2008 hr s m s u paper - sierra-cedar · detail. a middle layer such as obiee is critical in that it...
TRANSCRIPT
CEDARCRESTONE METRICS & ANALYTICS
2008 HR SYSTEMS MID-YEAR SURVEY UPDATE WHITE PAPER
May 2008

© Copyright 2008 CedarCrestone, Inc.
Information contained in this report was compiled and analyzed by CedarCrestone as part of our commitment to provide knowledge on workforce technologies, trends, and their impact on the performance of the enterprise. CedarCrestone encourages media, partners, analysts, and other readers to share the information found herein and to quote liberally from the report in their own work with appropriate credit to CedarCrestone. We request that all quotes and references are credited as “CedarCrestone 2008 Metrics and Analytics White Paper.”

© Copyright 2008 CedarCrestone, Inc.
Table of Contents
i
Table of Figures ............................................................................................................. iiExecutive Summary ....................................................................................................... 1State of Business Intelligence Technology Adoption .......................................... 3Mid-year Status Update ........................................................................................ 6 Focusing on Barriers ..................................................................................................6Metrics Used ......................................................................................................... 8Case Studies ...................................................................................................... 10 Luxottica Sees the Value of Analytics ...................................................................... 10 EMC Supports Growth Strategy with Metrics ........................................................... 12

© Copyright 2008 CedarCrestone, Inc.
Figure 1: Adoption of Business Intelligence Components .......................................... 5
Figure 2: HCM Business Solutions – Mid-year 2008 .................................................... 6
Figure 3: Most Used Metrics ......................................................................................... 8
Figure 4: Metrics by Organizational Strategy .............................................................. 9
Table of Figures
ii
© Copyright 2008 CedarCrestone, Inc.
Executive Summary
The most exciting area of human capital management is the move by organizations towards metrics-based management. By a variety of names—metrics-projects, business intelligence, workforce analytics, HR warehouse, and more—this whole area is one that organizations are spending time and money on. But the approaches and technologies to deliver metrics that highlight the contribution of the workforce on overall performance show no consistent approach.
This supplement to the CedarCrestone 2007–2008 HR Systems Survey White Paper provides a mid-year status update on the state of metrics and analytics. It covers the state of technology adoption. In our recent mid-year survey, most organizations are still “getting started” with operational reports and only 20% have more sophisticated approaches that include workforce planning and predictive analytics. The report also provides a focus on the barriers organizations are facing whether they are getting started or are further along and at least have a data warehouse. It concludes by highlighting two organizations as they move towards increased reporting, analytics, and overall business intelligence.
In terms of technology adoption, there are multiple components needed to institutionalize business intelligence. Most adopted to date is simple management reporting followed by an HR-oriented warehouse. The report details adoption numbers for:
• System of record (agreed upon by all parties)
• Data repository or data warehouse
• Reporting, including simple management reporting, operational reporting, ad hoc reporting, and multi-dimensional reporting
• Presentation/visualization approach
• Analytics
• Distribution and alert technologies
• Middleware that orchestrates getting data from multiple sources into a usable form
For those getting started, the most critical barrier is that data is in multiple systems making it difficult to provide an integrated view of talent and its performance impacts. For those with a data warehouse, access and user interface are the issues. First it is difficult to get to data in multiple feeder systems, given multiple reporting periods. Second, the user interface is unsatisfactory and the tools still too complex for use by non-technical and non-analytical staff.
The metric most used is headcount, along with other operational metrics such as turnover and workforce movement statistics. Four metrics are reported on average. Organizations in growth mode have different, more strategic metrics than those that have a strategy of profit or sustainability. These organizations are more focused on showing the impact of the workforce on the business.
Luxottica Group uses an ROI approach to analytics. By analyzing the financial returns (ROI) possible with various HR practices, the team at Luxottica can show how each addresses the two key pains in the retail industry: how to improve sales and how to reduce unwanted turnover. With a model built in Excel, the analytics team did an ROI analysis on sales from associates that went through a pre-hire analysis to show the tens of millions in revenue achieved from the practice vs. a control group that had not. The ROI analysis approach, because it is well understood, continues in use.
1
2
EMC has acquired and merged multiple organizations over the past few years and is also achieving organic growth. To support decisions on how to manage growth, EMC2 needs to know what the workforce looks like. It needs headcount, the pipeline of requisitions and offers, and attrition rates to forecast headcount needs and support cost-effective workforce deployment. It uses an Essbase data cube and will move to OBIEE—both from Oracle—along with dashboards from Infohrm. With its business intelligence efforts to date, it has achieved visibility, transparency, accuracy, and timeliness of data. It is managing workforce headcount cost effectively.
© Copyright 2008 CedarCrestone, Inc.
When HR community members talk about how they are using metrics and conducting analysis, it is like they are describing the various parts of an elephant. And, just like an elephant has many parts, there are many ways (and parts) to reporting and metrics; additionally there are many ways to implement and conduct workforce analytics.
However, we find that to fully institutionalize workforce analytics, that a set of technologies will be required. In this first section, we discuss the components.
1. An agreed upon system of record. The system of record is typically a human resource management system (HRMS). The primary value of the HRMS is that it captures raw transactional data at the source of a process such as a hire, promotion, or termination. Ideally the system of record is maintained at current release so as to embody the best practices at the process level. But because key metrics about the workforce may also reside in other repositories such as a talent management suite, there can be data integrity and lack of alignment issues when the solutions are from different vendors. Thus, it is ideal to have a talent management suite from the same vendor as the underlying HRMS to avoid integration issues.
2. Data repository or data warehouse: A business intelligence capability requires data not only from HR, but from other sources. Most important are data from talent management applications such as recruiting, performance management, learning management, and more. Other sources include payroll for salary and absence information, financial systems for financial performance, and customer-facing application data depending on the industry that will provide information such as customer satisfaction. Some organizations also pull in data from benchmarking firms to analyze turnover, performance, or salaries against industry norms. One third of survey respondents are using an HRMS warehouse (32%) and most frequently it is from PeopleSoft. Another 23% have an enterprise warehouse that includes workforce data.
State of Business Intelligence Technology Adoption
While components are a good place to start, to truly institutionalize business intelligence, organizations will also need some kind of middleware that orchestrates getting data into some form of presentation, whether a report, a dashboard, or an alert. A good example of such middleware is Oracle’s OBIEE (Oracle Business Intelligence Enterprise Edition). OBIEE provides a business model and data handling that maps between sources of data and a presentation layer used by executives, managers, specialists, and employees. The sources of data might be the HRMS and other applications such as talent management solutions, any data warehouse or data marts, or even every day tools such as Excel. The presentation layer may include reports, dashboards, and alerts. OBIEE also provides for ad-hoc analysis whereby a manager can drill down into data on a dashboard and see the underlying detail. A middle layer such as OBIEE is critical in that it provides a simplified business model that contains the complex data dimensions and metric calculations needed for any presentation approach and hides the complexity from business users. Its value is that it is one tool, one user interface, and one meta data source.
3© Copyright 2008 CedarCrestone, Inc.

© Copyright 2008 CedarCrestone, Inc.4
3. Reporting tools: Today, simple management reports that consist of one or two metrics such as headcount or turnover are most often run from the HRMS (60%) . But there are also operational reports run from the HRMS or perhaps from a copy of the HRMS (33%), or from the data warehouse. Least used, today, is multidimensional reporting with less than 19% of respondents reporting they provide the capability to drill down into the data to see what is behind a specific metric.
4. Presentation/visualization approach: Management can view metrics on reports on the Intranet or corporate portal, but business intelligence is most beneficial when presented in an actionable format such as a dashboard or scorecard. These are most useful when presented in a visual graphic that lets the manager easily and intuitively view key metrics and then drill down to examine underlying numbers to see what action should be taken. A scorecard or dashboard is still the domain of early adopters with 17% having one today and another 32% planning for this within the next three years. We do see some move from formal scorecards towards dashboards. One other visual model is the organization chart where metrics are presented by the organizational hierarchy. Nakisa is a recognized solution here.
5. The options for the actual analytical tools are vast, from Excel, likely used by all organizations, to predictive analytics. Eleven percent of respondents have a true workforce analytics capability today, with over 30% more planning for this within the next three years. There are also statistical packages from various vendors that have been adapted to workforce analytics. Further, there is analytics functionality in just about every talent management application or suite. Next are standalone workforce analytics applications. We see options from the ERP vendors as well as niche vendors such as DoubleStar or Infohrm that specialize in the HCM space. These latter two organizations have different approaches, but both provide a “software-as-a-service” (SaaS) delivery option. We see this as a good way to get started and will show in the EMC case story later the value of the Infohrm solution.
Another tool is predictive analytics, which is a modeling approach for “what if” analysis. What if we could improve the percent of high performers? What would the impact be on potential revenue? Only 5% of survey respondents
Integrated Security, User Management, Personalization
Multidimensional Calculation and Integration Engine
Intelligent Request Generation and Optimized Data Access Services
Data WarehouseData Mart
SAP, OraclePeopleSoft, Siebel,
Custom AppsFiles Excel
XMLBusinessProcess
BusinessProcessEssbase
Common Enterprise Information Model
Data Integration
Ad-hoc Analysis
Interactive Dashboards
EssbaseAnalytics
Reporting &Publishing
ProactiveDetectionand Alerts
Disconnected& MobileAnalytics
MS Office& OutlookIntegration
OLTP & ODSSystems
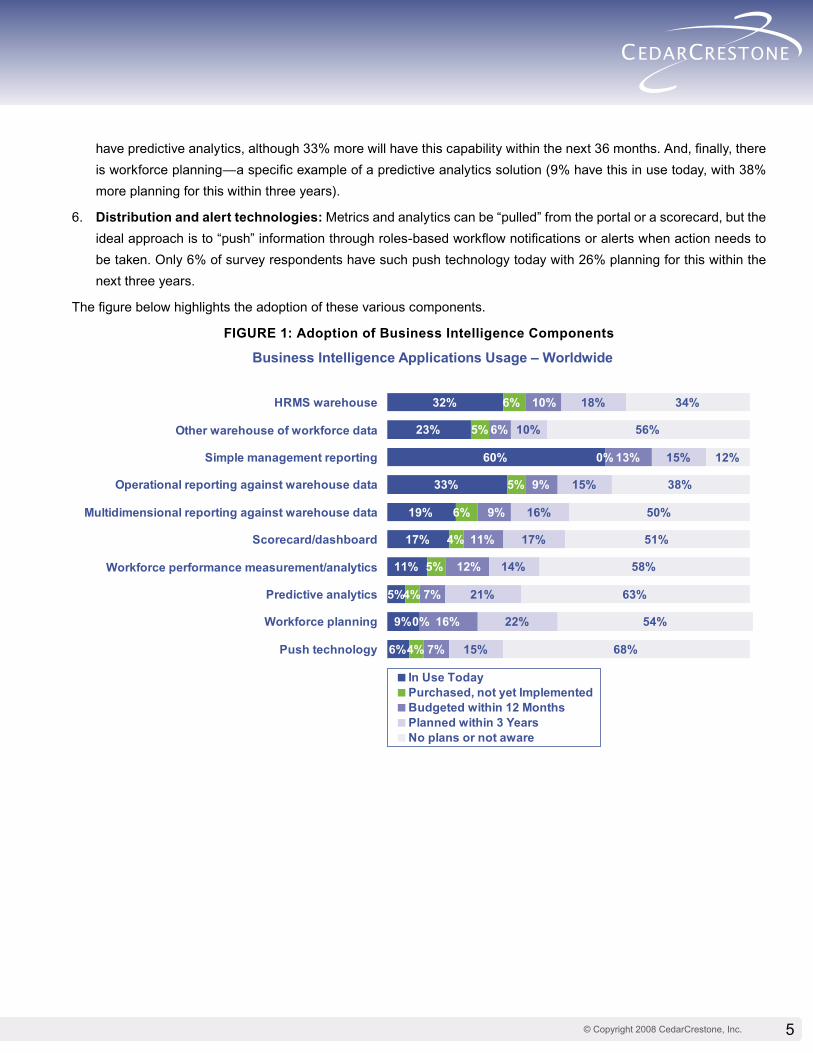
have predictive analytics, although 33% more will have this capability within the next 36 months. And, finally, there is workforce planning—a specific example of a predictive analytics solution (9% have this in use today, with 38% more planning for this within three years).
6. Distribution and alert technologies: Metrics and analytics can be “pulled” from the portal or a scorecard, but the ideal approach is to “push” information through roles-based workflow notifications or alerts when action needs to be taken. Only 6% of survey respondents have such push technology today with 26% planning for this within the next three years.
The figure below highlights the adoption of these various components.
FIGURE 1: Adoption of Business Intelligence Components
Business Intelligence Applications Usage – Worldwide
32%
23%
60%
33%
19%
17%
11%
5%
9%
6%
5%
0%
5%
4%
4%
4%
6%
13%
9%
11%
7%
16%
7%
18%
10%
15%
15%
16%
17%
14%
21%
22%
15%
34%
56%
12%
38%
50%
51%
58%
63%
54%
68%
5%
6%
6%
0%
12%
10%
9%
HRMS warehouse
Other warehouse of workforce data
Simple management reporting
Operational reporting against warehouse data
Multidimensional reporting against warehouse data
Scorecard/dashboard
Workforce performance measurement/analytics
Predictive analytics
Workforce planning
Push technology
In Use TodayPurchased, not yet ImplementedBudgeted within 12 MonthsPlanned within 3 YearsNo plans or not aware
5© Copyright 2008 CedarCrestone, Inc.

© Copyright 2008 CedarCrestone, Inc.6
In March and April, 2008, we did a follow up survey of respondents reporting at least two of the above components. Respondents were asked to select the best answer describing their HCM business intelligence solution. We see the highest adoption of operational reports, and a strong level of adoption of workforce planning/predictive analytics.
FIGURE 2: HCM Business Solutions – Mid-year 2008
Focusing on Barriers
In the mid-year survey, we also wanted to review barriers. The primary barrier, regardless of where organizations are is lack of funds to launch a project or to expand upon a BI platform. Then the barriers vary by whether the organization is in a getting started mode or has some form of warehouse.
Getting started. The consistent lament is these organizations are not able to convince management that workforce metrics are of value. The most critical barrier is that data is in multiple systems, making it difficult to provide any integrated view of talent and performance. Data from a recruiting solution or a performance management solution are cited as “silo data.” Respondents also report they do not have skilled technical resources to implement the warehouse and business intelligence tools. Finally, security is an issue for those getting started. Many organizations, however, have addressed security issues, and so, we believe data security is a perceived issue rather than one that is insurmountable.
Some form of warehouse: Even once organizations have begun to deploy a warehouse, getting access to data continues as an issue, particularly among respondents from global organizations. They can not easily get access to data in systems or data repositories outside the US. For them, it has been hard to achieve data standardization to support global business intelligence. Integration of sources from talent management solutions has also not yet been handled by all. Further, there are timing issues of data access. This is particularly an issue when an organization wants talent management information from best of breed solutions (typically from multiple vendors) vs. integrated solutions
21%
21%
21%
37%
Getting started with operational reports only (not from warehouse)HR data warehouse only, data quality issuesSingle warehouse (integrating HR, Finance, Operations)Supporting managers with workforce planning/predictive analytics
HCM BI Solution
Mid-year Status Update
© Copyright 2008 CedarCrestone, Inc.
(all from the same vendor as the core HRMS). So, an organization may handle getting sales data for a given period, but can not get recruiting data or performance evaluation data for the same time period. New talent management initiatives underway, however, are expected to create real time data for real time analytics. Finally, even among those with relatively sophisticated solutions, the user interface is unsatisfactory and the tools are still too complex for use by non-IT and non-analytical staff. Access to “easy to use reporting tools with drill down capabilities that we can put into managers’ hands” was a consistent criticism of respondents with the most advanced solutions.
7
© Copyright 2008 CedarCrestone, Inc.8
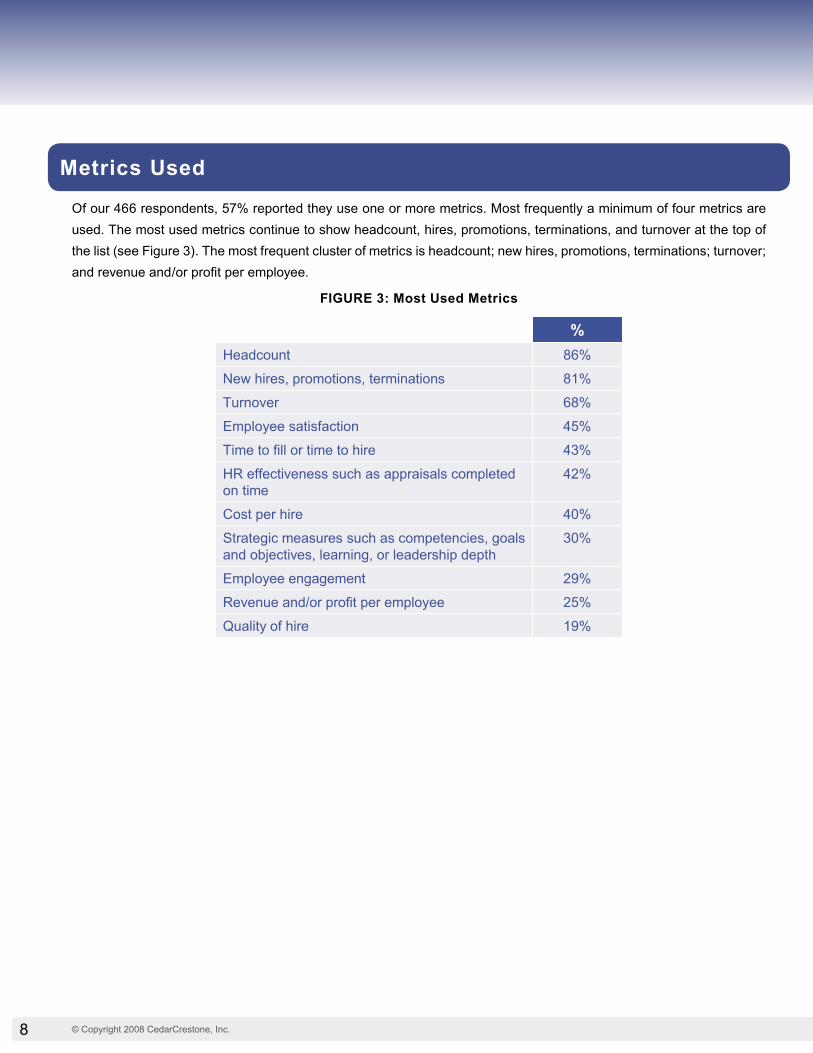
Of our 466 respondents, 57% reported they use one or more metrics. Most frequently a minimum of four metrics are used. The most used metrics continue to show headcount, hires, promotions, terminations, and turnover at the top of the list (see Figure 3). The most frequent cluster of metrics is headcount; new hires, promotions, terminations; turnover; and revenue and/or profit per employee.
FIGURE 3: Most Used Metrics
Metrics Used
19%Quality of hire
25%Revenue and/or profit per employee
29%Employee engagement
30%Strategic measures such as competencies, goals and objectives, learning, or leadership depth
40%Cost per hire
42%HR effectiveness such as appraisals completed on time
43%Time to fill or time to hire
45%Employee satisfaction
68%Turnover
81%New hires, promotions, terminations
86%Headcount
%
© Copyright 2008 CedarCrestone, Inc.
Two observations about respondents’ metrics selections:
1. When organizations move to institutionalize their metrics and analytics with higher amounts of business intelligence technology, they move from the standard traditional metrics of headcount—new hires, promotions, terminations—and turnover to ones that are more strategically focused such as those at the bottom of the list on the previous page.
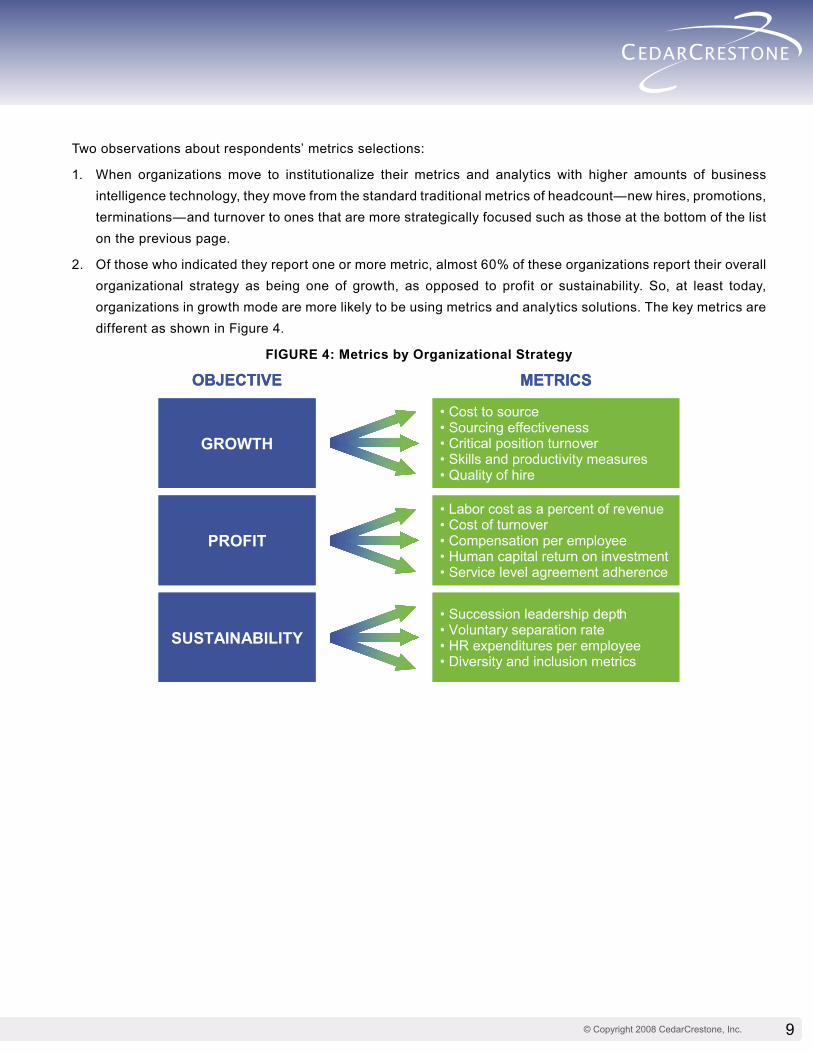
2. Of those who indicated they report one or more metric, almost 60% of these organizations report their overall organizational strategy as being one of growth, as opposed to profit or sustainability. So, at least today, organizations in growth mode are more likely to be using metrics and analytics solutions. The key metrics are different as shown in Figure 4.
FIGURE 4: Metrics by Organizational Strategy
GROWTH
• Cost to source• Sourcing effectiveness• Critical position turnover• Skills and productivity measures• Quality of hire
PROFIT
• Labor cost as a percent of revenue• Cost of turnover• Compensation per employee• Human capital return on investment• Service level agreement adherence
SUSTAINABILITY• Succession leadership depth• Voluntary separation rate• HR expenditures per employee• Diversity and inclusion metrics
OBJECTIVE METRICS
9

© Copyright 2008 CedarCrestone, Inc.10
Luxottica Sees the Value of Analytics
Luxottica Group is the world’s leading designer, manufacturer and distributor of prescription frames and sunglasses in the premium and luxury market. The group manages leading retail brands including LensCrafters, Pearle, Sears Optical and Sunglass Hut. At Luxottica, analytics is less about the technology and all about results. Based on lessons they learned along the way as they got started with analytics, if you think you should set up a scorecard, it may not be necessary. The Luxottica team will say that in retail you simply must show the business community that HCM practices and associated metrics and analytics can address two pains: how to improve sales and how to reduce unwanted turnover.
BackgroundAn early attempt at establishing an analytics approach was a report that analyzed turnover by brands and in Luxottica’s optical manufacturing plants. The first report simply showed turnover by key job groups. Managers within the business units opened the report, looked at it, and had few questions. The information just wasn’t all that useful. So, Robin Wilson a lawyer with financial analysis experience gained while working at GE, moved into the role of senior director of HR technology and analytics. She began to look for ways to provide more effective analytical services that would address the two pains.
Her first effort was to develop a balanced scorecard. She got HR, compensation, training, benefits, and staffing in a room to elicit the metrics that might be valuable. They included turnover and high performer/low performer statistics, among others. They set targets displaying green, yellow and red lights. But because scorecards and analytical concepts are not intuitive to this audience, the effort to define a scorecard was not successful. She reports, “It was too much theory and being too complicated, failed.”
Robin then decided to look at a concept that everyone understands: ROI. At the time, Luxottica was looking at cutting the cost of a pre-hire assessment instrument used to screen sales competencies among candidates. Partnering with the instrument vendor and one of the Luxottica brands, they first collected sales data. They did an ROI analysis on sales from associates that went through the pre-hire analysis vs. a comparable group that did not. They were able to show that additional tens of millions in revenue was brought in by the group that came on board using the assessment instrument vs. the control group. The brand managers were ecstatic. The tool was kept. The ROI analysis approach, because it is well understood, continues in use.
Moving ForwardThe brands began vying for analytics attention. Two other groups were served by looking at associate performance. With a predictive model, Robin and her Excel guru have correlated a performance factor against variables of pay, promotion speed, turnover, time in position, and more. Based on sales productivity, associates get a ranking from a low of 1 to a high of 5. The model helps tell stories such as if they hire more 3s and move those with lower rankings into other roles, sales will improve. With the results, Luxottica can make more informed actions on hiring, workforce movement, and even development.
Case Studies
© Copyright 2008 CedarCrestone, Inc.
With several successes under her belt, Robin’s group is now expanded to four more people. They have established an Operations Forum where the HR operational leaders for each brand discuss analysis ideas. The go-forward technology plan is to further formalize and improve performance reviews with a performance management solution and will also implement a learning management application. The group is taking on two to three analysis project studies at a time. They will look at the interplay of how sales performance (with performance results from financials and appraisal information in the performance management solution) is impacted over time by sourcing (with information from the recruiting solution) and development approaches (with information from the learning management solution). The appetite for simplicity and speed through automation also includes looking at providing access to reports and analysis from the corporate portal. They are also looking at pushing these out to managers when action needs to be taken. They are beginning to consider whether it makes sense to build a data warehouse or have a third-party provider support their cravings for analytics.
Lessons LearnedIt is clear that someone like Robin, with vision and the ability to predict or hypothesize factors that might impact sales, along with the passion and tenacity to keep going despite some failures, is critical to the success of such new initiatives. But, an analytics effort also “needs people to make the numbers appear,” suggests Robin. “It needs a team that understands where to get the data, how to get it out, and how to analyze it.” Robin and her group have succeeded by partnering with the Luxottica business intelligence team in IT. They have had to learn their language, not always easy for HR practitioners. But what HR practitioners do understand is the concept of ROI. By finding the financial returns possible with various HR practices from the planned technology deployments, the group is learning the fine art of analytics. And, while always focusing on increased sales and reducing turnover they are succeeding with their analytics initiative.
11
© Copyright 2008 CedarCrestone, Inc.12
EMC Supports Growth Strategy with Metrics
EMC provides information storage, content management and archiving, RSA information security, and VMware virtual infrastructure tools that help organizations capitalize on their most important asset—information. By bringing systems, software, services, and solutions together, EMC helps customers design, build, and manage intelligent, flexible, and secure information infrastructures. EMC employs more than 37,000 people worldwide. About 40% work outside the U.S. in nearly 70 countries around the world. EMC growth over the past few years through acquisitions as well as through organic growth, is supported by headcount reports that enable management to assure EMC is acquiring the talent it needs, where needed, without the cost of duplicate operations.
BackgroundJeff Drummond, HRMS Consultant in the HRMS and Analytics group has oversight for the delivery of workforce HR metrics at the corporate level. His responsibilities include creating and designing analytics reports, automating report production, and consulting with HR Operations and other corporate HR Functions on the development of new metrics and sourcing the data from EMC’s systems.
Over the past few years, he has watched EMC acquire Legato, Documentum, VMware, and RSA, among others. Whenever EMC acquires a company, they strive to retain and leverage the best of each while seeking to combine and streamline duplicate operations. With its success in helping customers all over the world to build out their information infrastructure, EMC has also experienced organic growth. EMC must constantly evaluate where it needs to develop new centers of excellence, such as in China, India, and Russia, which are areas of strong growth. At the same time, EMC must assess where it may need to slow growth or simply maintain current headcount levels.
To support such decisions, EMC management needs to know what the workforce looks like. It needs headcount by location, the pipeline of requisitions and offers, and attrition rates—all to forecast headcount and support the most cost-effective workforce deployment. To do this, early on, the HR group found that it had to speak about headcount the same way that Finance does, by cost centers. But, it also needs to report on headcount by supervisor in support of HR actions such as bonus allocations or equity planning.
A foundation technology to support providing headcount metrics for either approach is a data cube from Essbase (Hyperion/Oracle). This was in use by Finance, and HR has adapted this for its needs. This cube combines incumbent information from its core HR record keeping system, PeopleSoft, and an applicant tracking solution from Kenexa.
While the cube can be used to collect and store data, it does not do all the reporting EMC needs about workforce makeup. Thus, EMC also works with Infohrm to look at gender, ethnicity, service years, age, and other employee attributes not available in the data cube. The resulting reports let EMC see if it is doing well with diversity, retirement issues, seniority, job level distributions, and more. For these reports, EMC sends files to Infohrm from PeopleSoft and other systems on a monthly basis. For readers not familiar with Infohrm, it is a services and consulting firm that offers software-as-a-service (Saas) to support reporting, human capital analysis, and workforce planning.
© Copyright 2008 CedarCrestone, Inc.
Reports from Infohrm are reviewed by HR, then shared with EMC’s management team as needed, with a focus on sharing only information that is needed to impact business decisions. The Infohrm reporting capability, Query Workspace, is also deployed to provide in-depth analysis and provide users a way to combine multiple metrics and organization structures. For example, they can show what the workforce looks like today compared to the past so management can see how they are doing with attrition rates and take corrective actions. They’ve also used the site to model projected retirements. These projections were used to investigate the potential impacts of employee loss on retirement planning, EMC culture, and on the EMC “DNA”. Combined with a mobility model from Infohrm, they also point out the need for potential restructuring of job duties and the limitation of job advancement as more employees gain experience. This latter dynamic is recognized for its potential impact on lowering employee engagement, which can result in lowered productivity.
The projections also show the positive side of workforce changes in terms of the acquisition of “new blood” of intellectual capital from the acquired organizations, and the infusion of new ideas, new ways to work, and new values. A result is the recognition that EMC may need to design mentoring programs across the company at all levels and design work arrangements and/or benefits to retain intellectual capital through part-time and job sharing positions, consultant positions, “extended” benefits packages, and retirement planning programs. By seeing the make-up of the workforce by age and tenure, HR can bridge possible gaps of the various lifestyle cohorts currently working at EMC and projected to be working at EMC.
Results AchievedFrom EMC’s business intelligence efforts to date, it has achieved visibility, transparency, accuracy, and timeliness of data and overall does a better job of workforce headcount management. For example, EMC executives can now see a total view of their workforce lifecycle. While this may sound simplistic, EMC used to look at workforce evolution piecemeal, without being able to see incumbents, terminations, and requisitions holistically. While some business units did a good job of workforce headcount management, the combined report set shows executive vice presidents their view plus provides a comparison to peers. This visibility and transparency encourages each unit to get its house in order. For example, by seeing requisitions, it became clear that not all were effectively placed relative to strategic plans, and units were able to clean up the requisitions. Jeff views this as the bare basics of headcount management, but it was absolutely necessary given the massiveness of its acquisitions and the impact on headcount. According to Jeff, “we get more visibility to our real needs and budgetary impacts.” “We have a goal when we acquire a company that on day one, we can report on the company’s hires and terminations. We have immediacy of data.”
EMC has also created a great foundation for the future with the institutionalization of Essbase, used by both Finance and HR for headcount management in terms of budgetary impact. Where they are today, however, was not possible without Infohrm. Working with Infohrm, EMC has a central repository of workforce data with agreed upon calculations, descriptions, and definitions of components such as termination rates, promotion rates, hire rates, and net hire ratio. This last one is the hires against terminations and shows unit management whether they are hiring one for one, two for one, etc. “Working with Infohrm has whet our appetite for how we can merge analytics into our business,” Jeff reports. “Through our involvement with Infohrm, EMC HR further developed a common metrics language, a common repository of information, and advanced the impact of HR on our business. Using their tools, we are able to quickly analyze large amounts of information without wasting valuable time on structuring and mining data.”
13

© Copyright 2008 CedarCrestone, Inc.
Moving ForwardJeff recognizes that EMC’s challenge is to conduct even deeper workforce analysis. For example, EMC’s succession planning is a recurring process with key executives and key high performers. However, the current succession planning process needs to encompass a broader and deeper level of EMC employees.
The Essbase cube gives HR common reporting with Finance. EMC has plans to implement Oracle’s OBIEE and OBIA (described earlier in this report) in customer service and HR will follow on. With OBIEE, EMC will have the opportunity to develop both a financial scorecard and a supervisor scorecard and enable management to view these in tandem. EMC can also match customer data so as to show the impact of top performers. “We will be able to do business analytics and not just HR analytics.”
14

© Copyright 2008 CedarCrestone, Inc.

ABOUT CEDARCRESTONE
CedarCrestone provides consulting, hosting, and managed services for the deployment, management, and optimization of Human Capital Management (HCM), Financial Management (FMS), and Campus Solutions (CS) along with complementary Strategy & Analytics services. As a Certified Advantage Partner of Oracle Corporation, CedarCrestone has extensive expertise in Oracle technology and PeopleSoft Enterprise applications.
Visit www.CedarCrestone.com