2008 financial statements - home | nestlé global financial statements of the nestlé group 3...
TRANSCRIPT

2008 FinancialStatements
Consolidated FinancialStatements of the Nestlé GroupFinancial Statementsof Nestlé S.A.

© 2009, Nestlé S.A., Cham and Vevey (Switzerland)
ConceptNestlé S.A., Group Accounting & Reporting
DesignNestec Ltd., SGDU, Corporate Identity & Design
PrintingNeidhart + Schön Group AG (Switzerland)
PaperThis report is printed on LuxoArt, a paper produced from well-managed forests and other controlled sources certifi ed by the Forest Stewardship Council (FSC)
Mixed SourcesProduct group from well-managedforests and other controlled sourceswww.fsc.org Cert no. SQS-COC-100141© 1996 Forest Stewardship Council

1Consolidated Financial Statements of the Nestlé Group
Consolidated Financial Statements of the Nestlé Group
142nd Financial Statements of Nestlé S.A.
Income statement for the year ended 31 December 2008 104
Balance sheet as at 31 December 2008 105Notes to the annual accounts 106 1. Accounting policies 106 2. Income from Group companies 108 3. Financial income 108 4. Profi t on disposal of fi xed assets 108 5. Investment write downs 108 6. Administration and other expenses 108 7. Financial expense 109 8. Taxes 109 9. Liquid assets 109 10. Receivables 109 11. Financial assets 110 12. Participations in Group companies 110
13. Loans to Group companies 110 14. Own shares 111 15. Intangible assets 111 16. Tangible fi xed assets 111 17. Short term payables 112 18. Long term payables 112 19. Provisions 112 20. Share capital 113 21. Changes in equity 113 22. Reserve for own shares 114 23. Contingencies 11424. Risk assessment 11425. Additional information 115Proposed appropriation of profi t 120Report of the statutory auditors 121
Principal exchange rates 2Consolidated income statement for the year
ended 31 December 2008 3 Consolidated balance sheet
as at 31 December 2008 4 Consolidated cash fl ow statement for the year
ended 31 December 2008 6 Consolidated statement of recognised income
and expense and changes in equity for the year ended 31 December 2008 7
Notes 9 1. Accounting policies 9 2. Modifi cation of the scope of consolidation 21 3. Segmental information 22 4. Net other income/(expenses) 26 5. Net fi nancing cost 26 6. Expenses by nature 27 7. Taxes 27 8. Associates 29 9. Earnings per share 30 10. Trade and other receivables 31 11. Derivative assets and liabilities 32 12. Inventories 33 13. Property, plant and equipment 33
14. Goodwill 35 15. Intangible assets 38 16. Employee benefi ts 40 17. Share-based payment 46 18. Provisions and contingencies 51 19. Financial assets and liabilities 52 20. Financial risks 56 21. Equity 65 22. Cash fl ow statement 68 23. Acquisition of businesses 70 24. Disposal of businesses 71 25. Lease commitments 72 26. Transactions with related parties 7327. Joint ventures 74 28. Guarantees 75 29. Group risk management 75 30. Events after the balance sheet date 76 31. Group companies 76 32. Restatement of 2007 comparatives following fi rst application of IFRIC 14 76 Report of the statutory auditor
on the Consolidated Financial Statements 77 Financial information – fi ve year review 78 Companies of the Nestlé Group 80
2 Consolidated Financial Statements of the Nestlé Group
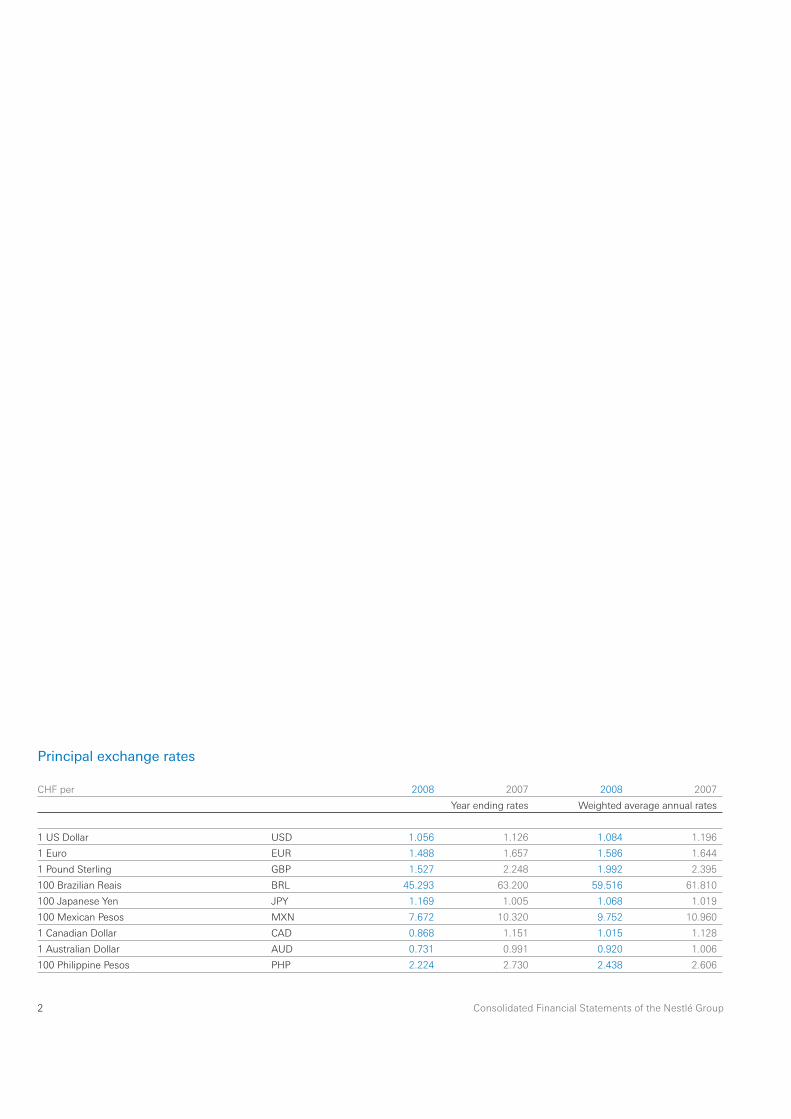
Principal exchange rates
CHF per 2008 2007 2008 2007
Year ending rates Weighted average annual rates
1 US Dollar USD 1.056 1.126 1.084 1.196
1 Euro EUR 1.488 1.657 1.586 1.644
1 Pound Sterling GBP 1.527 2.248 1.992 2.395
100 Brazilian Reais BRL 45.293 63.200 59.516 61.810
100 Japanese Yen JPY 1.169 1.005 1.068 1.019
100 Mexican Pesos MXN 7.672 10.320 9.752 10.960
1 Canadian Dollar CAD 0.868 1.151 1.015 1.128
1 Australian Dollar AUD 0.731 0.991 0.920 1.006
100 Philippine Pesos PHP 2.224 2.730 2.438 2.606

3Consolidated Financial Statements of the Nestlé Group
Consolidated income statementfor the year ended 31 December 2008
In millions of CHF Notes 2008 2007
Sales 3 109 908 107 552
Cost of goods sold (47 339) (45 037)
Distribution expenses (9 084) (9 104)
Marketing and administration expenses (35 832) (36 512)
Research and development costs (1 977) (1 875)
EBIT Earnings Before Interest, Taxes, restructuring and impairments 3 15 676 15 024
Net other income/(expenses) 4
Other income 9 426 695
Other expenses (2 124) (1 285)
7 302 (590)
Profi t before interest and taxes 22 978 14 434
Net fi nancing cost 5
Financial income 102 576
Financial expense (1 247) (1 492)
(1 145) (916)
Profi t before taxes and associates 21 833 13 518
Taxes 7 (3 787) (3 416)
Share of results of associates 8 1 005 1 280
Profi t for the period 19 051 11 382
of which attributable to minority interests 1 012 733
of which attributable to shareholders of the parent (Net profi t) 18 039 10 649
As percentages of sales
EBIT Earnings Before Interest, Taxes, restructuring and impairments 14.3% 14.0%
Profi t for the period attributable to shareholders of the parent (Net profi t) 16.4% 9.9%
Earnings per share (in CHF)
Basic earnings per share (a) 9 4.87 2.78
Fully diluted earnings per share (a) 9 4.84 2.76
(a) 2007 comparatives have been restated following 1-for-10 share split effective on 30 June 2008.

4 Consolidated Financial Statements of the Nestlé Group
Consolidated balance sheet as at 31 December 2008before appropriations
In millions of CHF Notes 2008 2007
Assets
Current assets
Cash and cash equivalents 19 5 835 6 594
Short-term investments 19 1 296 2 902
Trade and other receivables 10/19 13 442 14 890
Current income tax receivables 889 531
Assets held for sale 8 22
Inventories 12 9 342 9 272
Derivative assets 11/19 1 609 754
Prepayments and accrued income 627 805
Total current assets 33 048 35 770
Non-current assets
Property, plant and equipment 13 21 097 22 065
Investments in associates 8 7 796 8 936
Deferred tax assets 7 2 842 2 224
Financial assets 19 3 868 4 213
Employee benefi ts assets (a) 16 60 1 513
Goodwill 14 30 637 33 423
Intangible assets 15 6 867 7 217
Total non-current assets 73 167 79 591
Total assets 106 215 115 361
(a) 2007 comparatives have been restated following fi rst application of IFRIC 14 (refer to Note 32).
5Consolidated Financial Statements of the Nestlé Group
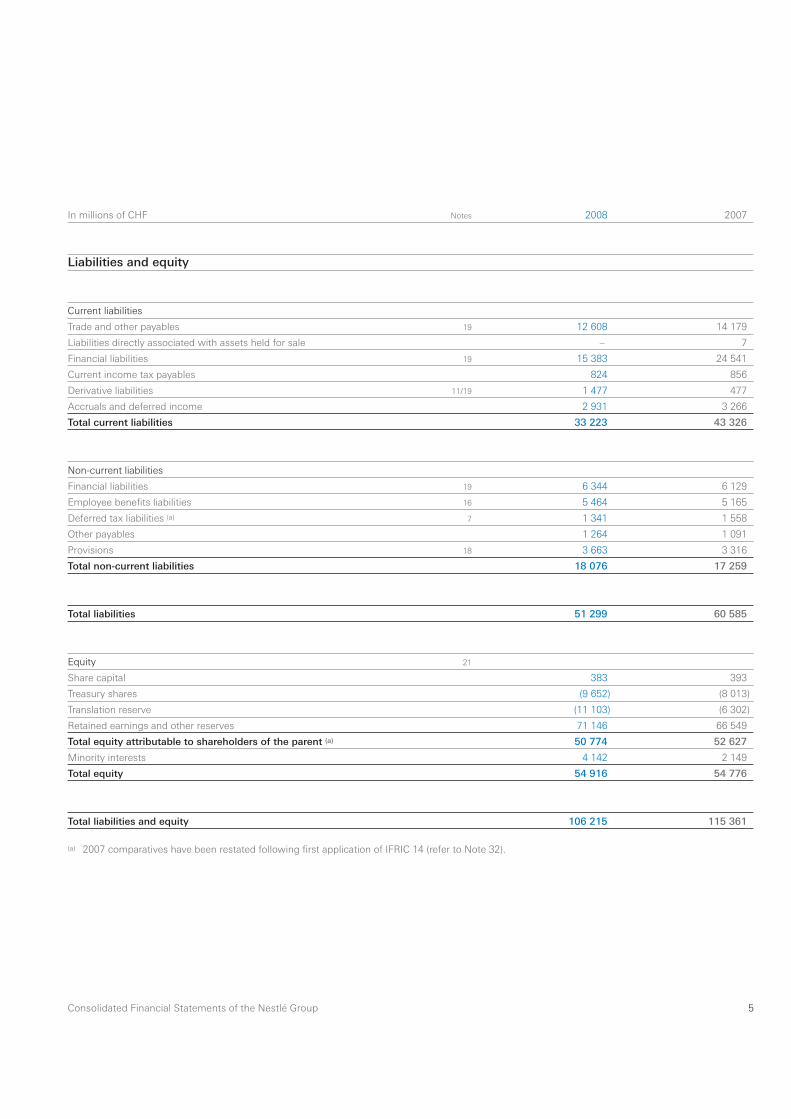
In millions of CHF Notes 2008 2007
Liabilities and equity
Current liabilities
Trade and other payables 19 12 608 14 179
Liabilities directly associated with assets held for sale – 7
Financial liabilities 19 15 383 24 541
Current income tax payables 824 856
Derivative liabilities 11/19 1 477 477
Accruals and deferred income 2 931 3 266
Total current liabilities 33 223 43 326
Non-current liabilities
Financial liabilities 19 6 344 6 129
Employee benefi ts liabilities 16 5 464 5 165
Deferred tax liabilities (a) 7 1 341 1 558
Other payables 1 264 1 091
Provisions 18 3 663 3 316
Total non-current liabilities 18 076 17 259
Total liabilities 51 299 60 585
Equity 21
Share capital 383 393
Treasury shares (9 652) (8 013)
Translation reserve (11 103) (6 302)
Retained earnings and other reserves 71 146 66 549
Total equity attributable to shareholders of the parent (a) 50 774 52 627
Minority interests 4 142 2 149
Total equity 54 916 54 776
Total liabilities and equity 106 215 115 361
(a) 2007 comparatives have been restated following fi rst application of IFRIC 14 (refer to Note 32).

6 Consolidated Financial Statements of the Nestlé Group
Consolidated cash fl ow statementfor the year ended 31 December 2008
In millions of CHF Notes 2008 2007
Operating activities (a)
Profi t for the period 19 051 11 382
Non-cash items of income and expense 22 (6 157) 2 097
Decrease/(increase) in working capital 22 (1 787) 82
Variation of other operating assets and liabilities 22 (344) (122)
Operating cash fl ow 10 763 13 439
Investing activities
Capital expenditure 13 (4 869) (4 971)
Expenditure on intangible assets 15 (585) (619)
Sale of property, plant and equipment 13 122 323
Acquisition of businesses 23 (937) (11 232)
Disposal of businesses 24 10 999 456
Cash fl ows with associates 266 264
Other investing cash fl ows (297) 26
Cash fl ow from investing activities 4 699 (15 753)
Financing activities
Dividend paid to shareholders of the parent 21 (4 573) (4 004)
Purchase of treasury shares 22 (8 696) (5 455)
Sale of treasury shares and options exercised 639 980
Cash fl ows with minority interests (367) (205)
Bonds issued 19 2 803 2 023
Bonds repaid 19 (2 244) (2 780)
Increase in other non-current fi nancial liabilities 374 348
Decrease in other non-current fi nancial liabilities (168) (99)
Increase/(decrease) in current fi nancial liabilities (6 100) 9 851
Decrease/(increase) in short-term investments 1 448 3 238
Cash fl ow from fi nancing activities (16 884) 3 897
Currency retranslations 663 (267)
Increase/(decrease) in cash and cash equivalents (759) 1 316
Cash and cash equivalents at beginning of period 6 594 5 278
Cash and cash equivalents at end of period 22 5 835 6 594
(a) Presentation was amended (refer to section Changes in presentation on page 20).
7Consolidated Financial Statements of the Nestlé Group
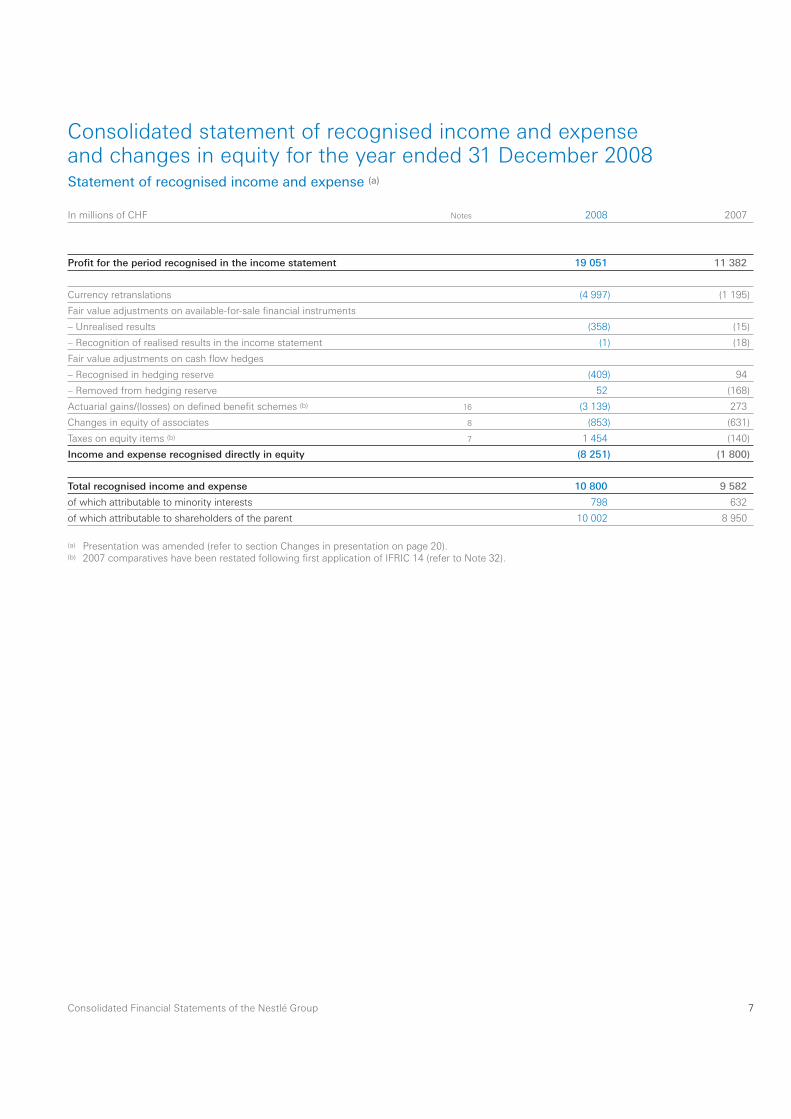
Consolidated statement of recognised income and expenseand changes in equity for the year ended 31 December 2008Statement of recognised income and expense (a)
In millions of CHF Notes 2008 2007
Profi t for the period recognised in the income statement 19 051 11 382
Currency retranslations (4 997) (1 195)
Fair value adjustments on available-for-sale fi nancial instruments
– Unrealised results (358) (15)
– Recognition of realised results in the income statement (1) (18)
Fair value adjustments on cash fl ow hedges
– Recognised in hedging reserve (409) 94
– Removed from hedging reserve 52 (168)
Actuarial gains/(losses) on defi ned benefi t schemes (b) 16 (3 139) 273
Changes in equity of associates 8 (853) (631)
Taxes on equity items (b) 7 1 454 (140)
Income and expense recognised directly in equity (8 251) (1 800)
Total recognised income and expense 10 800 9 582
of which attributable to minority interests 798 632
of which attributable to shareholders of the parent 10 002 8 950
(a) Presentation was amended (refer to section Changes in presentation on page 20).(b) 2007 comparatives have been restated following fi rst application of IFRIC 14 (refer to Note 32).

8 Consolidated Financial Statements of the Nestlé Group
Total recognised income and expense (4 801) 14 803 10 002 798 10 800
Dividend paid to shareholders of the parent (4 573) (4 573) (4 573)
Dividends paid to minority interests – (408) (408)
Movement of treasury shares (net) (b) (7 141) (381) (7 522) (7 522)
Changes in minority interests – 1 574 1 574
Equity compensation plans 223 17 240 29 269
Reduction in share capital (10) 5 279 (5 269) – –
Equity as at 31 December 2008 383 (9 652) (11 103) 71 146 50 774 4 142 54 916
(a) Refer to Note 32(b) Includes Nestlé S.A. shares exchanged for warrants (refer to Note 19).
20
08
20
07
Changes in equity
In millions of CHF
Sha
re
capi
tal
Trea
sury
shar
es
Tran
slat
ion
rese
rve
Ret
aine
dea
rnin
gs
and
othe
r re
serv
es
Tota
l equ
ity a
ttrib
utab
le
to s
hare
hold
ers
of t
he
pare
nt
Min
ority
in
tere
sts
Tota
l eq
uity
Equity as at 31 December 2006 as reported last year 401 (4 644) (5 205) 60 439 50 991 1 857 52 848
First application of IFRIC 14 (a) 793 793 793
Equity restated as at 1 January 2007 401 (4 644) (5 205) 61 232 51 784 1 857 53 641
Total recognised income and expense (1 097) 10 047 8 950 632 9 582
Dividend paid to shareholders of the parent (4 004) (4 004) (4 004)
Dividends paid to minority interests – (359) (359)
Movement of treasury shares (net) (4 522) 232 (4 290) (4 290)
Changes in minority interests – 1 1
Equity compensation plans 14 173 187 18 205
Reduction in share capital (8) 1 139 (1 131) – –
Equity restated as at 31 December 2007 393 (8 013) (6 302) 66 549 52 627 2 149 54 776

9Consolidated Financial Statements of the Nestlé Group
Notes
Consolidated companiesCompanies, in which the Group has the power to exercise control, are fully consolidated. This applies irrespective of the percentage of interest in the share capital. Control refers to the power to govern the fi nancial and operating policies of a company so as to obtain the benefi ts from its activities. Minority interests are shown as a component of equity in the balance sheet and the share of the profi t attributable to minority interests is shown as a component of profi t for the period in the income statement.
Proportionate consolidation is applied for companies over which the Group exercises joint control with partners. The individual assets, liabilities, income and expenses are consolidated in proportion to the Nestlé participation in their equity (usually 50%).
Newly acquired companies are consolidated from the effective date of control, using the purchase method.
AssociatesCompanies where the Group has the power to exercise a signifi cant infl uence but does not exercise control are accounted for using the equity method. The net assets and results are adjusted to comply with the Group’s accounting policies. The carrying amount of goodwill arising from the acquisition of associates is included in the carrying amount of investments in associates.
Venture fundsInvestments in venture funds are recognised in accord-ance with the consolidation methods described above, depending on the level of control or signifi cant infl uence exercised.
1. Accounting policies
Accounting convention and accounting standardsThe Consolidated Financial Statements comply with International Financial Reporting Standards (IFRS) issued by the International Accounting Standards Board (IASB) and with the Interpretations issued by the International Financial Reporting Interpretations Committee (IFRIC).
The consolidated accounts have been prepared on an accrual basis and under the historical cost convention, unless stated otherwise. All signifi cant consolidated com-panies and associates have a 31 December accounting year-end.
The preparation of the Consolidated Financial Statements requires Group Management to exercise judgement and to make estimates and assumptions that affect the application of policies, reported amounts of revenues, expenses, assets and liabilities and disclosures. These estimates and associated assumptions are based on historical experience and various other factors that are believed to be reasonable under the circumstances. Actual results may differ from these estimates.
The estimates and underlying assumptions are reviewed on an ongoing basis. Revisions to accounting estimates are recognised in the period in which the estimate is revised if the revision affects only that period, or in the period of the revision and future periods if the revision affects both current and future periods. Those areas affect mainly provisions, impairment tests, employee benefi ts and unrecognised tax losses.
Scope of consolidationThe Consolidated Financial Statements comprise those of Nestlé S.A. and of its affi liated companies, including joint ventures, and associates (the Group). The list of the principal companies is provided in the section “Companies of the Nestlé Group.”

10 Consolidated Financial Statements of the Nestlé Group
Foreign currenciesThe functional currency of the Group’s entities is the cur-rency of their primary economic environment.
In individual companies, transactions in foreign cur-rencies are recorded at the rate of exchange at the date of the transaction. Monetary assets and liabilities in foreign currencies are translated at year-end rates. Any resulting exchange differences are taken to the income statement.
On consolidation, assets and liabilities of Group entities reported in their functional currencies are translated into Swiss Francs, the Group’s presentation currency, at year-end exchange rates. Income and expense items are trans-lated into Swiss Francs at the annual weighted average rate of exchange or at the rate on the date of the transac-tion for signifi cant items.
Differences arising from the retranslation of opening net assets of Group entities, together with differences aris-ing from the restatement of the net results for the year of Group entities, are recognised against equity.
The balance sheet and net results of Group entities operating in hyperinfl ationary economies are restated for the changes in the general purchasing power of the local currency, using offi cial indices at the balance sheet date, before translation into Swiss Francs at year-end rates.
Segmental informationSegmental information is based on two segment formats: – the primary segment format – by management respon-
sibility and geographic area – refl ects the Group’s man-agement structure. The Group manages its Food and Beverages business through three geographic Zones and globally for Nestlé Waters and Nestlé Nutrition. The Group’s pharmaceuticals activities are also man-aged on a worldwide basis and are presented sepa-rately from Food and Beverages.
– the secondary segment format – by product group – is divided into six product groups (segments).
Segment results represent the contribution of the differ-ent segments to central overheads, research and develop-ment costs and the profi t of the Group. Specifi c corporate expenses as well as specifi c research and development costs are allocated to the corresponding segments.
Segment assets comprise property, plant and equipment, intangible assets, goodwill, trade and other receivables, assets held for sale, inventories as well as prepayments and accrued income.
Segment liabilities comprise trade and other payables, liabilities directly associated with assets held for sale as well as accruals and deferred income.
Eliminations represent inter-company balances between the different segments.
Segment assets and liabilities of the primary segment represent the situation at the end of the year. Segment assets of the secondary segment represent the annual average as this provides a better indication of the level of invested capital for management purposes.
Capital additions represent the total cost incurred to acquire property, plant and equipment, intangible assets and goodwill, including those arising from business com-binations. Capital expenditure represents the investment in property, plant and equipment only.
Depreciation of segment assets includes depreciation of property, plant and equipment and intangible assets. Impairment of segment assets includes impairment related to property, plant and equipment, intangible assets and goodwill.
Unallocated items represent non-specifi c items whose allocation to a segment would be arbitrary. They mainly comprise:– corporate expenses and related assets/liabilities;– research and development costs and related assets/
liabilities;– some goodwill and intangible assets;– capital additions related to administration and distribu-
tion assets for the secondary segment; and– assets held for sale and liabilities directly associated
with assets held for sale linked to a discontinued operation.

11Consolidated Financial Statements of the Nestlé Group
Valuation methods, presentation and defi nitions
RevenueRevenue represents amounts received and receivable from third parties for goods supplied to the customers and for services rendered. Revenue from the sales of goods is recognised in the income statement at the moment when the signifi cant risks and rewards of ownership of the goods have been transferred to the buyer, which is mainly upon shipment. It is measured at the list price applicable to a given distribution channel after deduction of all returns, sales taxes, pricing allowances and similar trade discounts. Payments made to the customers for commercial services received are expensed.
ExpensesCost of goods sold is determined on the basis of the cost of production or of purchase, adjusted for the variation of inventories (which are measured as described in the policy on inventories, below). All other expenses, including those in respect of advertising and promotions, are recognised when the Group has the right of access to the goods or when it receives the services.
Net other income/(expenses)These comprise all exit costs including but not limited to profi t and loss on disposal of property plant and equip-ment, profi t and loss on disposal of businesses, onerous contracts, restructuring costs, impairment of property plant and equipment, intangibles and goodwill.
Restructuring costs are restricted to dismissal indem-nities and employee benefi ts paid to terminated employees upon the reorganisation of a business. Dismissal indem-nities paid for normal attrition such as poor performance, professional misconduct, etc. are part of the expenses by functions.
Net fi nancing costNet fi nancing cost includes the fi nancial expense on bor-rowings from third parties as well as the fi nancial income earned on funds invested outside the Group.
Net fi nancing cost also includes other fi nancial income and expense, such as exchange differences on loans and borrowings, results on foreign currency and interest rate hedging instruments that are recognised in the income statement.
Unwind of discount on provisions is presented in net fi nancing cost.
TaxesThe Group is subject to taxes in different countries all over the world. Taxes and fi scal risks recognised in the Consolidated Financial Statements refl ect Group Management’s best estimate of the outcome based on the facts known at the balance sheet date in each individual country. These facts may include but are not limited to change in tax laws and interpretation thereof in the vari-ous jurisdictions where the Group operates. They may have an impact on the income tax as well as the resulting assets and liabilities. Any differences between tax esti-mates and fi nal tax assessments are charged to the income statement in the period in which they are incurred, unless anticipated.
Taxes include current taxes on profi t and other taxes such as taxes on capital. Also included are actual or potential withholding taxes on current and expected trans-fers of income from Group companies and tax adjust-ments relating to prior years. Income tax is recognised in the income statement, except to the extent that it relates to items directly taken to equity, in which case it is recog-nised against equity.

12 Consolidated Financial Statements of the Nestlé Group
Deferred taxation is the tax attributable to the tem porary differences that arise when taxation authorities recognise and measure assets and liabilities with rules that differ from the principles of the Consolidated Financial Statements. It also arises on temporary differences stemming from tax losses carry-forward.
Deferred taxes are calculated under the liability method at the rates of tax expected to prevail when the temporary differences reverse subject to such rates being substan-tially enacted at the balance sheet date. Any changes of the tax rates are recognised in the income statement unless related to items directly recognised against equity. Deferred tax liabilities are recognised on all taxable tem-porary differences excluding non-deductible goodwill. Deferred tax assets are recognised on all deductible tem-porary differences provided that it is probable that future taxable income will be available.
For share-based payments, a deferred tax asset is rec-ognised in the income statement over the vesting period, provided that a future reduction of the tax expense is both probable and can be reliably estimated. The deferred tax asset for the future tax deductible amount exceeding the total share-based payment cost is recognised against equity.
Financial Instruments
Classes of fi nancial instrumentsThe Group aggregates its fi nancial instruments into classes based on their nature and characteristics. The details of fi nancial instruments by class are disclosed in the notes.
Financial assetsThe Group designates its fi nancial assets into the following categories, as appropriate: loans and receivables, held-to-maturity investments, fi nancial assets at fair value through profi t and loss and available-for-sale assets.
Financial assets are initially recognised at fair value plus directly attributable transaction costs. Subsequent remeas-urement of fi nancial assets is determined by their designa-tion that is revisited at each reporting date.
Derivatives embedded in other contracts are separated and treated as stand-alone derivatives when their risks and characteristics are not closely related to those of their host contracts and the respective host contracts are not carried at fair value.
In case of regular way purchase or sale (purchase or sale under a contract whose terms require delivery within the time frame established by regulation or convention in the market place), the settlement date is used for both initial recognition and subsequent derecognition.
At each balance sheet date, the Group assesses whether its fi nancial assets are to be impaired. Impairment losses are recognised in the income statement where there is objective evidence of impairment. These losses are never reversed unless they refer to a fi nancial instrument measured at fair value and classifi ed as available-for-sale and the increase in fair value can objectively be related to an event occurring after the recognition of the impairment loss.
Financial assets are derecognised (in full or partly) when the Group’s rights to cash fl ows from the respective assets have expired or have been transferred and the Group has neither exposure to the risks inherent in those assets nor entitlement to rewards from them.
Cash and cash equivalentsThese are cash balances, deposits at sight as well as time deposits and placements in commercial paper the maturi-ties of which are three months or less at inception.
Loans and receivablesLoans and receivables are non-derivative fi nancial assets with fi xed or determinable payments that are not quoted in an active market. This category includes the following three classes of fi nancial assets: loans, trade and other receivables.

13Consolidated Financial Statements of the Nestlé Group
Subsequent to initial measurement, loans and receiv-ables are carried at amortised cost using the effective interest rate method less appropriate allowances for doubtful receivables.
Allowances for doubtful receivables represent the Group’s estimates of losses that could arise from the fail-ure or inability of customers to make payments when due. These estimates are based on the ageing of customers balances, specifi c credit circumstances and the Group’s historical bad receivables experience.
Loans and receivables are further classifi ed as current and non-current depending whether these will be realised within twelve months after the balance sheet date or beyond.
Held-to-maturity investmentsHeld-to-maturity investments are non-derivative fi nancial assets with fi xed or determinable payments and fi xed maturities. The Group uses this designation when it has an intention and ability to hold until maturity and the re-sale of such investments is prohibited.
Subsequent to initial recognition held-to-maturity investments are recognised at amortised cost less impair-ment losses.
Held-to-maturity investments are further classifi ed as current and non-current depending whether these will mature within twelve months after the balance sheet date or beyond.
Financial assets at fair value through profi t and lossThe fi nancial assets at fair value through profi t and loss category includes the following two classes of fi nancial assets: held-for-trading assets and undesignated deriva-tives.
Held-for-trading assetsHeld-for-trading assets are marketable securities and other fi xed income portfolios that are managed with the aim of delivering performance over agreed benchmarks and are therefore classifi ed as trading. Short-term investments in securities and fi xed income instruments are made in line with the Group’s liquidity and credit risk management policies.
Subsequent to initial measurement, held-for-trading assets are carried at fair value and all their gains and losses, realised and unrealised, are recognised in the income statement.
Undesignated derivativesUndesignated derivatives are comprised of two categories. The fi rst includes derivatives for which hedge accounting is not applied because these are either not designated as hedging instruments or not effective as hedging instru-ments. The second category relates to derivatives that are acquired with the aim of delivering performance over agreed benchmarks of marketable securities portfolios.
Subsequent to initial measurement, undesignated de rivatives are carried at fair value and all their gains and losses, realised and unrealised, are recognised in the income statement. In both cases, derivatives are acquired in full compliance with the Group’s risk management policies.
Available-for-sale assetsAvailable-for-sale assets are those non-derivative fi nancial assets that are either designated as such upon initial rec-ognition or are not classifi ed in any of the other fi nancial assets categories. This category includes the following classes of fi nancial assets: cash at bank and in hands, commercial paper, time deposits and other investments.
Subsequent to initial measurement available-for-sale assets are stated at fair value with all unrealised gains or losses recognised against equity until their disposal when such gains or losses are recognised in the income state-ment.
Interests on available-for-sale assets are calculated using the effective interest rate method and are recognised in the income statement as part of interest income under net fi nancing cost.
Available-for-sale assets are further classifi ed as current and non-current depending whether these will be realised within twelve months after the balance sheet date or beyond.
14 Consolidated Financial Statements of the Nestlé Group
Financial liabilities at amortised costFinancial liabilities are initially recognised at the fair value of consideration received less directly attributable trans-action costs.
Subsequent to initial measurement, fi nancial liabilities are recognised at amortised cost unless they are part of a fair value hedge relationship (refer to fair value hedges). The difference between the initial carrying amount of the fi nancial liabilities and their redemption value is recog-nised in the income statement over the contractual terms using the effective interest rate method. This category includes the following four classes of fi nancial liabilities: trade and other payables, commercial paper, bonds and other fi nancial liabilities.
Financial liabilities at amortised cost are further classi-fi ed as current and non-current depending whether these will fall due within twelve months after the balance sheet date or beyond.
Financial liabilities are derecognised (in full or partly) when either the Group is discharged from its obligation, it expires, is cancelled or replaced by a new liability with substantially modifi ed terms.
Derivative fi nancial instrumentsA derivative is a fi nancial instrument that changes its values in response to changes in the underlying variable, requires no or little net initial investment and is settled at a future date. Derivatives are mainly used to manage exposures to foreign exchange, interest rate and commodity price risk. Whilst some derivatives are also acquired with the aim of managing the return of marketable securities portfolios, these derivatives are only acquired when there are under-lying fi nancial assets. The classifi cation of derivatives is determined upon initial recognition and is monitored on a regular basis.
Derivatives are initially recognised at fair value, adjusted for directly attributable transaction costs. These are sub-sequently remeasured at fair value on a regular basis and at each reporting date as a minimum. The fair values of
exchange-traded derivatives are based on market prices, while the fair value of the over-the-counter derivatives are using accepted mathematical models based on market data and assumptions. Derivatives are carried as assets when their fair value is positive and as liabilities when their fair value is negative. Any gains or losses arising from changes in fair values of derivatives that do not qualify for hedge accounting are recognised directly in the income statement.
The Group’s derivatives mainly consist of currency for-wards, futures, options and swaps; commodity futures and options; interest rate forwards, futures, options and swaps.
The use of derivatives is governed by the Group’s poli-cies approved by the Board of Directors, which provide written principles on the use of derivatives consistent with the Group’s overall risk management strategy.
Hedge accountingThe Group designates and documents certain derivatives as hedging instruments against changes in fair values of recognised assets and liabilities (fair value hedges), highly probable forecast transactions (cash fl ow hedges) and hedges of net investments in foreign operations (net investment hedges). The effectiveness of such hedges is demonstrated at inception and verifi ed at regular intervals and at least on a quarterly basis, using prospective and retrospective testing.
Fair value hedgesThe Group uses fair value hedges to mitigate foreign cur-rency and interest rate risks of its recognised assets and liabilities.
The changes in fair values of hedging instruments are recognised in the income statement. Hedged items are also stated at fair value in respect of the risk being hedged, with any gain or loss being recognised in the income statement.

15Consolidated Financial Statements of the Nestlé Group
Cash fl ow hedgesThe Group uses cash fl ow hedges to mitigate foreign cur-rency risks of highly probable forecast transactions, such as anticipated future export sales, purchases of equipment and raw materials, as well as the variability of expected interest payments and receipts.
The effective part of the changes in fair value of hedg-ing instruments are recognised against equity, while any ineffective part is recognised immediately in the income statement. When the hedged item results in the recogni-tion of a non-fi nancial asset or liability, the gains or losses previously recognised against equity are included in the measurement cost of the asset or of the liability. Other-wise the gains or losses previously recognised against equity are removed from equity and recognised in the income statement at the same time as the hedged transaction.
Net investment hedgesThe Group uses net investment hedges to mitigate transla-tion exposure on its net investments in affi liated companies.
The changes in fair values of hedging instruments are taken directly to equity together with gains or losses on the foreign currency translation of the hedged investments. All of these fair value gains or losses are deferred in equity until the investments are sold or otherwise disposed of.
Fair valuesThe Group determines the fair values of its fi nancial instru-ments using market prices for quoted instruments and widely accepted valuation techniques for other instruments.
Valuation techniques include discounted cash fl ows, standard valuation models based on market parameters, dealer quotes for similar instruments and use of comparable arm’s length transactions.
When fair values of unquoted instruments cannot be measured with suffi cient reliability, the Group carries such instruments at cost less impairment, if applicable.
InventoriesRaw materials and purchased fi nished goods are valued at purchase cost. Work in progress and manufactured fi nished goods are valued at production cost. Production cost includes direct production costs and an appropriate pro-portion of production overheads and factory depreciation.
Raw material inventories and purchased fi nished goods are accounted for using the FIFO (fi rst in, fi rst out) method. The weighted average cost method is used for other inventories.
An allowance is established when the net realisable value of any inventory item is lower than the value calcu-lated above.
Prepayments and accrued incomePrepayments and accrued income comprise payments made in advance relating to the following year, and income relating to the current year, which will not be invoiced until after the balance sheet date.

16 Consolidated Financial Statements of the Nestlé Group
Property, plant and equipmentProperty, plant and equipment are shown in the balance sheet at their historical cost. Depreciation is provided on components that have homogenous useful lives by using the straight-line method so as to depreciate the initial cost down to the residual value over the estimated useful lives. The residual values are 30% on head offi ces and nil for all other asset types. The useful lives are as follows:
Buildings 20–40 yearsMachinery and equipment 10–25 yearsTools, furniture, information technology and sundry equipment 3–10 yearsVehicles 3–8 yearsLand is not depreciated.
Useful lives, components and residual amounts are reviewed annually. Such a review takes into consideration the nature of the assets, their intended use including but not limitative to the closure of facilities and the evolution of the technology and competitive pressures that may lead to technical obsolescence.
Depreciation of property, plant and equipment is allo-cated to the appropriate headings of expenses by function in the income statement.
Financing costs incurred during the course of construc-tion are expensed. Premiums capitalised for leasehold land or buildings are amortised over the length of the lease. Government grants are recognised in accordance with the deferral method, whereby the grant is set up as deferred income which is released to the income state-ment over the useful life of the related assets. Grants that are not related to assets are credited to the income state-ment when they are received.
Leased assetsAssets acquired under fi nance leases are capitalised and depreciated in accordance with the Group’s policy on property, plant and equipment unless the lease term is shorter. Land and building leases are recognised sepa-rately provided an allocation of the lease payments between these categories is reliable. The associated obli-gations are included under fi nancial liabilities.
Rentals payable under operating leases are expensed.The costs of the agreements that do not take the legal
form of a lease but convey the right to use an asset are separated into lease payments and other payments if the entity has the control of the use or of the access to the asset or takes essentially all the output of the asset. Then the entity determines whether the lease component of the agreement is a fi nance or an operating lease.
Business combinations and related goodwillAs from 1 January 1995, the excess of the cost of an acquisition over the fair value of the net identifi able assets, liabilities and contingent liabilities acquired is capitalised. Previously these amounts had been written off through equity.
Goodwill is not amortised but tested for impairment at least annually and upon the occurrence of an indication of impairment. The impairment testing process is described in the appropriate section of these policies.
Goodwill is recorded in the functional currencies of the acquired operations.
All assets, liabilities and contingent liabilities acquired in a business combination are recognised at the acquisition date and measured at their fair value.
17Consolidated Financial Statements of the Nestlé Group
Intangible assetsThis heading includes intangible assets that are acquired either separately or in a business combination when they are identifi able and can be reliably measured. Intangible assets are considered to be identifi able if they arise from contractual or other rights, or if they are separable i.e. they can be disposed of either individually or together with other assets. Intangible assets comprise indefi nite life intangible assets and fi nite life intangible assets.
Indefi nite life intangible assets are those for which there is no foreseeable limit to their useful economic life as they arise from contractual or other legal rights that can be renewed without signifi cant cost and are the subject of continuous marketing support. They are not depreciated but tested for impairment annually or more frequently if an impairment indicator is triggered. They mainly comprise certain brands, trademarks and intellectual property rights. The assessment of the classifi cation of intangible assets as indefi nite is reviewed annually.
Finite life intangible assets are those for which there is an expectation of obsolescence that limits their useful economic life or where the useful life is limited by contrac-tual or other terms. They are depreciated over the shorter of their contractual or useful economic lives. They com-prise mainly management information systems, patents and rights to carry on an activity (i. e. exclusive rights to sell products or to perform a supply activity). Finite life intangible assets are depreciated on a straight-line basis assuming a zero residual value: management information systems over a period ranging from three to fi ve years; and other fi nite life intangible assets over fi ve to 20 years. The depreciation period and depreciation method are reviewed annually by taking into account the risk of ob solescence.
Depreciation of intangible assets is allocated to the appropriate headings of expenses by function in the income statement.
Internally generated intangible assets are capitalised, provided they generate future economic benefi ts and their costs are clearly identifi able.
Research and development Research costs are charged to the income statement in the year in which they are incurred.
Development costs relating to new products are not capitalised because the expected future economic benefi ts cannot be reliably determined. As long as the products have not reached the market place, there is no reliable evidence that positive future cash fl ows would be obtained.
Other development costs (essentially management information system software) are capitalised provided that there is an identifi able asset that will be useful in generat-ing future benefi ts in terms of savings, economies of scale, etc.
Impairment of goodwill and indefi nite life intangible assetsGoodwill and indefi nite life intangible assets are tested for impairment at least annually and upon the occurrence of an indication of impairment.
The impairment tests are performed annually at the same time each year and at the cash generating unit (CGU) level. The Group defi nes its CGUs based on the way that it monitors and derives economic benefi ts from the acquired goodwill and intangibles. The impairment tests are performed by comparing the carrying value of the assets of these CGUs with their recoverable amount, based on their future projected cash fl ows discounted at an appropriate pre-tax rate of return. Usually, the cash fl ows correspond to estimates made by Group Manage-ment in fi nancial plans and business strategies covering a period of fi ve years. They are then projected to 50 years using a steady or declining growth rate given that the Group businesses are of a long-term nature. The Group assesses the uncertainty of these estimates by making sensitivity analyses. The discount rate refl ects the current assessment of the time value of money and the risks spe-cifi c to the CGUs (essentially country risk). The business risk is included in the determination of the cash fl ows. Both the cash fl ows and the discount rates exclude infl ation.

18 Consolidated Financial Statements of the Nestlé Group
Impairment of property, plant and equipment and fi nite life intangible assets Consideration is given at each balance sheet date to deter-mine whether there is any indication of impairment of the carrying amounts of the Group’s property, plant and equipment and fi nite life intangible assets. Indication could be unfavourable development of a business under com-petitive pressures or severe economic slowdown in a given market as well as reorganisation of the operations to leverage their scale. If any indication exists, an asset’s recoverable amount is estimated. An impairment loss is recognised whenever the carrying amount of an asset exceeds its recoverable amount. The recoverable amount is the greater of the fair value less cost to sell and value in use. In assessing value in use, the estimated future cash fl ows are discounted to their present value, based on the average borrowing rate of the country where the assets are located, adjusted for risks specifi c to the asset.
Assets held for sale and discontinued operationsNon-current assets held for sale (and disposal groups) are presented separately in the current section of the balance sheet. Immediately before the initial classifi cation of the assets (and disposal groups) as held for sale, the carrying amounts of the assets (or all the assets and liabilities in the disposal groups) are measured in accordance with their applicable accounting policy. Non-current assets held for sale (and disposal groups) are subsequently measured at the lower of their carrying amount and fair value less cost to sell. Non-current assets held for sale (and disposal groups) are no longer depreciated.
Upon occurrence of discontinued operations, the net profi t/(loss) on discontinued operations is presented on the face of the Consolidated income statement. Comparative information is restated accordingly. Income statement and cash fl ow information related to discontin-ued operations are disclosed separately in the notes.
ProvisionsProvisions comprise liabilities of uncertain timing or amount that arise from restructuring plans, environmental, litigation and other risks. Provisions are recognised when there exists a legal or constructive obligation stemming from a past event and when the future cash outfl ows can be reliably estimated. Obligations arising from restructur-ing plans are recognised when detailed formal plans have been established and when there is a valid expectation that such plans will be carried out by either starting to implement them or announcing their main features. Obligations under litigations refl ect Group Management’s best estimate of the outcome based on the facts known at the balance sheet date.
Employee benefi tsThe liabilities of the Group arising from defi ned benefi t obligations, and the related current service cost, are deter-mined using the projected unit credit method. Actuarial advice is provided both by external consultants and by actuaries employed by the Group. The actuarial assump-tions used to calculate the defi ned benefi t obligations vary according to the economic conditions of the country in which the plan is located. Such plans are either externally funded (in the form of independently administered funds) or unfunded.
For the funded defi ned benefi t plans, the defi cit or excess of the fair value of plan assets over the present value of the defi ned benefi t obligation is recognised as a liability or an asset in the balance sheet, taking into account any unrecognised past service cost. However, an excess of assets is recognised only to the extent that it represents a future economic benefi t which is actually available to the Group, for example in the form of available refunds from the plan or reductions in future contributions to the plan (either effective or possible). When such an excess is not available or does not represent at minimum a possible future economic benefi t, it is not recognised but is disclosed in the notes. Impacts of minimum funding requirements in relation to past service are considered when determining pension obligations.

19Consolidated Financial Statements of the Nestlé Group
Actuarial gains and losses arise mainly from changes in actuarial assumptions and differences between actuarial assumptions and what has actually occurred. They are recognised in the period in which they occur in the state-ment of recognised income and expense.
For defi ned benefi t plans, the pension cost charged to the income statement consists of current service cost, interest cost, expected return on plan assets and past service cost. Recycling to the income statement of cumu-lated actuarial gains and losses recognised against equity is not permitted by IAS 19. The past service cost for the enhancement of pension benefi ts is accounted for when such benefi ts vest or become a constructive obligation.
Some benefi ts are also provided by defi ned contribution plans; contributions to such plans are charged to the income statement as incurred.
Share-based paymentThe Group has equity-settled and cash-settled share-based payment transactions.
Equity-settled share-based payment transactions are recognised in the income statement with a corresponding increase in equity over the vesting period. They are fair valued at grant date and measured using the Black and Scholes model. The cost of equity-settled share-based payment transactions is adjusted annually by the expec-tations of vesting, for the forfeitures of the participants’ rights that no longer satisfy the plan conditions, as well as for early vesting.
Liabilities arising from cash-settled share-based pay-ment transactions are recognised in the income statement over the vesting period. They are fair valued at each reporting date and measured using the Black and Scholes
model. The cost of cash-settled share-based payment transactions is adjusted for the forfeitures of the partici-pants’ rights that no longer satisfy the plan conditions, as well as for early vesting.
Accruals and deferred incomeAccruals and deferred income comprise expenses relating to the current year, which will not be invoiced until after the balance sheet date and income received in advance, relating to the following year.
DividendsIn accordance with Swiss law and the Company’s Articles of Association, dividends are treated as an appropriation of profi t in the year in which they are ratifi ed at the Annual General Meeting and subsequently paid.
Contingent assets and liabilitiesContingent assets and liabilities are possible rights and obligations that arise from past events and whose exist-ence will be confi rmed only by the occurrence or non-occurrence of one or more uncertain future events not fully within the control of the Group. They are disclosed in the notes.
Events occurring after the balance sheet dateThe values of assets and liabilities at the balance sheet date are adjusted if there is evidence that subsequent adjusting events warrant a modifi cation of these values. These adjustments are made up to the date of approval of the Consolidated Financial Statements by the Board of Directors. Other non-adjusting events are disclosed in the notes.

20 Consolidated Financial Statements of the Nestlé Group
Changes in accounting policies The Group has applied the following IFRS as from 1 January 2008 onwards:
IFRIC 14 – IAS 19 – The limit on a defi ned benefi t asset, minimum funding requirements and their interactionThis interpretation requires to determine the availability of refunds or reductions in future contributions in accord-ance with the terms and conditions of the plans and the statutory requirements of the plans of the respective jurisdictions.
The retrospective application of IFRIC 14 impacted the 2007 Consolidated Financial Statements (refer to Note 32).
Reclassifi cation of Financial Assets – Amendments to IAS 39 – Financial Instruments: Recognition and Measurement and IFRS 7 – Financial Instruments: DisclosuresThese amendments allow entities to reclassify non-deriva-tive fi nancial assets out of fair value through profi t or loss if the assets are no longer held for the purpose of selling or repurchasing and if the entity has the intention and ability to hold them for the foreseeable future or until maturity.
The Group did not reclassify any fi nancial assets out of the fair value through profi t or loss category in 2008.
Changes in presentation
EquityThe Group has simplifi ed the presentation of its equity. In line with the income statement, the statement of recog-nised income and expense discloses in aggregate the allo-cations to minority interests and shareholders of the parent (previously allocated for each movement). The statement of changes in equity presents the reserves
“Share premium” and “Reserve for treasury shares” together with “Retained earnings.” Additionally, all of the movements in respect of equity-settled share-based pay-ment are disclosed together in the statement of changes in equity. Furthermore, the dividends paid to minority interests are shown separately from the other changes in minority interests (previously presented under “Move-ments with minority interests [net].”)
Cash Flow StatementThe Group has enhanced the presentation of its cash fl ow statement. It presents all of the “Non-cash items of income and expense” in aggregate (previously presented individually or under “Other operating cash fl ows.”) It also discloses separately the variation of the “Other operating assets and liabilities” (previously presented under “Increase/[decrease] in provisions and deferred taxes” and “Other operating cash fl ows.”) These reclassifi cations have had no impact on the operating cash fl ow.
Changes in accounting estimatesIn accordance with the review of useful lives required by IAS 16, the Group has modifi ed its useful lives as follows in 2008: – maximum life of buildings increased from 35 to 40
years and deletion of the residual amount of 20% on distribution centres for products stored at ambient temperature,
– maximum useful life of machinery and equipment increased from 20 to 25 years,
– maximum life of tools furniture and sundry equipment increased from 8 to 10 years.
The Group considers that the new maximum lives bet-ter refl ect the current improved construction techniques and operation conditions of industrial equipment. These changes do no have a material effect on the Group’s fi nan-cial statements.

21Consolidated Financial Statements of the Nestlé Group
Changes in IFRS that may affect the Group after 31 December 2008
IFRS 3 Revised – Business combinationsThis standard will be effective for the fi rst annual reporting period beginning on or after 1 July 2009. The Group will thus apply it prospectively as from 1 January 2010 onwards. The revised standard will cause the following changes:– acquisition costs will be expensed;– for a business combination in which the acquirer
achieves control without buying all of the equity of the acquiree, the remaining minority (non-controlling) equity interests are measured either at fair value or at the non-controlling interests’ proportionate share of the acquiree’s net identifi able assets;
– upon obtaining control in a business combination achieved in stages, the acquirer shall remeasure its previously held equity interest at fair value and recog-nise a gain or a loss to the income statement; and
– changes in the contingent consideration of an acquisi-tion will be accounted for outside goodwill, in the income statement.
IAS 27 Revised – Consolidated and separate fi nancial statements This standard will be applicable prospectively for the fi rst annual reporting period beginning on or after 1 July 2009, the Group will thus apply it as from 1 January 2010 onwards. The revised standard stipulates that a change in the minor-ity (non-controlling) interest of an acquiree that does not result in a loss of control shall be recognised in equity.
IFRS 8 – Operating segmentsThis standard will be applied in 2009. The Group has assessed its impact and determined that it should not sig-nifi cantly change its segments previously identifi ed under IAS 14 – Segment Reporting.
IAS 1 Revised – Presentation of fi nancial statementsThe standard includes non-mandatory changes of the titles of the fi nancial statements that the Group may not apply. The standard also introduces a statement of com-prehensive income but allows to present an income state-ment and a statement of recognised income and expense.
IAS 23 Revised – Borrowing costsThe revised standard removes the option of recognising as an expense borrowing costs directly attributable to acquisition, construction or production of a qualifying asset as currently elected by the Group. This standard will not have a material impact on the Group’s fi nancial statements.
Improvements to IFRSsSeveral standards have been modifi ed on miscellaneous points and are effective in 2009. They are not going to have a material effect on the Group’s fi nancial statement. Moreover the Group already complies with the require-ment of the change in IAS 38 – Intangible assets whereby expenditure in respect of advertising and promotions is recognised when an entity has the right of access to the goods and when the services are delivered.
IFRIC 13 – Consumer loyalty programmesThe Group will apply this interpretation in 2009. It requires that the fair value of the consideration related to award credits programmes be separately identifi ed as a com-ponent of the sales transaction and recognised when the awards are redeemed by the customers and the cor-responding obligations are fulfi lled by the Group. Such programmes are not numerous in the Group and this inter-pretation is unlikely to have a material effect on its results.
IFRIC 16 – Hedges of a net investment in a foreign operationThis interpretation deals with the nature of the hedged risk, its designation and where the hedging instrument can be held. This interpretation will have no impact on the Group’s fi nancial statements when it is effective in 2009 as the Group already complies with its requirements.
2. Modifi cation of the scope of consolidationThe scope of consolidation is affected by acquisitions and disposals. In 2008, the principal businesses acquired were:– Collagenex, USA, Dermatology Rosacea, 50% (April)– Ruzanna, Russia, Confectionery, 100% (March)

22 Consolidated Financial Statements of the Nestlé Group
20
07
Segment revenues and results
Sales (c) 28 153 33 134 17 130 9 589 10 375
EBIT Earnings Before Interest, Taxes, restructuring and impairments 3 446 5 469 2 826 573 1 797
Segment assets and liabilities
Segment assets 13 899 18 815 8 668 8 245 13 262
Non-segment assets
Total assets
of which goodwill and intangible assets 3 140 7 044 1 852 2 245 9 564
Segment liabilities 4 860 3 748 2 461 1 691 1 339
Non-segment liabilities
Total liabilities
Other segment information
Capital additions 1 247 1 525 774 1 051 504
of which Capital expenditure 904 1 359 663 768 355
Depreciation of segment assets 852 738 434 554 217
Impairment of segment assets 63 53 (1) 638 6
Restructuring costs 88 45 41 169 18
(a) Mainly Nespresso and Food and Beverages Joint Ventures managed on a worldwide basis(b) Refer to the Segmental information section of the Accounting policies for the defi nition of Unallocated items.
3. Segmental information
3.1 By management responsibility and geographic area
In millions of CHF
Zone
Eur
ope
Zone
Am
eric
as
Zone
Asi
a,O
cean
iaan
d A
fric
a
Nes
tléW
ater
s
Nes
tléN
utrit
ion
Segment revenues and results
Sales (c) 28 464 32 917 16 556 10 404 8 434
EBIT Earnings Before Interest, Taxes, restructuring and impairments 3 412 5 359 2 697 851 1 447
Segment assets and liabilities
Segment assets 15 794 19 503 9 153 9 298 13 990
Non-segment assets (d)
Total assets (d)
of which goodwill and intangible assets 3 457 7 702 2 113 2 859 10 070
Segment liabilities 6 096 4 067 2 595 2 220 1 385
Non-segment liabilities (d)
Total liabilities (d)
Other segment information
Capital additions 1 118 1 667 811 1 382 9 768
of which Capital expenditure 932 1 371 675 1 043 271
Depreciation of segment assets 878 753 458 527 155
Impairment of segment assets 85 66 13 243 –
Restructuring costs 89 15 60 237 46
20
08

23Consolidated Financial Statements of the Nestlé Group
20
07
20
08
Segment revenues and results
3 983 102 364 7 544 109 908 Sales (c)
696 (1 704) 13 103 2 573 15 676 EBIT Earnings Before Interest, Taxes, restructuring and impairments
Segment assets and liabilities
2 052 11 991 (1 145) 75 787 7 122 82 909 Segment assets
23 306 Non-segment assets
106 215 Total assets
193 9 917 33 955 3 549 37 504 of which goodwill and intangible assets
754 721 (1 145) 14 429 1 110 15 539 Segment liabilities
35 760 Non-segment liabilities
51 299 Total liabilities
Other segment information
307 188 5 596 753 6 349 Capital additions
304 188 4 541 328 4 869 of which Capital expenditure
106 93 2 994 255 3 249 Depreciation of segment assets
– – 759 51 810 Impairment of segment assets
1 4 366 36 402 Restructuring costs
(c) The analysis of sales by geographic area is stated by customer location. Inter-segment sales are not signifi cant.(d) 2007 comparatives have been restated following fi rst application of IFRIC 14 (refer to Note 32).
Oth
erFo
od a
ndB
ever
ages
(a)
Una
lloca
ted
item
s (b
)
Inte
r-se
gm
ent
elim
inat
ions
Tota
lFo
od a
ndB
ever
ages
Pha
rma
Tota
l
Segment revenues and results
3 458 100 233 7 319 107 552 Sales (c)
548 (1 725) 12 589 2 435 15 024 EBIT Earnings Before Interest, Taxes, restructuring and impairments
Segment assets and liabilities
1 792 13 140 (1 565) 81 105 7 120 88 225 Segment assets
27 136 Non-segment assets (d)
115 361 Total assets (d)
237 10 667 37 105 3 535 40 640 of which goodwill and intangible assets
768 796 (1 565) 16 362 1 090 17 452 Segment liabilities
43 133 Non-segment liabilities (d)
60 585 Total liabilities (d)
Other segment information
272 135 15 153 1 483 16 636 Capital additions
269 134 4 695 276 4 971 of which Capital expenditure
31 146 2 948 263 3 211 Depreciation of segment assets
4 – 411 71 482 Impairment of segment assets
7 – 454 27 481 Restructuring costs

24 Consolidated Financial Statements of the Nestlé Group
20
07
20
08
3.2 By product group
In millions of CHF
Bev
erag
es
Milk
pro
duct
s,N
utrit
ion
and
Ice
crea
m
Pre
pare
ddi
shes
and
cook
ing
aid
s
Con
fect
ione
ry
Segment revenues and results
Sales 28 245 29 106 18 504 12 248
EBIT Earnings Before Interest, Taxes, restructuring and impairments 4 854 3 744 2 414 1 426
Segment assets
Segment assets 17 937 23 047 10 959 6 663
of which goodwill and intangible assets 3 374 10 318 4 167 1 021
Other segment information
Capital additions 1 678 10 519 313 304
of which Capital expenditure 1 409 933 305 316
Impairment of segment assets 243 112 47 (1)
Restructuring costs 288 91 20 53
Segment revenues and results
Sales 28 474 30 936 18 117 12 370
EBIT Earnings Before Interest, Taxes, restructuring and impairments 4 756 4 158 2 311 1 620
Segment assets
Segment assets 18 218 28 203 10 716 6 682
of which goodwill and intangible assets 3 237 14 476 3 782 990
Other segment information
Capital additions 1 375 1 058 434 534
of which Capital expenditure 1 159 896 387 329
Impairment of segment assets 647 68 23 1
Restructuring costs 197 80 49 22
(a) Refer to the Segmental information section of the Accounting policies for the defi nition of Unallocated items.

25Consolidated Financial Statements of the Nestlé Group
20
07
20
08
PetC
are
Pha
rmac
eutic
alpr
oduc
ts
Tota
lse
gm
ents
Una
lloca
ted
item
s (a
)
Tota
l
Segment revenues and results
12 130 7 319 107 552 107 552 Sales
1 876 2 435 16 749 (1 725) 15 024 EBIT Earnings Before Interest, Taxes, restructuring and impairments
Segment assets
15 652 6 704 80 962 Segment assets
11 347 3 286 33 513 of which goodwill and intangible assets
Other segment information
496 1 363 14 673 1 963 16 636 Capital additions
402 155 3 520 1 451 4 971 of which Capital expenditure
10 71 482 – 482 Impairment of segment assets
2 27 481 – 481 Restructuring costs
Segment revenues and results
12 467 7 544 109 908 109 908 Sales
1 962 2 573 17 380 (1 704) 15 676 EBIT Earnings Before Interest, Taxes, restructuring and impairments
Segment assets
14 795 7 077 85 691 Segment assets
10 282 3 425 36 192 of which goodwill and intangible assets
Other segment information
431 583 4 415 1 934 6 349 Capital additions
431 158 3 360 1 509 4 869 of which Capital expenditure
20 51 810 – 810 Impairment of segment assets
18 36 402 – 402 Restructuring costs

26 Consolidated Financial Statements of the Nestlé Group
4. Net other income/(expenses)
In millions of CHF Notes 2008 2007
Other income
Profi t on disposal of property, plant and equipment 13 24 185
Profi t on disposal of businesses 24 9 333 318
Other 69 192
9 426 695
Other expenses
Loss on disposal of property, plant and equipment 13 (6) (9)
Loss on disposal of businesses 24 (81) (59)
Restructuring costs 18 (402) (481)
Impairment of property, plant and equipment 13 (248) (225)
Impairment of goodwill 14 (561) (251)
Impairment of intangible assets 15 (1) (6)
Other (a) (825) (254)
(2 124) (1 285)
Net other income/(expenses) 7 302 (590)
(a) In 2008, the signifi cant items are expenses linked to tax litigation claims mainly in South America.
5. Net fi nancing cost
In millions of CHF 2008 2007
Financial income
Interest income 102 418
Gains on investments at fair value to income statement – 158
102 576
Financial expense
Interest expense (1 102) (1 481)
Losses on investments at fair value to income statement (a) (131) –
Unwind of the discount on provisions (14) (11)
(1 247) (1 492)
Net fi nancing cost (1 145) (916)
(a) Losses in 2008 are mainly related to fair value losses in trading securities, of which a signifi cant portion is related to Alcon.

27Consolidated Financial Statements of the Nestlé Group
6. Expenses by natureThe following items are allocated to the appropriate headings of expenses by function in the income statement:
In millions of CHF 2008 2007
Depreciation of property, plant and equipment 2 625 2 620
Depreciation of intangible assets 624 591
Salaries and welfare expenses 16 129 16 831
Operating lease charges 630 625
Exchange differences 283 146
The expected tax expense at weighted average applicable tax rate is the result from applying the domestic statutory tax rates to profi ts before taxes of each entity in the coun-try it operates. For the Group, the weighted average appli-cable tax rate varies from one year to the other depending on the relative weight of the profi t of each individual entity
in the Group’s profi t as well as the changes in the statu-tory tax rates.
In 2008, the weighted average applicable tax rate is also substantially impacted by the tax free gain resulting from the disposal of the 24.8% stake of Alcon.
7. Taxes
7.1 Taxes recognised in the income statement
In millions of CHF 2008 2007 (a)
Components of taxes
Current taxes (b) 3 423 3 400
Deferred taxes (1 090) 156
Taxes reclassifi ed to equity 1 454 (140)
3 787 3 416
Reconciliation of taxes
Expected tax expense at weighted average applicable tax rate 4 294 3 134
Tax effect of non-deductible or non-taxable items (873) (225)
Prior years’ taxes (220) (58)
Transfers to unrecognised deferred tax assets 61 62
Transfers from unrecognised deferred tax assets (14) (46)
Changes in tax rates (6) –
Withholding taxes levied on transfers of income 350 403
Other, incl. taxes on capital 195 146
3 787 3 416
(a) 2007 comparatives have been restated following fi rst application of IFRIC 14.(b) The adjustment for current taxes of prior years is a benefi t of CHF 49 million (2007: expense of CHF 12 million).

28 Consolidated Financial Statements of the Nestlé Group
At 31 December 2008, the unrecognised deferred tax assets amount to CHF 450 million (2007: CHF 520 million).
In addition, the Group has not recognised deferred tax liabilities in respect of unremitted earnings that are consid-
ered indefi nitely reinvested in foreign subsidiaries. At 31 December 2008, these earnings amount to CHF 17.4 bil-lion (2007: CHF 22.3 billion). They could be subject to withholding and other taxes on remittance.
In millions of CHF 2008 2007 (a)
Refl ected in the balance sheet as follows:
Deferred tax assets 2 842 2 224
Deferred tax liabilities (1 341) (1 558)
Net assets 1 501 666
(a) 2007 comparatives have been restated following fi rst application of IFRIC 14 (refer to Note 32).
7.2 Reconciliation of deferred taxes by types of temporary differences recognised in the balance sheet
In millions of CHF
Property,plant and
equipment
Goodwilland
intangibleassets
Employeebenefi ts
Inventories,receivables,
payablesand
provisions
Unused taxlosses andunused tax
credits Other Total
At 1 January 2007 (a) (922) (655) 1 620 898 288 265 1 494
Currency retranslations 81 15 (85) (27) (5) (10) (31)
Deferred tax (expense)/income (a) (3) 36 (193) 31 (14) (13) (156)
Modifi cation of the scope of consolidation (47) (453) 80 (11) 9 (219) (641)
At 31 December 2007 (a) (891) (1 057) 1 422 891 278 23 666
Currency retranslations 76 69 (165) (106) (26) (45) (197)
Deferred tax (expense)/income (99) 147 654 94 75 219 1 090
Modifi cation of the scope of consolidation 3 (17) (4) 1 (3) (38) (58)
At 31 December 2008 (911) (858) 1 907 880 324 159 1 501
7.3 Unrecognised deferred taxesThe deductible temporary differences as well as the unused tax losses and tax credits for which no deferred tax assets are recognised expire as follows:
20
08
20
07
In millions of CHF 2008 2007
Within one year 80 115
Between one and fi ve years 343 739
More than fi ve years 1 080 890
1 503 1 744

29Consolidated Financial Statements of the Nestlé Group
8. Associates
In millions of CHF 2008 2007
At 1 January 8 936 8 430
Currency retranslations (986) 90
Investments 116 100
Share of results 1 005 1 280
Dividends received (382) (364)
Changes in equity (853) (631)
Modifi cation of the scope of consolidation (40) 31
At 31 December 7 796 8 936
of which L’Oréal 7 009 8 197
L’OréalThe Group holds 178 381 021 shares in L’Oréal, representing a 30.6% participation in its equity (considering own shares held by L’Oréal in relation to the employee stock option plans and the share buy-back programmes). At 31 December 2008, the market value of our shares amounts to CHF 16 537 million (2007: CHF 28 961 million).
Key fi nancial data of the main associatesThe following items are an aggregate of the Financial Statements of the main associates:
In millions of CHF 2008 2007
Total current assets 10 640 11 153
Total non-current assets 25 130 28 916
Total assets 35 770 40 069
Total current liabilities 11 791 10 210
Total non-current liabilities 5 714 6 751
Total liabilities 17 505 16 961
Total equity 18 265 23 108
Total sales 29 718 29 982
Total results 3 155 4 305

30 Consolidated Financial Statements of the Nestlé Group
9. Earnings per share
2008 2007 (a)
Basic earnings per share (in CHF) 4.87 2.78
Net profi t (in millions of CHF) 18 039 10 649
Weighted average number of shares outstanding 3 704 613 573 3 828 809 470
Fully diluted earnings per share (in CHF) 4.84 2.76
Net profi t, net of effects of dilutive potential ordinary shares (in millions of CHF) 18 044 10 678
Weighted average number of shares outstanding, net of effects of dilutive potential ordinary shares 3 725 018 002 3 867 876 260
Reconciliation of net profi t (in millions of CHF)
Net profi t used to calculate basic earnings per share 18 039 10 649
Elimination of interest expense, net of taxes, related to the Turbo Zero Equity-Link issued with warrants on
Nestlé S.A. shares 5 29
Net profi t used to calculate diluted earnings per share 18 044 10 678
Reconciliation of weighted average number of shares outstanding
Weighted average number of shares outstanding used to calculate basic earnings per share 3 704 613 573 3 828 809 470
Adjustment for assumed exercise of warrants, where dilutive 4 182 623 19 666 210
Adjustment for share-based payment schemes, where dilutive 16 221 806 19 400 580
Weighted average number of shares outstanding used to calculate diluted earnings per share 3 725 018 002 3 867 876 260
(a) 2007 comparatives have been restated following 1-for-10 share split effective on 30 June 2008.

31Consolidated Financial Statements of the Nestlé Group
10. Trade and other receivables
10.1 By type
In millions of CHF 2008 2007
Trade receivables 10 552 12 025
Other receivables 2 890 2 865
13 442 14 890
The fi ve major receivables represent 9% (2007: 10%) of trade and other receivables, none of them exceeding 3%.
10.2 Past due and impaired receivables
In millions of CHF 2008 2007
Not past due 11 060 12 242
Past due 1–30 days 1 363 1 605
Past due 31–60 days 370 388
Past due 61–90 days 242 173
Past due 91–120 days 144 147
Past due more than 120 days 707 841
Allowance for doubtful receivables (444) (506)
13 442 14 890
10.3 Allowance for doubtful receivables
In millions of CHF 2008 2007
At 1 January 506 453
Currency retranslations (73) 3
Allowance made in the period 151 58
Amounts used and reversal of unused amounts (141) (46)
Modifi cation of the scope of consolidation 1 38
At 31 December 444 506
Based on the historic trend and expected performance of the customers, the Group believes that the above allowance for doubtful receivables suffi ciently covers the risk of default.
32 Consolidated Financial Statements of the Nestlé Group
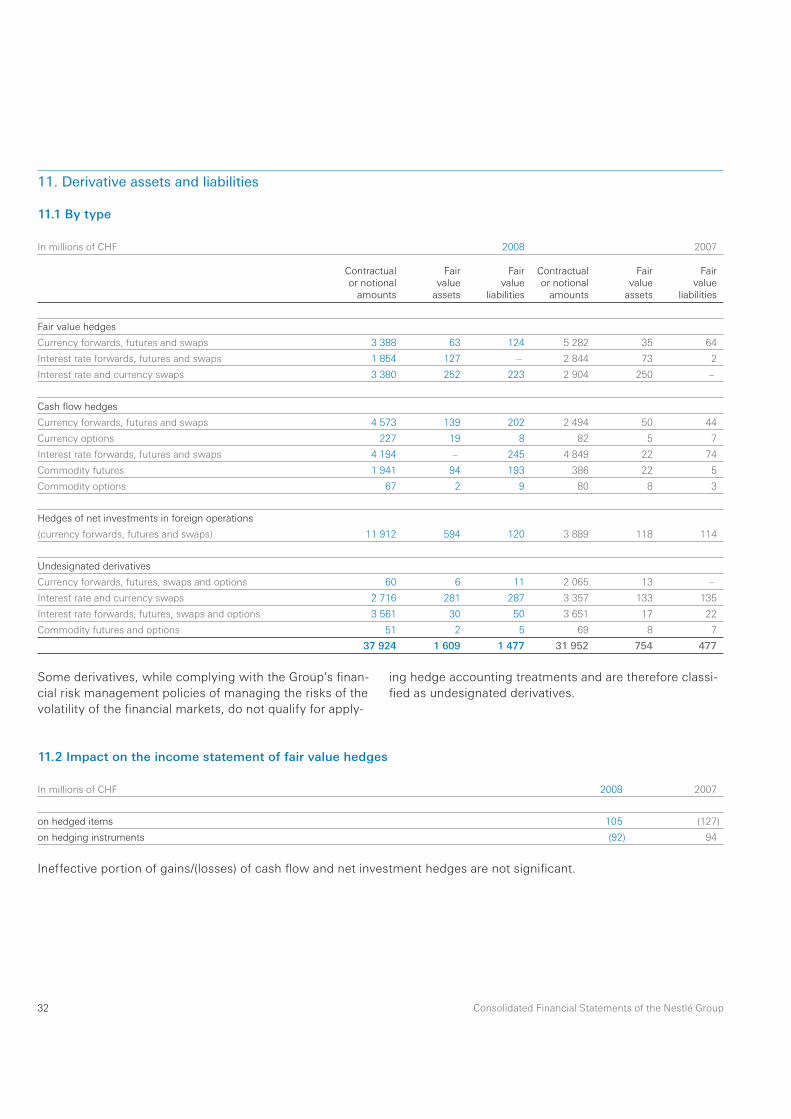
11. Derivative assets and liabilities
11.1 By type
In millions of CHF 2008 2007
Contractualor notional
amounts
Fairvalue
assets
Fairvalue
liabilities
Contractualor notional
amounts
Fairvalue
assets
Fairvalue
liabilities
Fair value hedges
Currency forwards, futures and swaps 3 388 63 124 5 282 35 64
Interest rate forwards, futures and swaps 1 854 127 – 2 844 73 2
Interest rate and currency swaps 3 380 252 223 2 904 250 –
Cash fl ow hedges
Currency forwards, futures and swaps 4 573 139 202 2 494 50 44
Currency options 227 19 8 82 5 7
Interest rate forwards, futures and swaps 4 194 – 245 4 849 22 74
Commodity futures 1 941 94 193 386 22 5
Commodity options 67 2 9 80 8 3
Hedges of net investments in foreign operations
(currency forwards, futures and swaps) 11 912 594 120 3 889 118 114
Undesignated derivatives
Currency forwards, futures, swaps and options 60 6 11 2 065 13 –
Interest rate and currency swaps 2 716 281 287 3 357 133 135
Interest rate forwards, futures, swaps and options 3 561 30 50 3 651 17 22
Commodity futures and options 51 2 5 69 8 7
37 924 1 609 1 477 31 952 754 477
11.2 Impact on the income statement of fair value hedges
In millions of CHF 2008 2007
on hedged items 105 (127)
on hedging instruments (92) 94
Ineffective portion of gains/(losses) of cash fl ow and net investment hedges are not signifi cant.
ing hedge accounting treatments and are therefore classi-fi ed as undesignated derivatives.
Some derivatives, while complying with the Group’s fi nan-cial risk management policies of managing the risks of the volatility of the fi nancial markets, do not qualify for apply-

33Consolidated Financial Statements of the Nestlé Group
13. Property, plant and equipment
In millions of CHF 2007
Land andbuildings
Machineryand
equipment
Tools,furniture
and otherequipment Vehicles Total
Gross value
At 1 January 13 245 25 455 7 446 931 47 077
Currency retranslations (156) (478) (171) (86) (891)
Capital expenditure 860 2 695 1 209 207 4 971
Disposals (258) (884) (492) (78) (1 712)
Reclassifi ed as held for sale (30) (38) (3) – (71)
Modifi cation of the scope of consolidation 90 51 3 (44) 100
At 31 December 13 751 26 801 7 992 930 49 474
Accumulated depreciation and impairments
At 1 January (5 251) (15 732) (5 363) (501) (26 847)
Currency retranslations 60 284 60 14 418
Depreciation (398) (1 307) (800) (115) (2 620)
Impairments (26) (148) (50) (1) (225)
Disposals 165 758 468 67 1 458
Reclassifi ed as held for sale 22 30 3 – 55
Modifi cation of the scope of consolidation 80 228 12 32 352
At 31 December (5 348) (15 887) (5 670) (504) (27 409)
Net at 31 December 8 403 10 914 2 322 426 22 065
12. Inventories
In millions of CHF 2008 2007
Raw materials, work in progress and sundry supplies 3 708 3 590
Finished goods 5 901 5 957
Allowance for write-down at net realisable value (267) (275)
9 342 9 272
Inventories amounting to CHF 143 million (2007: CHF 153 million) are pledged as security for fi nancial liabilities.
At 31 December 2007, property, plant and equipment include CHF 1178 million of assets under construction. Net property, plant and equipment held under fi nance leases amount to CHF 354 million. Net property, plant and equip-
ment of CHF 117 million are pledged as security for fi nan-cial liabilities. Fire risks, reasonably estimated, are insured in accordance with domestic requirements.

34 Consolidated Financial Statements of the Nestlé Group
In millions of CHF 2008
Land andbuildings
Machineryand
equipment
Tools,furniture
and otherequipment Vehicles Total
Gross value
At 1 January 13 751 26 801 7 992 930 49 474
Currency retranslations (1 616) (3 678) (1 094) (128) (6 516)
Capital expenditure 1 069 2 615 1 060 125 4 869
Disposals (92) (733) (387) (60) (1 272)
Reclassifi ed as held for sale (33) (124) (29) – (186)
Modifi cation of the scope of consolidation 26 (170) (32) (2) (178)
At 31 December 13 105 24 711 7 510 865 46 191
Accumulated depreciation and impairments
At 1 January (5 348) (15 887) (5 670) (504) (27 409)
Currency retranslations 603 2 225 806 77 3 711
Depreciation (362) (1 349) (805) (109) (2 625)
Impairments (79) (131) (38) – (248)
Disposals 92 553 371 60 1 076
Reclassifi ed as held for sale 33 120 25 – 178
Modifi cation of the scope of consolidation 49 148 23 3 223
At 31 December (5 012) (14 321) (5 288) (473) (25 094)
Net at 31 December 8 093 10 390 2 222 392 21 097
At 31 December 2008, property, plant and equipment include CHF 781 million of assets under construction. Net property, plant and equipment held under fi nance leases amount to CHF 236 million. Net property, plant and equip-ment of CHF 109 million are pledged as security for fi nan-cial liabilities. Fire risks, reasonably estimated, are insured in accordance with domestic requirements.
ImpairmentImpairment of property, plant and equipment arises mainly from the plans to optimise industrial manufacturing capac-ities by closing or selling ineffi cient production facilities.
Commitments for expenditure At 31 December 2008, the Group was committed to expenditure amounting to CHF 449 million (2007: CHF 442 million).

35Consolidated Financial Statements of the Nestlé Group
14.1 Impairment charge during the period
Nestlé Waters Home and Offi ce Delivery business in EuropeGoodwill related to the 2003 acquisition of Powwow has been allocated for the impairment test to the Cash Gene-rating Unit (CGU) defi ned as the Nestlé Waters Home and Offi ce Delivery (HOD) business in Europe. As at 31 December 2008, the carrying amounts of all goodwill items allocated to this CGU and expressed in various European currencies represent an equivalent of CHF 836 million before 2008 impairment (2007: CHF 1119 million).
According to IFRS requirements an annual impairment test was conducted in the second half of the year. Following further deterioration of the business in various countries since the last impairment test and the foreseen disposal of the Italian and UK HOD operations, the present value of future cash fl ows was revised downwards.
As the recoverable amount of the CGU was lower than its carrying amount, an impairment of goodwill amounting to CHF 442 million has been recognised in 2008 (2007: CHF 210 million).
The recoverable amount of the CGU has been deter-mined based upon a value-in-use calculation. Defl ated cash fl ow projections covering the next 50 years, dis-counted at a weighted average rate of 6.2%, were used in this calculation. The cash fl ows for the fi rst fi ve years were based upon fi nancial plans approved by Group Management; years six to ten were based upon Group Management’s best expectations. Cash fl ows were assumed to be fl at for years eleven to 50. Cash fl ows have been adjusted to refl ect the specifi c business risks.
14. Goodwill
In millions of CHF Notes 2008 2007
Gross value (a)
At 1 January 35 142 30 007
Currency retranslations (2 784) (1 620)
Goodwill from acquisitions 23 515 6 903
Disposals (127) (148)
At 31 December 32 746 35 142
Accumulated impairments
At 1 January (1 719) (1 494)
Currency retranslations 123 9
Impairments (561) (251)
Disposals 48 17
At 31 December (2 109) (1 719)
Net at 31 December 30 637 33 423
(a) In accordance with IFRS 3 – Business Combinations, gross value includes prior years’ accumulated amortisation.
36 Consolidated Financial Statements of the Nestlé Group
Main assumptions, based on past experiences and cur-rent initiatives, were the following:
– sales: annual growth between 1.5 and 8.3% for the fi rst three years, and between 2.2 and 2.3% in the six years afterwards;
– EBIT margin evolution: consistent with sales growth and enhanced cost management and effi ciency, with a higher growth during the fi rst three years and then steadily improving ten basis points per year over the following years.
14.2 Yearly impairment testsGoodwill impairment reviews have been conducted for more than 200 goodwill items allocated to some 50 Cash Generating Units (CGUs). There are no signifi cant carrying values of goodwill that are allocated across multiple CGUs.
Detailed results of the impairment tests are presented below for the three signifi cant goodwill items, representing more than 50% of the net book value at 31 December 2008. For the purpose of the tests, they have been allocated to the following CGUs: PetCare, Infant Nutrition and Ice Cream USA.
PetCareGoodwill related to the 2001 acquisition of Ralston Purina has been allocated for the impairment test to the CGU of the product category PetCare on a worldwide basis. As at 31 December 2008, the carrying amounts, expressed in various currencies, represent an equivalent of CHF 9888 mil lion (2007: CHF 10 618 million) for the good-will and CHF 29 million (2007: CHF 29 million) for the intan-gible assets with indefi nite useful life.
The recoverable amount of the CGU is higher than its carrying amount. The recoverable amount has been deter-mined based upon a value-in-use calculation. Defl ated cash fl ow projections covering the next 50 years, discounted at a weighted average rate of 6.7%, were used in this cal-culation. The cash fl ows for the fi rst fi ve years were based upon fi nancial plans approved by Group Management; years six to ten were based upon Group Management’s best expectations, which are consistent with the Group’s
approved strategy for this period. Cash fl ows were assumed to be fl at for years eleven to 50, although Group Management expects continuing growth. Cash fl ows have been adjusted to refl ect the specifi c business risks.
Main assumptions, based on past experiences and cur-rent initiatives, were the following:
– sales: annual growth between 3.9 and 7.9% for North America and between 3 and 4.5% for Europe over the fi rst ten-year period;
– EBIT margin evolution: steadily improving margin over the period, in a range of 10–30 basis points per year for North America and 10–60 basis points per year for Europe, consistent with sales growth and portfolio rationalisation.
Assumptions used in the calculation are consistent with the expected long-term average growth rate of the PetCare business in the regions concerned.
The key sensitivity for the impairment test is the growth in sales and EBIT margin. Assuming no sales growth and no improvement in EBIT margin over the entire period would not result in the carrying amount exceeding the recoverable amount.
An increase of 100 basis points in the discount rate assumption would not change the conclusions of the impairment test.
Infant NutritionGoodwill and intangible assets with indefi nite useful life related to the 2007 acquisition of Gerber have been allocated for the impairment test to the CGU of the Infant Nutrition businesses on a worldwide basis. As at 31 December 2008, the carrying amounts, expressed in various currencies, represent an equivalent of CHF 3963 million (2007: CHF 4227 million) for the goodwill and CHF 1405 million (2007: CHF 1497 million) for the intangible assets with indefi nite useful life.
The recoverable amount of the CGU is higher than its carrying amount. The recoverable amount has been deter-mined based upon a value-in-use calculation. Defl ated cash fl ow projections covering the next 50 years, discounted at a weighted average rate of 8%, were used in this calcu-lation. The cash fl ows for the fi rst fi ve years were based
37Consolidated Financial Statements of the Nestlé Group
upon fi nancial plans approved by Group Management; years six to ten were based upon Group Management’s best expectations, which are consistent with the Group’s approved strategy for this period. Cash fl ows were assumed to be fl at after, although Group Management expects con-tinuing growth. Cash fl ows have been adjusted to refl ect the specifi c business risks.
Main assumptions were the following:– sales: annual growth between 2 and 5% for North
America and between 5.2 and 5.7% for the rest of the world over the fi rst fi ve-year period;
– EBIT margin evolution: steadily improving margin over the period, in a range of 10–50 basis points per year for North America and in a range of 60–90 basis points per year for the rest of the world.
The key sensitivity for the impairment test is the growth in sales and EBIT margin. Assuming no sales growth and no improvement in EBIT margin over the entire period would not result in the carrying amount exceeding the recoverable amount.
An increase of 100 basis points in the discount rate assumption would not change the conclusions of the impairment test.
Ice Cream USAGoodwill and intangible assets with indefi nite useful life related to the Group’s Ice cream businesses in the USA (Nestlé Ice Cream Company and Dreyer’s) has been allo-cated for the impairment test to the Ice Cream USA CGU. As at 31 December 2008, the carrying amounts, expressed in USD, represent an equivalent of CHF 3096 million (2007: CHF 3301 million) for the goodwill and CHF 76 million (2007: CHF 81 million) for the intangible assets with indefi -nite useful life.
The recoverable amount of the CGU is higher than its carrying amount. The recoverable amount has been deter-mined based upon a value-in-use calculation. Defl ated cash fl ow projections covering the next 50 years, dis-counted at 6.4%, were used in this calculation. The cash fl ows for the fi rst fi ve years were based upon fi nancial plans approved by Group Management; years six to ten were based upon Group Management’s best expectations,
which are consistent with the Group’s approved strategy for this period. Cash fl ows were assumed to be fl at for years eleven to 50, although Group Management expects continuing growth. Cash fl ows have been adjusted to refl ect the specifi c business risks.
Main assumptions, based on past experiences and cur-rent initiatives, were the following:
– sales: annual growth between 2 and 5% over the fi rst ten-year period;
– EBIT margin evolution: steadily improving margin over the period, in a range of 70–270 basis points per year, which is consistent with strong sales growth and enhanced cost management and effi -ciency.
The key sensitivity for the impairment test is the growth in sales and EBIT margin. Limiting annual growth to only 4% until 2017 and 0% thereafter would not result in the carrying amount exceeding the recoverable amount. Reaching 80% of the expectations in terms of EBIT evolu-tion would not result in the carrying amount exceeding the recoverable amount.
An increase of 100 basis points in the discount rate assumption would not change the conclusions of the impairment test.

38 Consolidated Financial Statements of the Nestlé Group
15. Intangible assets
In millions of CHF 2007
Brands andintellectual
propertyrights
Operatingrights and
others
Managementinformation
systems Total
of whichinternally
generated
Gross value
At 1 January 1 550 753 3 533 5 836 3 067
of which indefi nite useful life 1 167 – – 1 167 –
Currency retranslations (153) (38) (24) (215) (8)
Expenditure 11 61 547 619 510
Disposals (8) (18) (58) (84) (3)
Modifi cation of the scope of consolidation 3 129 478 (6) 3 601 (6)
At 31 December 4 529 1 236 3 992 9 757 3 560
of which indefi nite useful life 4 133 – – 4 133 –
Accumulated depreciation and impairments
At 1 January (224) (521) (1 318) (2 063) (914)
Currency retranslations – 29 12 41 –
Depreciation (16) (90) (485) (591) (459)
Impairments (2) (2) (2) (6) –
Disposals 8 14 56 78 –
Modifi cation of the scope of consolidation – 1 – 1 –
At 31 December (234) (569) (1 737) (2 540) (1 373)
Net at 31 December 4 295 667 2 255 7 217 2 187

39Consolidated Financial Statements of the Nestlé Group
In millions of CHF 2008
Brands andintellectual
propertyrights
Operatingrights and
others
Managementinformation
systems Total
of whichinternally
generated
Gross value
At 1 January 4 529 1 236 3 992 9 757 3 560
of which indefi nite useful life 4 133 – – 4 133 –
Currency retranslations (227) (65) (502) (794) (463)
Expenditure 9 140 436 585 362
Disposals – (10) (49) (59) (18)
Reclassifi ed as held for sale – – (5) (5) (5)
Modifi cation of the scope of consolidation 184 58 (5) 237 (5)
At 31 December 4 495 1 359 3 867 9 721 3 431
of which indefi nite useful life (a) 3 948 – – 3 948 –
Accumulated depreciation and impairments
At 1 January (234) (569) (1 737) (2 540) (1 373)
Currency retranslations 10 25 230 265 198
Depreciation (24) (99) (501) (624) (476)
Impairments – (1) – (1) –
Disposals – 8 36 44 7
Reclassifi ed as held for sale – – 1 1 1
Modifi cation of the scope of consolidation – – 1 1 –
At 31 December (248) (636) (1 970) (2 854) (1 643)
Net at 31 December 4 247 723 1 897 6 867 1 788
(a) Yearly impairment tests are performed together with goodwill items (refer to Note 14).
Internally generated intangible assets consist mainly of management information systems.
Commitments for expenditureAt 31 December 2008, the Group was committed to expenditure amounting to CHF 54 million (2007: none).
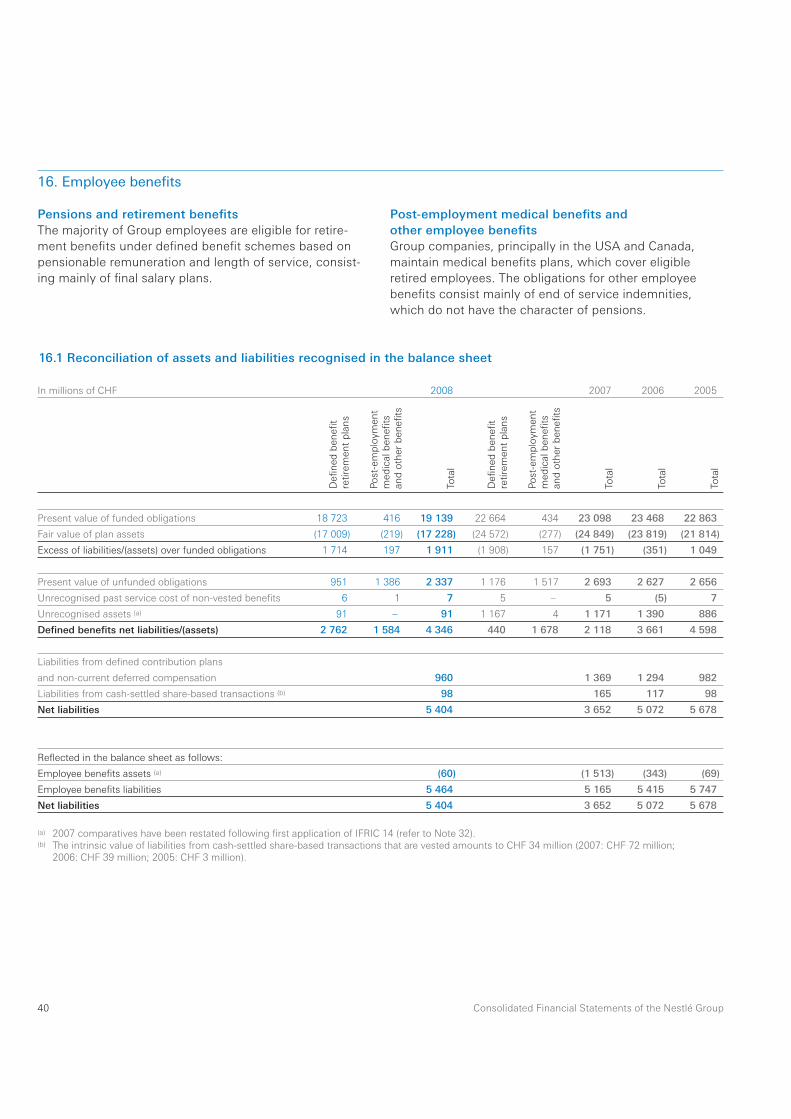
40 Consolidated Financial Statements of the Nestlé Group
16.1 Reconciliation of assets and liabilities recognised in the balance sheet
16. Employee benefi ts
In millions of CHF 2008 2007 2006 2005
Defi
ned
ben
efi t
retir
emen
t pl
ans
Post
-em
ploy
men
t m
edic
al b
enefi
ts
and
othe
r be
nefi t
s
Tota
l
Defi
ned
ben
efi t
retir
emen
t pl
ans
Post
-em
ploy
men
t m
edic
al b
enefi
ts
and
othe
r be
nefi t
s
Tota
l
Tota
l
Tota
l
Present value of funded obligations 18 723 416 19 139 22 664 434 23 098 23 468 22 863
Fair value of plan assets (17 009) (219) (17 228) (24 572) (277) (24 849) (23 819) (21 814)
Excess of liabilities/(assets) over funded obligations 1 714 197 1 911 (1 908) 157 (1 751) (351) 1 049
Present value of unfunded obligations 951 1 386 2 337 1 176 1 517 2 693 2 627 2 656
Unrecognised past service cost of non-vested benefi ts 6 1 7 5 – 5 (5) 7
Unrecognised assets (a) 91 – 91 1 167 4 1 171 1 390 886
Defi ned benefi ts net liabilities/(assets) 2 762 1 584 4 346 440 1 678 2 118 3 661 4 598
Liabilities from defi ned contribution plans
and non-current deferred compensation 960 1 369 1 294 982
Liabilities from cash-settled share-based transactions (b) 98 165 117 98
Net liabilities 5 404 3 652 5 072 5 678
Refl ected in the balance sheet as follows:
Employee benefi ts assets (a) (60) (1 513) (343) (69)
Employee benefi ts liabilities 5 464 5 165 5 415 5 747
Net liabilities 5 404 3 652 5 072 5 678
(a) 2007 comparatives have been restated following fi rst application of IFRIC 14 (refer to Note 32).(b) The intrinsic value of liabilities from cash-settled share-based transactions that are vested amounts to CHF 34 million (2007: CHF 72 million;
2006: CHF 39 million; 2005: CHF 3 million).
Pensions and retirement benefi tsThe majority of Group employees are eligible for retire-ment benefi ts under defi ned benefi t schemes based on pensionable remuneration and length of service, consist-ing mainly of fi nal salary plans.
Post-employment medical benefi ts and other employee benefi tsGroup companies, principally in the USA and Canada, maintain medical benefi ts plans, which cover eligible retired employees. The obligations for other employee benefi ts consist mainly of end of service indemnities, which do not have the character of pensions.

41Consolidated Financial Statements of the Nestlé Group
The major categories of plan assets as a percentage of total plan assets are as follows:
At 31 December 2008 2007
Equities 38% 46%
Bonds 27% 27%
Real estate property 7% 7%
Alternative investments 23% 16%
Cash/Deposits 5% 4%
The plan assets include property occupied by affi liated companies with a fair value of CHF 19 million (2007: CHF 31 million) and assets loaned to affi liated companies with a fair value of CHF 33 million (2007: CHF 24 million).
The actual return on plan assets is negative in 2008 by CHF 4194 million (2007: positive by CHF 1850 million).
The Group expects to contribute CHF 690 million to its funded defi ned benefi t schemes in 2009.
16.2 Movement in fair value of defi ned benefi t plan assets
In millions of CHF 2008 2007
Defi
ned
ben
efi t
retir
emen
t pl
ans
Post
-em
ploy
men
t m
edic
al b
enefi
ts
and
othe
r be
nefi t
s
Tota
l
Defi
ned
ben
efi t
retir
emen
t pl
ans
Post
-em
ploy
men
t m
edic
al b
enefi
ts
and
othe
r be
nefi t
s
Tota
l
At 1 January (24 572) (277) (24 849) (23 560) (259) (23 819)
Currency retranslations 2 912 26 2 938 615 9 624
Expected return on plan assets (1 507) (18) (1 525) (1 412) (17) (1 429)
Employees’ contributions (115) – (115) (110) – (110)
Employer contributions (518) (32) (550) (518) (34) (552)
Actuarial (gains)/losses 5 658 61 5 719 (423) 2 (421)
Benefi ts paid on funded defi ned benefi t schemes 1 181 20 1 201 1 188 24 1 212
Modifi cation of the scope of consolidation (16) – (16) (336) – (336)
Transfer from/(to) defi ned contribution plans (32) 1 (31) (16) (2) (18)
At 31 December (17 009) (219) (17 228) (24 572) (277) (24 849)

42 Consolidated Financial Statements of the Nestlé Group
16.3 Movement in the present value of defi ned benefi t obligations
In millions of CHF 2008 2007
Defi
ned
ben
efi t
retir
emen
t pl
ans
Post
-em
ploy
men
t m
edic
al b
enefi
ts
and
othe
r be
nefi t
s
Tota
l
Defi
ned
ben
efi t
retir
emen
t pl
ans
Post
-em
ploy
men
t m
edic
al b
enefi
ts
and
othe
r be
nefi t
s
Tota
l
At 1 January 23 840 1 951 25 791 24 181 1 914 26 095
of which funded defi ned benefi t schemes 22 664 434 23 098 23 020 448 23 468
of which unfunded defi ned benefi t schemes 1 176 1 517 2 693 1 161 1 466 2 627
Currency retranslations (3 132) (185) (3 317) (608) (104) (712)
Current service cost 621 77 698 677 76 753
Interest cost 1 140 108 1 248 1 132 110 1 242
Early retirements, curtailments, settlements (5) (1) (6) 8 (4) 4
Past service cost of vested benefi ts 8 (3) 5 11 1 12
Past service cost of non-vested benefi ts – – – (9) – (9)
Actuarial (gains)/losses (1 576) 10 (1 566) (616) (42) (658)
Benefi ts paid on funded defi ned benefi t schemes (1 181) (20) (1 201) (1 188) (24) (1 212)
Benefi ts paid on unfunded defi ned benefi t schemes (69) (98) (167) (89) (107) (196)
Modifi cation of the scope of consolidation (5) 2 (3) 332 174 506
Transfer from/(to) defi ned contribution plans 33 (39) (6) 9 (43) (34)
At 31 December 19 674 1 802 21 476 23 840 1 951 25 791
of which funded defi ned benefi t schemes 18 723 416 19 139 22 664 434 23 098
of which unfunded defi ned benefi t schemes 951 1 386 2 337 1 176 1 517 2 693
The overall investment policy and strategy for the Group’s funded defi ned benefi t schemes is guided by the objective of achieving an investment return which, together with the contributions paid, is suffi cient to maintain reasonable control over the various funding risks of the plans. The investment advisors appointed by plan trustees are responsible for determining the mix of asset types and tar-get allocations which are reviewed by the plan trustees on an ongoing basis. Actual asset allocation is determined by
a variety of current economic and market conditions and in consideration of specifi c asset class risk.
The expected long-term rates of return on plan assets are based on long-term expected infl ation, interest rates, risk premiums and targeted asset class allocations. These estimates take into consideration historical asset class returns and are determined together with the plans’ investment and actuarial advisors.

43Consolidated Financial Statements of the Nestlé Group
16.4 Actuarial gains/(losses) of defi ned benefi t schemes recognised in the Statement of recognised income and expense
In millions of CHF 2008 2007 2006 2005
Defi
ned
ben
efi t
retir
emen
t pl
ans
Post
-em
ploy
men
t m
edic
al b
enefi
ts
and
othe
r be
nefi t
s
Tota
l
Defi
ned
ben
efi t
retir
emen
t pl
ans
Post
-em
ploy
men
t m
edic
al b
enefi
ts
and
othe
r be
nefi t
s
Tota
l
Tota
l
Tota
l
Experience adjustments on plan assets (5 658) (61) (5 719) 423 (2) 421 1 027 1 522
Experience adjustments on plan liabilities 82 13 95 (291) (6) (297) 21 16
Change of assumptions on plan liabilities 1 494 (23) 1 471 907 48 955 (65) (1 133)
Transfer from/(to) unrecognised assets (a) 1 010 4 1 014 (802) (4) (806) (521) (427)
Actuarial gains/(losses) on defi ned benefi t schemes (3 072) (67) (3 139) 237 36 273 462 (22)
Transfer to unrecognised assets represents excess of return of overfunded defi ned benefi t plans that cannot be recognised as assets as well as contributions paid to such plans in excess of their annual cost.
At 31 December 2008, the net cumulative actuarial losses on defi ned benefi t schemes recognised in equity amount to CHF 4261 million (2007: CHF 1787 (a) million; 2006: CHF 3222 million; 2005: CHF 3689 million).
(a) 2007 comparatives have been restated following fi rst application of IFRIC 14 (refer to Note 32).

44 Consolidated Financial Statements of the Nestlé Group
16.6 Mortality tables and life expectancies for the major schemes
Country Mortality table
Life expectancy at age 65for a male member
currently aged 65 (in years)
Life expectancy at age 65for a female member
currently aged 65 (in years)
At 31 December 2008 2007 2008 2007
Switzerland LPP 2000 18.1 18.1 21.5 21.4
United Kingdom PNA00, medium cohort 20.7 20.6 23.0 22.9
United States RP–2000 18.9 18.8 20.8 20.8
Germany Heubeck Richttafeln 1998 21.3 19.6 22.8 22.8
Netherlands AG Prognosetafel 2005–2050 18.9 18.9 21.0 21.0
Life expectancy is refl ected in the defi ned benefi t obligations by using up-to-date mortality tables of the country in which the plan is located. When those tables no longer refl ect recent experience, they are adjusted by appropriate loadings.
16.5 Expenses recognised in the income statement
In millions of CHF 2008 2007 D
efi n
ed b
enefi
tre
tirem
ent
plan
s
Post
-em
ploy
men
t m
edic
al b
enefi
ts
and
othe
r be
nefi t
s
Tota
l
Defi
ned
ben
efi t
retir
emen
t pl
ans
Post
-em
ploy
men
t m
edic
al b
enefi
ts
and
othe
r be
nefi t
s
Tota
l
Current service cost 621 77 698 677 76 753
Employee contributions (115) – (115) (110) – (110)
Interest cost 1 140 108 1 248 1 132 110 1 242
Expected return on plan assets (1 507) (18) (1 525) (1 412) (17) (1 429)
Early retirements, curtailments, settlements (5) (1) (6) 8 (4) 4
Past service cost of vested benefi ts 8 (3) 5 11 1 12
Past service cost of non-vested benefi ts – – – – 2 2
Total defi ned benefi t expenses 142 163 305 306 168 474
Total defi ned contribution expenses 356 392
The expenses for defi ned benefi t and defi ned contribution plans are allocated to the appropriate headings of expenses by function.

45Consolidated Financial Statements of the Nestlé Group
16.7 Principal fi nancial actuarial assumptionsThe principal fi nancial actuarial assumptions are presented by geographic area. Each item is a weighted average in rela-tion to the relevant underlying component.
At 31 December 2008 2007
Discount rates
Europe 5.0% 4.7%
Americas 6.3% 6.3%
Asia, Oceania and Africa 4.6% 5.5%
Expected long-term rates of return on plan assets
Europe 5.7% 6.9%
Americas 8.6% 8.3%
Asia, Oceania and Africa 6.3% 6.8%
Expected rates of salary increases
Europe 3.2% 3.3%
Americas 3.0% 2.9%
Asia, Oceania and Africa 3.0% 3.8%
Expected rates of pension adjustments
Europe 1.9% 2.2%
Americas 0.2% 0.2%
Asia, Oceania and Africa 1.6% 2.0%
Medical cost trend rates
Americas 6.4% 6.3%
16.8 Sensitivity analysis on medical cost trend ratesA one percentage point increase in assumed medical cost trend rates would increase the defi ned benefi t obligations by CHF 92 million and increase the aggregate of current service cost and interest cost by CHF 11 million.
A one percentage point decrease in assumed medical cost trend rates would decrease the defi ned benefi t obli-gations by CHF 78 million and decrease the aggregate of current service cost and interest cost by CHF 9 million.

46 Consolidated Financial Statements of the Nestlé Group
17. Share-based paymentThe following share-based payment costs are allocated to the appropriate headings of expenses by function in the income statement:
In millions of CHF 2008 2007
Equity-settled share-based payment costs 250 246
Cash-settled share-based payment costs (14) 118
Total share-based payment costs 236 364
2008 2007 (a)
Number
of options Number
of options
Outstanding at 1 January 27 374 110 41 532 280
of which vested and exercisable 24 579 360 22 775 260
New rights 979 000 1 155 000
Rights exercised (b) (5 740 284) (15 313 170)
Rights forfeited (285 930) –
Outstanding at 31 December 22 326 896 27 374 110
of which vested and exercisable at 31 December 19 408 146 24 579 360
additional options vesting in 2009 964 750
(a) 2007 comparatives and earlier grants have been restated following 1-for-10 share split effective on 30 June 2008.(b) Average exercise price: CHF 33.77 (2007: CHF 33.29); average share price at exercise date: CHF 48.16 (2007: CHF 49.07)
The following share-based payment schemes are currently available to members of the Executive Board and Senior Management:
17.1 Management Stock Option Plan (MSOP)Members of Group Management are entitled to participate each year in a share option plan without payment. The benefi ts consist of the right to buy Nestlé S.A. shares (accounted for as equity-settled share-based payment transactions) at a predetermined fi xed price. From 2005 onwards, the grant has been limited to members of the Executive Board.
This plan has a rolling seven-year duration. Vesting is subject to three years service conditions. The rights are exercised throughout the year in accordance with the rules of the plan.

47Consolidated Financial Statements of the Nestlé Group
Main features of the MSOP are the following:
2008 2007 (a)
Grant date Expiring on
Exerciseprice
in CHF (a) Expectedvolatility
Risk-freeinterest rate
Expecteddividend
yield
Fair valueat grant
in CHF (a)
Numberof options
outstanding
Numberof options
outstanding
01.03.2001 29.02.2008 34.32 – 1 453 090
01.03.2002 28.02.2009 36.73 3 187 589 5 129 230
01.02.2003 31.01.2010 27.86 27.16% 1.78% 2.25% 5.74 5 249 972 6 044 190
01.10.2003 30.09.2010 30.86 20.58% 2.11% 2.30% 4.93 107 750 164 000
01.02.2004 31.01.2011 32.91 19.41% 2.05% 2.11% 5.05 10 129 035 11 542 350
01.10.2004 30.09.2011 28.94 20.83% 2.09% 2.50% 4.52 125 800 176 500
01.02.2005 31.01.2012 30.92 20.13% 1.84% 2.29% 4.39 608 000 665 000
01.02.2006 31.01.2013 37.95 19.00% 2.20% 2.11% 5.29 964 750 1 044 750
01.02.2007 31.01.2014 44.50 16.78% 2.72% 2.54% 6.76 1 055 000 1 155 000
01.02.2008 31.01.2015 47.38 23.84% 2.65% 2.65% 7.81 899 000 –
22 326 896 27 374 110
(a) 2007 comparatives and earlier grants have been restated following 1-for-10 share split effective on 30 June 2008.
The exercise price corresponds to the weighted average share price of the last ten trading days preceding the grant date. Group Management has assumed that, on average, the participants exercise their options after fi ve years. The
expected volatility is based on the historical volatility, adjusted for any expected changes to future volatility due to publicly available information.
2008 2007 (a)
Numberof RSU
Numberof RSU
Outstanding at 1 January 10 771 260 7 648 860
of which vested 41 470 52 000
New RSU 3 182 660 3 739 200
RSU settled (b) (4 279 570) (519 850)
RSU forfeited (230 400) (96 950)
Outstanding at 31 December 9 443 950 10 771 260
of which vested at 31 December – 41 470
of which considered cash-settled 411 960 798 130
(a) 2007 comparatives and earlier grants have been restated following 1-for-10 share split effective on 30 June 2008.(b) Average price at vesting date: CHF 49.72 (2007: CHF 47.86)
17.2 Restricted Stock Unit Plan (RSUP)As from 1 March 2005, members of Group Management are also awarded Restricted Stock Units (RSU) that each gives the right to one Nestlé S.A. share. Vesting is subject to three years service conditions. Upon vesting, the Group
either delivers Nestlé S.A. shares (accounted for as equity-settled share-based payment transactions) or pays the equivalent amount in cash (accounted for as cash-settled share-based payment transactions).

48 Consolidated Financial Statements of the Nestlé Group
17.3 US plansThe US affi liates sponsor Share Appreciation Rights (SAR) plans. Those plans give right, upon exercise, to the payment in cash of the difference between the market price of a Nestlé S.A. share and the exercise price. They are
accounted for as cash-settled share-based payment trans-actions.
From 2006 onwards, the US affi liates sponsor a sepa-rate Restricted Stock Unit Plan, that will be settled in cash.
17.4 Alcon Incentive PlanUnder the 2002 Alcon Incentive Plan, the Board of Directors of Alcon may award to offi cers, directors and key employees share-based compensation, including stock options, share-settled stock appreciation rights (SSARs), restricted shares, restricted share units (RSUs), performance share units and certain cash-settled liability awards.
The total number of Alcon shares that may be issued with respect to such awards shall not exceed the lessor of 30 million Alcon shares or 10% of Alcon’s issued and outstanding shares. Alcon intends to satisfy all equity
awards granted prior to 31 December 2003 and after 31 December 2007 with the issuance of new shares from conditional capital authorised for the 2002 Alcon Incentive Plan. Shares are issued at the grant price of stock options upon exercise.
The Board of Directors of Alcon has authorised the acquisition on the open market of Alcon shares to, among other things, satisfy the exercise of stock options and SSARs and the issuance of restricted shares and RSUs granted under the 2002 Alcon Incentive Plan.
Main features of the RSUP are the following:
2008 2007 (a)
Grant date Restricted until Risk-free
interest rate
Expecteddividend
yield
Fair valueat grant
in CHF (a)
Numberof RSU
outstanding
Numberof RSU
outstanding
01.03.2005 29.02.2008 1.59% 2.45% 31.80 – 3 625 320
01.10.2005 30.09.2008 1.50% 2.15% 37.16 – 58 270
01.02.2006 31.01.2009 2.10% 2.13% 37.47 3 026 200 3 395 640
01.10.2006 30.09.2009 2.40% 2.15% 43.93 44 900 46 400
01.02.2007 31.01.2010 2.71% 2.15% 46.39 3 259 330 3 590 950
01.10.2007 30.09.2010 3.02% 2.00% 53.90 49 180 54 680
01.02.2008 31.01.2011 2.65% 2.65% 48.30 3 019 330 –
01.10.2008 30.09.2011 2.80% 2.80% 48.20 45 010 –
9 443 950 10 771 260
(a) 2007 comparatives and earlier grants have been restated following 1-for-10 share split effective on 30 June 2008.
The fair value corresponds to the market price at grant, adjusted for the restricted period of three years.

49Consolidated Financial Statements of the Nestlé Group
Alcon stock options and SSARs
2008 2007 2008 2007
Number
of options Number
of options Number
of SSARs Number
of SSARs
Outstanding at 1 January 8 223 509 12 154 336 2 697 311 1 326 945
of which vested and exercisable 4 977 306 5 433 353 3 852 407
New rights 168 504 187 551 1 025 030 1 477 132
Rights exercised (a) (2 041 871) (3 977 693) – (947)
Rights forfeited (14 368) (140 685) (93 343) (105 819)
Rights expired (5 191) – – –
Outstanding at 31 December 6 330 583 8 223 509 3 628 998 2 697 311
of which vested and exercisable at 31 December 5 818 693 4 977 306 10 113 3 852
additional awards scheduled to vest in 2009 159 158 1 232 532
(a) Weighted average options exercise price: USD 61.32 (2007: USD 47.71); weighted average share price at options exercise date: USD 154.82 (2007: USD 134.60). Weighted average SSARs exercise price: none (2007: USD 122.90); weighted average share price at SSARs exercise date: none (2007: USD 138.01)
The rights are exercised throughout the year in accordance with the rules of the plan.
Main features of Alcon stock options are the following:
2008 2007
Grant date Expiring on
Exerciseprice
in USD
Remaininglife
in years Expectedvolatility
Risk-freeinterest rate
Dividendyield
Fair valueat grantin USD
Numberof options
outstanding
Numberof options
outstanding
21.03.2002 21.03.2012 33.00 3.22 33.00% 4.75% 1.00% 10.03 483 134 743 329
18.02.2003 18.02.2013 36.39 4.13 33.00% 2.92% 1.00% 10.06 1 251 633 1 623 011
Various 2003 Various 2013 49.63 4.52 33.00% 3.01% 1.00% 13.79 13 000 20 600
11.02.2004 11.02.2014 63.32 5.11 33.00% 2.99% 1.00% 19.59 1 811 022 2 334 890
Various 2004 Various 2014 77.07 5.69 33.00% 3.23% 1.00% 22.84 58 000 58 000
09.02.2005 09.02.2015 79.00 6.11 33.00% 3.60% 1.00% 25.48 2 187 067 3 059 413
Various 2005 Various 2015 90.84 6.26 33.00% 3.80% 1.00% 30.26 33 922 46 000
08.02.2006 08.02.2016 122.90 7.10 33.00% 4.56% 1.00% 42.54 162 483 156 459
12.02.2007 12.02.2017 130.56 8.10 31.00% 4.80% 1.50% 40.37 189 942 181 807
11.02.2008 11.02.2018 147.54 9.11 29.50% 2.67% 1.50% 38.39 140 255 –
03.04.2008 03.04.2018 144.87 9.25 29.50% 2.75% 1.50% 37.90 125 –
6 330 583 8 223 509
Stock option grant prices are determined by the Board of Directors of Alcon and shall not be lower than the prevailing stock exchange price on the date of grant.

50 Consolidated Financial Statements of the Nestlé Group
Main features of Alcon SSARs are the following:
2008 2007
Grant date Expiring on
Exerciseprice
in USD
Remaininglife
in years Expectedvolatility
Risk-freeinterest rate
Dividendyield
Fair valueat grantin USD
Numberof SSARs
outstanding
Numberof SSARs
outstanding
08.02.2006 08.02.2016 122.90 7.10 33.00% 4.56% 1.00% 41.51 1 216 524 1 261 036
Various 2006 Various 2016 100.42 7.40 33.00% 5.03% 1.00% 32.67 15 050 15 050
12.02.2007 12.02.2017 130.58 8.12 31.00% 4.80% 1.50% 40.37 1 346 973 1 399 823
Various 2007 Various 2017 135.08 8.52 31.00% 4.41% 1.50% 40.81 21 402 21 402
11.02.2008 11.02.2018 147.54 9.11 29.50% 2.67% 1.50% 38.39 1 006 283 –
Various 2008 Various 2018 148.17 9.30 29.50% 2.63% 1.50% 38.92 22 766 –
3 628 998 2 697 311
Alcon Restricted shares and Restricted Share Units (RSUs)Restricted shares and RSUs are recognised at the closing market price on the day of grant over the required service period. The participants will receive dividend equivalents over the scheduled three-year vesting period.
2008 2007 2008 2007
Numberof Restricted
shares
Numberof Restricted
shares Numberof RSUs
Numberof RSUs
Outstanding at 1 January 344 242 185 939 51 486 27 705
New granted (a) – 184 884 291 992 27 249
Settled (b) (24 438) (7 612) (7 313) (846)
Forfeited (17 622) (18 969) (10 216) (2 622)
Outstanding at 31 December 302 182 344 242 325 949 51 486
(a) Weighted average fair value of Restricted shares at grant date: none (2007: USD 130.63); weighted average fair value of RSUs at grant date: USD 147.29 (2007: USD 130.65)
(b) Weighted average price of Restricted shares at vesting date: USD 158.44 (2007: USD 124.80); weighted average price of RSUs at vesting date: USD 154.02 (2007: USD 115.60)
The fair value corresponds to the market price at grant.
Expected volatility rates are estimated based on daily his-torical trading data of its common shares from March 2002 through the grant dates and, due to Alcon’s short history
as a public company, other factors, such as the volatility of the common share prices of other pharmaceutical and sur-gical companies.
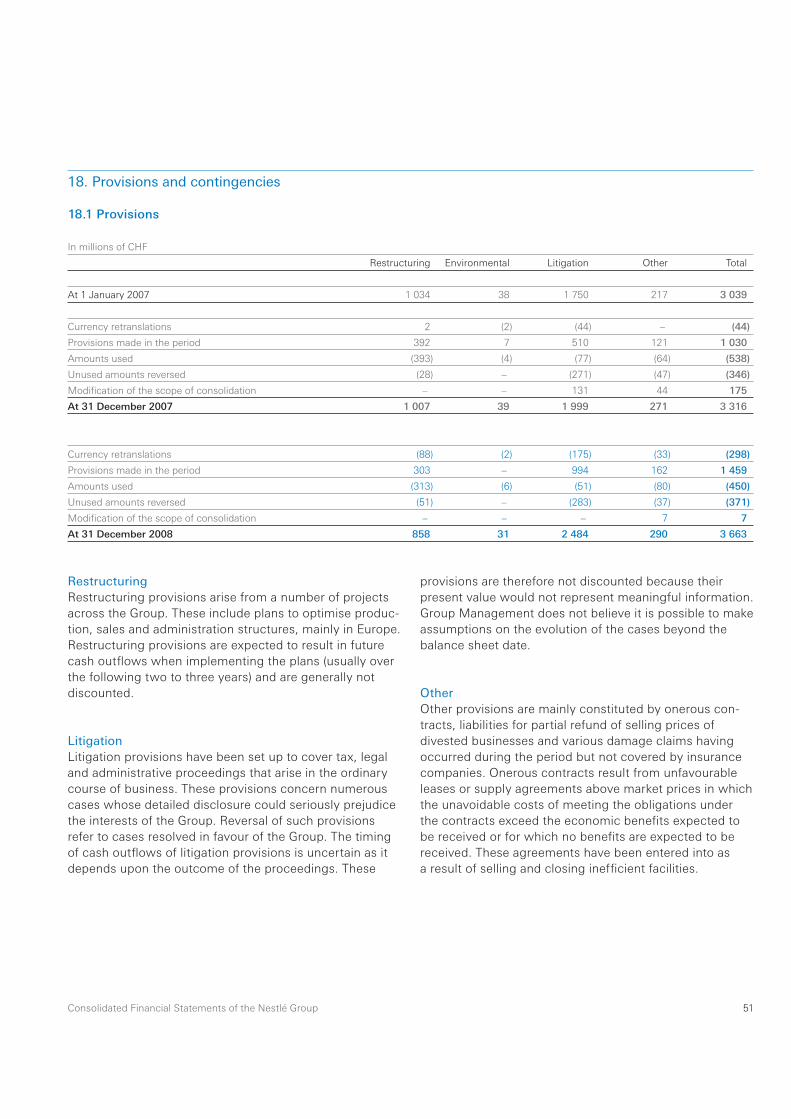
51Consolidated Financial Statements of the Nestlé Group
RestructuringRestructuring provisions arise from a number of projects across the Group. These include plans to optimise produc-tion, sales and administration structures, mainly in Europe. Restructuring provisions are expected to result in future cash outfl ows when implementing the plans (usually over the following two to three years) and are generally not discounted.
Litigation Litigation provisions have been set up to cover tax, legal and administrative proceedings that arise in the ordinary course of business. These provisions concern numerous cases whose detailed disclosure could seriously prejudice the interests of the Group. Reversal of such provisions refer to cases resolved in favour of the Group. The timing of cash outfl ows of litigation provisions is uncertain as it depends upon the outcome of the proceedings. These
provisions are therefore not discounted because their present value would not represent meaningful information. Group Management does not believe it is possible to make assumptions on the evolution of the cases beyond the balance sheet date.
OtherOther provisions are mainly constituted by onerous con-tracts, liabilities for partial refund of selling prices of divested businesses and various damage claims having occurred during the period but not covered by insurance companies. Onerous contracts result from unfavourable leases or supply agreements above market prices in which the unavoidable costs of meeting the obligations under the contracts exceed the economic benefi ts expected to be received or for which no benefi ts are expected to be received. These agreements have been entered into as a result of selling and closing ineffi cient facilities.
18. Provisions and contingencies
18.1 Provisions
In millions of CHF
Restructuring Environmental Litigation Other Total
At 1 January 2007 1 034 38 1 750 217 3 039
Currency retranslations 2 (2) (44) – (44)
Provisions made in the period 392 7 510 121 1 030
Amounts used (393) (4) (77) (64) (538)
Unused amounts reversed (28) – (271) (47) (346)
Modifi cation of the scope of consolidation – – 131 44 175
At 31 December 2007 1 007 39 1 999 271 3 316
Currency retranslations (88) (2) (175) (33) (298)
Provisions made in the period 303 – 994 162 1 459
Amounts used (313) (6) (51) (80) (450)
Unused amounts reversed (51) – (283) (37) (371)
Modifi cation of the scope of consolidation – – – 7 7
At 31 December 2008 858 31 2 484 290 3 663

52 Consolidated Financial Statements of the Nestlé Group
19. Financial assets and liabilities
In millions of CHF 2008 2007
Liquid assets (a) 7 131 9 496
Trade and other receivables 13 442 14 890
Current income tax receivables 889 531
Financial assets – non-current 3 868 4 213
Derivative assets 1 609 754
Total fi nancial assets 26 939 29 884
Trade and other payables 12 608 14 179
Current income tax payables 824 856
Financial liabilities – current 15 383 24 541
Financial liabilities – non-current 6 344 6 129
Other payables 1 264 1 091
Derivative liabilities 1 477 477
Total fi nancial liabilities 37 900 47 273
Net fi nancial position (10 961) (17 389)
(a) Liquid assets are composed of cash and cash equivalents and short-term investments.
18.2 ContingenciesThe Group is exposed to contingent liabilities amounting to a maximum potential payment of CHF 644 million (2007: CHF 1016 million) representing potential litigations of CHF 590 million (2007: CHF 956 million) and other items of CHF 54 million (2007: CHF 60 million).
Contingent assets for litigation claims in favour of the Group amount to a maximum potential recoverable of CHF 296 million (2007: CHF 395 million).

53Consolidated Financial Statements of the Nestlé Group
19.1 By category
In millions of CHF 2008 2007
Loans and receivables 14 932 15 927
Held for trading 854 1 510
Derivative assets (a) 1 609 754
Available-for-sale assets 9 544 11 693
Total fi nancial assets 26 939 29 884
Financial liabilities at amortised cost 30 341 41 218
Financial liabilities at fair value under hedge accounting 6 082 5 578
Derivative liabilities (a) 1 477 477
Total fi nancial liabilities 37 900 47 273
Net fi nancial position (10 961) (17 389)
(a) Include derivatives classifi ed as undesignated derivatives (refer to Note 11).
The Group does not apply the fair value option.
19.2 Fair value hierarchy per classes of fi nancial instrumentsThe Group determines the fair value of its fi nancial instru-ments on the basis of the following hierarchy. The fair value of instruments that are quoted in active markets is determined based on current market prices. This applies to commodity futures that are traded on terminal exchanges and to listed bonds. The fair value of the other instruments is determined on the basis of valuation techniques such as discounted
cash fl ow calculations or other pricing models. In this cat-egory, the fair value of the majority of the instruments is based on parameters stemming from observable market data or by reference to the prices of other instruments, while the fair value of a small number of instruments is based on unobservable input.

54 Consolidated Financial Statements of the Nestlé Group
19.3 Bonds
In millions of CHF 2008 2007
IssuerFace valuein millions Interest rates
Year of issue/maturity Comments
Coupon Effective
Nestlé Holdings, Inc., USA USD 535 0.00% 6.25% 2001–2008 (a) – 587
USD 400 3.50% 3.81% 2005–2008 (b) – 449
USD 300 5.00% 5.19% 2006–2008 (b) – 338
USD 250 3.88% 3.42% 2003–2009 (c) – 281
EUR 250 2.13% 2.97% 2005–2009 (b)(d) 367 392
AUD 300 5.50% 5.68% 2005–2009 (b)(e) 223 286
GBP 200 5.13% 5.38% 2006–2009 (b)(f) 313 443
USD 300 4.38% 4.49% 2005–2009 (b) 321 339
AUD 300 6.00% 6.36% 2006–2010 (b)(g) 225 285
CHF 625 2.75% 2.69% 2007–2010 (h) 620 398
HUF 10000 6.88% 7.20% 2007–2010 (b) 53 64
NOK 1500 4.75% 5.16% 2007–2010 (b)(i) 230 188
NZD 100 8.25% 8.53% 2008–2010 (b) 62 –
AUD 600 7.25% 7.63% 2008–2011 (j) 451 –
CHF 300 2.25% 2.30% 2008–2011 (k) 296 –
NOK 1000 5.00% 5.55% 2008–2011 (k) 152 –
USD 750 4.00% 3.87% 2008–2011 (b) 822 –
USD 500 4.75% 4.90% 2007–2011 (k) 537 572
CHF 675 3.00% 2.86% 2007–2012 (l) 700 199
CHF 450 2.50% 2.57% 2006–2013 (b) 454 435
CHF 250 2.63% 2.66% 2007–2018 (b) 245 235
Nestlé Purina PetCare Company, USA USD 83 9.25% 5.90% 1989–2009 90 98
USD 48 7.75% 6.25% 1995–2015 54 59
USD 63 9.30% 6.46% 1991–2021 83 89
USD 79 8.63% 6.46% 1992–2022 99 107
USD 44 8.13% 6.47% 1993–2023 53 57
USD 51 7.88% 6.45% 1995–2025 62 66
Nestlé Finance International Ltd, Luxembourg EUR 500 3.50% 3.51% 2003–2008 (b) – 828
(formerly Nestlé Finance-France S.A., France) AUD 200 6.00% 6.03% 2004–2008 (b) – 198
HUF 25000 7.00% 7.00% 2004–2009 (b) 138 163
EUR 100 3.50% 3.52% 2006–2009 (b) 149 164
Nestlé (Thai) Ltd, Thailand THB 5000 2.16% 2.16% 2003–2008 – 167
Other bonds 19 56
Total 6 818 7 543
of which due within one year 1 607 2 601
of which due after one year 5 211 4 942

55Consolidated Financial Statements of the Nestlé Group
(a) Turbo Zero Equity-Link issue with warrants on Nestlé S.A. shares: The debt component (issue of the notes) was recognised under
bonds for USD 451 million at inception, while the equity compo-nent (premium on warrants issued) was recognised under equity for USD 123 million. The investors had the option to put the notes to Nestlé Holdings, Inc. and the warrants to Nestlé S.A. at their accreted value in June 2003 and in June 2006.
Exercise conditions of the warrants: 70 000 warrants to purchase Nestlé S.A. shares. Each warrant gives the right to purchase 31.9065 shares. The holders of warrants may exercise their war-rants to purchase shares of Nestlé S.A. either:1) during the note exercise period from July 2001 to June 2008 by
tendering a note and a warrant in exchange for shares on the basis that one note is required to exercise each warrant; or
2) on the cash exercise date, 11 June 2008, by tendering warrants together with the exercise price in cash.
The effective initial exercise price per share is USD 261.119 (or CHF 455.–, based on a fi xed exchange rate of CHF 1.7425 for each USD), growing by 2.625% per annum, prior to any anti-dilution ad-justment. In June 2003, 100 units (at USD 10 000 each) of this is-sue were put for cash by a holder on the put date at the prescribed price as per the terms and conditions of the issue. In 2006, one warrant was exercised. In 2007, 16 524 warrants were exercised. Notes valued at amortised cost of USD 155 million (nominal USD 165 million) were exchanged for 527 210 Nestlé S.A. shares of nominal value of CHF 1.–. In 2008, 50 765 warrants were exer-cised. Notes valued at amortised cost of USD 501 million (nominal USD 507 million) were exchanged for 1 619 688 Nestlé S.A. shares of nominal value of CHF 1.–.
(b) Subject to an interest rate and/or currency swap that creates a liability at fl oating rates in the currency of the issuer.
(c) The step-up fi xed rate callable medium term note was called by Nestlé Holdings Inc. in March 2008 in accordance with terms and conditions.
(d) The initial EUR 150 million bond issued in 2005 was increased by EUR 100 million in 2006.
(e) The initial AUD 200 million bond issued in 2005 was increased by AUD 100 million in 2006.
(f) The initial GBP 100 million bond issued in 2006 was increased by GBP 100 million in 2007.
(g) The initial AUD 200 million bond issued in 2006 was increased by AUD 100 million in 2007.
(h) This bond is composed of:– CHF 200 million issued in 2007 subject to an interest rate and
currency swap that creates a liability at fi xed rates in the cur-rency of the issuer;
– CHF 200 million issued in 2007 subject to an interest rate and/or currency swap that creates a liability at fl oating rates in the currency of the issuer;
– CHF 100 million issued in 2008 subject to an interest rate and currency swap that creates a liability at fi xed rates in the cur-rency of the issuer; and
– CHF 125 million issued in 2008 subject to an interest rate and/or currency swap that creates a liability at fl oating rates in the currency of the issuer.
(i) The initial NOK 1000 million bond issued in 2007 was increased by NOK 500 million in 2008.
(j) This bond is composed of:– AUD 300 million issued in 2008 subject to an interest rate and
currency swap that creates a liability at fi xed rates in the cur-rency of the issuer; and
– AUD 300 million issued in 2008 subject to an interest rate and/or currency swap that creates a liability at fl oating rates in the currency of the issuer.
(k) Subject to an interest rate and currency swap that creates a liability at fi xed rates in the currency of the issuer.
(l) This bond is composed of:– CHF 200 million issued in 2007 subject to an interest rate and/
or currency swap that creates a liability at fl oating rates in the currency of the issuer;
– CHF 150 million issued in 2008 subject to an interest rate and currency swap that creates a liability at fi xed rates in the cur-rency of the issuer; and
– CHF 325 million issued in 2008 subject to an interest rate and/or currency swap that creates a liability at fl oating rates in the currency of the issuer.
Bonds subject to fair value hedges are carried at fair value for CHF 5243 million (2007: CHF 5578 million) and the related derivatives are shown under derivative assets for CHF 377 million (2007: CHF 340 million) and under derivative liabilities for CHF 223 million (2007: none). The full fair value of bonds amounts to CHF 6910 million (2007: CHF 7560 million).
Amounts subject to an interest rate and/or currency swap that creates a liability at fl oating rates in the cur-rency of the issuer are carried at fair value.
Amounts subject to an interest rate and currency swap that creates a liability at fi xed rates in the currency of the issuer are carried at amortised cost.

56 Consolidated Financial Statements of the Nestlé Group
20. Financial risks
In the course of its business, the Group is exposed to a number of fi nancial risks: credit risk, liquidity risk, market risk (including foreign currency risk and interest rate risk), commodity price risk and other risks (including equity price risk and settlement risk). This note presents the Group’s objectives, policies and processes for managing its fi nancial risk and capital.
Financial risk management is an integral part of the way the Group is managed. The Board of Directors establishes the Group’s fi nancial policies and the Chief Executive Offi cer establishes objectives in line with these policies. An Asset and Liability Management Committee (ALMC), under the supervision of the Chief Financial Offi cer, is then responsible for setting fi nancial strategies, which are exe-cuted by the Centre Treasury, the Regional Treasury Centres and, in specifi c local circumstances, by the affi li-ated companies. The activities of the Centre Treasury and of the various Regional Treasury Centres are supervised by an independent Middle Offi ce, which verifi es the compli-ance of the strategies proposed and/or operations exe-cuted within the approved guidelines and limits set by the ALMC. Approved Treasury Management Guidelines defi ne and classify risks as well as determine, by category of transaction, specifi c approval, limit and monitoring proce-dures. In accordance with the aforementioned policies, the Group only enters into derivative transactions relating to assets, liabilities or anticipated future transactions.
20.1 Credit risk
Credit risk managementCredit risk arises because counterparty may fail to perform its obligations. The Group is exposed to credit risk on fi nancial instruments such as liquid assets, derivative assets and trade receivable portfolios.
The Group sets credit limits based on a counterparty value computed with a probability of default. The method-ology used to set the list of counterparty limits includes Enterprise Value (EV), counterparty Credit Ratings (CR) and Credit Default Swaps (CDS).
Evolution of counterparties is monitored daily, taking into consideration EV, CR and CDS evolution. As a result of this daily review, changes on investment limits and risk allocation are carried out.
The Group avoids the concentration of credit risk on its liquid assets by spreading them over several institutions and sectors.
Following on the credit crisis, the Group enhanced risk management activities in particular concerning temporary reduction of global credit limits of key counterparties, reg-ular review by the ALMC of exposures, reduction of liquid investments to decrease counterparty risk and payment of debt.
Trade receivables are subject to credit limits, control and approval procedures in all the affi liated companies. Due to its large geographic base and number of custom-ers, the Group is not exposed to material concentrations of credit risk on its trade receivables (refer to Note 10). Nevertheless global commercial counterparties are con-stantly monitored following the same methodology used for fi nancial counterparties.
The maximum exposure to credit risk resulting from fi nancial activities, without considering netting agreements and without taking into account any collateral held or other credit enhancements, is equal to the carrying amount of the Group’s fi nancial assets.

57Consolidated Financial Statements of the Nestlé Group
The source of the credit ratings is Standard & Poor’s; if not available, the Group uses Moody’s and Fitch’s equivalents. The Group deals essentially with fi nancial institutions located in Switzerland, the European Union and North America.
20.2 Liquidity risk
Liquidity risk managementLiquidity risk arises when a company encounters diffi culties to meet commitments associated with liabilities and other payment obligations. Such risk may result from inadequate market depth or disruption or refi nancing problems. The Group’s objective is to manage this risk by limiting exposures in instruments that may be affected by liquidity problems and by maintaining suffi cient back-up facilities. The Group
does not expect any refi nancing issues and has successfully completed the renewal and amendment of its EUR 5 bil -lion 364-day revolving credit facility this year. The facility currently serves primarily as a backstop to its global commercial paper programme. In total, the Group’s revolving credit facilities amounts to EUR 8.2 billion.
Credit rating of fi nancial assets (excl. loans and receivables)
In millions of CHF 2008 2007
Investment grade A and above 10 977 13 119
Investment grade BBB+, BBB and BBB– 449 416
Non-investment grade (BB+ and below) 231 160
Not rated 350 262
12 007 13 957

58 Consolidated Financial Statements of the Nestlé Group
Maturity of fi nancial instruments
In millions of CHF 2007 In
the
fi rs
t ye
ar
In t
he s
econ
d ye
ar
In t
he t
hird
to t
he fi
fth
year
Aft
er t
he fi
fth
year
Con
trac
tual
am
ount
Car
ryin
g a
mou
nt
Financial assets (excl. currency derivatives)
Cash at bank and in hand 2 610 – – – 2 610 2 610
Commercial paper 2 071 – – – 2 071 2 071
Time deposits 3 144 – – – 3 144 3 144
Trade, tax and other receivables 15 421 – – – 15 421 15 421
Trading portfolios 1 510 – – – 1 510 1 510
Non-currency derivative assets 76 19 52 3 150 150
Other fi nancial assets 213 208 163 2 689 3 273 3 273
25 045 227 215 2 692 28 179 28 179
Financial investments without contractual maturities 1 101
25 045 227 215 2 692 28 179 29 280
Financial liabilities (excl. currency derivatives)
Trade, tax and other payables 15 035 1 091 – – 16 126 16 126
Commercial paper (a) 18 647 – – – 18 647 18 544
Bonds (a) 2 909 2 312 2 167 1 345 8 733 7 543
Non-currency derivative liabilities 40 17 45 7 109 113
Other fi nancial liabilities 3 738 500 590 505 5 333 4 583
40 369 3 920 2 802 1 857 48 948 46 909
Currency derivative assets and liabilities
Gross amount receivable from currency derivatives 14 655 4 417 1 819 701 21 592 21 411
Gross amount payable from currency derivatives (14 669) (4 447) (1 401) (664) (21 181) (21 171)
(14) (30) 418 37 411 240
Net fi nancial position (15 338) (3 723) (2 169) 872 (20 358) (17 389)
of which Cash fl ow hedges (b)
Derivative assets 71 – 34 2 107
Derivative liabilities 66 14 47 6 133
(a) Commercial paper (liabilities) of CHF 17 436 million and bonds of CHF 1621 million have maturities of less than three months.(b) The periods when the cash fl ow hedges affect the income statement do not differ signifi cantly from the maturities disclosed above.

59Consolidated Financial Statements of the Nestlé Group
In millions of CHF 2008
In t
he fi
rst
year
In t
he s
econ
d ye
ar
In t
he t
hird
to t
he fi
fth
year
Aft
er t
he fi
fth
year
Con
trac
tual
am
ount
Car
ryin
g a
mou
nt
Financial assets (excl. currency derivatives)
Cash at bank and in hand 1 855 – – – 1 855 1 855
Commercial paper 1 026 – – – 1 026 1 026
Time deposits 3 213 – – – 3 213 3 213
Trade, tax and other receivables 14 331 – – – 14 331 14 331
Trading portfolios 854 – – – 854 854
Non-currency derivative assets 111 29 115 – 255 255
Other fi nancial assets 183 378 224 2 364 3 149 3 149
21 573 407 339 2 364 24 683 24 683
Financial investments without contractual maturities 902
21 573 407 339 2 364 24 683 25 585
Financial liabilities (excl. currency derivatives)
Trade, tax and other payables 13 428 1 158 110 – 14 696 14 696
Commercial paper (a) 10 235 – – – 10 235 10 213
Bonds (a) 1 888 1 403 3 619 807 7 717 6 818
Non-currency derivative liabilities 292 77 95 38 502 502
Other fi nancial liabilities 3 683 834 527 537 5 581 4 696
29 526 3 472 4 351 1 382 38 731 36 925
Currency derivative assets and liabilities
Gross amount receivable from currency derivatives 22 356 1 864 2 104 264 26 588 26 543
Gross amount payable from currency derivatives (22 287) (1 740) (2 103) (216) (26 346) (26 164)
69 124 1 48 242 379
Net fi nancial position (7 884) (2 941) (4 011) 1 030 (13 806) (10 961)
of which Cash fl ow hedges (b)
Derivative assets 208 23 23 – 254
Derivative liabilities 375 77 167 38 657
(a) Commercial paper (liabilities) of CHF 9444 million and bonds of CHF 262 million have maturities of less than three months.(b) The periods when the cash fl ow hedges affect the income statement do not differ signifi cantly from the maturities disclosed above.

60 Consolidated Financial Statements of the Nestlé Group
Financial instruments by currency
In millions of CHF 2007
CHF EUR USD GBP AUD Other Total
Financial assets (excl. currency derivatives)
Liquid assets (a) 1 663 711 5 213 347 7 1 555 9 496
Trade, tax and other receivables 463 5 324 2 923 637 290 5 784 15 421
Non-current fi nancial assets 966 246 2 753 2 3 243 4 213
Non-currency derivative assets – 49 84 5 – 12 150
3 092 6 330 10 973 991 300 7 594 29 280
Financial liabilities (excl. currency derivatives)
Trade, tax and other payables 1 442 5 463 4 447 487 237 4 050 16 126
Commercial paper 740 1 647 15 361 66 – 730 18 544
Bonds 1 268 1 383 3 080 444 768 600 7 543
Non-currency derivative liabilities – 21 84 5 – 3 113
Other fi nancial liabilities 126 1 135 463 88 156 2 615 4 583
3 576 9 649 23 435 1 090 1 161 7 998 46 909
Currency derivative assets and liabilities
Gross amount receivable from currency derivatives 5 504 3 437 5 507 607 2 072 4 284 21 411
Gross amount payable from currency derivatives (2 785) (8 402) (3 554) (452) (1 235) (4 743) (21 171)
2 719 (4 965) 1 953 155 837 (459) 240
Net fi nancial position 2 235 (8 284) (10 509) 56 (24) (863) (17 389)
(a) Liquid assets are composed of cash and cash equivalents and short-term investments.
20.3 Market riskThe Group is exposed to risk from movements in foreign currency exchange rates, interest rates and market prices that affect its assets, liabilities and anticipated future trans-actions.
Foreign currency riskForeign currency risk managementThe Group is exposed to foreign currency risk from trans-actions and translation.
Transaction exposure arises because affi liated companies undertake transactions in foreign currencies. Transac tional exposures are managed within a prudent and systematic hedging policy in accordance with the Group’s specifi c business needs. Translation exposure arises from the con-solidation of the fi nancial statements of foreign operations in Swiss francs, which is in principle not hedged.
The Group’s objective is to manage its foreign currency exposure through the use of currency forwards, futures, swaps and options.

61Consolidated Financial Statements of the Nestlé Group
In millions of CHF 2008
CHF EUR USD GBP AUD Other Total
Financial assets (excl. currency derivatives)
Liquid assets (a) 1 675 424 3 794 311 7 920 7 131
Trade, tax and other receivables 328 4 840 3 282 485 217 5 179 14 331
Non-current fi nancial assets 733 295 2 603 1 2 234 3 868
Non-currency derivative assets 29 3 162 49 – 12 255
2 765 5 562 9 841 846 226 6 345 25 585
Financial liabilities (excl. currency derivatives)
Trade, tax and other payables 1 358 4 673 4 289 348 166 3 862 14 696
Commercial paper 90 260 9 105 297 – 461 10 213
Bonds 2 317 516 2 131 313 898 643 6 818
Non-currency derivative liabilities – 44 424 27 – 7 502
Other fi nancial liabilities 24 1 180 315 35 127 3 015 4 696
3 789 6 673 16 264 1 020 1 191 7 988 36 925
Currency derivative assets and liabilities
Gross amount receivable from currency derivatives 7 445 2 290 11 813 373 1 701 2 921 26 543
Gross amount payable from currency derivatives (2 003) (12 648) (7 266) (167) (730) (3 350) (26 164)
5 442 (10 358) 4 547 206 971 (429) 379
Net fi nancial position 4 418 (11 469) (1 876) 32 6 (2 072) (10 961)
(a) Liquid assets are composed of cash and cash equivalents and short-term investments.

62 Consolidated Financial Statements of the Nestlé Group
Average interest rates
2008
USD CHF EUR GBP
Liquid assets 2.00% 1.74% 2.99% –
Financial liabilities (excl. bonds (a)) 2.54% 1.49% 3.80% 2.55%
(a) Interest rates of bonds are disclosed in Note 19.
Interest rate riskInterest risk management
Interest structure of non-current fi nancial liabilities
In millions of CHF 2008 2007
Financial liabilities at fi xed rates 5 507 5 603
Financial liabilities at variable rates 837 526
6 344 6 129
Interest rate risk comprises the interest price risk that results from borrowings at fi xed rates and the interest cash fl ow risk that results from borrowings at variable rates.
The ALMC is responsible for setting the overall duration and interest management targets.
The Group’s objective is to manage its interest rate exposure through the use of interest rate forwards, futures and swaps.
2007
USD CHF EUR GBP
Liquid assets 5.29% 2.17% 3.81% 5.30%
Financial liabilities (excl. bonds (a)) 5.27% 2.49% 4.07% 5.99%

63Consolidated Financial Statements of the Nestlé Group
20.4 Commodity price riskCommodity price risk arises from transactions on the world commodity markets for securing the supplies of green coffee, cocoa beans and other commodities neces-sary for the manufacture of some of the Group‘s products.
Commodity price risk managementThe Group’s objective is to minimise the impact of com-modity price fl uctuations and this exposure is hedged in accordance with the commodity risk management policies set by the Board of Directors.
The regional Commodity Purchasing Competence Centres are responsible for managing commodity price risk on the basis of internal directives and centrally deter-mined limits. They ensure that the Group benefi ts from guaranteed fi nancial hedges through the use of exchange traded commodity derivatives.
The commodity price risk exposure of anticipated future purchases is managed using a combination of derivatives (futures and options) and executory contracts (differentials and ratios). The vast majority of these contracts are for physical delivery, while cash-settled contracts are treated as undesignated derivatives.
As a result of the short product business cycle of the Group, the majority of the anticipated future raw material transactions outstanding at the balance sheet date are expected to occur in the next period.
20.5 Other risks
Equity price riskThe Group is exposed to equity price risk on short-term investments held as trading and available-for-sale assets. To manage the price risk arising from investments in secu-rities, the Group diversifi es its portfolios in accordance with the Guidelines set by the Board of Directors.
The Group’s external investments are in principle only with publicly traded counterparties that have an investment grade rating by one of the recognised rating agencies.
Settlement riskSettlement risk results from the fact that the Group may not receive fi nancial instruments from its counterparties at the expected time. This risk is managed by monitoring counterparty activity and settlement limits.

64 Consolidated Financial Statements of the Nestlé Group
20.6 Value at Risk (VaR)
The estimated potential one-day loss from the Group’s commodity price risk sensitive instruments, as calculated using the above described historic VaR model, is as follows:
In millions of CHF 2008 2007
Commodity price 16 2
Description of the methodThe VaR is a single measure to assess market risk. The VaR estimates the size of losses given current positions and possible changes in fi nancial markets. The Group uses simulation to calculate VaR based on the historic data for a 250 days period.
The VaR calculation is based on 95% confi dence level and, accordingly, does not take into account losses that might occur beyond this level of confi dence. The VaR is calculated on the basis of exposures outstanding at the close of business and does not necessarily refl ect intra-day exposures.
Objective of the methodThe Group uses the described VaR analysis to estimate the potential one-day loss in the fair value of its fi nancial and commodity instruments.
The Group cannot predict the actual future movements in market rates and commodity prices, therefore the below VaR numbers neither represent actual losses nor consider the effects of favourable movements in underlying variables. Accordingly, these VaR numbers may only be considered indicative of future movements to the extent the historic market patterns repeat in the future.
In millions of CHF 2008 2007
Foreign currency 9 15
Interest rate 19 44
Foreign currency and interest rate combined 14 41
VaR fi guresThe VaR computation includes the Group’s fi nancial assets and liabilities that are subject to foreign currency, interest rate and commodity price risk.
The estimated potential one-day loss from the Group’s foreign currency and interest rate risk sensitive instruments, as calculated using the above described historic VaR model, is as follows:
65Consolidated Financial Statements of the Nestlé Group
20.7 Capital risk management
21. Equity
21.1 Share capital issued
The Group’s capital management is driven by the impact on shareholders of the level of total capital employed. It is the Group’s policy to maintain a sound capital base to sup-port the continued development of its business.
The Board of Directors seeks to maintain a prudent bal-ance between different components of the Group’s capi-tal. The ALMC monitors capital on the basis of operating cash fl ow as a percentage of net fi nancial debt. Net fi nan-
cial debt is defi ned as current and non-current fi nancial lia-bilities less liquid assets, as shown on the Consolidated balance sheet.
The operating cash fl ow-to-net fi nancial debt ratio high-lights the ability of a business to repay its debts. As at 31 December 2008, the ratio was 73.7% (2007: 63.5%).
The Group’s subsidiaries have complied with local statu-tory capital requirements as appropriate.
The ordinary share capital of Nestlé S.A. authorised, issued and fully paid is composed of 3 830 000 000 regis-tered shares with a nominal value of CHF 0.10 each (2007: 393 072 500 registered shares with a nominal value of CHF 1.– each). Each share confers the right to one vote. No shareholders may be registered with the right to vote for shares which it holds, directly or indirectly, in excess of 5% of the share capital. Shareholders have the right to receive dividends.
The share capital changed twice in the last two fi nancial years as a consequence of the Share Buy-Back Programmes launched in 2005 and 2007. The cancellation of shares was approved at the Annual General Meetings of 19 April 2007 and 10 April 2008. In 2007, the share capital was reduced by 7 663 200 shares from CHF 401 million to CHF 393 million. In 2008, the share capital was further reduced by 10 072 500 shares from CHF 393 million to CHF 383 million.
Additionally, the shareholders gave their assent at the last Annual General Meeting to a 1-for-10 share split and respective increase of the number of shares. This split aims to increase the liquidity and tradability of the Nestlé S.A. shares. As a consequence, the nominal value of the shares was reduced from CHF 1.– to CHF 0.10.
21.2 Conditional share capitalThe conditional capital of Nestlé S.A. amounts to CHF 10 million as in the preceding year. It confers the right to increase the ordinary share capital, through the exercise of conversion or option rights in connection with deben-tures and other fi nancial market instruments, by a maxi-mum of CHF 10 million by the issue of a maximum of 100 000 000 registered shares with a nominal value of CHF 0.10 each. Thus the Board of Directors has at its dis-posal a fl exible instrument enabling it, if necessary, to fi nance the activities of the Company through convertible debentures.

66 Consolidated Financial Statements of the Nestlé Group
20
08
20
07
(a)
21.3 Treasury shares
Number of shares Notes 2008 2007 (a)
Purpose of holding
Trading 9 501 554 18 727 050
Share Buy-Back Programme 165 824 000 82 940 000
Warrants on Turbo bond issue of Nestlé Holdings Inc., USA 19 – 17 030 590
Management option rights 17 22 326 896 27 374 110
Restricted Stock Units 17 9 443 950 10 771 260
Freely available for future Long-Term Incentive Plans 7 296 360 11 164 410
214 392 760 168 007 420
(a) 2007 comparatives have been restated following 1-for-10 share split effective on 30 June 2008.
At 31 December 2008, the market value of the treasury shares held by the Group is CHF 8919 million (2007: CHF 8736 million).
21.4 Number of shares outstanding
Purchase of treasury shares (183 809 000) (183 809 000)
Sale of treasury shares 9 575 506 9 575 506
Treasury shares delivered in respect of options exercised 5 740 284 5 740 284
Treasury shares delivered in respect of equity compensation plans 4 502 290 4 502 290
Treasury shares exchanged for warrants 16 880 580 16 880 580
Treasury shares cancelled (100 725 000) 100 725 000 –
At 31 December 2008 3 830 000 000 (214 392 760) 3 615 607 240
(a) 2007 comparatives have been restated following 1-for-10 share split effective on 30 June 2008.
Sharesissued
Treasuryshares
Outstandingshares
At 1 January 2007 4 007 357 000 (170 136 260) 3 837 220 740
Purchase of treasury shares (104 326 920) (104 326 920)
Sale of treasury shares 8 662 660 8 662 660
Treasury shares delivered in respect of options exercised 15 313 170 15 313 170
Treasury shares delivered in respect of equity compensation plans 575 830 575 830
Treasury shares exchanged for warrants 5 272 100 5 272 100
Treasury shares cancelled (76 632 000) 76 632 000 –
At 31 December 2007 3 930 725 000 (168 007 420) 3 762 717 580

67Consolidated Financial Statements of the Nestlé Group
21.7 Minority interestsThe minority interests comprise the portion of equity of subsidiaries that are not owned, directly or indirectly, by Nestlé S.A. A signifi cant portion of minority interests relates to Alcon.
21.8 DividendThe dividend related to 2007 was paid on 16 April 2008 in conformity with the decision taken at the Annual General Meeting on 10 April 2008. Shareholders approved the pro-posed dividend of CHF 12.20 per share, resulting in a total dividend of CHF 4573 million.
Dividends payable are not accounted for until they have been ratifi ed at the Annual General Meeting. At the meet-ing on 23 April 2009, a dividend of CHF 1.40 per share will be proposed, resulting in a total dividend of CHF 5127 mil-lion. For further details, refer to the Financial Statements of Nestlé S.A.
The Financial Statements for the year ended 31 Decem-ber 2008 do not refl ect this proposed distribution, which will be treated as an appropriation of profi t in the year ending 31 December 2009.
21.5 Translation reserveThe translation reserve comprises the cumulative gains and losses arising from translating the fi nancial statements of foreign operations that use functional currencies other than Swiss francs. It also includes the changes in the fair value of hedging instruments used for net investments in foreign operations.
21.6 Retained earnings and other reservesRetained earnings represent the cumulative profi ts, share premium, as well as actuarial gains and losses on defi ned benefi t plans attributable to shareholders of the parent. Other reserves comprise the fair value reserve and the hedging reserve attributable to shareholders of the parent.
The fair value reserve includes the gains and losses on remeasuring available-for-sale fi nancial instruments. At 31 December 2008, it amounts to CHF 79 million (2007: CHF 436 million).
The hedging reserve consists of the effective portion of the gains and losses on hedging instruments related to hedged transactions that have not yet occurred. At 31 December 2008, the reserve is negative of CHF 378 mil-lion (2007: negative of CHF 21 million).

68 Consolidated Financial Statements of the Nestlé Group
22. Cash fl ow statement
22.1 Non-cash items of income and expense
In millions of CHF 2008 2007
Share of results of associates (1 005) (1 280)
Depreciation of property, plant and equipment 2 625 2 620
Impairment of property, plant and equipment 248 225
Impairment of goodwill 561 251
Depreciation of intangible assets 624 591
Impairment of intangible assets 1 6
Net result on disposal of businesses (9 252) (259)
Net result on disposal of assets 186 (206)
Non-cash items in fi nancial assets and liabilities (759) (113)
Deferred taxes (1 090) 156
Taxes on equity items 1 454 (140)
Equity compensation plans 250 246
(6 157) 2 097
22.2 Decrease/(increase) in working capital
In millions of CHF 2008 2007
Inventories (1 523) (1 001)
Trade receivables 13 (108)
Trade payables 78 968
Other current assets (870) (363)
Other current liabilities 515 586
(1 787) 82

69Consolidated Financial Statements of the Nestlé Group
22.3 Variation of other operating assets and liabilities
In millions of CHF 2008 2007
Variation of employee benefi ts assets and liabilities (824) (213)
Variation of provisions 638 146
Other (158) (55)
(344) (122)
22.5 Cash and cash equivalents at end of period
In millions of CHF 2008 2007
Cash at bank and in hand 1 855 2 610
Time deposits (a) 3 174 3 039
Commercial paper (a) 806 945
5 835 6 594
(a) With original maturity of less than three months
22.6 Interest, taxes and dividendsThe following items are allocated to the appropriate headings in the cash fl ow statement:
In millions of CHF 2008 2007
Interest paid (1 138) (1 352)
Interest received 231 564
Taxes paid (3 207) (3 072)
Dividends paid (4 981) (4 363)
Dividends received 399 404
22.4 Purchase of treasury sharesIn 2008, the Group invested CHF 8685 million on its Share Buy-Back Programme (2007: CHF 4405 million).
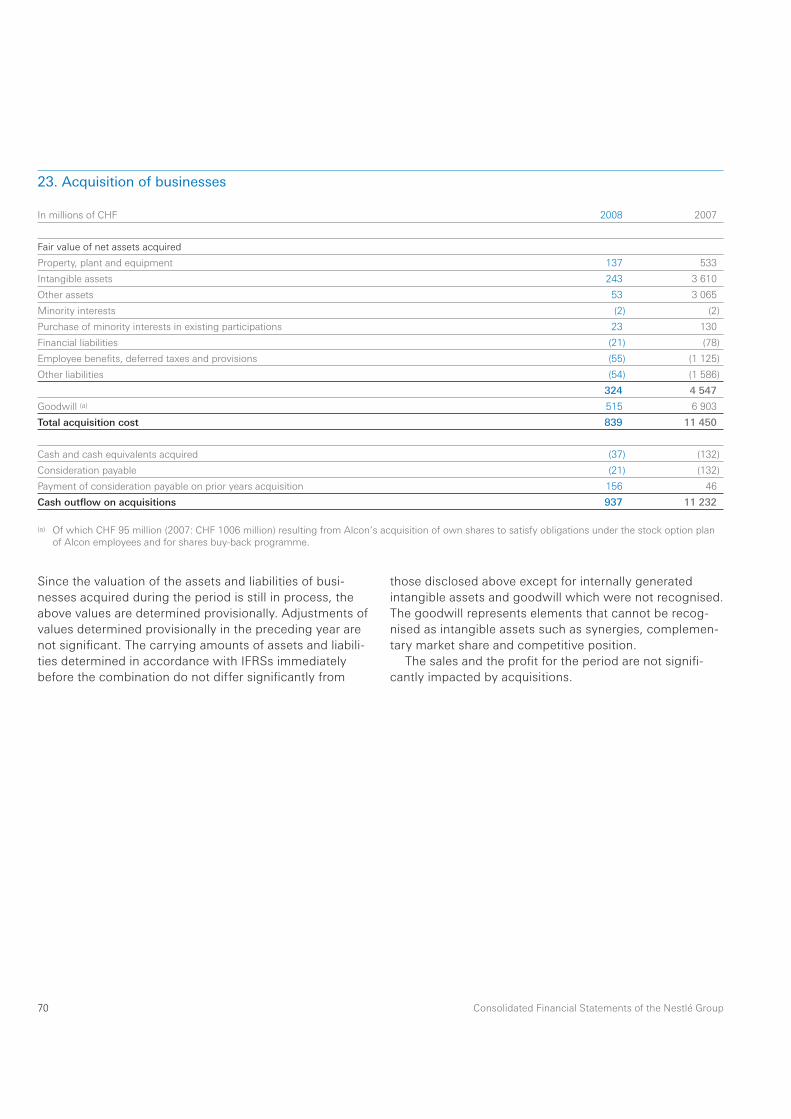
70 Consolidated Financial Statements of the Nestlé Group
23. Acquisition of businesses
Since the valuation of the assets and liabilities of busi-nesses acquired during the period is still in process, the above values are determined provisionally. Adjustments of values determined provisionally in the preceding year are not signifi cant. The carrying amounts of assets and liabili-ties determined in accordance with IFRSs immediately before the combination do not differ signifi cantly from
those disclosed above except for internally generated intangible assets and goodwill which were not recognised. The goodwill represents elements that cannot be recog-nised as intangible assets such as synergies, complemen-tary market share and competitive position.
The sales and the profi t for the period are not signifi -cantly impacted by acquisitions.
In millions of CHF 2008 2007
Fair value of net assets acquired
Property, plant and equipment 137 533
Intangible assets 243 3 610
Other assets 53 3 065
Minority interests (2) (2)
Purchase of minority interests in existing participations 23 130
Financial liabilities (21) (78)
Employee benefi ts, deferred taxes and provisions (55) (1 125)
Other liabilities (54) (1 586)
324 4 547
Goodwill (a) 515 6 903
Total acquisition cost 839 11 450
Cash and cash equivalents acquired (37) (132)
Consideration payable (21) (132)
Payment of consideration payable on prior years acquisition 156 46
Cash outfl ow on acquisitions 937 11 232
(a) Of which CHF 95 million (2007: CHF 1006 million) resulting from Alcon’s acquisition of own shares to satisfy obligations under the stock option plan of Alcon employees and for shares buy-back programme.

71Consolidated Financial Statements of the Nestlé Group
24. Disposal of businesses
Disposal of Alcon
In millions of CHF 2008 2007
Net assets disposed of
Property, plant and equipment 92 81
Goodwill and intangible assets 84 139
Other assets 176 297
Minority interests 1 554 (29)
Financial liabilities (61) (18)
Employee benefi ts, deferred taxes and provisions (5) 36
Other liabilities (102) (244)
1 738 262
Profi t/(loss) on current year disposals 9 252 259
Total disposal consideration 10 990 521
Cash and cash equivalents disposed of (20) (30)
Consideration receivable (5) (41)
Receipt of consideration receivable on prior years disposal 34 6
Cash infl ow on disposals 10 999 456
On 7 July 2008, the Group sold 24.8% of Alcon outstand-ing capital to Novartis for a total amount of USD 10.4 bil-lion, resulting in a profi t on disposal of CHF 9208 million and in an increase of minority interests of CHF 1537 mil-lion. Alcon remains fully consolidated.
The agreement further includes the option for Novartis to acquire Nestlé’s remaining shareholding in Alcon at a price of USD 181.– per share from January 2010 until July 2011. During the same period, Nestlé will have the option to sell its remaining shareholding in Alcon to
Novartis at the lower of either the call price of USD 181.– per share or the average share price during the week pre-ceding the exercise plus a premium of 20.5%. In accord-ance with IFRS requirements under IAS 39 – Financial Instruments: Recognition and Measurement, contracts between a buyer and a seller in a business combination to buy or sell a business at a later date, are exempt from recognition. Therefore, the outstanding put and call options have not been recognised.

72 Consolidated Financial Statements of the Nestlé Group
25. Lease commitments
25.1 Operating leasesLease commitments refer mainly to buildings, industrial equipment, vehicles and IT equipment.
In millions of CHF 2008 2007
Minimum lease payments
Future value
Within one year 609 559
In the second year 487 425
In the third to the fi fth year inclusive 918 859
After the fi fth year 524 571
2 538 2 414
25.2 Finance leases
In millions of CHF 2008 2007
Minimum lease payments
Present
value Future value
Presentvalue
Future value
Within one year 65 67 78 88
In the second year 54 64 100 120
In the third to the fi fth year inclusive 101 139 146 208
After the fi fth year 74 181 122 264
294 451 446 680
The difference between the future value of the minimum lease payments and their present value represents the discount on the lease obligations.

73Consolidated Financial Statements of the Nestlé Group
26. Transactions with related parties
26.1 Compensation of the Board of Directors and the Executive Board
Board of Directors With the exception of the Chairman and the CEO, mem-bers of the Board of Directors receive an annual compen-sation that varies with the Board and the Committee responsibilities as follows:
– Board members: CHF 280 000; – members of the Chairman’s and Corporate
Governance Committee: additional CHF 200 000; – members of the Compensation Comittee: additional
CHF 40 000 (Chair CHF 100 000); – members of the Nomination Committee: additional
CHF 40 000 (Chair CHF 100 000); and– members of the Audit Committee: additional
CHF 100 000 (Chair CHF 150 000). Half of the compensation is paid through the granting of
Nestlé S.A. shares at the ex-dividend closing price on the day of payment of the dividend. These shares are subject to a two-year blocking period.
With the exception of the Chairman and the CEO, members of the Board of Directors also receive an annual
expense allowance of CHF 15 000 each. This allowance covers travel and hotel accommodation in Switzerland, as well as sundry out-of-pocket expenses. For Board mem-bers from outside Europe, the Company reimburses addi-tionally the airline tickets. When the Board meets outside of Switzerland, all expenses are borne and paid directly by the Company.
The Chairman is entitled to a salary, a bonus and Long-Term Incentives.
Executive BoardThe total annual remuneration of the members of the Executive Board comprises a salary, a bonus (based on the individual‘s performance and the achievement of the Group‘s objectives), share options, restricted stock units and other benefi ts. Members of the Executive Board can choose to receive part or all of their bonus in Nestlé S.A. shares at the average closing price of the last ten trading days of January of the year of allocation. These shares are subject to a three-year blocking period.
2008 2007
Number CHF millions Number (a) CHF millions
Board of Directors
Chairman’s compensation (b) 14
Other Board members
Remuneration cash 3 3
Shares 50 320 2 58 750 3
Executive Board
Remuneration cash 14 15
Bonus 8 6
Shares 100 741 3 245 170 10
Options (c) 499 000 4 1 155 000 8
Restricted Stock Units (c) 153 200 7 242 500 11
Pension contributions 5 5
(a) 2007 comparatives have been restated following 1-for-10 share split effective on 30 June 2008.(b) Refer to Note 25 of the Financial Statements of Nestlé S.A.(c) Both options and Restricted Stock Units are equity-settled share-based payment transactions whose cost is recognised over the vesting period.

74 Consolidated Financial Statements of the Nestlé Group
26.2 Intra-Group transactions and transactions
27. Joint ventures
with associated companiesIntra-Group transactions are eliminated on consolidation:
– when it is between the parent and the fully consoli-dated affi liates or between fully consolidated affi li-ates; or
– in proportion to the Nestlé participation in the equity of the joint ventures (usually 50%) when it is between the parent and the joint ventures, or between fully consolidated affi liates and joint ventures.
There were no signifi cant transactions between the Group companies and associated companies.
26.3 Other transactionsNestlé Capital Management Ltd, one of the Group’s sub-sidiaries, is an asset manager authorised and regulated by the Financial Services Authority, in the United Kingdom. As from 2007, it is engaged to manage some of the assets
of the Group’s pension funds. In this function, it executes trading and investment transactions on behalf of these pension funds directly or for the Robusta Funds. The fees received in 2008 for those activities amounted to CHF 14 million (2007: CHF 13 million). The assets under direct management represented an amount of CHF 6.5 bil-lion at 31 December 2008 (2007: CHF 8.4 billion).
In addition, Robusta Asset Management Ltd (RAML), another Group’s subsidiary, is in charge of selecting and monitoring investment managers for the Robusta Funds pension investment vehicles. No fees are charged by RAML for this activity. The assets under supervision of RAML, including assets under direct management of Nestlé Capital Management Ltd (CHF 4.6 billion), amounted to CHF 8 billion at 31 December 2008 (2007: CHF 10.6 billion).
Furthermore, throughout 2008, no director had a per-sonal interest in any transaction of signifi cance for the business of the Group.
In millions of CHF 2008 2007
Share of assets and liabilities consolidated in the balance sheet
Total current assets 862 834
Total non-current assets 1 058 956
Total current liabilities 1 263 1 097
Total non-current liabilities 149 152
Share of income and expenses consolidated in the income statement
Total sales 2 820 2 692
Total expenses (2 528) (2 437)
75Consolidated Financial Statements of the Nestlé Group
28. GuaranteesThe Group has not given signifi cant guarantees to third parties.
29. Group risk managementThe Nestlé Group Enterprise Risk Management Framework (ERM) is designed to identify, communicate, and mitigate risks in order to minimise their potential impact on the Group. Nestlé Group Risk Services developed the ERM and its implementation approach, and is responsible for managing the ERM today. The complexity of the Nestlé Group requires a two-tiered (centralised and decentralised) approach to the evaluation of risk. To allow for this com-plexity, the ERM has been developed using both “Top-Down” and “Bottom-Up” assessments. Implementation of this Framework has allowed the Group to achieve the fol-lowing objectives:
– evaluation of all types of risks (e. g. fi nancial, reputa-tion, legal and compliance, security, environmental);
– development of a common language for communi-cating and consolidating risk; and
– prioritisation and identifi cation of where to focus management resources and activity.
The “Top-Down” assessment occurs annually and focuses on the Group’s global risk portfolio. It involves the aggregation of individual “Top-Down” assessments of Zones, Globally Managed Businesses, and selected mar-kets. It is intended to provide a high-level mapping of Group risk and allow Group Management to make sound decisions on the future operations of the Company. Risk
assessments are the responsibility of line management; this applies equally to a business, a market or a function, and any mitigating actions identifi ed in the assessments are the responsibility of the individual line management. If a Group-level intervention is required, responsibility for mitigating actions will generally be determined by the Executive Board.
The “Bottom-Up” process includes assessments per-formed at an individual component level (business unit, function, department or project). The reason for perform-ing these component level risk assessments is to highlight localised issues where risks can be mitigated quickly and effi ciently. The timing of these assessments varies, and any mitigating actions required are the responsibility of the line management of the individual component unit.
Overall Group ERM reporting combines the total results of the “Top-Down” assessment and the compilations of the individual “Bottom-Up” assessments. The results of the Group ERM are presented to the Executive Board and Audit Committee annually. In the case of an individual risk assessment identifying a risk which requires action at Group level, an ad hoc presentation is made to the Executive Board.
Financial risks management is described in more details in Note 20.
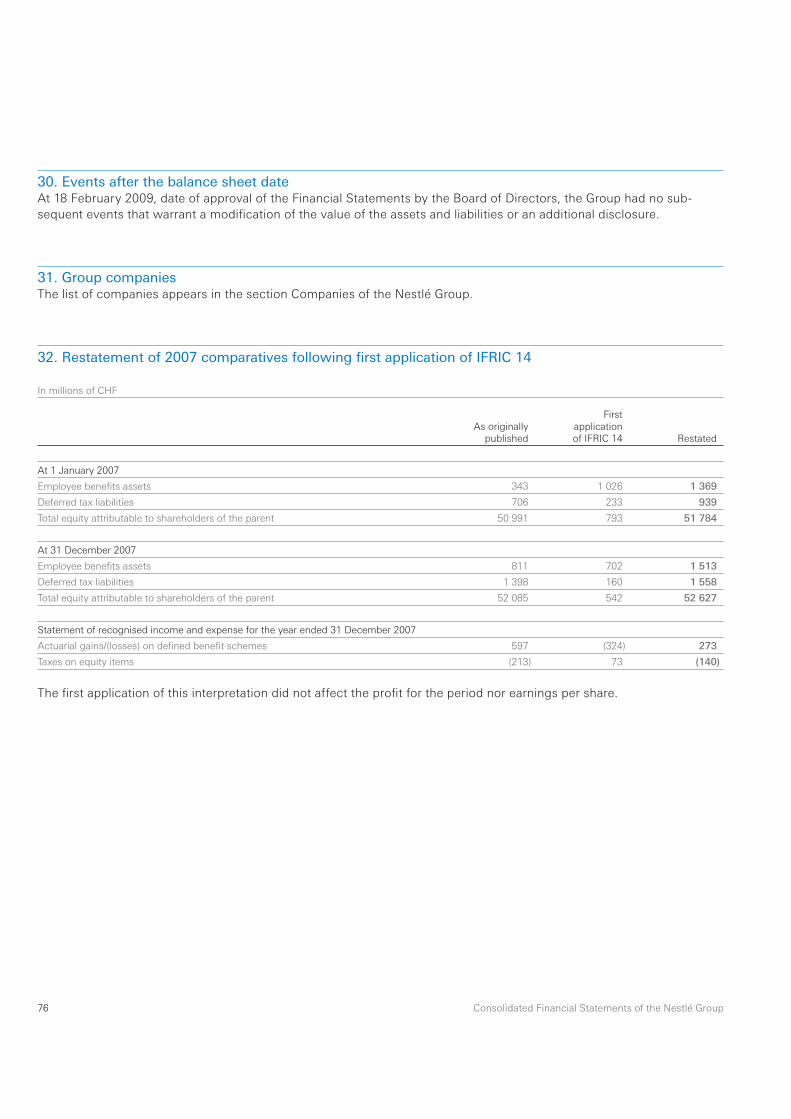
76 Consolidated Financial Statements of the Nestlé Group
32. Restatement of 2007 comparatives following fi rst application of IFRIC 14
30. Events after the balance sheet date
At 18 February 2009, date of approval of the Financial Statements by the Board of Directors, the Group had no sub-sequent events that warrant a modifi cation of the value of the assets and liabilities or an additional disclosure.
31. Group companies
In millions of CHF
As originallypublished
Firstapplicationof IFRIC 14 Restated
At 1 January 2007
Employee benefi ts assets 343 1 026 1 369
Deferred tax liabilities 706 233 939
Total equity attributable to shareholders of the parent 50 991 793 51 784
At 31 December 2007
Employee benefi ts assets 811 702 1 513
Deferred tax liabilities 1 398 160 1 558
Total equity attributable to shareholders of the parent 52 085 542 52 627
Statement of recognised income and expense for the year ended 31 December 2007
Actuarial gains/(losses) on defi ned benefi t schemes 597 (324) 273
Taxes on equity items (213) 73 (140)
The fi rst application of this interpretation did not affect the profi t for the period nor earnings per share.
The list of companies appears in the section Companies of the Nestlé Group.

77Consolidated Financial Statements of the Nestlé Group
As Statutory auditor we have audited the Consolidated Financial Statements (income statement, balance sheet, cash fl ow statement, statement of recognised income and expense, changes in equity and notes on pages 3 to 76) of the Nestlé Group for the year ended 31 December 2008.
Board of Directors’ responsibilityThe Board of Directors is responsible for the preparation and fair presentation of the Consolidated Financial Statements in accordance with International Financial Reporting Standards (IFRS) and the requirements of Swiss law. This responsibility includes designing, implementing and maintaining an internal control system relevant to the preparation and fair presentation of Consolidated Financial Statements that are free from material misstatement, whether due to fraud or error. The Board of Directors is further responsible for selecting and applying appropriate accounting policies and making accounting estimates that are reasonable in the circumstances.
Auditor’s responsibilityOur responsibility is to express an opinion on these Consolidated Financial Statements based on our audit. We conducted our audit in accordance with Swiss law and Swiss Auditing Standards and International Standards on Auditing. Those standards require that we plan and perform the audit to obtain reasonable assurance whether the Consolidated Financial Statements are free from material misstatement.
An audit involves performing procedures to obtain audit evidence about the amounts and disclosures in the Consolidated Financial Statements. The procedures selected depend on the auditor’s judgment, including the assessment of the risks of material misstatement of the
Consolidated Financial Statements, whether due to fraud or error. In making those risk assessments, the auditor considers the internal control system relevant to the enti-ty’s preparation and fair presentation of the Consolidated Financial Statements in order to design audit procedures that are appropriate in the circumstances, but not for the purpose of expressing an opinion on the effectiveness of the entity’s internal control system. An audit also includes evaluating the appropriateness of the accounting policies used and the reasonableness of accounting estimates made, as well as evaluating the overall presentation of the Consolidated Financial Statements. We believe that the audit evidence we have obtained is suffi cient and appro-priate to provide a basis for our audit opinion.
OpinionIn our opinion, the Consolidated Financial Statements for the year ended 31 December 2008 give a true and fair view of the fi nancial position, the result of operations and the cash fl ows in accordance with IFRS and comply with Swiss law.
Report on other legal requirementsWe confi rm that we meet the legal requirements on licens-ing according to the Auditor Oversight Act (AOA) and inde-pendence (article 728 CO and article 11 AOA) and that there are no circumstances incompatible with our independence.
In accordance with article 728a paragraph 1 item 3 CO and Swiss Auditing Standard 890, we confi rm that an internal control system exists, which has been designed for the preparation of Consolidated Financial Statements according to the instructions of the Board of Directors.
We recommend that the Consolidated Financial Statements submitted to you be approved.
Report of the Statutory auditoron the Consolidated Financial Statementsto the General Meeting of Nestlé S.A.
Mark Baillache Stéphane GardLicensed Audit Expert Licensed Audit ExpertAuditor in charge
Zurich, 18 February 2009

78 Consolidated Financial Statements of the Nestlé Group
In millions of CHF (except for per share data and personnel) 2008 2007
Results Sales 109 908 107 552
EBIT Earnings Before Interest, Taxes, restructuring and impairments 15 676 15 024
as % of sales 14.3% 14.0%
Taxes 3 787 3 416
Profi t for the period attributable to shareholders of the parent (Net profi t) 18 039 10 649
as % of sales 16.4% 9.9%
Total amount of dividend 5 127 (d) 4 573
Depreciation of property, plant and equipment 2 625 2 620
Balance sheet and Cash fl ow statement Current assets 33 048 35 770
of which liquid assets 7 131 9 496
Non-current assets 73 167 79 591 (c)
Total assets 106 215 115 361 (c)
Current liabilities 33 223 43 326
Non-current liabilities 18 076 17 259 (c)
Equity attributable to shareholders of the parent 50 774 52 627 (c)
Minority interests 4 142 2 149
Net fi nancial debt 14 596 21 174
Operating cash fl ow 10 763 13 439
as % of net fi nancial debt 73.7% 63.5%
Free cash fl ow (e) 5 033 8 231
Capital expenditure 4 869 4 971
as % of sales 4.4% 4.6%
Data per share (f) Weighted average number of shares outstanding 3 704 613 573 3 828 809 470
Basic earnings per share from continuing operations 4.87 2.78
Basic earnings per share from discontinued operations – –
Equity attributable to shareholders of the parent 13.71 13.75 (c)
Dividend 1.40 (d) 1.22
Pay-out ratio based on Total basic earnings per share 28.8% (d) 43.9%
Stock prices (high) 52.95 55.35
Stock prices (low) 38.02 42.65
Yield (g) 2.6/3.7 (d) 2.2/2.9
Market capitalisation 150 409 195 661
Number of personnel (in thousands) 283 276
Financial information – fi ve year review
(a) 2005 comparatives restated following fi rst application of the option of IAS 19 – Employee Benefi ts § 93A ss. and IFRIC 4 – Determining whether an Arrangement contains a Lease, as well as the decision to transfer the fresh cheese activities in Italy to Nestlé Nutrition.
(b) 2004 comparatives restated following fi rst application of IFRS 2 – Share-based Payment and for the discontinued operation following the an-nouncement made in December 2005 for the Chilled dairy activities in Europe.
(c) 2007 comparatives have been restated following fi rst application of IFRIC 14.
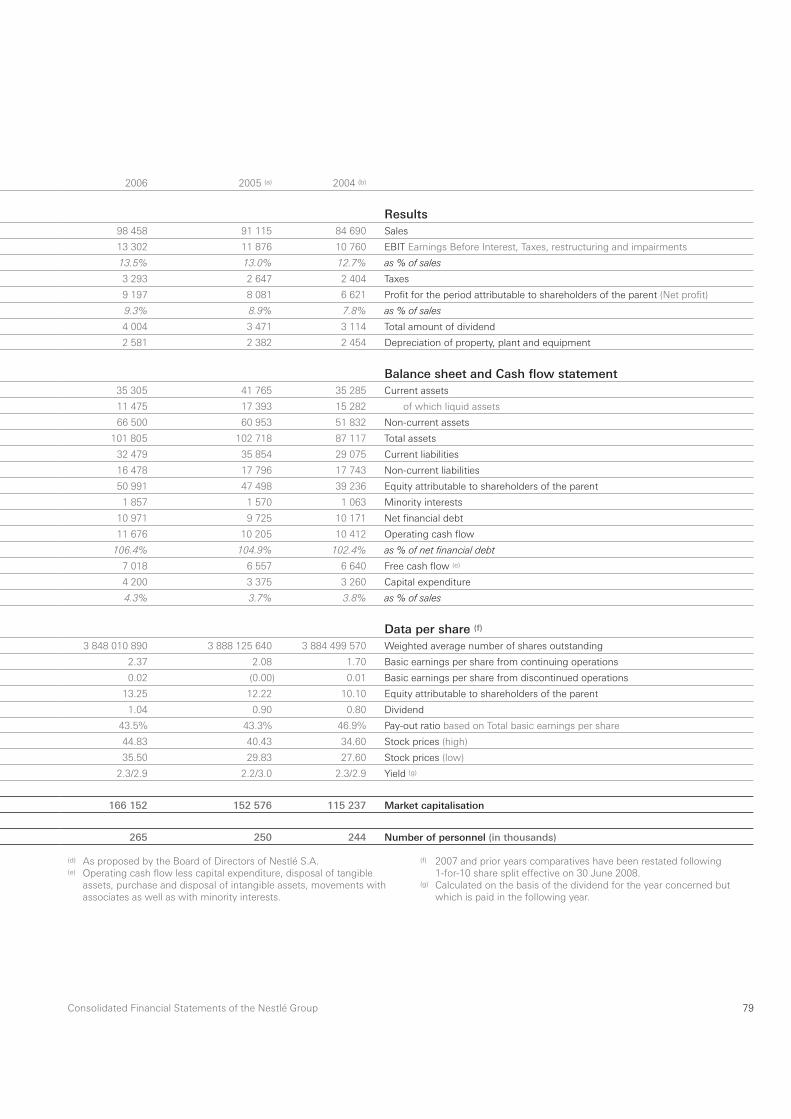
79Consolidated Financial Statements of the Nestlé Group
2006 2005 (a) 2004 (b)
Results 98 458 91 115 84 690 Sales
13 302 11 876 10 760 EBIT Earnings Before Interest, Taxes, restructuring and impairments
13.5% 13.0% 12.7% as % of sales
3 293 2 647 2 404 Taxes
9 197 8 081 6 621 Profi t for the period attributable to shareholders of the parent (Net profi t)
9.3% 8.9% 7.8% as % of sales
4 004 3 471 3 114 Total amount of dividend
2 581 2 382 2 454 Depreciation of property, plant and equipment
Balance sheet and Cash fl ow statement 35 305 41 765 35 285 Current assets
11 475 17 393 15 282 of which liquid assets
66 500 60 953 51 832 Non-current assets
101 805 102 718 87 117 Total assets
32 479 35 854 29 075 Current liabilities
16 478 17 796 17 743 Non-current liabilities
50 991 47 498 39 236 Equity attributable to shareholders of the parent
1 857 1 570 1 063 Minority interests
10 971 9 725 10 171 Net fi nancial debt
11 676 10 205 10 412 Operating cash fl ow
106.4% 104.9% 102.4% as % of net fi nancial debt
7 018 6 557 6 640 Free cash fl ow (e)
4 200 3 375 3 260 Capital expenditure
4.3% 3.7% 3.8% as % of sales
Data per share (f) 3 848 010 890 3 888 125 640 3 884 499 570 Weighted average number of shares outstanding
2.37 2.08 1.70 Basic earnings per share from continuing operations
0.02 (0.00) 0.01 Basic earnings per share from discontinued operations
13.25 12.22 10.10 Equity attributable to shareholders of the parent
1.04 0.90 0.80 Dividend
43.5% 43.3% 46.9% Pay-out ratio based on Total basic earnings per share
44.83 40.43 34.60 Stock prices (high)
35.50 29.83 27.60 Stock prices (low)
2.3/2.9 2.2/3.0 2.3/2.9 Yield (g)
166 152 152 576 115 237 Market capitalisation
265 250 244 Number of personnel (in thousands)
(d) As proposed by the Board of Directors of Nestlé S.A. (e) Operating cash fl ow less capital expenditure, disposal of tangible
assets, purchase and disposal of intangible assets, movements with associates as well as with minority interests.
(f) 2007 and prior years comparatives have been restated following 1-for-10 share split effective on 30 June 2008.
(g) Calculated on the basis of the dividend for the year concerned but which is paid in the following year.
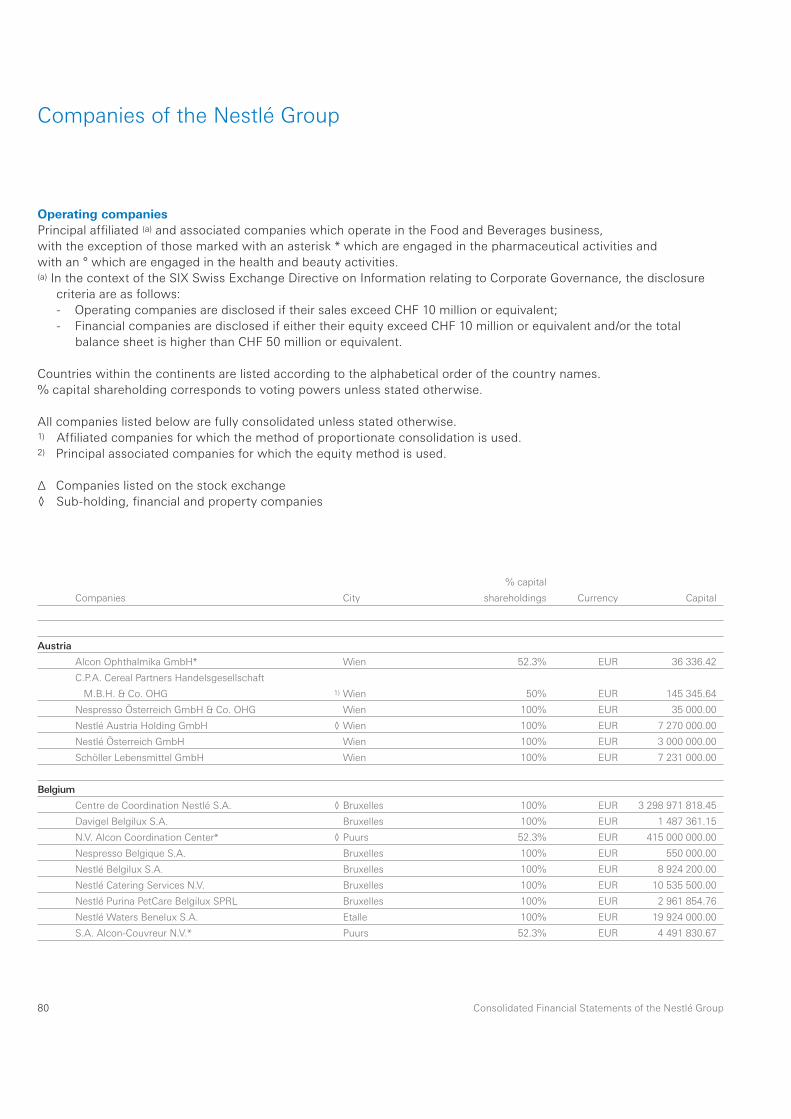
80 Consolidated Financial Statements of the Nestlé Group
Companies of the Nestlé Group
Operating companiesPrincipal affi liated (a) and associated companies which operate in the Food and Beverages business, with the exception of those marked with an asterisk * which are engaged in the pharmaceutical activities and with an ° which are engaged in the health and beauty activities.(a) In the context of the SIX Swiss Exchange Directive on Information relating to Corporate Governance, the disclosure
criteria are as follows:- Operating companies are disclosed if their sales exceed CHF 10 million or equivalent; - Financial companies are disclosed if either their equity exceed CHF 10 million or equivalent and/or the total
balance sheet is higher than CHF 50 million or equivalent.
Countries within the continents are listed according to the alphabetical order of the country names. % capital shareholding corresponds to voting powers unless stated otherwise.
All companies listed below are fully consolidated unless stated otherwise.1) Affi liated companies for which the method of proportionate consolidation is used. 2) Principal associated companies for which the equity method is used.
Δ Companies listed on the stock exchange◊ Sub-holding, fi nancial and property companies
Companies
% capital
City shareholdings Currency Capital
Austria
Alcon Ophthalmika GmbH* Wien 52.3% EUR 36 336.42
C.P.A. Cereal Partners Handelsgesellschaft
M.B.H. & Co. OHG 1) Wien 50% EUR 145 345.64
Nespresso Österreich GmbH & Co. OHG Wien 100% EUR 35 000.00
Nestlé Austria Holding GmbH ◊ Wien 100% EUR 7 270 000.00
Nestlé Österreich GmbH Wien 100% EUR 3 000 000.00
Schöller Lebensmittel GmbH Wien 100% EUR 7 231 000.00
Belgium
Centre de Coordination Nestlé S.A. ◊ Bruxelles 100% EUR 3 298 971 818.45
Davigel Belgilux S.A. Bruxelles 100% EUR 1 487 361.15
N.V. Alcon Coordination Center* ◊ Puurs 52.3% EUR 415 000 000.00
Nespresso Belgique S.A. Bruxelles 100% EUR 550 000.00
Nestlé Belgilux S.A. Bruxelles 100% EUR 8 924 200.00
Nestlé Catering Services N.V. Bruxelles 100% EUR 10 535 500.00
Nestlé Purina PetCare Belgilux SPRL Bruxelles 100% EUR 2 961 854.76
Nestlé Waters Benelux S.A. Etalle 100% EUR 19 924 000.00
S.A. Alcon-Couvreur N.V.* Puurs 52.3% EUR 4 491 830.67
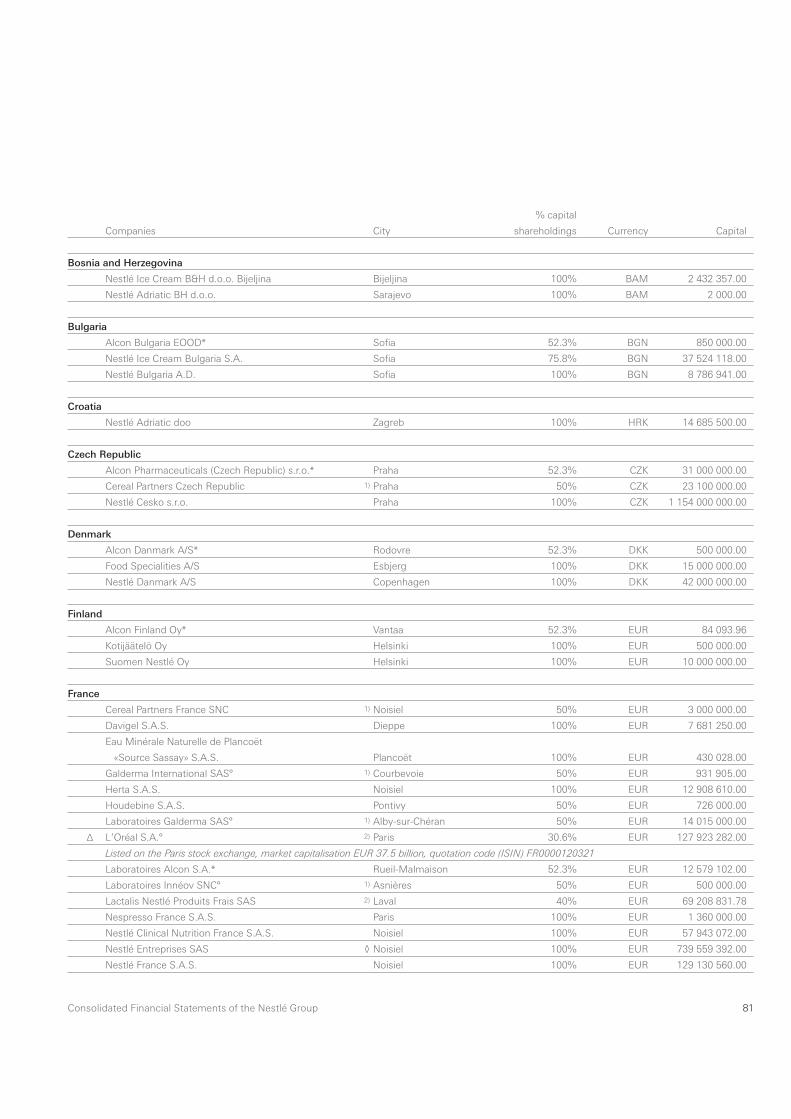
81Consolidated Financial Statements of the Nestlé Group
Companies
% capital
City shareholdings Currency Capital
Bosnia and Herzegovina
Nestlé Ice Cream B&H d.o.o. Bijeljina Bijeljina 100% BAM 2 432 357.00
Nestlé Adriatic BH d.o.o. Sarajevo 100% BAM 2 000.00
Bulgaria
Alcon Bulgaria EOOD* Sofi a 52.3% BGN 850 000.00
Nestlé Ice Cream Bulgaria S.A. Sofi a 75.8% BGN 37 524 118.00
Nestlé Bulgaria A.D. Sofi a 100% BGN 8 786 941.00
Croatia
Nestlé Adriatic doo Zagreb 100% HRK 14 685 500.00
Czech Republic
Alcon Pharmaceuticals (Czech Republic) s.r.o.* Praha 52.3% CZK 31 000 000.00
Cereal Partners Czech Republic 1) Praha 50% CZK 23 100 000.00
Nestlé Cesko s.r.o. Praha 100% CZK 1 154 000 000.00
Denmark
Alcon Danmark A/S* Rodovre 52.3% DKK 500 000.00
Food Specialities A/S Esbjerg 100% DKK 15 000 000.00
Nestlé Danmark A/S Copenhagen 100% DKK 42 000 000.00
Finland
Alcon Finland Oy* Vantaa 52.3% EUR 84 093.96
Kotijäätelö Oy Helsinki 100% EUR 500 000.00
Suomen Nestlé Oy Helsinki 100% EUR 10 000 000.00
France
Cereal Partners France SNC 1) Noisiel 50% EUR 3 000 000.00
Davigel S.A.S. Dieppe 100% EUR 7 681 250.00
Eau Minérale Naturelle de Plancoët
«Source Sassay» S.A.S.
Plancoët 100% EUR 430 028.00
Galderma International SAS° 1) Courbevoie 50% EUR 931 905.00
Herta S.A.S. Noisiel 100% EUR 12 908 610.00
Houdebine S.A.S. Pontivy 50% EUR 726 000.00
Laboratoires Galderma SAS° 1) Alby-sur-Chéran 50% EUR 14 015 000.00
Δ L’Oréal S.A.° 2) Paris 30.6% EUR 127 923 282.00
Listed on the Paris stock exchange, market capitalisation EUR 37.5 billion, quotation code (ISIN) FR0000120321
Laboratoires Alcon S.A.* Rueil-Malmaison 52.3% EUR 12 579 102.00
Laboratoires Innéov SNC° 1) Asnières 50% EUR 500 000.00
Lactalis Nestlé Produits Frais SAS 2) Laval 40% EUR 69 208 831.78
Nespresso France S.A.S. Paris 100% EUR 1 360 000.00
Nestlé Clinical Nutrition France S.A.S. Noisiel 100% EUR 57 943 072.00
Nestlé Entreprises SAS ◊ Noisiel 100% EUR 739 559 392.00
Nestlé France S.A.S. Noisiel 100% EUR 129 130 560.00

82 Consolidated Financial Statements of the Nestlé Group
Companies
% capital
City shareholdings Currency Capital
France (continued)
Nestlé Grand Froid S.A. Noisiel 100% EUR 6 674 000.00
Nestlé HomeCare S.A.S. Noisiel 100% EUR 1 077 860.00
Nestlé Purina PetCare France S.A.S. Rueil-Malmaison 100% EUR 21 091 872.00
Nestlé Waters Direct France S.A.S. Rungis 100% EUR 8 864 000.00
Nestlé Waters France S.A.S. ◊ Issy-les-Moulineaux 100% EUR 44 856 149.00
Nestlé Waters Marketing & Distribution Issy-les-Moulineaux 100% EUR 26 740 940.00
Nestlé Waters SAS ◊ Issy-les-Moulineaux 100% EUR 154 893 080.00
Nestlé Waters Supply Centre Issy-les-Moulineaux 100% EUR 2 577 000.00
Nestlé Waters Supply Est Issy-les-Moulineaux 100% EUR 17 539 660.00
Nestlé Waters Supply Sud Issy-les-Moulineaux 100% EUR 8 130 105.17
S.A. des Eaux Minérales de Ribeauvillé Ribeauvillé 100% EUR 846 595.13
Schöller Glaces et Desserts S.A.S. Vitry-sur-Seine 100% EUR 104 400.00
Société de Bouchages Emballages
Conditionnement Moderne 2) Lavardac 50% EUR 10 200 000.00
Société Française des Eaux Régionales ◊ Issy-les-Moulineaux 100% EUR 1 490 098.00
Société Immobilière de Noisiel ◊ Noisiel 100% EUR 22 753 550.00
Société Industrielle de Transformation de
Produits Agricoles «SITPA» S.A.S. Dijon 100% EUR 9 718 000.00
Germany
Alcon Pharma GmbH* Freiburg/Breisgau 52.3% EUR 511 291.88
Alois Dallmayr Kaffee OHG 2) München 25% EUR 10 250 000.00
C.P.D. Cereal Partners Deutschland GmbH & Co. OHG 1) Frankfurt am Main 50% EUR 511 291.88
Distributa Gesellschaft für Lebensmittel-Logistik mbH Wildau 70% EUR 515 000.00
Erlenbacher Backwaren GmbH Gross-Gerau 100% EUR 2 582 024.00
FUCATUS Vermietungsgesellschaft mbH & Co.
Objekt Mainz OHG
Düsseldorf 100% EUR 71 785.39
Galderma Laboratorium GmbH° 1) Düsseldorf 50% EUR 800 000.00
Herta GmbH Herten 100% EUR 51 129.19
Nespresso Deutschland GmbH Düsseldorf 100% EUR 25 000.00
Nestlé Deutschland AG Frankfurt am Main 100% EUR 214 266 628.49
Nestlé Pensionsfond AG ◊ Biessenhofen 100% EUR 3 000 000.00
Nestlé Purina PetCare Deutschland GmbH Euskirchen 100% EUR 30 000.00
Nestlé Schöller GmbH & Co. KG Nürnberg 100% EUR 60 000 000.00
Nestlé Schöller Produktions GmbH Nürnberg 100% EUR 30 000.00
Nestlé Unternehmungen Deutschland GmbH ◊ Frankfurt am Main 100% EUR 1 000 000.00
Nestlé Versorgungskasse GmbH ◊ Frankfurt am Main 100% EUR 60 000.00
Nestlé Waters Deutschland AG Mainz 100% EUR 10 566 000.00
Nestlé Waters Direct Deutschland GmbH Neuss 100% EUR 31 000.00
PowerBar Europe GmbH München 100% EUR 25 000.00
Schöller Holding GmbH & Co. KG ◊ Nürnberg 100% EUR 167 669 861.39
Trinks GmbH 2) Goslar 34% EUR 2 360 000.00
Trinks Süd GmbH 2) München 34% EUR 260 000.00

83Consolidated Financial Statements of the Nestlé Group
Companies
% capital
City shareholdings Currency Capital
Germany (continued)
Wagner Tiefkühlprodukte GmbH Nonnweiler 49% EUR 511 291.88
Nestlé acquired control, further fi nancial investments subject to regulatory review
Δ WaveLight AG* Erlangen 48.7% EUR 6 577 026.00
Listed on the Xetra stock exchange, market capitalisation EUR 0.1 billion, quotation code (ISIN) DE0005125603
WCO Kinderkost GmbH Conow Conow 100% EUR 26 000.00
Greece
Alcon Laboratories Hellas Commercial
and Industrial S.A.*
Maroussi 52.3% EUR 1 657 189.05
C.P. Hellas E.E.I.G. 1) Maroussi 50% EUR 146 735.14
Makan Food Trade S.A. Acharnes-Attica 100% EUR 1 246 400.00
Nestlé Hellas Ice Cream S.A. Tavros-Attica 100% EUR 12 655 458.00
Nestlé Hellas S.A. Maroussi 100% EUR 18 656 726.00
Hungary
Alcon Hungary Pharmaceuticals Trading LLC* Budapest 52.3% HUF 75 000 000.00
Cereal Partners Hungária Kft. 1) Budapest 50% HUF 22 000 000.00
Kékkúti Ásvànyvíz Rt. Budapest 100% HUF 238 326 000.00
Nestlé Hungária Kft. Budapest 100% HUF 6 000 000 000.00
Italy
Acqua Claudia s.r.l. Milano 99.6% EUR 7 910 000.00
Alcon Italia S.p.A.* Milano 52.3% EUR 1 300 000.00
Fastlog S.p.A. Milano 99.6% EUR 154 935.00
Galderma Italia S.p.A.° 1) Milano 50% EUR 112 000.00
Koiné S.p.A. Madone (Bergamo) 50.9% EUR 258 230.00
Nespresso Italiana S.p.A. Milano 100% EUR 250 000.00
Nestlé ltaliana S.p.A. Milano 100% EUR 25 582 492.00
Nestlé Vera s.r.l. Castronovo di Sicilia, Palermo 100% EUR 5 000 000.00
Sanpellegrino S.p.A. Milano 99.6% EUR 58 742 145.00
Kazakhstan
Nestle Food Kazakhstan LLP Almaty 100% KZT 91 900.00
Lithuania
UAB “Nestlé Baltics” Vilnius 100% LTL 110 000.00
Luxemburg
Balkan Ice Cream Holding S.A. ◊ Luxemburg 100% EUR 52 425 000.00
Compagnie Financière du Haut-Rhin ◊ Luxemburg 100% EUR 105 200 000.00
Nestlé Finance International ◊ Luxemburg 100% EUR 440 000.00
Nestlé Waters Powwow European Investments Sàrl ◊ Luxemburg 100% EUR 12 525.00
NTC-Europe S.A. ◊ Luxemburg 100% EUR 3 565 000.00

84 Consolidated Financial Statements of the Nestlé Group
Companies
% capital
City shareholdings Currency Capital
Macedonia
Nestlé Ice Cream A.D. Skopje Skopje 100% MKD 100 301 200.00
Nestlé Adriatik Makedonija d.o.o.e.l. Skopje-Karpos 100% MKD 306 700.00
Malta
Nestlé Malta Ltd Lija 100% EUR 116 469.00
Netherlands
Alcon Nederland B.V.* Gorinchem 52.3% EUR 18 151.21
East Springs International N.V. ◊ Amsterdam 100% EUR 25 370 000.00
Nespresso Nederland B.V. Amsterdam 100% EUR 680 670.32
Nestlé Nederland B.V. Amsterdam 100% EUR 68 067 032.41
Nestlé Purina PetCare Nederland B.V. Zwijndrecht 100% EUR 18 152.00
Nestlé Waters Direct Netherlands B.V. Zoetermeer 100% EUR 1 606 430.00
Norway
A/S Nestlé Norge Sandvika 100% NOK 81 250 000.00
Alcon Norge AS* Oslo 52.3% NOK 100 000.00
Hjem-IS A/S Oslo 100% NOK 2 250 000.00
Kaffeknappen Norge AS Oslo 50% NOK 100 000.00
Poland
Alcon Polska Sp. z o.o.* Warszawa 52.3% PLN 750 000.00
Cereal Partners Poland Torun-Pacifi c Sp. z o.o. 1) Torun 50% PLN 14 572 838.00
Nestlé Polska S.A. Warszawa 100% PLN 50 000 000.00
Nestlé Waters Polska S.A. Warszawa 100% PLN 46 100 000.00
Z.L. Uzdrowisko Naleczów S.A. Naleczów 99.9% PLN 10 634 160.00
Alima-Gerber S.A. Warszawa 100% PLN 57 075 370.00
Portugal
Alcon Portugal-Produtos e Equipamentos
Oftalmologicos, Ltda.* Paço d’Arcos 52.3% EUR 4 500 000.00
Cereal Associados Portugal A.E.I.E. 1) Oeiras 50% EUR 99 759.58
Nestlé Portugal S.A. Linda-a-Velha 100% EUR 30 000 000.00
Nestlé Waters Direct Portugal - Comérico e
Distribuiçao de Produtos Alimentares S.A. S. João da Talha 100% EUR 1 000 000.00
Prolacto-Lacticinios de Sao Miguel S.A. Ponta Delgada 100% EUR 700 000.00
Republic of Ireland
Alcon Lab. Ireland Limited* Cork 52.3% EUR 192 501.00
Nestlé (lreland) Ltd Dublin 100% EUR 3 530 600.00
Romania
Alcon Romania SRL* Bucharest 52.3% RON 3 291 000.00
Nestlé Ice Cream Romania S.R.L. Clinceni 100% RON 49 547 943.00
Nestlé Romania SRL Bucharest 100% RON 30 783 700.00
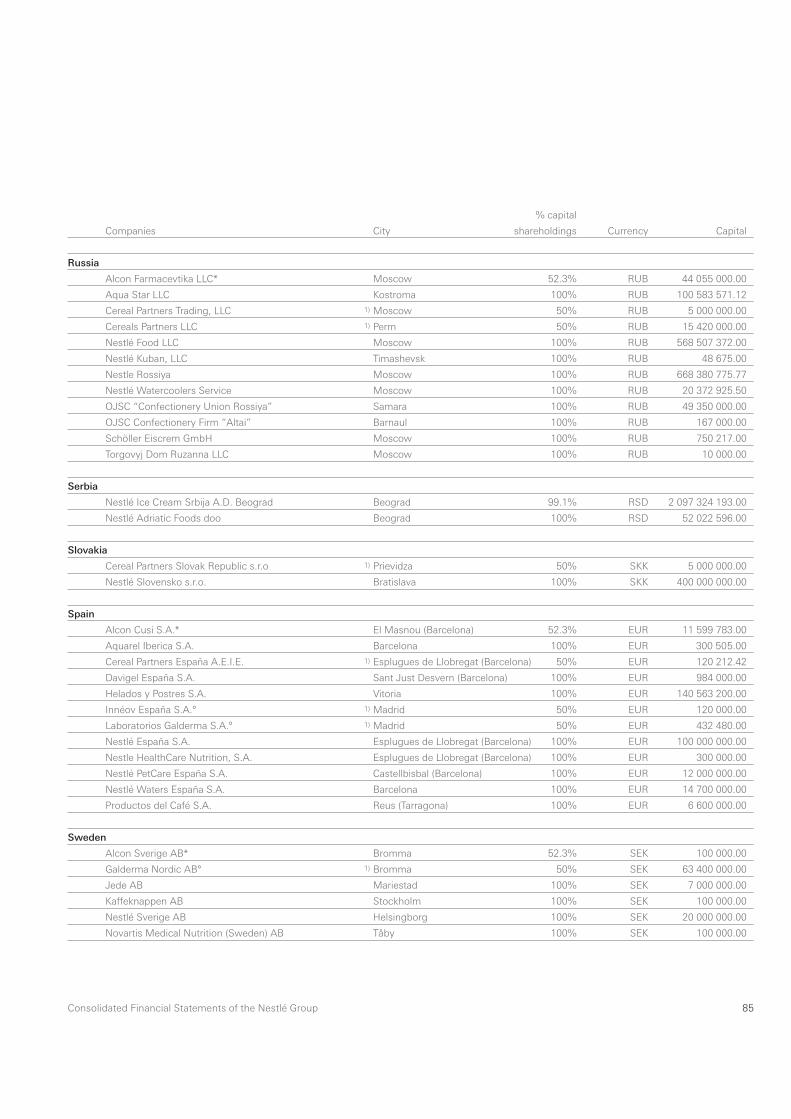
85Consolidated Financial Statements of the Nestlé Group
Companies
% capital
City shareholdings Currency Capital
Russia
Alcon Farmacevtika LLC* Moscow 52.3% RUB 44 055 000.00
Aqua Star LLC Kostroma 100% RUB 100 583 571.12
Cereal Partners Trading, LLC 1) Moscow 50% RUB 5 000 000.00
Cereals Partners LLC 1) Perm 50% RUB 15 420 000.00
Nestlé Food LLC Moscow 100% RUB 568 507 372.00
Nestlé Kuban, LLC Timashevsk 100% RUB 48 675.00
Nestle Rossiya Moscow 100% RUB 668 380 775.77
Nestlé Watercoolers Service Moscow 100% RUB 20 372 925.50
OJSC “Confectionery Union Rossiya” Samara 100% RUB 49 350 000.00
OJSC Confectionery Firm “Altai” Barnaul 100% RUB 167 000.00
Schöller Eiscrem GmbH Moscow 100% RUB 750 217.00
Torgovyj Dom Ruzanna LLC Moscow 100% RUB 10 000.00
Serbia
Nestlé Ice Cream Srbija A.D. Beograd Beograd 99.1% RSD 2 097 324 193.00
Nestlé Adriatic Foods doo Beograd 100% RSD 52 022 596.00
Slovakia
Cereal Partners Slovak Republic s.r.o 1) Prievidza 50% SKK 5 000 000.00
Nestlé Slovensko s.r.o. Bratislava 100% SKK 400 000 000.00
Spain
Alcon Cusi S.A.* El Masnou (Barcelona) 52.3% EUR 11 599 783.00
Aquarel Iberica S.A. Barcelona 100% EUR 300 505.00
Cereal Partners España A.E.I.E. 1) Esplugues de Llobregat (Barcelona) 50% EUR 120 212.42
Davigel España S.A. Sant Just Desvern (Barcelona) 100% EUR 984 000.00
Helados y Postres S.A. Vitoria 100% EUR 140 563 200.00
Innéov España S.A.° 1) Madrid 50% EUR 120 000.00
Laboratorios Galderma S.A.° 1) Madrid 50% EUR 432 480.00
Nestlé España S.A. Esplugues de Llobregat (Barcelona) 100% EUR 100 000 000.00
Nestle HealthCare Nutrition, S.A. Esplugues de Llobregat (Barcelona) 100% EUR 300 000.00
Nestlé PetCare España S.A. Castellbisbal (Barcelona) 100% EUR 12 000 000.00
Nestlé Waters España S.A. Barcelona 100% EUR 14 700 000.00
Productos del Café S.A. Reus (Tarragona) 100% EUR 6 600 000.00
Sweden
Alcon Sverige AB* Bromma 52.3% SEK 100 000.00
Galderma Nordic AB° 1) Bromma 50% SEK 63 400 000.00
Jede AB Mariestad 100% SEK 7 000 000.00
Kaffeknappen AB Stockholm 100% SEK 100 000.00
Nestlé Sverige AB Helsingborg 100% SEK 20 000 000.00
Novartis Medical Nutrition (Sweden) AB Tåby 100% SEK 100 000.00
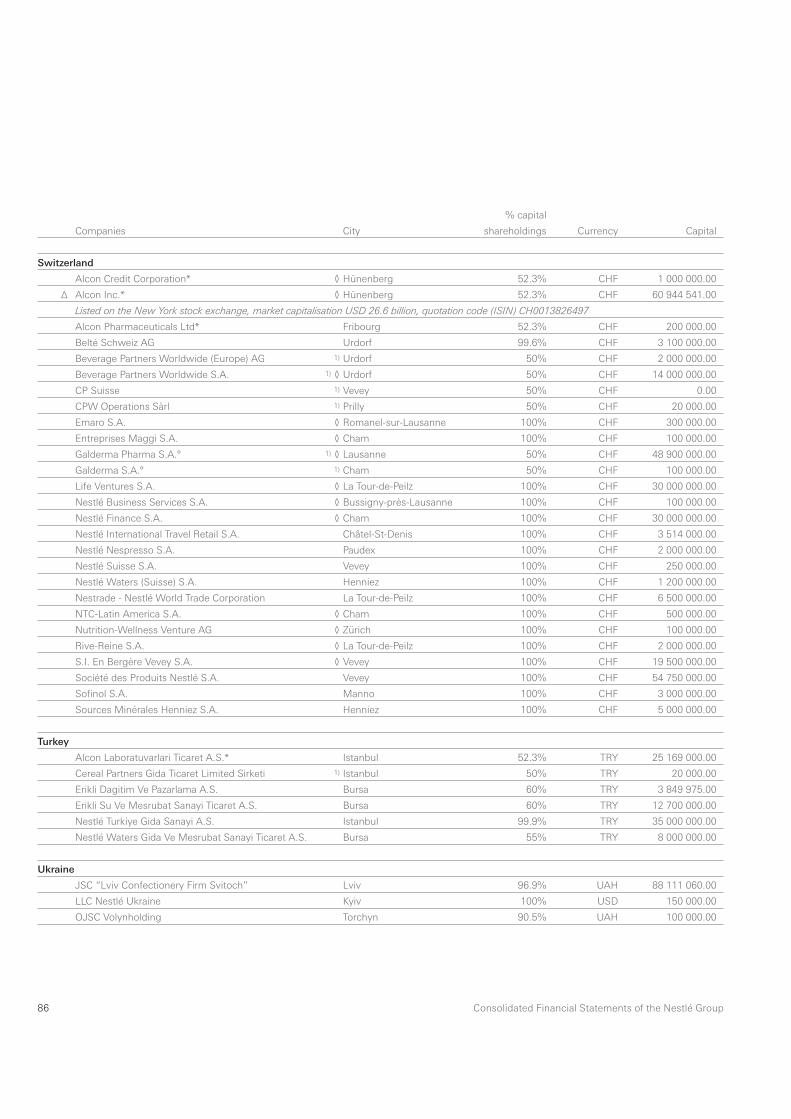
86 Consolidated Financial Statements of the Nestlé Group
Companies
% capital
City shareholdings Currency Capital
Switzerland
Alcon Credit Corporation* ◊ Hünenberg 52.3% CHF 1 000 000.00
Δ Alcon Inc.* ◊ Hünenberg 52.3% CHF 60 944 541.00
Listed on the New York stock exchange, market capitalisation USD 26.6 billion, quotation code (ISIN) CH0013826497
Alcon Pharmaceuticals Ltd* Fribourg 52.3% CHF 200 000.00
Belté Schweiz AG Urdorf 99.6% CHF 3 100 000.00
Beverage Partners Worldwide (Europe) AG 1) Urdorf 50% CHF 2 000 000.00
Beverage Partners Worldwide S.A. 1) ◊ Urdorf 50% CHF 14 000 000.00
CP Suisse 1) Vevey 50% CHF 0.00
CPW Operations Sàrl 1) Prilly 50% CHF 20 000.00
Emaro S.A. ◊ Romanel-sur-Lausanne 100% CHF 300 000.00
Entreprises Maggi S.A. ◊ Cham 100% CHF 100 000.00
Galderma Pharma S.A.° 1) ◊ Lausanne 50% CHF 48 900 000.00
Galderma S.A.° 1) Cham 50% CHF 100 000.00
Life Ventures S.A. ◊ La Tour-de-Peilz 100% CHF 30 000 000.00
Nestlé Business Services S.A. ◊ Bussigny-près-Lausanne 100% CHF 100 000.00
Nestlé Finance S.A. ◊ Cham 100% CHF 30 000 000.00
Nestlé International Travel Retail S.A. Châtel-St-Denis 100% CHF 3 514 000.00
Nestlé Nespresso S.A. Paudex 100% CHF 2 000 000.00
Nestlé Suisse S.A. Vevey 100% CHF 250 000.00
Nestlé Waters (Suisse) S.A. Henniez 100% CHF 1 200 000.00
Nestrade - Nestlé World Trade Corporation La Tour-de-Peilz 100% CHF 6 500 000.00
NTC-Latin America S.A. ◊ Cham 100% CHF 500 000.00
Nutrition-Wellness Venture AG ◊ Zürich 100% CHF 100 000.00
Rive-Reine S.A. ◊ La Tour-de-Peilz 100% CHF 2 000 000.00
S.I. En Bergère Vevey S.A. ◊ Vevey 100% CHF 19 500 000.00
Société des Produits Nestlé S.A. Vevey 100% CHF 54 750 000.00
Sofi nol S.A. Manno 100% CHF 3 000 000.00
Sources Minérales Henniez S.A. Henniez 100% CHF 5 000 000.00
Turkey
Alcon Laboratuvarlari Ticaret A.S.* Istanbul 52.3% TRY 25 169 000.00
Cereal Partners Gida Ticaret Limited Sirketi 1) Istanbul 50% TRY 20 000.00
Erikli Dagitim Ve Pazarlama A.S. Bursa 60% TRY 3 849 975.00
Erikli Su Ve Mesrubat Sanayi Ticaret A.S. Bursa 60% TRY 12 700 000.00
Nestlé Turkiye Gida Sanayi A.S. Istanbul 99.9% TRY 35 000 000.00
Nestlé Waters Gida Ve Mesrubat Sanayi Ticaret A.S. Bursa 55% TRY 8 000 000.00
Ukraine
JSC “Lviv Confectionery Firm Svitoch” Lviv 96.9% UAH 88 111 060.00
LLC Nestlé Ukraine Kyiv 100% USD 150 000.00
OJSC Volynholding Torchyn 90.5% UAH 100 000.00
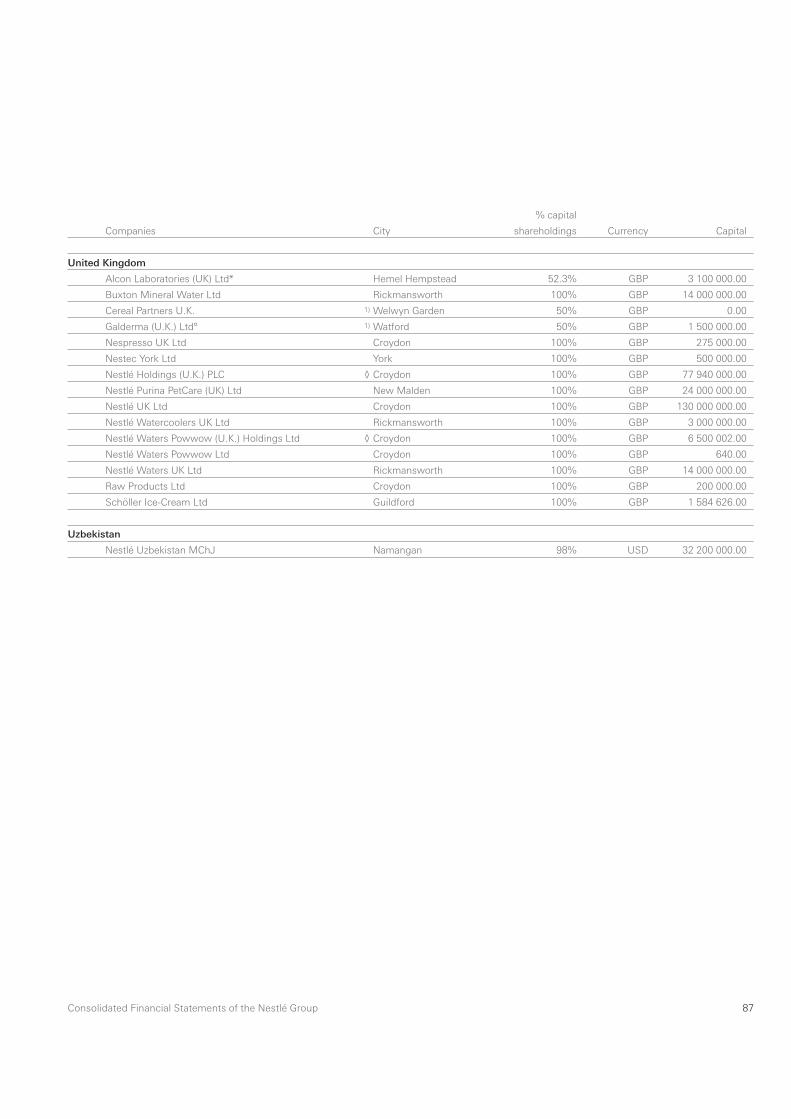
87Consolidated Financial Statements of the Nestlé Group
Companies
% capital
City shareholdings Currency Capital
United Kingdom
Alcon Laboratories (UK) Ltd* Hemel Hempstead 52.3% GBP 3 100 000.00
Buxton Mineral Water Ltd Rickmansworth 100% GBP 14 000 000.00
Cereal Partners U.K. 1) Welwyn Garden 50% GBP 0.00
Galderma (U.K.) Ltd° 1) Watford 50% GBP 1 500 000.00
Nespresso UK Ltd Croydon 100% GBP 275 000.00
Nestec York Ltd York 100% GBP 500 000.00
Nestlé Holdings (U.K.) PLC ◊ Croydon 100% GBP 77 940 000.00
Nestlé Purina PetCare (UK) Ltd New Malden 100% GBP 24 000 000.00
Nestlé UK Ltd Croydon 100% GBP 130 000 000.00
Nestlé Watercoolers UK Ltd Rickmansworth 100% GBP 3 000 000.00
Nestlé Waters Powwow (U.K.) Holdings Ltd ◊ Croydon 100% GBP 6 500 002.00
Nestlé Waters Powwow Ltd Croydon 100% GBP 640.00
Nestlé Waters UK Ltd Rickmansworth 100% GBP 14 000 000.00
Raw Products Ltd Croydon 100% GBP 200 000.00
Schöller Ice-Cream Ltd Guildford 100% GBP 1 584 626.00
Uzbekistan
Nestlé Uzbekistan MChJ Namangan 98% USD 32 200 000.00
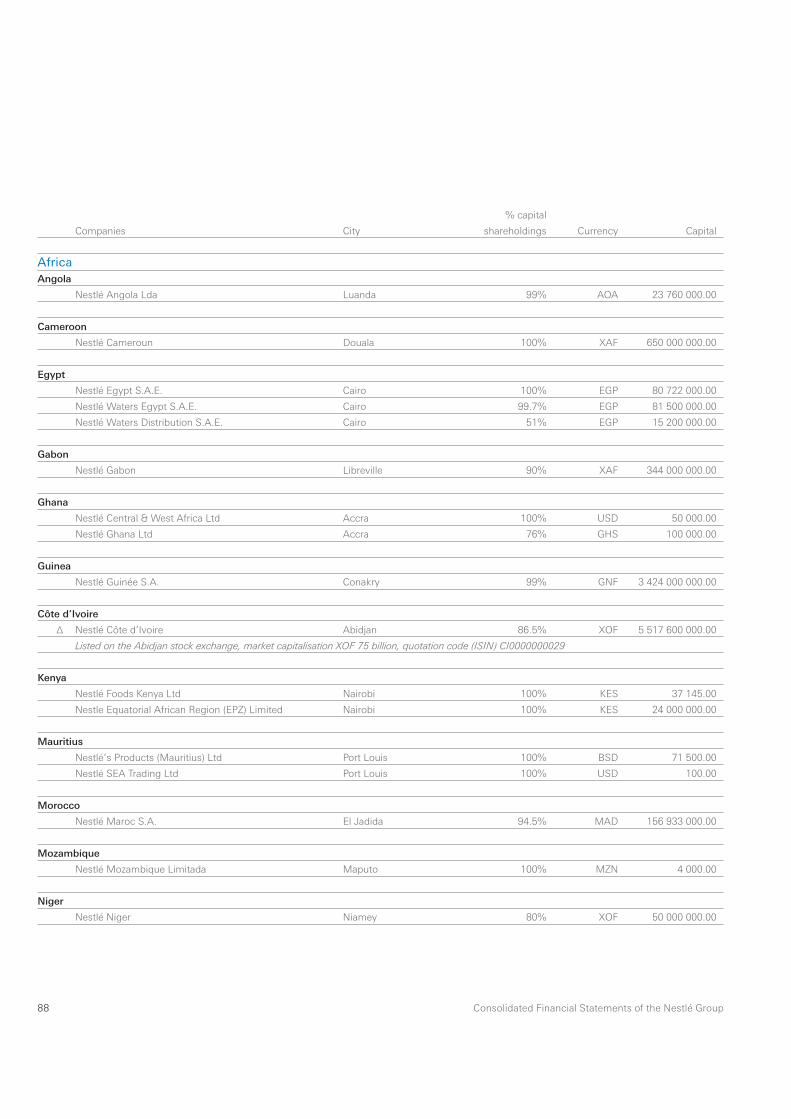
88 Consolidated Financial Statements of the Nestlé Group
Companies
% capital
City shareholdings Currency Capital
AfricaAngola
Nestlé Angola Lda Luanda 99% AOA 23 760 000.00
Cameroon
Nestlé Cameroun Douala 100% XAF 650 000 000.00
Egypt
Nestlé Egypt S.A.E. Cairo 100% EGP 80 722 000.00
Nestlé Waters Egypt S.A.E. Cairo 99.7% EGP 81 500 000.00
Nestlé Waters Distribution S.A.E. Cairo 51% EGP 15 200 000.00
Gabon
Nestlé Gabon Libreville 90% XAF 344 000 000.00
Ghana
Nestlé Central & West Africa Ltd Accra 100% USD 50 000.00
Nestlé Ghana Ltd Accra 76% GHS 100 000.00
Guinea
Nestlé Guinée S.A. Conakry 99% GNF 3 424 000 000.00
Côte d’Ivoire
Δ Nestlé Côte d’Ivoire Abidjan 86.5% XOF 5 517 600 000.00
Listed on the Abidjan stock exchange, market capitalisation XOF 75 billion, quotation code (ISIN) CI0000000029
Kenya
Nestlé Foods Kenya Ltd Nairobi 100% KES 37 145.00
Nestle Equatorial African Region (EPZ) Limited Nairobi 100% KES 24 000 000.00
Mauritius
Nestlé’s Products (Mauritius) Ltd Port Louis 100% BSD 71 500.00
Nestlé SEA Trading Ltd Port Louis 100% USD 100.00
Morocco
Nestlé Maroc S.A. El Jadida 94.5% MAD 156 933 000.00
Mozambique
Nestlé Mozambique Limitada Maputo 100% MZN 4 000.00
Niger
Nestlé Niger Niamey 80% XOF 50 000 000.00
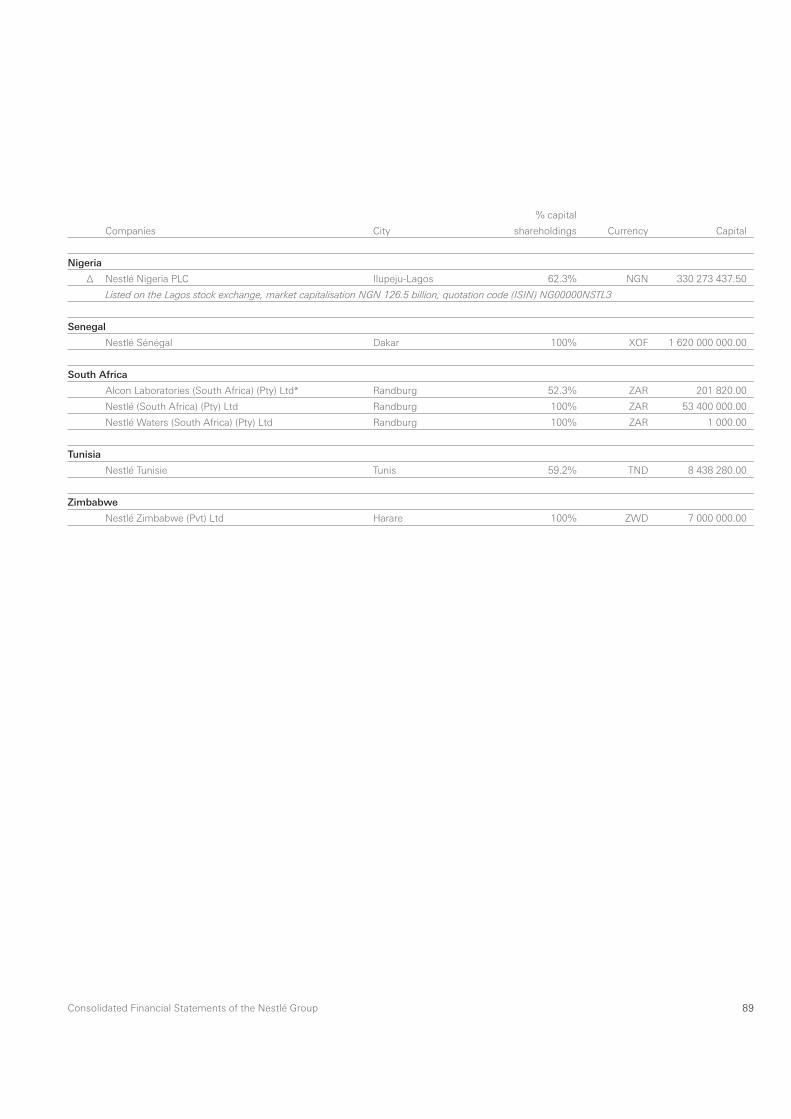
89Consolidated Financial Statements of the Nestlé Group
Companies
% capital
City shareholdings Currency Capital
Nigeria
Δ Nestlé Nigeria PLC Ilupeju-Lagos 62.3% NGN 330 273 437.50
Listed on the Lagos stock exchange, market capitalisation NGN 126.5 billion, quotation code (ISIN) NG00000NSTL3
Senegal
Nestlé Sénégal Dakar 100% XOF 1 620 000 000.00
South Africa
Alcon Laboratories (South Africa) (Pty) Ltd* Randburg 52.3% ZAR 201 820.00
Nestlé (South Africa) (Pty) Ltd Randburg 100% ZAR 53 400 000.00
Nestlé Waters (South Africa) (Pty) Ltd Randburg 100% ZAR 1 000.00
Tunisia
Nestlé Tunisie Tunis 59.2% TND 8 438 280.00
Zimbabwe
Nestlé Zimbabwe (Pvt) Ltd Harare 100% ZWD 7 000 000.00

90 Consolidated Financial Statements of the Nestlé Group
Companies
% capital
City shareholdings Currency Capital
AmericasArgentina
Alcon Laboratorios Argentina S.A.* Buenos Aires 52.3% ARS 978 145.00
Dairy Partners Americas Argentina S.A. 1) Buenos Aires 50% ARS 98 800.00
Dairy Partners Americas Manufacturing Argentina S.A. 1) Buenos Aires 50% ARS 150 000.00
Eco de Los Andes S.A. Buenos Aires 50.9% ARS 92 524 285.00
Nestlé Argentina S.A. Buenos Aires 99.7% ARS 9 000 000.00
Nestlé Waters Argentina Buenos Aires 100% ARS 2 000 000.00
Union Sancor C.U.L./DPAA Union Transitoria
de Empresas 2) Buenos Aires 25% ARS 1 000 000.00
Barbados
Lacven Corporation 1) ◊ Barbados 50% USD 65 179 195.00
Bermuda
Centram Holdings Ltd ◊ Hamilton 100% USD 12 000.00
DPA Manufacturing Holding Ltda 1) ◊ Hamilton 50% USD 23 639 630.00
Trinity River Insurance Co. Ltd* ◊ Hamilton 52.3% USD 120 000.00
Trinity River International Investments (Bermuda) Ltd* ◊ Hamilton 52.3% USD 12 000.00
Bolivia
Nestlé Bolivia S.A. Santa Cruz de la Sierra 100% BOB 191 900.00
Brazil
Alcon Laboratorios do Brasil Ltda.* São Paulo 52.3% BRL 7 729 167.00
Chocolates Garoto S.A. Vila Velha-ES 100% BRL 161 450 000.00
CPW Brasil Ltda. 1) Cacapava/São Paulo 50% BRL 7 885 520.00
Dairy Partners Americas Brasil Ltda. 1) São Paulo 50% BRL 27 606 368.00
Dairy Partners Americas Manufacturing Brasil Ltda. 1) Feira de Santana 50% BRL 100 000.00
Galderma Brasil Limitada° 1) São Paulo 50% BRL 19 741 602.00
Nestec BDG Alimentos e Bebidas Ltda. São Paulo 100% BRL 1 000.00
Nestlé Brasil Ltda. São Paulo 100% BRL 468 208 970.00
Nestlé Nordeste Alimentos e Bebidas Ltda. Feira de Santana 100% BRL 12 713 641.00
Nestlé Waters Brasil - Bebidas e Alimentos Ltda. São Paulo 100% BRL 87 248 341.00
Ralston Purina do Brasil Ltda. Ribeirão Preto 77% BRL 79 473 771.00
Socopal Soc Coml de Corretagem de Seguros e Part. Ltda. São Paulo 100% BRL 2 155 600.00
Canada
Alcon Canada Inc.* Mississauga (Ontario) 52.3% CAD 5 002 500.00
Galderma Canada Inc.° 1) Thornhill (Ontario) 50% CAD 100.00
Galderma Production Canada Inc.° 1) Baie D’Urfé (Québec) 50% CAD 100.00

91Consolidated Financial Statements of the Nestlé Group
Companies
% capital
City shareholdings Currency Capital
Canada (continued)
Jenny Craig Weight Loss Centres (Canada) Company Halifax (Nova Scotia) 100% CAD 10 000.00
Nestlé Canada Inc. Toronto (Ontario) 100% CAD 29 478 000.00
Nestlé Capital Canada Ltd ◊ Toronto (Ontario) 100% CAD 1 010.00
Nestlé Globe Inc. Toronto (Ontario) 100% CAD 106 000 100.00
Chile
Aguas CCU - Nestlé Chile S.A. 2) Santiago de Chile 20% CLP 10 532 023 856.00
Alcon Laboratorios Chile Ltda.* Santiago de Chile 52.3% CLP 2 021 238 071.00
Cereales CPW Chile Ltda. 1) Santiago de Chile 50% CLP 3 026 156 114.00
Gerber Chile S.A. Santiago de Chile 100% CLP 3 959 016 618.00
Nestlé Chile S.A. Santiago de Chile 99.5% CLP 11 832 926 051.00
Nestlé Waters Chile S.A. Santiago de Chile 100% CLP 16 474 259 000.00
Comercializadora de Productos Nestlé S.A. (CPN) Santiago de Chile 100% CLP 1 000 000.00
Colombia
Comestibles La Rosa S.A. Bogotá 100% COP 126 397 400.00
Dairy Partners Americas Manufacturing
Colombia Ltda. 1) Bogotá 50% COP 200 000 000.00
Laboratorios Alcon de Colombia, S.A.* Bogotá 52.3% COP 20 872 000.00
Nestlé de Colombia S.A. Bogotá 100% COP 1 291 305 400.00
Nestlé Purina PetCare de Colombia S.A. Bogotá 100% COP 17 030 000 000.00
Costa Rica
Compañía Nestlé Costa Rica S.A. Barreal de Heredia 100% CRC 36 682 500.00
Gerber Ingredients, Sociedad Anónima San José 100% CRC 10 000.00
Cuba
Coralac S.A. La Habana 60% USD 6 350 000.00
Los Portales S.A. La Habana 50% USD 24 110 000.00
Dominican Republic
Nestlé Dominicana S.A. Santo Domingo 97.6% DOP 48 500 000.00
Ecuador
Ecuajugos S.A. 1) Quito 50% USD 232 000.00
Industrial Surindu S.A. Quito 100% USD 32 216 012.00
Nestlé Ecuador S.A. Quito 100% USD 1 776 760.00
Guatemala
Nestlé Guatemala S.A. Mixco 100% GTQ 23 460 600.00
NZMP Guatemala S.A. Mixco 99.9% GTQ 1 968 800.00

92 Consolidated Financial Statements of the Nestlé Group
Companies
% capital
City shareholdings Currency Capital
Honduras
Nestlé Hondureña S.A. Tegucigalpa 100% PAB 200 000.00
Jamaica
Nestlé Jamaica Ltd Kingston 100% JMD 49 200 000.00
Mexico
Alcon Laboratorios, S.A. de C.V.* México, D.F. 52.3% MXN 5 915 300.00
Cereal Partners México, S.A. de C.V. 1) México, D.F. 50% MXN 500 000.00
CPW México S. de R.L. de C.V. 1) México, D.F. 50% MXN 43 138 000.00
Fundación Purina, S.C. ◊ México, D.F. 50% MXN 0.00
Galderma México, S.A. de C.V.° 1) México, D.F. 50% MXN 2 385 000.00
Manantiales La Asunción, S.A.P.I. de C.V. México, D.F. 51% MXN 377 827 492.00
Marcas Nestlé, S.A. de C.V. México, D.F. 100% MXN 500 050 000.00
Nescalín, S.A. de C.V. ◊ México, D.F. 100% MXN 445 826 740.00
Nestlé Distribución, S.A. de C.V. México, D.F. 100% MXN 130 050 000.00
Nestlé México, S.A. de C.V. México, D.F. 100% MXN 606 532 730.00
Productos Gerber, S.A. de C.V. México, D.F. 100% MXN 5 252 440.00
Ralston Purina Holdings México, S.A. de C.V. ◊ México, D.F. 100% MXN 60 283 210.00
Ralston Purina México, S.A. de C.V. México, D.F. 100% MXN 9 257 111.80
Waters Partners Services México, S.A.P.I. de C.V. México, D.F. 51% MXN 600 000.00
Nicaragua
Compañia Centroamericana de Productos Lácteos, S.A. Matagalpa 92.4% NIO 10 294 900.00
Nestlé Nicaragua, S.A. Managua 100% USD 150 000.00
Panama
Alcon Centroamérica, S.A.* Panamá City 52.3% USD 1 000.00
Food Products (Holdings), S.A. ◊ Panamá City 100% PAB 286 000.00
Lacteos de Centroamérica, S.A. Panamá City 100% USD 1 500 000.00
Nestlé Caribbean, Inc. Panamá City 100% PAB 100 000.00
Nestlé Panamá, S.A. Panamá City 100% PAB 17 500 000.00
Nestlé Products (Thailand), Inc. Panamá City 100% PAB 1 000 000.00
Unilac, Inc. ◊ Panamá City 100% USD 750 000.00
Paraguay
Nestlé Paraguay S.A. Asunción 100% PYG 100 000 000.00
Peru
Alcon Pharmaceutical del Perú, S.A.* Lima 52.3% PEN 3 261 865.00
Nestlé Marcas Perú, S.A.C. Lima 100% PEN 1 000.00
Nestlé Perú, S.A. Lima 97.9% PEN 120 676 240.00

93Consolidated Financial Statements of the Nestlé Group
Companies
% capital
City shareholdings Currency Capital
Puerto Rico
Alcon (Puerto Rico), Inc.* Cataño 52.3% USD 100.00
Gerber Products Company of Puerto Rico, Inc. Carolina 100% USD 100 000.00
Nestlé Puerto Rico, Inc. Cataño 100% USD 4 600 000.00
Payco Foods Corporation Bayamon 100% USD 9 260 000.00
SWIRL Corporation Guaynabo 100% USD 17 999 445.00
Salvador
Nestlé El Salvador S.A. de C.V. San Salvador 100% SVC 39 000 000.00
Trinidad and Tobago
Nestlé Caribbean, Inc. Valsayn 100% USD 100 000.00
Nestlé Trinidad and Tobago Ltd Valsayn 100% TTD 35 540 000.00
United States
Alcon Capital Corporation* ◊ Wilmington (Delaware) 52.3% USD 1 000.00
Alcon Holdings, Inc.* ◊ Wilmington (Delaware) 52.3% USD 10.00
Alcon Laboratories, Inc.* Wilmington (Delaware) 52.3% USD 1 000.00
Alcon RefractiveHorizons, LLC* ◊ Wilmington (Delaware) 52.3% USD 10.00
Beverage Partners Worldwide (North America) 1) Wilmington (Delaware) 50% USD 0.00
Checkerboard Holding Company, Inc. ◊ Wilmington (Delaware) 100% USD 1 001.00
Dreyer’s Grand Ice Cream Holdings, Inc. Oakland (California) 100% USD 10.00
Dreyer’s Grand Ice Cream, Inc. Oakland (California) 100% USD 1.00
Falcon Pharmaceuticals, Ltd* Wilmington (Delaware) 52.3% USD 10.00
Galderma Laboratories, Inc.° 1) Fort Worth (Texas) 50% USD 981.00
Gerber Life Insurance Company New York 100% USD 148 500 000.00
Gerber Products Company Fremont (Michigan) 100% USD 0.00
Jenny Craig Holdings, Inc. ◊ Carlsbad (California) 100% USD 3 000.00
Jenny Craig, Inc. ◊ Carlsbad (California) 100% USD 3 000.00
Jenny Craig Operations, Inc. Carlsbad (California) 100% USD 0.00
Jenny Craig Weight Loss Centres, Inc. ◊ Carlsbad (California) 100% USD 100.00
Nespresso USA, Inc. Wilmington (Delaware) 100% USD 1 000.00
Nestlé Capital Corporation ◊ Glendale (California) 100% USD 1 000 000.00
Nestlé Holdings, Inc. ◊ Norwalk (Connecticut) 100% USD 100 000.00
Nestlé Prepared Foods Company Solon (Ohio) 100% USD 476 760.00
Nestlé Purina PetCare Company St. Louis (Missouri) 100% USD 1 000.00
Nestlé Transportation Company ◊ Glendale (California) 100% USD 100.00
Nestlé USA, Inc. Glendale (California) 100% USD 1 000.00
Nestlé Waters North America Holdings, Inc. ◊ Greenwich (Connecticut) 100% USD 0.00
Nestlé Waters North America, Inc. Wilmington (Delaware) 100% USD 0.00
The Haagen-Dazs Shoppe Company, Inc. ◊ Minneapolis (Minnesota) 100% USD 0.00
The Stouffer Corporation ◊ Solon (Ohio) 100% USD 0.00
TSC Holdings, Inc. ◊ Glendale (California) 100% USD 100 000.00

94 Consolidated Financial Statements of the Nestlé Group
Companies
% capital
City shareholdings Currency Capital
Uruguay
Nestlé del Uruguay S.A. Montevideo 100% UYU 200 000.00
Venezuela
Alcon Pharmaceutical, C.A.* Caracas 52.3% VEF 2 366.00
Cadipro Milk Products, C.A. Caracas 100% VEF 9 505 123.00
Corporacíon Inlaca, C.A. 1) Caracas 50% VEF 6 584 590.00
Nestlé Venezuela, S.A. Caracas 100% VEF 516 590.00
Laboratorios Galderma Venezuela, S.A.° 1) Caracas 50% VEF 5 000.00

95Consolidated Financial Statements of the Nestlé Group
Companies
% capital
City shareholdings Currency Capital
AsiaBangladesh
Nestlé Bangladesh Ltd Dhaka 100% BDT 100 000 000.00
Greater China Region
Alcon (China) Ophthalmic Product Co., Ltd* Beijing 52.3% USD 2 164 635.00
Alcon Hong Kong Limited* Hong Kong 52.3% HKD 77 000.00
Alcon Pharmaceuticals Taiwan Limited* Taipei 52.3% CHF 50 000.00
Beverage Partners Worldwide (Pacifi c) Limited 1) Hong Kong 50% HKD 1 000 000.00
Guangzhou Refrigerated Foods Limited Guangzhou 96.4% CNY 122 000 000.00
Nestlé (China) Limited Beijing 100% CNY 250 000 000.00
Nestlé Dairy Farm Guangzhou Limited Guangzhou 95% CNY 268 000 000.00
Nestlé Dongguan Limited Dongguan 100% CNY 472 000 000.00
Nestlé Hong Kong Limited Hong Kong 100% HKD 250 000 000.00
Nestlé Hulunbeir Limited Erguna 100% CNY 55 000 000.00
Nestlé Purina PetCare Tianjin Limited Tianjin 100% CNY 40 000 000.00
Nestlé Qingdao Limited Qingdao 100% CNY 640 000 000.00
Nestlé Shanghai Limited Shanghai 95% CNY 200 000 000.00
Nestlé Shuangcheng Limited Shuangcheng 97% CNY 435 000 000.00
Nestlé Sources Shanghai Limited Shanghai 100% CNY 211 000 000.00
Nestlé Taiwan Limited Taipei 100% TWD 300 000 000.00
Nestlé Tianjin Limited Tianjin 100% CNY 785 000 000.00
Shanghai Fuller Foods Co. Limited Shanghai 100% CNY 384 000 000.00
Shanghai Nestlé Product Services Limited Shanghai 97% CNY 83 000 000.00
Shanghai Totole Food Limited Shanghai 80% USD 7 800 000.00
Sichuan Haoji Food Co. Limited Chengdu 80% CNY 80 000 000.00
India
Alcon Laboratories (India) Private Limited* Bangalore 52.3% INR 29 953 380.00
Δ Nestlé India Ltd New Delhi 61.9% INR 964 157 160.00
Listed on the Mumbai stock exchange, market capitalisation INR 140.1 billion, quotation code (ISIN) INE239A01016
Speciality Foods India Pvt Ltd New Delhi 100% INR 140 000 000.00
Indonesia
P.T. Cereal Partners Indonesia 1) Jakarta 50% IDR 956 500 000.00
P.T. Nestlé Indofood Citarasa Indonesia 1) Jakarta 50% IDR 50 000 000 000.00
P.T. Nestlé Indonesia Jakarta 90.2% IDR 60 000 000 000.00
Iran
Nestlé Iran Private Joint Stock Company Tehran 89.7% IRR 358 538 000 000.00
Israel
Δ OSEM Investments Ltd Shoham 53.8% ILS 110 644 444.00
Listed on the Tel-Aviv stock exchange, market capitalisation ILS 5 billion, quotation code (ISIN) IL0003040149

96 Consolidated Financial Statements of the Nestlé Group
Companies
% capital
City shareholdings Currency Capital
Japan
Alcon Japan Ltd* Tokyo 52.3% JPY 500 000 000.00
Nestlé Confectionery Ltd Kobe 100% JPY 10 000 000.00
Nestlé Japan Ltd Ibaraki 100% JPY 20 000 000 000.00
Nestlé Manufacturing Ltd Kobe 100% JPY 10 000 000.00
Nestlé Purina PetCare Ltd Kobe 100% JPY 20 000 000.00
Nestlé Nutrition K.K. Kobe 100% JPY 100 000 000.00
Jordan
Ghadeer Mineral Water Co. Ltd Amman 75% JOD 1 785 000.00
Nestlé Jordan Trading Co. Ltd Amman 87% JOD 410 000.00
Kingdom of Bahrain
Nestlé Bahrain Trading WLL Manama 49% BHD 200 000.00
Kuwait
Nestlé Kuwait General Trading Co. W.L.L. Safat 49% KWD 300 000.00
Lebanon
Société des Eaux Minérales Libanaises S.A.L. Hazmieh 100% LBP 1 610 000 000.00
Société pour l’Exportation des Produits Nestlé S.A. Beyrouth 100% CHF 1 750 000.00
SOHAT Distribution S.A.L. Hazmieh 100% LBP 160 000 000.00
Malaysia
Alcon Laboratories (Malaysia) Sdn. Bhd.* Kuala Lumpur 52.3% MYR 190 000.00
Cereal Partners (Malaysia) Sdn. Bhd. 1) Petaling Jaya 50% MYR 1 025 000.00
Δ Nestlé (Malaysia) Bhd. Petaling Jaya 72.6% MYR 234 500 000.00
Listed on the Kuala Lumpur stock exchange, market capitalisation MYR 6.3 billion, quotation code (ISIN) MYL4707OO005
Nestlé Asean (Malaysia) Sdn. Bhd. Petaling Jaya 72.6% MYR 42 000 000.00
Nestlé Manufacturing (Malaysia) Sdn. Bhd. Petaling Jaya 72.6% MYR 32 500 000.00
Nestlé Products Sdn. Bhd. Petaling Jaya 72.6% MYR 25 000 000.00
Purina PetCare (Malaysia) Sdn. Bhd. Petaling Jaya 100% MYR 1 100 000.00
Oman
Nestlé Oman Trading LLC Muscat 49% OMR 300 000.00
Pakistan
Δ Nestlé Pakistan Ltd Lahore 59% PKR 452 731 000.00
Listed on the Karachi and the Lahore stock exchange, market capitalisation PKR 60.3 billion, quotation code (ISIN) PK0025101012

97Consolidated Financial Statements of the Nestlé Group
Companies
% capital
City shareholdings Currency Capital
Philippines
Alcon Laboratories (Philippines), Inc.* Manila 52.3% PHP 16 526 000.00
CPW Philippines, Inc. 1) Makati City 50% PHP 7 500 000.00
Nestlé Philippines, Inc. Makati City 100% PHP 2 300 927 200.00
Penpro, Inc. Makati City 40% PHP 630 000 000.00
Qatar
Nestlé Qatar Trading LLC Doha 49% QAR 1 680 000.00
Al Manhal Qatar Doha 51% QAR 5 500 000.00
Republic of Korea
Alcon Korea Ltd* Seoul 52.3% KRW 3 800 000 000.00
Galderma Korea Ltd° 1) Seoul 50% KRW 500 000 000.00
Nestlé Korea Ltd Seoul 100% KRW 18 202 060 000.00
Pulmuone Waters Co. Ltd Seoul 100% KRW 3 778 760 000.00
Saudi Arabia
Al Anhar Water Factory Co. Ltd Jeddah 64% SAR 7 500 000.00
Al Manhal Water Factory Co. Ltd Riyadh 64% SAR 7 000 000.00
Saudi Food Industries Co. Ltd Jeddah 51% SAR 51 000 000.00
SHAS Company for Water Services Ltd Riyadh 75% SAR 13 500 000.00
Springs Water Factory Co. Ltd Dammam 75% SAR 5 000 000.00
Nestle Water Factory Co. Ltd Riyadh 64% SAR 15 000 000.00
Singapore
Alcon Pte Ltd* Singapore 52.3% SGD 164 000.00
Galderma South East Asia Ltd° 1) Singapore 50% SGD 1 387 000.00
Nestlé Singapore (Pte) Ltd Singapore 100% SGD 1 000 000.00
Nestlé TC Asia Pacifi c Pte Ltd Singapore 100% JPY 10 000 000 000.00
Sri Lanka
Δ Nestlé Lanka PLC Colombo 90.8% LKR 537 254 630.00
Listed on the Colombo stock exchange, market capitalisation LKR 14 billion, quotation code (ISIN) LK0128N00005
Syria
Nestlé Syria Ltd Damascus 100% SYP 800 000 000.00
Société pour l’Exportation des Produits Nestlé S.A. Damascus 100% CHF 1 750 000.00
Thailand
Alcon Laboratories (Thailand) Ltd* Bangkok 77.3% THB 2 100 000.00
Nestlé (Thai) Ltd Bangkok 100% THB 880 000 000.00
Perrier Vittel (Thailand) Ltd Bangkok 100% THB 235 000 000.00
Quality Coffee Products Ltd Bangkok 50% THB 400 000 000.00

98 Consolidated Financial Statements of the Nestlé Group
Companies
% capital
City shareholdings Currency Capital
United Arab Emirates
CP Middle East FZCO 1) Jebel Ali Free Zone Dubai 50% AED 600 000.00
Nestlé Dubai LLC Dubai 49% AED 2 000 000.00
Nestlé Middle East FZE Dubai 100% AED 3 000 000.00
Nestlé Treasury Centre - Middle East & Africa Ltd. ◊ Dubai 100% USD 8 750 500 000.00
Nestlé Waters Middle East Investments FZCO Dubai 100% AED 600 000.00
Vietnam
La Vie Limited Liability Company Long An 65% USD 2 663 400.00
Nestlé Vietnam Ltd Bien Hoa 100% USD 54 598 000.00

99Consolidated Financial Statements of the Nestlé Group
Companies
% capital
City shareholdings Currency Capital
OceaniaAustralia
Alcon Laboratories (Australia) Pty Ltd* Frenchs Forest 52.3% AUD 2 550 000.00
Cereal Partners Australia Pty Limited 1) Rhodes 50% AUD 107 800 000.00
Galderma Australia Pty Ltd° 1) Frenchs Forest 50% AUD 2 700 100.00
Nestlé Australia Ltd Rhodes 100% AUD 274 000 000.00
Supercoat Holdings Australia Ltd North Ryde 100% AUD 55 814 174.00
Supercoat PetCare Pty Limited North Ryde 100% AUD 2.00
Fiji
Nestlé (Fiji) Ltd Ba 100% FJD 3 000 000.00
French Polynesia
Nestlé Polynésie S.A. Papeete 100% XPF 5 000 000.00
New Caledonia
Nestlé Nouvelle-Calédonie S.A. Noumea 100% XPF 250 000 000.00
New Zealand
Nestlé New Zealand Limited Auckland 100% NZD 300 000.00
Papua New Guinea
Nestlé (PNG) Ltd Lae 100% PGK 11 850 000.00

100 Consolidated Financial Statements of the Nestlé Group
Companies City
Technical assistance, research and development companiesTechnical Assistance TA
Research & Development centres R&D
Product Technology Centres PTC
Switzerland
Nestec S.A. TA Vevey
Technical, scientifi c, commercial and business assistance company whose units, specialised in all areas of the business, supply permanent know-
how and assistance to operating companies in the Group within the framework of licence and equivalent contracts. It is also responsible for all
scientifi c research and technological development, which it undertakes itself or through affl iated companies.
The companies and units involved are:
Australia
CPW R&D Rutherglen 1)R&D Rutherglen
France
Centre de Recherche Nestlé R&D Tours
Galderma R&D Centre° 1)R&D Biot
Nestlé Product Technology Centre PTC Beauvais
Nestlé Product Technology Centre PTC Lisieux
Nestlé Purina PetCare R&D Centre R&D Amiens
Nestlé Waters Product Technology Centre PTC Vittel
Germany
Nestlé Product Technology Centre PTC Singen
Greater China Region
Nestlé R&D Centre R&D Beijing
Nestlé R&D Centre R&D Shanghai
Israel
Nestlé R&D Centre R&D Sderot
Italy
Casa Buitoni R&D Sansepolcro
Mexico
Nestlé R&D Centre R&D Queretaro
Poland
Nestlé R&D Centre R&D Rzeszow
Singapore
Nestlé R&D Centre R&D Singapore

101Consolidated Financial Statements of the Nestlé Group
Companies City
Switzerland
Nestlé Research Centre R&D Lausanne
Nestlé Product Technology Centre PTC Konolfi ngen
Nestlé Product Technology Centre PTC Orbe
Nestlé Professional Beverage Centre R&D Orbe
United Kingdom
CPW R&D Welwyn Garden City 1)R&D Welwyn Garden City
Nestlé Product Technology Centre PTC York
United States
Alcon R&D Centre* R&D Fort Worth (Texas)
Galderma R&D Centre° 1)R&D Cranbury (New Jersey)
Nestlé Purina PetCare Product Technology Centre PTC St. Joseph (Missouri)
Nestlé Purina PetCare Product Technology Centre PTC St. Louis (Missouri)
Nestlé R&D Centre R&D Fremont (Michigan)
Nestlé Product Technology Centre PTC Marysville (Ohio)
Nestlé R&D Centre R&D Minneapolis (Minnesota)
Nestlé R&D Centre R&D Solon (Ohio)

102 Consolidated Financial Statements of the Nestlé Group

103142nd Financial Statements of Nestlé S.A.
142nd Financial Statements of Nestlé S.A.
13. Loans to Group companies 110 14. Own shares 111 15. Intangible assets 111 16. Tangible fi xed assets 111 17. Short-term payables 112 18. Long-term payables 112 19. Provisions 112 20. Share capital 113 21. Changes in equity 113 22. Reserve for own shares 114 23. Contingencies 11424. Risk assessment 11425. Additional information 115Proposed appropriation of profi t 120Report of the statutory auditors 121
Income statement for the year ended 31 December 2008 104
Balance sheet as at 31 December 2008 105Notes to the annual accounts 106 1. Accounting policies 106 2. Income from Group companies 108 3. Financial income 108 4. Profi t on disposal of fi xed assets 108 5. Investment write downs 108 6. Administration and other expenses 108 7. Financial expense 109 8. Taxes 109 9. Liquid assets 109 10. Receivables 109 11. Financial assets 110 12. Participations in Group companies 110
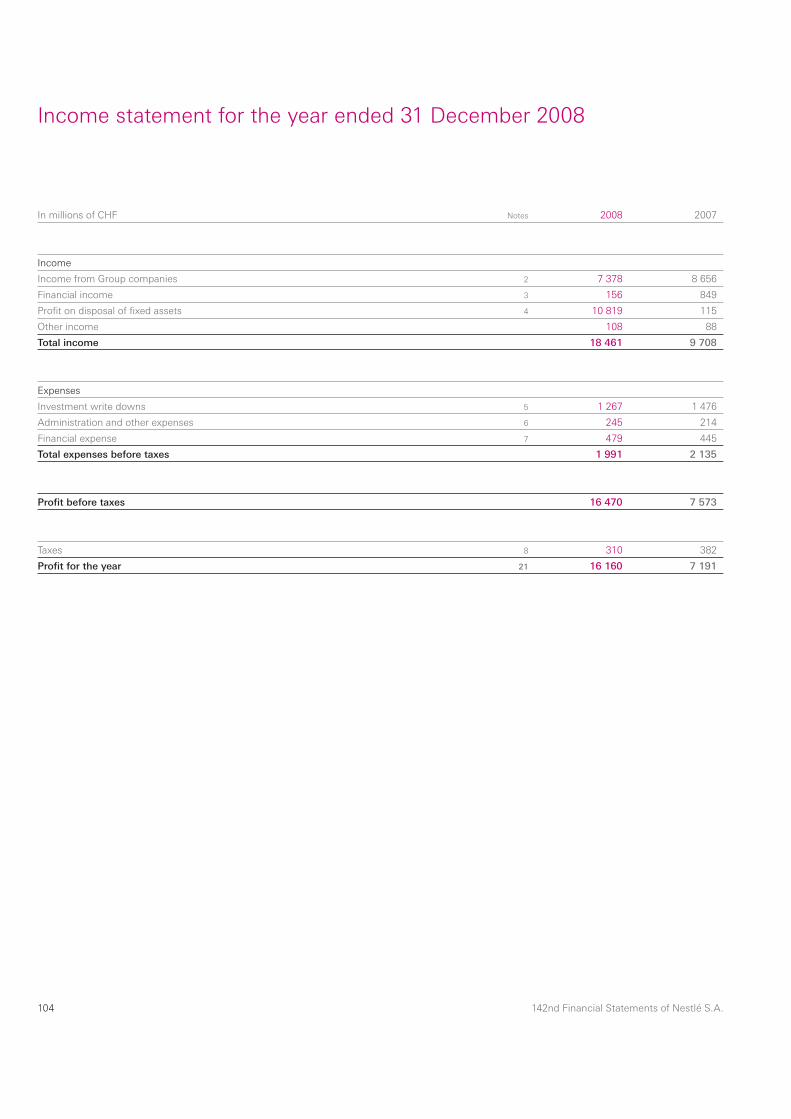
104 142nd Financial Statements of Nestlé S.A.
Income statement for the year ended 31 December 2008
In millions of CHF Notes 2008 2007
Income
Income from Group companies 2 7 378 8 656
Financial income 3 156 849
Profi t on disposal of fi xed assets 4 10 819 115
Other income 108 88
Total income 18 461 9 708
Expenses
Investment write downs 5 1 267 1 476
Administration and other expenses 6 245 214
Financial expense 7 479 445
Total expenses before taxes 1 991 2 135
Profi t before taxes 16 470 7 573
Taxes 8 310 382
Profi t for the year 21 16 160 7 191

105142nd Financial Statements of Nestlé S.A.
Balance sheet as at 31 December 2008before appropriations
In millions of CHF Notes 2008 2007
Assets
Current assets
Liquid assets 9 823 1 033
Receivables 10 1 953 1 151
Prepayments and accrued income 126 169
Total current assets 2 902 2 353
Fixed assets
Financial assets 11 39 898 36 294
Intangible assets 15 1 262 1 378
Tangible fi xed assets 16 – –
Total fi xed assets 41 160 37 672
Total assets 44 062 40 025
Liabilities and equity
Liabilities
Short-term payables 17 5 426 7 644
Accruals and deferred income 218 114
Long-term payables 18 160 236
Provisions 19 656 737
Total liabilities 6 460 8 731
Equity
Share capital 20/21 383 393
Legal reserves 21 11 655 9 681
Special reserve 21 8 673 12 799
Profi t brought forward 21 731 1 230
Profi t for the year 21 16 160 7 191
Total equity 37 602 31 294
Total liabilities and equity 44 062 40 025

106 142nd Financial Statements of Nestlé S.A.
Notes to the annual accounts
Income statementNot currently transferable income is recognised only upon receipt. Dividends paid out of pre-acquisition profi ts are not included under income from Group companies; instead they are credited against the carrying value ofthe participation.
In accordance with Swiss law and the Company’s Articles of Association, dividends are treated as an appro-priation of profi t in the year in which they are ratifi ed at the Annual General Meeting rather than as an appropriation of profi t in the year to which they relate.
TaxesThis caption includes taxes on profi t, capital and withhold-ing taxes on transfers from Group companies.
Financial assetsThe carrying value of participations and loans comprises the cost of investment, excluding the incidental costs of acquisition, less any write downs.
Participations located in countries where the political, economic or monetary situation might be consideredto carry a greater than normal level of risk are carriedat a nominal value of one franc.
Participations and loans are written down on a conservative basis, taking into account the profi tability of the company concerned.
Marketable securities are valued at the lower of cost and market value.
Own shares held to cover option rights in favour of members of the Group’s Management are carriedat exercise price if lower than cost. Own shares held for trading purposes are carried at cost as are own shares ear-marked to cover other Long-Term Incentive Plans. Own shares repurchased for the Share Buy-Back Programme are carried at cost. All gains and losses on own shares are recorded in the income statement.
1. Accounting policies
GeneralNestlé S.A. (the Company) is the ultimate holding com-pany of the Nestlé Group which comprises subsidiaries, associated companies and joint ventures throughout the world. The accounts are prepared in accordance with accounting principles required by Swiss law. They are pre-pared under the historical cost convention and on the accruals basis.
Foreign currency translationTransactions in foreign currencies are recorded at the rate of exchange at the date of the transaction or, if hedged forward, at the rate of exchange under the related forward contract. Non-monetary assets and liabilities are carried at historical rates. Monetary assets and liabilities in foreign currencies are translated at year-end rates. Any resulting exchange differences are included in the respective income statement captions depending upon the nature of the underlying transactions. The aggregate unrealised exchange difference is calculated by reference to original transaction date exchange rates and includes hedging transactions. Where this gives rise to a net loss, it is charged to the income statement whilst a net gain is deferred.
HedgingThe Company uses forward foreign exchange contracts, options, fi nancial futures and currency swaps to hedge foreign currency fl ows and positions. Unrealised foreign exchange differences on hedging instruments are matched and accounted for with those on the underlying asset or liability. Long-term loans, in foreign currencies, used to fi nance investments in participations are generally not hedged.
The Company also uses interest rate swaps to manage interest rate risk. The swaps are accounted for at fair value at each balance sheet date and changes in the market value are recorded in the income statement.

107142nd Financial Statements of Nestlé S.A.
Intangible assetsTrademarks and other industrial property rights are written off on acquisition or exceptionally over a longer period. In the Consolidated Financial Statements of the Nestlé Group this item has a different treatment.
Tangible fi xed assetsThe Company owns land and buildings which have been depreciated in the past to one franc. Offi ce furniture and equipment are fully depreciated on acquisition.
ProvisionsProvisions recognise contingencies which may arise and which have been prudently provided. A provision for unin-sured risks is constituted to cover general risks not insured with third parties, such as consequential loss. Provisions for Swiss taxes are made on the basis of the Company’s taxable capital, reserves and profi t for the year. A general provision is maintained to cover possible foreign taxesliabilities.
Employee benefi tsEmployees are eligible for retirement benefi ts under a defi ned contribution plan with a retirement pension objective expressed as a percentage of the base salary. Those benefi ts are mainly provided through separate pen-sion funds.
Prepayments and accrued incomePrepayments and accrued income comprise payments made in advance relating to the following year, and income relating to the current year which will not be received until after the balance sheet date (such as inter-est receivable on loans or deposits). Revaluation gains on open forward exchange contracts at year-end rates, as well as the result of the valuation of interest rate swaps, are also included in this caption.
Accruals and deferred incomeAccruals and deferred income comprise expenses relating to the current year which will not be paid until afterthe balance sheet date and income received in advance, relating to the following year. Net revaluation losses on open forward exchange contracts at year-end rates, as well as the result of the valuation of interest rate swaps, are also included in this caption.

108 142nd Financial Statements of Nestlé S.A.
2. Income from Group companies
3. Financial income
In millions of CHF 2008 2007
Net result on loans to Group companies – 667
Other fi nancial income 156 182
156 849
5. Investment write downs
In millions of CHF 2008 2007
Participations and loans 238 284
Trademarks and other industrial property rights 1 029 1 192
1 267 1 476
6. Administration and other expenses
In millions of CHF 2008 2007
Salaries and welfare expenses 94 99
Other expenses 151 115
245 214
This represents dividends of the current and prior years and other net income from Group companies.
This represents mainly the net gains realised on the sale of 24,8% of Alcon Inc to Novartis, as well as the sale of trade-marks and other industrial property rights previously written down.
The write down of trademarks and other industrial prop-erty rights in 2008 includes one third of the amount paid in 2007 in respect of Gerber and Novartis Medical Nutrition (CHF 690 million), as well as Gerber North America’s Intellectual Property Rights acquired in 2008 (CHF 286 million).
In 2007, trademarks linked to the acquisitions of Gerber and Novartis Medical Nutrition were amortised by one third of the amount paid during the period (CHF 690 mil-lion) and Jenny Craig’s trademark had been fully amortised (CHF 340 million).
4. Profi t on disposal of fi xed assets
Substantial unrealised exchange losses on long-term loans to Group companies were recorded as a result of the strengthening of the Swiss Franc against most foreign currencies. The interest income arising on these loans partially compensated these exchange losses. The net charge is included under “Financial expense” in Note 7.

109142nd Financial Statements of Nestlé S.A.
7. Financial expense
In millions of CHF 2008 2007
Net result on loans from Group companies (see Note 3) 475 277
Other fi nancial expenses 4 168
479 445
9. Liquid assets
In millions of CHF 2008 2007
Cash and cash equivalents 20 373
Marketable securities 803 660
823 1 033
10. Receivables
In millions of CHF 2008 2007
Amounts owed by Group companies (current accounts) 1 886 1 072
Other receivables 67 79
1 953 1 151
This includes withholding taxes on income from foreign sources, as well as Swiss taxes for which adequate provisions have been established.
8. Taxes

110 142nd Financial Statements of Nestlé S.A.
11. Financial assets
In millions of CHF Notes 2008 2007
Participations in Group companies 12 17 714 14 969
Loans to Group companies 13 12 894 15 075
Own shares 14 9 209 6 172
Other investments 81 78
39 898 36 294
12. Participations in Group companies
In millions of CHF 2008 2007
At 1 January 14 969 14 857
Net increase 2 915 388
Write downs (170) (276)
At 31 December 17 714 14 969
13. Loans to Group companies
In millions of CHF 2008 2007
At 1 January 15 075 16 272
New loans 2 269 4 703
Repayments and write downs (2 295) (4 984)
Realised exchange differences (95) (17)
Unrealised exchange differences (2 060) (899)
At 31 December 12 894 15 075
Loans granted to Group companies are usually long-term to fi nance investments in participations.
The net increase in participations represents in particular additional funding, through capital increases, of a number of Group companies.
The carrying value of participations continues to repre-sent a conservative valuation having regard to both the income received by the Company and the net assets of the Group companies concerned.
A list of the most important companies held, either directly by Nestlé S.A. or indirectly through other Group companies, with the percentage of the capital controlled, is given in the section “Consolidated Financial Statements of the Nestlé Group”.

111142nd Financial Statements of Nestlé S.A.
15. Intangible assets
14. Own shares
In millions of CHF 2008 2007
Number Amount Number Amount
Share Buy-Back Programme 165 824 000 7 812 82 940 000 4 405
Management Stock Option Plan 22 326 896 741 27 374 110 908
Restricted Stock Unit Plan 9 443 950 370 10 771 260 422
Future Long-Term Incentive Plans 7 296 360 286 11 164 410 437
204 891 206 9 209 132 249 780 6 172
This amount represents the balance of the trademarks and other industrial property rights capitalised value linked with the Gerber and Novartis Medical Nutrition acquisitions.
A third of the initial value has been amortised during the period (refer to Note 5).
16. Tangible fi xed assets These are principally the land and buildings at Cham and at La Tour-de-Peilz. Nestlé Suisse S.A., the principal oper-ating company in the Swiss market, is the tenant of the building at La Tour-de-Peilz. The “En Bergère” head offi ce building in Vevey is held by a property company, which is wholly owned by Nestlé S.A.
The fi re insurance value of buildings, furniture and offi ce equipment at 31 December 2008 amounted to CHF 24 million (2007: CHF 23 million).
The share capital of the Company has been reduced by CHF 10 072 500 through the cancellation of the corre-sponding number of registered shares purchased as part of the Share Buy-Back Programme. On 30 June 2008, the nominal value of the share was split at a 1:10 ratio. The number of own shares, up to this date, has been restated.
During the year, 100 725 000 shares were cancelled at their cost value of CHF 5279 million, and 183 609 000 shares were purchased as part of the Share Buy-Back Programme for CHF 8685 million.
The Company held 22 326 896 shares to cover manage-ment option rights, 9 443 950 shares designated to the Restricted Stock Unit Plan and 7 296 360 shares desig-nated to the future Long-Term Incentive Plans, the former held at exercise price when lower than the acquisition cost and the latter at cost. During the year 10 242 574 shares were delivered as part of the Nestlé Group remuneration plans for a total value of CHF 417 million.

112 142nd Financial Statements of Nestlé S.A.
18. Long-term payables
19. Provisions
In millions of CHF 2008 2007
Uninsured
risks Exchange
risks
Swiss &foreigntaxes Other Total Total
At 1 January 475 – 171 91 737 942
Provisions made in the period – – 63 56 119 155
Amounts used – – (101) (61) (162) (360)
Unused amounts reversed – – (38) – (38) –
At 31 December 475 – 95 86 656 737
17. Short-term payables
In millions of CHF 2008 2007
Amounts owed to Group companies 5 025 7 344
Other payables 401 300
5 426 7 644
Amounts owed to Group companies represent a long-term loan issued in 1989. The carrying value decreased by CHF 76 million to CHF 160 million as a result of an unrealised exchange difference at the end of 2008.

113142nd Financial Statements of Nestlé S.A.
20. Share capitalThe share capital of the Company has been reduced by CHF 10 072 500 through the cancellation of the corresponding number of registered shares purchased as part of the Share Buy-Back Programme. On 30 June 2008, the nominal value of the share was split at a 1:10 ratio. As a result, the share capital of Nestlé S.A. is now structured as follows:
2008 2007
Number of registered shares of nominal value CHF 0.10 each 3 830 000 000 393 072 500
In millions of CHF 383 393
21. Changes in equity
In millions of CHFShare
capital General
reserve (a)
Reservefor own
shares a)(b)
Specialreserve
Retainedearnings Total
At 1 January 2008 393 1 842 7 839 12 799 8 421 31 294
Cancellation of 100 725 000 shares
(ex Share Buy-Back Programme) (10) 10 (5 279) (5 279)
Transfer to the special reserve 3 000 (3 000) –
Profi t for the year 16 160 16 160
Dividend for 2007 (4 573) (4 573)
Movement of own shares 7 243 (7 243) –
Dividend on own shares held
on the payment date of 2007 dividend 117 (117) –
At 31 December 2008 383 1 852 9 803 8 673 16 891 37 602
(a) The general reserve and the reserve for own shares constitute the legal reserves.(b) Refer to Note 22.
According to article 5 of the Company’s Articles of Association, no person or entity shall be registered with voting rights for more than 5% of the share capital as recorded in the commercial register. This limitation onregistration also applies to persons who hold some or allof their shares through nominees pursuant to this article. In addition, article 11 provides that no person may exer-cise, directly or indirectly, voting rights, with respect to own shares or shares represented by proxy, in excess of 5% of the share capital as recorded in the commercialregister.
At 31 December 2008, the share register showed 120 323 registered shareholders. If unprocessed applica-tions for registration and the indirect holders of shares under American Depositary Receipts are also taken into account, the total number of shareholders probably exceeds 250 000. The Company was not aware of any shareholder holding, directly or indirectly, 5% or more of
the share capital, other than Group companies holding together 5.6% of the Nestlé S.A. share capital as at 31 December 2008.
Conditional share capitalAccording to the Articles of Association, the share capital may be increased in an amount not to exceed CHF 10 000 000 (ten million of Swiss francs) by issuing up to 100 000 000 registered shares with a nominal value of CHF 0.10 each, which shall be fully paid up, through the exercise of conversion rights and/or option rights granted in connection with the issuance by Nestlé S.A. or one of its subsidiaries of newly or already issued convertible debentures, debentures with option rights or other fi nan-cial market instruments.
Concerning the share capital in general, refer also to the Corporate Governance Report.
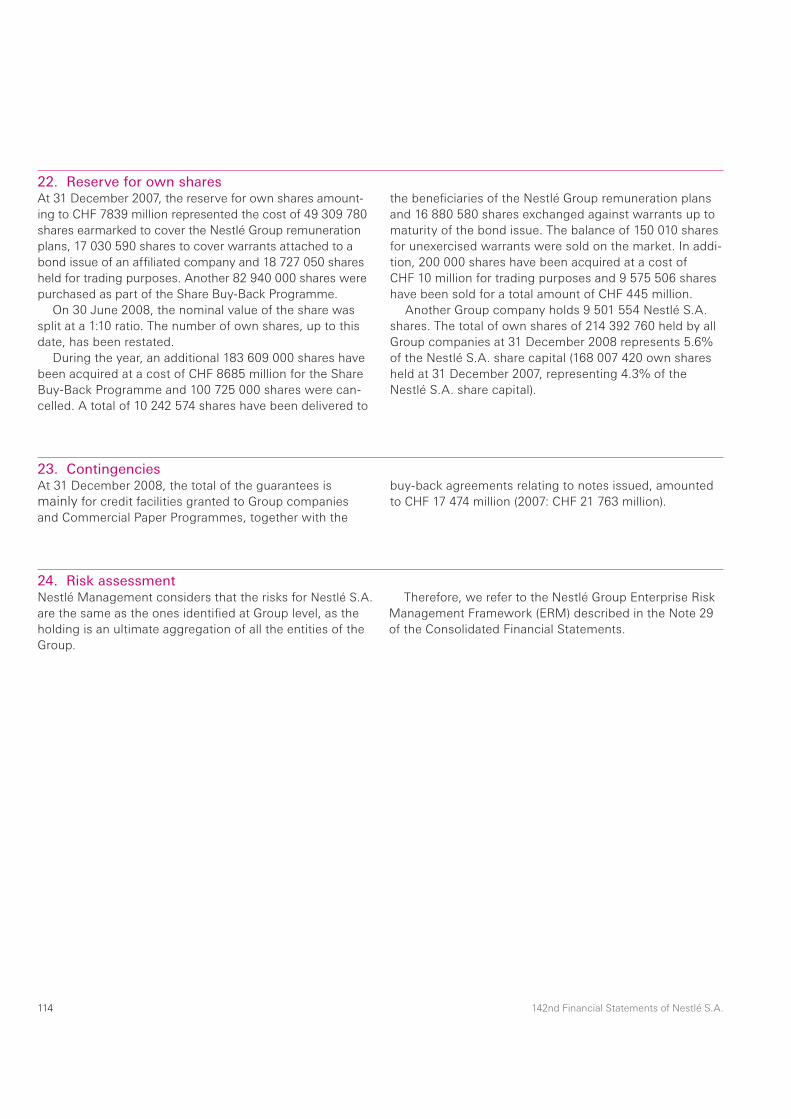
114 142nd Financial Statements of Nestlé S.A.
22. Reserve for own sharesAt 31 December 2007, the reserve for own shares amount-ing to CHF 7839 million represented the cost of 49 309 780 shares earmarked to cover the Nestlé Group remuneration plans, 17 030 590 shares to cover warrants attached to a bond issue of an affi liated company and 18 727 050 shares held for trading purposes. Another 82 940 000 shares were purchased as part of the Share Buy-Back Programme.
On 30 June 2008, the nominal value of the share was split at a 1:10 ratio. The number of own shares, up to this date, has been restated.
During the year, an additional 183 609 000 shares have been acquired at a cost of CHF 8685 million for the Share Buy-Back Programme and 100 725 000 shares were can-celled. A total of 10 242 574 shares have been delivered to
the benefi ciaries of the Nestlé Group remuneration plans and 16 880 580 shares exchanged against warrants up to maturity of the bond issue. The balance of 150 010 shares for unexercised warrants were sold on the market. In addi-tion, 200 000 shares have been acquired at a cost of CHF 10 million for trading purposes and 9 575 506 shares have been sold for a total amount of CHF 445 million.
Another Group company holds 9 501 554 Nestlé S.A. shares. The total of own shares of 214 392 760 held by all Group companies at 31 December 2008 represents 5.6% of the Nestlé S.A. share capital (168 007 420 own shares held at 31 December 2007, representing 4.3% of the Nestlé S.A. share capital).
23. ContingenciesAt 31 December 2008, the total of the guarantees is mainly for credit facilities granted to Group companies and Commercial Paper Programmes, together with the
buy-back agreements relating to notes issued, amounted to CHF 17 474 million (2007: CHF 21 763 million).
24. Risk assessmentNestlé Management considers that the risks for Nestlé S.A. are the same as the ones identifi ed at Group level, as the holding is an ultimate aggregation of all the entities of the Group.
Therefore, we refer to the Nestlé Group Enterprise Risk Management Framework (ERM) described in the Note 29 of the Consolidated Financial Statements.

115142nd Financial Statements of Nestlé S.A.
25. Additional information requested by the Swiss Code of Obligations on remuneration
Annual remuneration of members of the Board of Directors
2008
Cash in CHF (a)
Number of shares (b)
Discountedvalue of shares
in CHF (c) Total
remuneration
Peter Brabeck-Letmathe, Chairman (d) see details below 13 945 163
Paul Bulcke, Chief Executive Offi cer (d)
Andreas Koopmann, 1st Vice Chairman 275 000 5 140 231 706 506 706
Rolf Hänggi, 2nd Vice Chairman 350 000 6 620 298 423 648 423
Edward George (Lord George) 275 000 5 140 231 706 506 706
Kaspar Villiger 255 000 4 740 213 674 468 674
Daniel Borel 205 000 3 760 169 497 374 497
Jean-Pierre Meyers 205 000 3 760 169 497 374 497
André Kudelski 205 000 3 760 169 497 374 497
Carolina Müller-Möhl 155 000 2 770 124 869 279 869
Günter Blobel 155 000 2 770 124 869 279 869
Jean-René Fourtou 175 000 3 160 142 450 317 450
Steven George Hoch 175 000 3 160 142 450 317 450
Naïna Lal Kidwai (e) 155 000 (e) 2 770 (e) 124 869 (e) 279 869 (e)
Beat Hess 155 000 2 770 124 869 279 869
Total for 2008 2 740 000 50 320 2 268 376 18 953 539
Total for 2007 3 045 000 58 750 2 525 486 5 570 486
(a) The cash amount includes the expense allowance of CHF 15 000.(b) After share split 1:10 on June 30, 2008.(c) Nestlé S.A. shares received as part of the Board membership and the Committee fees are valued at the ex-dividend closing price of the Nestlé S.A.
share at the dividend payment’s date, discounted by 11% to account for the blocking restriction of two years.(d) The Chairman and the Chief Executive Offi cer receive no Board membership or Committee fees.(e) Naïna Lal Kidwai has waived her compensation (cash fees and shares) other than the expense allowance of CHF 15 000, as per requirements of the
Reserve Bank of India. Nestlé S.A. has decided instead to make a contribution to charity.

116 142nd Financial Statements of Nestlé S.A.
Peter Brabeck-Letmathe acted as Chairman and CEO up to 12 April 2008 and then as an active non-executive Chairman for the rest of the year. As such, he is entitled to a salary, a Short-Term Bonus payable in Nestlé S.A. shares, which are blocked for three years, and Long-Term Incentives in the form of stock options. His total compensation for 2008 was:
Number Value
(in CHF)
Salary 2 116 667
Short-term Bonus (discounted value of shares) 109 671 3 732 138
Restricted Stock Units (fair value at grant) 16 000 772 800
Management Stock Options (Black-Scholes value at grant) 400 000 3 124 000
Total compensation 2008 9 745 605
Other benefi ts (a) 4 199 558
Total 13 945 163
(a) Includes long-service retirement awards in line with the Company’s policy and a special share award granted by the Board of Directors,in February 2008.
Up to April 2008, the Company also made a contribution of CHF 175 980 towards future pensions benefi ts in line with Nestlé’s Pension Benefi t Policy (CHF 1 252 600 in 2007).

117142nd Financial Statements of Nestlé S.A.
Loans to members of the Board of Directors
Shares and stock options ownership of the non-executive members of the Board of Directors and closely related parties as at 31 December 2008
Number of shares held (a)
Number ofoptions held (b)
Peter Brabeck-Letmathe, Chairman (c) 1 315 884 3 606 143
Andreas Koopmann, 1st Vice Chairman 52 700 –
Rolf Hänggi, 2nd Vice Chairman 51 840 –
Edward George (Lord George) 38 000 –
Kaspar Villiger 42 840 –
Daniel Borel 166 270 –
Jean-Pierre Meyers 1 415 110 –
André Kudelski 37 610 –
Carolina Müller-Möhl 20 440 –
Günter Blobel 18 580 –
Jean-René Fourtou 10 750 –
Steven George Hoch 150 290 –
Naïna Lal Kidwai 3 790 –
Beat Hess 3 390 –
Total as at 31 December 2008 3 322 494 3 606 143
Total as at 31 December 2007 2 141 760 –
(a) Including blocked shares.(b) The subscription ratio is one option for one Nestlé S.A. shares.(c) In 2007, the shares and stock options’ ownership of Peter Brabeck-Letmathe was reported under the Executive Board’s section.
There are no loans outstanding to executive and non-executive members of the Board of Directors or closely relatedparties.
Additional fees and remunerations of the Board of DirectorsThere are no additional fees or remunerations paid by Nestlé S.A. or one of its Group companies, directly or indirectly, to members of the governing body or closely related parties.
Compensations for former members of the Board of DirectorsThere is no compensation conferred during 2008 on former members of the Board of Directors who gave up their func-tion during the year preceding the year under review or earlier.

118 142nd Financial Statements of Nestlé S.A.
Annual remuneration of members of the Executive Board
2008
Number Value
(in CHF)
Annual Base Salary 1 800 000
Short-term Bonus (cash) 1 977 150
Short-term Bonus (discounted value of Nestlé S.A. shares) 35 000 1 191 050
Restricted Stock Units (fair value at grant) 32 000 1 545 600
Management Stock Options (Black-Scholes value at grant) 185 000 1 444 850
Other benefi ts 28 380
Total 7 987 030
The Company also made a contribution of CHF 731 962 towards future pension benefi ts in line with Nestlé’s Pension Benefi ts Policy.
Loans to members of the Executive Board
The total remuneration of members of the Executive Board amounts to CHF 36 220 962 for the year 2008(CHF 49 620 852 for the year 2007, including the remuner-ation of Peter Brabeck-Letmathe as Chairman and CEO). Remuneration principles are described in Appendix 1 of the Corporate Governance Report.
The Company also made contributions of CHF 4 901 953 toward future pension benefi ts of the Executive Board members in line with Nestlé’s Pension Benefi t Policy (CHF 5 146 990 in 2007).
Highest total compensation for a member of the Executive BoardIn 2008, the highest total compensation for a member of the Executive Board was conferred to Paul Bulcke, Executive Vice President for Zone Americas up to 12 April 2008 and CEO since then.
On 31 December 2008, there were no loans outstandingto any member of the Executive Board or closely related parties.
Additional fees and remunerations of the Executive BoardThere are no additional fees or remunerations paid by Nestlé S.A. or one of its Group companies, directly or in-directly, to members of the Executive Board or closely related parties.
Compensations for former members of the Executive BoardA total of CHF 192 200 was conferred during 2008 on two former members of the Executive Board who gave up their function during the year preceding the year under review or earlier (CHF 96 637 to one member in 2007).
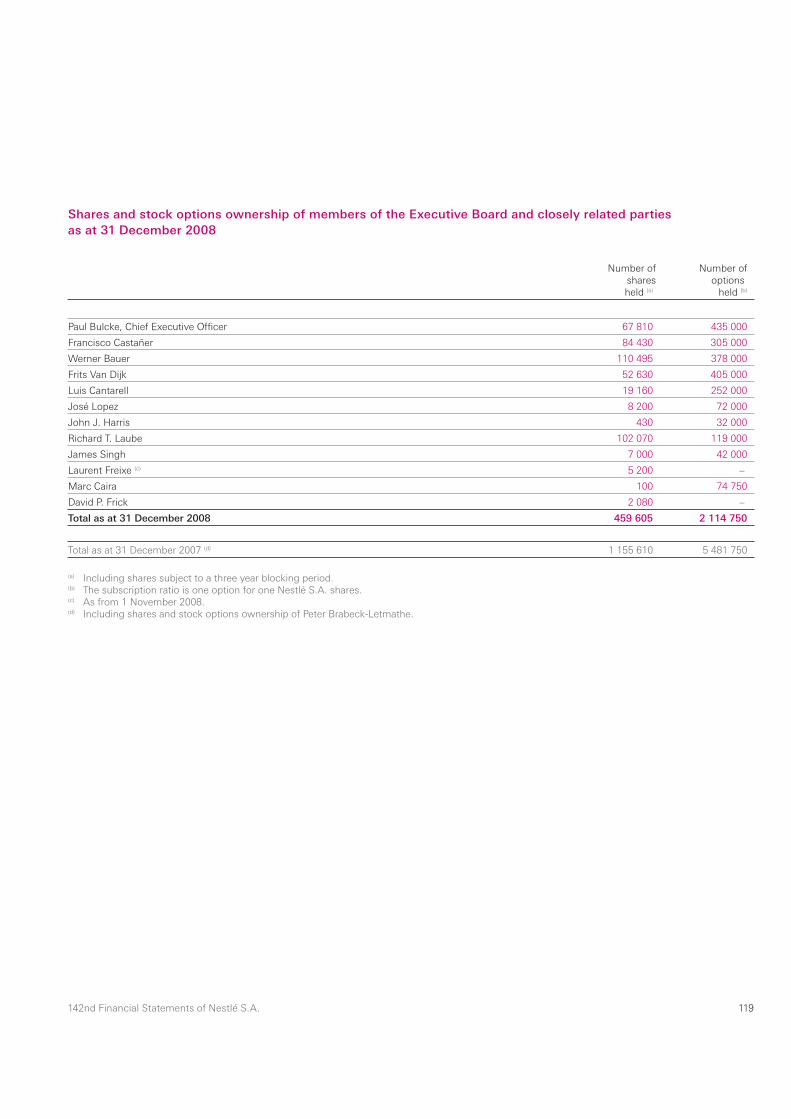
119142nd Financial Statements of Nestlé S.A.
Shares and stock options ownership of members of the Executive Board and closely related partiesas at 31 December 2008
Number ofsharesheld (a)
Number ofoptions
held (b)
Paul Bulcke, Chief Executive Offi cer 67 810 435 000
Francisco Castañer 84 430 305 000
Werner Bauer 110 495 378 000
Frits Van Dijk 52 630 405 000
Luis Cantarell 19 160 252 000
José Lopez 8 200 72 000
John J. Harris 430 32 000
Richard T. Laube 102 070 119 000
James Singh 7 000 42 000
Laurent Freixe (c) 5 200 –
Marc Caira 100 74 750
David P. Frick 2 080 –
Total as at 31 December 2008 459 605 2 114 750
Total as at 31 December 2007 (d) 1 155 610 5 481 750
(a) Including shares subject to a three year blocking period.(b) The subscription ratio is one option for one Nestlé S.A. shares.(c) As from 1 November 2008.(d) Including shares and stock options ownership of Peter Brabeck-Letmathe.

120 142nd Financial Statements of Nestlé S.A.
Proposed appropriation of profi t
In CHF 2008 2007
Retained earnings
Balance brought forward 730 608 258 1 230 199 215
Profi t for the year 16 160 468 011 7 191 297 148
16 891 076 269 8 421 496 363
We propose the following appropriations:
Transfer to the special reserve 11 000 000 000 3 000 000 000
Dividend for 2008, CHF 1.40 per share
on 3 662 222 000 shares (a)
(2007: CHF 12.20 on 384 499 025 shares) (b) 5 127 110 800 4 690 888 105
16 127 110 800 7 690 888 105
Balance to be carried forward 763 965 469 730 608 258
(a) Depending on the number of shares issued as of the dividend record date. Own shares held by the Nestlé Group are not entitled to dividends, conse-quently the dividend on those shares still held on 28 April 2009 will be transferred to the special reserve.
(b) The amount of CHF 117 413 093, representing the dividend on 9 624 024 own shares held at the date of the dividend payment, has been transferred to the special reserve.
Provided that the proposal of the Board of Directors is approved, the gross dividend will amount to CHF 1.40 per share. After deduction of the Swiss withholding tax of 35%, a net amount of CHF 0.91 per share will be payable as from 29 April 2009 to all shareholders on record on 28 April 2009, by bank transfer to the shareholders account, in accord-ance with their instructions.
The Board of Directors
Cham and Vevey, 18 February 2009

121142nd Financial Statements of Nestlé S.A.
As Statutory auditor we have audited the accounting records and the fi nancial statements (income statement, balance sheet and notes to the annual accounts onpages 104 to 120) of Nestlé S.A. for the year ended 31 December 2008.
Board of Directors’ ResponsibilityThe Board of Directors is responsible for the preparation of the fi nancial statements in accordance with the require-ments of Swiss law and the company’s articles of incorpo-ration. This responsibility includes designing, implement-ing and maintaining an internal control system relevant to the preparation of fi nancial statements that are free from material misstatement, whether due to fraud or error. The Board of Directors is further responsible for selecting and applying appropriate accounting policies and making accounting estimates that are reasonable in the circum-stances.
Auditor’s ResponsibilityOur responsibility is to express an opinion on these fi nan-cial statements based on our audit. We conducted our audit in accordance with Swiss law and Swiss Auditing Standards. Those standards require that we plan and per-form the audit to obtain reasonable assurance whether the fi nancial statements are free from material misstate-ment.
An audit involves performing procedures to obtain audit evidence about the amounts and disclosures in the fi nancial statements. The procedures selected depend on the auditor’s judgment, including the assessment of the risks of material misstatement of the fi nancial statements, whether due to fraud or error. In making those risk assess-ments, the auditor considers the internal control system
relevant to the entity’s preparation of the fi nancial state-ments in order to design audit procedures that are appro-priate in the circumstances, but not for the purpose of expressing an opinion on the effectiveness of the entity’s internal control system. An audit also includes evaluating the appropriateness of the accounting policies used and the reasonableness of accounting estimates made, as well as evaluating the overall presentation of the fi nancial statements. We believe that the audit evidence we have obtained is suffi cient and appropriate to provide a basis for our audit opinion.
OpinionIn our opinion, the accounting records and the fi nancial statements for the year ended 31 December 2008 comply with Swiss law and the company’s articles of incorporation. Report on Other Legal RequirementsWe confi rm that we meet the legal requirements on licensing according to the Auditor Oversight Act (AOA) and independence (article 728 CO and article 11 AOA) and that there are no circumstances incompatible with our independence.
In accordance with article 728a paragraph 1 item 3 CO and Swiss Auditing Standard 890, we confi rm that an internal control system exists, which has been designed for the preparation of fi nancial statements according to the instructions of the Board of Directors.
We further confi rm that the proposed appropriation of available earnings complies with Swiss law and the com-pany’s articles of incorporation.
We recommend that the fi nancial statements submitted to you be approved.
Report of the Statutory auditorto the General Meeting of Nestlé S.A.
Mark Baillache Stéphane GardLicensed Audit Expert Licensed Audit ExpertAuditor in Charge
Zurich, 18 February 2009

122 142nd Financial Statements of Nestlé S.A.
Notes
123142nd Financial Statements of Nestlé S.A.
Notes

124 142nd Financial Statements of Nestlé S.A.
Notes


Nestlé – 20
08 Fin
ancial Statem
ents