2008 annual report on pesticide residues
TRANSCRIPT
EFSA Journal 2010; 8(6):1646
Suggested citation: 2008 Annual Report on Pesticide Residues according to Article 32 of Regulation (EC) No 396/2005. EFSA Journal 2010; 8(6):1646. [442 pp.]. doi:10.2903/j.efsa.2010.1646. Available online: www.efsa.europa.eu
© European Food Safety Authority, 2010
SCIENTIFIC REPORT OF EFSA
2008 Annual Report on Pesticide Residues
according to Article 32 of Regulation (EC) No 396/20051
European Food Safety Authority2, 3
European Food Safety Authority (EFSA), Parma, Italy
ABSTRACT The report presents the results of the monitoring of pesticide residues in food commodities sampled during the calendar year 2008 in the 27 EU Member States and two EFTA States (Norway and Iceland). The report also comprises the outcome of the consumer risk assessment of pesticide residues. Finally, the report provides some recommendations aiming to improve future monitoring programmes.
In total, more than 70,000 samples of nearly 200 different types of food were analysed for pesticide residues by competent authorities. 96.5% of the samples comply with the legal maximum residue levels (MRLs) of pesticides. EFSA concluded that the long-term exposure of consumers did not raise health concerns. The short-term exposure assessment revealed that for 134 food samples analysed the acute reference dose (ARfD) might have been exceeded if the pertinent food was consumed in high amounts.
KEY WORDS
Pesticide residues, food control, monitoring, Maximum Residue Levels, consumer risk assessment, Regulation (EC) No 396/2005
1 On request of EFSA, Question No EFSA-Q-2009-00601, issued on 15 June 2010. 2 Correspondence: [email protected] 3 The report was prepared by the Pesticide Risk Assessment Peer Review (PRAPeR) Unit in collaboration with the
Assessment Methodology Unit (AMU).
2008 Annual Report on Pesticide Residues
2
EFSA Journal 2010; 8(6):1646
SUMMARY The report gives an overview of the control activities performed by EU Member States and EFSA countries in order to ensure compliance of food with the standards defined in European legislation on pesticide residues.
2008 was an important year for the harmonisation of the Maximum Residue Levels (MRLs) for pesticides at European level. Whereas before 1 September 2008 a mixed system with harmonised Community MRLs for ca. 250 active substances and national MRLs for the remaining substances was in place, after this date harmonised MRLs became applicable for all active substances used in plant protection products that have the potential to enter the food chain.
Because of these substantial changes in the European MRL legislation, the results of previous monitoring reports published by EFSA and the European Commission are not directly comparable with the results reported in this report. The comparability of the data among reporting countries and over time is hampered not only by the important change in the legal situation but also by other factors, such as the change in the number of the reporting countries over time, the difference in the design of the national monitoring plans and the data validation and recoding.
Typically, in each European reporting country two monitoring programmes are in place: a national control/monitoring programme (designed by each country) and a coordinated European programme for which clear guidance is given on which specific control activities should be performed by the Member States.
The EU coordinated programme aims to provide statistically representative data regarding pesticide residues in food available to European consumers. The lots sampled should be chosen without any particular suspicion towards a specific producer and/or consignment. Thus, the results obtained in the coordinated programme are considered as an indicator for the MRL compliance rate in food placed on the European common market and allow an estimation of the actual consumer exposure. Although the participation was not mandatory in 2008, all 27 Member States and the two EFTA states participated in the EU harmonised control programme.
A total number of 11,610 samples of nine different commodities (oranges, mandarins, pears, potatoes, carrots, cucumbers, spinach, beans without pods, and rice) were taken in the 2008 EU coordinated pesticide monitoring programme. These samples should be analysed for 78 pesticides (including the relevant metabolites, as specified in the legal residue definition). 2.2% of the samples exceeded the MRL, while the percentage of samples with measurable residues above the quantification level, but at or below the MRL, was 35.7%. In 62.1% of the samples no residues were detected. The overall MRL exceedance rate was comparable with the previous year rate (2.3%). It is noted that the percentage of samples without measurable residues increased from 52.7% in 2007 to 62.1% in 2008. The highest percentage of samples exceeding the MRL was identified for spinach (6.2%) followed by oranges (3.0%), rice (2.4%), cucumbers (2.1%), mandarins (2.0%), carrots (1.8%), pears (1.6%), beans without pods (0.8%) and potatoes (0.5%).
It should be noted that the presence of pesticides, even an exceedance of an MRL, does not imply that this is a food safety concern. To ascertain the latter exposure assessments are required.
The official controls carried out at national level in the framework of the national monitoring programmes are complementary to the control performed in the context of the EU coordinated programme and are performed to ensure compliance with the provisions established in food legislation regarding the pesticide residues. Member States and EFTA countries are free to decide on the design of the national monitoring programmes for pesticide residues in food.
2008 Annual Report on Pesticide Residues
3
EFSA Journal 2010; 8(6):1646
The total number of samples taken in the context of the national programmes in 2008 was 70,1434. This includes 67,887 surveillance samples and 2,256 enforcement samples. Compared with the previous year, this is a decrease by 5.9 %.
National programmes cover samples originating from national, Community and third country production. The majority of samples taken were produced in one of the European reporting countries (77%), while 20% of the samples were taken from imported consignments or lots. For 3 % of the samples the origin was not reported. Approximately 200 different unprocessed food commodities were analysed for pesticide residues by all reporting countries.
In 2008 the number of pesticides sought by each country varied from 39 to 679. The total number of substances covered by all reporting countries was 862.
In total, residues of 365 different pesticides were found in measurable quantities in fruit and vegetables, while in cereals residues of 76 different pesticides were observed. As in previous years, the number of different pesticide residues found in fruit and vegetables in 2008 was higher than the number of pesticides found in cereals, which also reflects the greater number of products used in the fruit and vegetables category.
96.5% of the surveillance samples analysed were below the legally permitted limits, while 3.5% of the samples exceeded the MRLs. The overall reported MRL exceedance rate (3.5%) is lower than in the previous year where 4.2% of the samples were found to exceed the MRLs.
A higher incidence of MRL exceedances was also observed in samples imported from third countries (7.6%) than from EU (2.4%).
A significantly higher MRL exceedance rate was observed for enforcement samples (10.3%) compared to surveillance samples (3.5%). The former are taken when there are suspicions about the safety of a product and as a follow-up of violations found previously.
For baby food, the European legislation is more restrictive than for other food categories as no more than 0.01 mg/kg of any single pesticide residue is permitted in baby food samples. In 2008, a total of 2,062 surveillance samples of baby food were reported by 25 countries. Quantifiable residues above the reporting level were found in 76 samples, while the MRLs were exceeded only in 4 samples (0.2%).
At EU level no specific MRLs for organic products are established, i.e. the MRLs established for conventionally produced products apply. In 2008, the results of a total of 3,131 samples of organic origin were reported by 22 countries. For organic fruit and vegetables, a lower rate of MRL exceedances (0.9%) in comparison to conventionally grown fruit and vegetables (3.7%) was found. It should be mentioned that EU legislation allows the use of certain active substances in organic food production.
Considering the results of both the national and the EU coordinated programmes (including enforcement samples), the percentage of samples of fruits, vegetables and cereals with multiple residues (i.e. single samples which contain residues of more than one pesticide) has increased over the time, from 15% in 1997 to 26% in 2007. In 2008, residues of two or more pesticides were found in 27% of the analysed samples of fruits, vegetables and cereals. The highest number of different pesticides in a single sample was 26 in 2008 and was recorded for a table grape sample. Multiple
4 This figure also comprises the number of samples taken for the EU coordinated programme since these samples in many
countries were analysed for a wider range of active substances than defined in the coordinated programme and are therefore belonging to both programmes, the national and the EU coordinated programme.
2008 Annual Report on Pesticide Residues
4
EFSA Journal 2010; 8(6):1646
residues in one sample can result from the application of different types of pesticides (e.g. insecticides, fungicides and herbicides) to protect the crop against different pests, diseases or other threats having an impact on the quality or yield of crops, from mixing of lots with different treatments, contaminations, but also from practices which do not respect the principles of good plant protection practice.
The results of the monitoring were used to perform exposure assessments. However, this exercise was impeded by the fact that aggregated results, rather than results at single chemical determination level, were provided to EFSA. This lack of information was bridged by introducing conservative assumptions in the exposure modelling which bias the results by overestimating the actual consumer exposure. In order to improve the accuracy of the actual consumer exposure calculations with 2009 monitoring data, EFSA has developed and tested a new pesticide monitoring reporting format.
The long-term exposure assessment was based on the residue findings for the food commodities which are the major constituents of the human diet. The calculations demonstrated for all except one pesticide that even under conservative assumptions the chronic (long-term) exposure does not exceed the toxicologically acceptable limits. For diazinon a potential consumer health risk could not be excluded in the first tier risk assessment. However, after having performed a more refined calculation, taking into account that residues are lower in food commodities that are consumed after processing (i.e. apple juice), EFSA concluded that the long-term consumer exposure to diazinon residues is not likely to exceed the Acceptable Daily Intake (ADI). Thus, also for diazinon no long-term consumer risk is expected. It is noted that the use of diazinon is no longer permitted in the European Union.
The assessment of the acute (short-term) consumer exposure was performed for the nine food commodities which were analysed under the EU coordinated monitoring programme. The assessment was based on worst-case scenarios: the consumption data for consumers who eat a large portion size of the food item under consideration were combined with the highest residue measured in the coordinated programme. In order to accommodate for a possible non-homogeneous distribution of residues in an analysed food lot a variability factor was introduced. Assuming a coincidence of these events (high food consumption, high residue concentration and inhomogeneous residue distribution in a lot), a potential consumer risk could not be excluded for 35 pesticide/commodity combinations.
The highest potential exceedances of the toxicological reference value was indicated for dimethoate/omethoate on potatoes and spinach (10,763% and 2,938% of the ARfD, respectively), methiocarb on cucumbers (2,519%), dimethoate/omethoate on pears (1,730%) and mthomyl/thiodicarb on oranges (1,644%). However, the critical intake events identified in the acute risk assessment calculations were considered very unlikely, taking into account the frequency of critical residues and the frequency of extreme consumption events. For 11 of the pesticide/commodity combinations for which a critical intake situation could not be excluded, risk management actions have already been taken by withdrawing authorisations or by lowering the MRLs.
2008 Annual Report on Pesticide Residues
5
EFSA Journal 2010; 8(6):1646
TABLE OF CONTENTS Abstract .................................................................................................................................................... 1 Summary .................................................................................................................................................. 2 Table of contents ...................................................................................................................................... 5 Legal basis ................................................................................................................................................ 7 Terms of reference .................................................................................................................................... 8 1. Introduction ................................................................................................................................. 9 2. Design and background on the monitoring programmes ........................................................... 17
2.1. EU coordinated programme .................................................................................................. 17 2.1.1. Food commodities analysed ............................................................................................. 17 2.1.2. Pesticides analysed ........................................................................................................... 20 2.1.3. Number of samples ........................................................................................................... 23
2.2. National programmes ............................................................................................................ 26 2.2.1. Number of samples – national programmes ..................................................................... 27 2.2.2. Pesticides analysed – national programmes...................................................................... 31 2.2.3. Food commodities analysed – national programmes ........................................................ 33 2.2.4. Baby food monitoring ....................................................................................................... 34 2.2.5. Organic food monitoring .................................................................................................. 36 2.2.6. Processed-food monitoring ............................................................................................... 38 2.2.7. Origin of samples .............................................................................................................. 39
2.3. Quality assurance .................................................................................................................. 41 3. Results of the EU-coordinated monitoring programme ............................................................. 43
3.1. Overall results for MRL exceedances ................................................................................... 43 3.2. Results by country ................................................................................................................ 44 3.3. Results by food commodity .................................................................................................. 44 3.4. Results by pesticide-commodity combination ...................................................................... 47 3.5. Results by pesticides ............................................................................................................. 59
4. Results of the national monitoring programmes ........................................................................ 62 4.1. Overall results for MRL exceedances ................................................................................... 62 4.2. MRL exceedance rate over the time...................................................................................... 62 4.3. Origin of samples exceeding the EC MRLs .......................................................................... 63 4.4. Results by food commodity .................................................................................................. 66 4.5. Results by pesticide/crop combinations ................................................................................ 69
4.5.1. Results for organic samples .............................................................................................. 70 4.5.2. Results for baby-food samples ......................................................................................... 71 4.5.3. Results for processed products ......................................................................................... 71 4.5.4. Results for samples with multiple residues ....................................................................... 72 4.5.5. Reasons for MRL exceedances ......................................................................................... 76
5. Dietary exposure and dietary risk assessment ........................................................................... 77 5.1. Model assumptions for the short-term exposure assessment ................................................ 78
5.1.1. Residue levels ................................................................................................................... 81 5.1.2. Processing/peeling factors ................................................................................................ 84 5.1.3. Acute Reference Dose values (ARfDs) ............................................................................ 84 5.1.4. Presentation of the results of the short-term consumer exposure ..................................... 86 5.1.5. Limitation and uncertainties affecting the short-term exposure assessment ..................... 87
5.2. Results of the short-term risk assessment ............................................................................. 88 5.2.1. Pesticide/crop combination for which a theoretical short-term risk could not be excluded .......................................................................................................................................... 88
5.2.1.1. Azinphos-methyl ...................................................................................................... 97
2008 Annual Report on Pesticide Residues
6
EFSA Journal 2010; 8(6):1646
5.2.1.2. Carbaryl ................................................................................................................... 98 5.2.1.3. Benomyl/carbendazim ........................................................................................... 101 5.2.1.4. Chlormequat ........................................................................................................... 102 5.2.1.5. Chlorpropham ........................................................................................................ 103 5.2.1.6. Chlorpyriphos ........................................................................................................ 104 5.2.1.7. Diazinon ................................................................................................................. 105 5.2.1.8. Dimethoate/omethoate ........................................................................................... 106 5.2.1.9. Endosulfan ............................................................................................................. 108 5.2.1.10. Imazalil .................................................................................................................. 110 5.2.1.11. Lambda-Cyhalothrin .............................................................................................. 111 5.2.1.12. Methamidophos ..................................................................................................... 113 5.2.1.13. Methiocarb ............................................................................................................. 114 5.2.1.14. Methomyl/thiodicarb ............................................................................................. 114 5.2.1.15. Oxamyl ................................................................................................................... 119 5.2.1.16. Parathion ................................................................................................................ 121 5.2.1.17. Procymidone .......................................................................................................... 122 5.2.1.18. Tebuconazole ......................................................................................................... 124
5.2.2. Pesticide/crop combinations for which the short-term risk assessment was not conclusive . ........................................................................................................................................ 125
5.2.2.1. Cypermethrin ......................................................................................................... 128 5.2.2.2. Dithiocarbamates ................................................................................................... 129 5.2.2.3. Folpet/Captan ......................................................................................................... 131
5.2.3. Pesticide/crop combinations for which the short-term risk assessment could not be performed ..................................................................................................................................... 133
5.3. Model assumptions for long-term risk assessment ............................................................. 133 5.3.1. Residue levels ................................................................................................................. 136 5.3.2. Processing/peeling factors .............................................................................................. 144 5.3.3. Acceptable Daily Intake values (ADIs) .......................................................................... 144 5.3.4. Presentation of the results of the long-term consumer exposure .................................... 146 5.3.5. Limitations and uncertainties affecting the chronic exposure assessment ...................... 146
5.4. Results of the long-term risk assessment ............................................................................ 147 5.4.1. Pesticides for which a chronic risk could not be excluded ............................................. 149
5.4.1.1. Diazinon ................................................................................................................. 149 5.4.2. Pesticides for which the chronic risk assessment was not conclusive ............................ 150
5.4.2.1. Dimethoate/omethoate ........................................................................................... 150 5.4.3. Pesticides for which the chronic risk assessment could not be performed ..................... 151
5.4.3.1. Dichlorvos .............................................................................................................. 151 5.4.3.2. Triazoles ................................................................................................................. 151
Recommendations ................................................................................................................................ 153 Acknowledgments ................................................................................................................................ 155 References ............................................................................................................................................ 156 Abbreviations and special terms used in the report .............................................................................. 159 Appendices ........................................................................................................................................... 162 Appendix I…………………………………………………………………………………………163 Appendix II……………………………………………………………………………………….. 167 Appendix III………………………………………………………………………………………. 241 Appendix IV……………………………………………………………………………………… 275
2008 Annual Report on Pesticide Residues
7
EFSA Journal 2010; 8(6):1646
LEGAL BASIS According to the EU legislation in place in 2008, EU and EEA Member States 5 (Iceland and Norway) had to carry out national monitoring programmes on pesticide residues and report the results to the European Commission and EFSA.
General legal provisions for food inspections and monitoring were established by Regulation (EC) No. 882/2004 (EC 2004) on official controls performed to ensure the verification of compliance with feed and food law, animal health and animal welfare.
The legal basis for the preparation of this Annual Report on the pesticide residues is laid down in Directives 76/895/EEC, 86/362/EEC, 86/363/EEC and 90/642/EEC (EEC 1976; EEC 1986a; EEC 1986b; EEC 1990). These directives required Member States to establish national control programmes and to carry out regular official controls on pesticide residues in food commodities to check compliance with the Maximum Residues Levels (MRLs) for pesticide residues. Commission Regulation (EC) No. 645/2000 (EC 2000) provides for detailed implementing rules for the monitoring provisions of Directives 86/362/EEC and 90/642/EEC (EEC1986a; EEC1990) on pesticide MRLs.
On 1 September 2008, Regulation (EC) No. 396/20056 on maximum residue levels of pesticides in or on food and feed of plant and animal origin (EC 2005a) became fully applicable, and the provisions regarding the monitoring activities in the above-mentioned four directives were replaced by Chapter V of Regulation (EC) No. 396/2005. According to Article 31 of this regulation, Member States have to submit the results of official controls and other relevant information to the European Commission, to EFSA and to other Member States. With Article 32 the responsibility for preparing the Annual Report on pesticide residues was transferred from the European Commission to EFSA. This regulation also contains general provisions regarding the content of the Annual Report.
In addition to the general provisions on national monitoring programmes as defined in Article 30 of the MRL Regulation, the Commission has recommended that EU Member States and EEA countries participate in a specific EU coordinated monitoring programme. The details of the coordinated monitoring programme for 2008 have been established in Commission Recommendation 2008/103/EC (EC 2008a).
The results of the analysis of samples taken during the previous year under the national and coordinated Community monitoring programme had to be submitted to the European Commission by the end of August 2009. All 27 EU Member States and two EEA States submitted the results of the 2008 monitoring programme electronically to EFSA between 10 July and 30 October 2009.
5 Liechtenstein, an EFTA State previously reporting its results on the monitoring of pesticide residues to the Commission,
has been exempted from reporting obligations from 2007 due to a change in the EEA agreement concerning agricultural issues.
6 Regulation (EC) No. 396/2005 of the European Parliament and of the Council of 23 February 2005 on maximum residue levels of pesticides in or on food and feed of plant and animal origin and amending Council Directive 91/414/EECText with EEA relevance. Official Journal L 70, 16.3.2005, p 1-16 (EC 2005a)
2008 Annual Report on Pesticide Residues
8
EFSA Journal 2010; 8(6):1646
TERMS OF REFERENCE In accordance with Article 32 of Regulation (EC) No. 396/2005 (EC 2005a), EFSA shall submit the Annual Report on pesticide residues concerning the control activities carried out in 2008 to the Commission.
The Annual Report shall at least include the following information:
• An analysis of the result of the controls on pesticide residues provided by EU Member States and EEA States;
• A statement of the possible reasons why the MRLs were exceeded, together with any appropriate observations regarding risk management options;
• An analysis of chronic and acute risks to the health of consumers from pesticide residues;
• An assessment of consumer exposure to pesticide residues based on the information provided under the first bullet point and any other relevant information available, including reports submitted under Directive 96/23/EC (EC 1996b).
In addition, the report may include an opinion on the pesticides that should be included in future monitoring programmes.
2008 Annual Report on Pesticide Residues
9
EFSA Journal 2010; 8(6):1646
1. Introduction
The report presents the results of the monitoring of pesticide residues in food commodities sampled during the calendar year 2008 in the 27 EU Member States and the two EFTA States (Norway and Iceland ) who have signed the Agreement on the European Economic Area (EEA agreement).
The objective of this report is to give an overview of the control activities performed by Member States and EFTA countries in order to ensure compliance of food with the standards defined by Directive 86/362/EEC, 90/642/EEC (applicable until end of August 2008) and Regulation (EC) No. 396/2005, to summarise the results provided by the reporting countries, to identify critical areas of concern regarding sample compliance with MRLs, to assess the actual consumer exposure to pesticide residues and to perform an analysis of the chronic and acute risks to consumer health. Furthermore, this report provides some recommendations for future monitoring plans and activities.
2008 was an important year for the harmonisation of the pesticide MRL legislation at European level. Whereas before 1 September 2008 a mixed system with harmonised Community MRLs for about 250 active substances and national MRLs for the remaining substances was applicable, when Regulation (EC) No 396/2005 was introduced it harmonised MRLs for all active substances used in plant protection products that have the potential to enter the food chain.
Due to the changed legal situation, the results of previous monitoring reports published by EFSA and the European Commission are not directly comparable with the results reported in this report. Therefore, the 2008 monitoring data should be interpreted at with care to understand if a possible change of the pesticide residue findings should be ascribed to the new harmonised EU legal limits or to other factors. The impact will be best evaluated by assessing future monitoring data, starting from the 2009 monitoring results. Finally, when comparing the data and results reported by the different countries and for different years, the reader should bear in mind that important changes in the legal framework have been introduced. The comparability is also hampered by other factors, such as scope of the national monitoring programmes, proficiencies of analytical laboratories providing results, the data validation and recoding7.
Chapter 2 of the report describes the design of the monitoring programmes in place in Europe. In particular, the difference between the EU coordinated programme and the national control plans is explained.
The results of the EU coordinated monitoring programme, as established in Commission Recommendation 2008/103/EC, are reported in chapter 3 of this report.
Key figures and results of the national control programmes are summarised in chapter 4. In this section the results of surveillance samples (non-targeted samples) and the results of the national enforcement sampling taken under the national control programmes are reported.
In the last section of the report (chapter 5), EFSA assessed the dietary exposure of European consumers, based mainly on the results of the EU coordinated programme.
7 More detailed information about the results of control activities in the individual reporting countries is available from the
respective national authorities. The list of web addresses where the results of monitoring plans have been published is reported in Appendix I. It should be noted that upon submission of the data, EFSA validated the data and recoded the names of the food and the pesticide names reported by the participating countries to make the comparable. If there were inconsistencies in data from different countries, they were asked for corrections. Therefore, small differences in the data published separately by the national authorities and the data reported in the present report may occur.
2008 Annual Report on Pesticide Residues
10
EFSA Journal 2010; 8(6):1646
The reader not familiar with terms and concepts frequently used in the present report (e.g. MRL and sampling strategy) is invited to consult the background information section below.
2008 Annual Report on Pesticide Residues
11
EFSA Journal 2010; 8(6):1646
BACKGRUND INFORMATION
This section provides explanations on terms frequently used in the present report.
Authorisation of pesticides/plant protection products The quality and yield of agricultural and horticultural crops is jeopardized by plant diseases and infestation by pests. In order to protect crops before and after harvest, pesticides8 are used. Since the active substances used in pesticides can have harmful effects on human health, wildlife and the environment, a strict system of pesticide authorisation and control of use has been established at EU level. In the framework of the authorisation procedure, companies asking for the authorisation of products have to demonstrate that with regard to consumer safety the products do not pose a consumer health risk from pesticide residues on food.
Pesticide residues Pesticide residues are the measurable amounts of the active substances used in plant protection products, their metabolites and/or breakdown or reaction products resulting from current or formerly used plant protection products that can be found on harvested crops or in food of animal origin.
Pesticide use The nationally authorised or registered use of a pesticide reflects the safe use of a pesticide under actual agricultural conditions and implies the use of the minimum quantity of pesticides which allows the desired effect to be obtained (referred to as the Good Agricultural Practice - GAP). Authorisations are granted at national level, taking into account the local and environmental conditions and the occurrence of pests (and therefore the use of pesticides). MRLs are set for the most critical authorised GAPs, provided that a consumer health risk can be excluded for these uses.
Residue definition Active substances applied on a crop are not stable, but the molecule applied undergoes to a certain extent a transformation induced by plant enzymes, light, humidity or other environmental factors. Thus, on the harvested food commodity, other chemical molecules than the active substances originally applied may be present. Since not all of these degradation products are harmless, they have to be taken into account in the consumer risk assessment. In certain cases, the parent compound (i.e. the substance originally applied on the crop) is not found at all in the harvested crops, but only a typical metabolite which is an indicator of the use of this parent compound. The concept of residue definition is used to define the active substance used in plant protection products and its metabolites, degradates, and other transformation products relevant for consumer exposure (i.e. residue definition for risk assessment) or to define marker substances allowing a conclusion on the use of the active substance (i.e. residue definition for MRL enforcement). For each pesticide used on food or feed commodities, the regulatory authorities need to choose which components of the terminal residue on the harvested crops are of relevance for setting and enforcing MRLs and for the dietary exposure. Therefore, for each pesticide, two residue definitions are set:
Residue definition for MRL setting /MRL enforcement purposes focuses on those analytes which are indicators for the use of the pesticide and which can be analysed in routine monitoring, ideally by a multi-residue method.
Residue definition for dietary risk assessment includes the parent compound and its metabolites, which are significant in term of relative toxicities and which contribute significantly to consumer exposure.
8 In the report the term “pesticide” is used as synonym of “plant protection product”.
2008 Annual Report on Pesticide Residues
12
EFSA Journal 2010; 8(6):1646
MRL Maximum Residue Levels (MRLs) for pesticides are defined as the upper legal levels of a pesticide residue concentration (expressed in mg/kg) in or on food or feed which result from authorised agricultural practices. Food with residues of pesticides above the MRL cannot be traded.
Hence, MRLs are not necessarily toxicological safety limits, but reflect the use of minimum quantities of pesticides to achieve effective plant protection, applied in such a manner that the amount of residue is the smallest practicable. Before an MRL is established, a risk assessment has to prove that the limit is safe for consumer health. In the past responsibility for risk assessment in the MRL setting procedure was shared between Member States and the European Commission. Since Regulation 396/2005 (EC 2005a) became fully applicable on 1 September 2008, EFSA has become the independent, responsible body for the risk assessment and evaluation of each intended new/revised MRL in the framework of the MRL setting procedures.
In most cases the MRLs are well below the toxicologically acceptable residue levels. If a pesticide residue is found on a given crop at or below the MRL, then the crop can be considered safe for consumer health. On the other hand, if a residue exceeds the MRL, it is not necessarily true that the consumer is at risk. In the latter case, an assessment of the expected exposure and a comparison with the toxicological reference values is necessary to conclude whether the food poses a consumer health risk.
MRLs are established for raw commodities of plant or animal origin placed on the market, i.e. fresh or frozen products without processing, in many cases including non-edible parts of the crop such as peel. The description of the commodities and the parts of the products to which the MRLs apply can be found in the Annexes of the basic MRL directives (EEC 1976; EEC 1990; EEC 1986a and EEC 1986b) and in Annex I to Regulation (EC) No. 396/2005 (EC 2005a).
At EU level, harmonized MRLs for pesticide residues in food applicable for the reference period January to August 2008 have been established in four basic directives (Council Directive 76/895/EEC (EEC 1976), Council Directive 86/362/EEC (EEC 1986a), Council Directive 86/363/EEC (EEC 1986b) and Council Directive 90/642/EEC (EEC 1990)), which cover more than 250 pesticides. In addition, for pesticides not covered by the European legislation in the reference period until September 2008, Member States had the possibility to establish MRLs at national level. However, not all Member States had subsidiary national MRL provisions in place.
Starting from September 2008, EU MRLs have been established by Annexes II and III of Regulation (EC) No. 396/2005 (EC 2005a). This Regulation provides for a harmonised system for the setting of the MRL, which apply to all food commodities available in all EU Member States. This Regulation covers about 500 pesticides. For pesticides not explicitly mentioned in Annexes II, III or IV of the Regulation, a default MRL of 0.01 mg/kg is applicable. MRLs are established at the limit of quantification (LOQ) if a pesticide is not authorised for use on a specific crop.
For processed or composite food commodities, the MRLs established in the MRL legislation for raw commodities are applied by taking into account changes in the levels of pesticide residues caused by processing or mixing (processing factors).
It should also be mentioned that no specific MRLs for organic products have been established at EU level. For these products the same MRLs as for conventional products apply, but additional production and labelling rules have to be respected (EC 1991b).
For infant formulae, follow-on formulae and for processed cereal-based foods and baby foods for infants and young children, a default MRL of 0.01 mg/kg is applicable, unless a specific lower MRL has been set in Directives 91/321/EEC and 96/5/EC (ECC 1991, EC1996a).

2008 Annual Report on Pesticide Residues
13
EFSA Journal 2010; 8(6):1646
MRL exceedance Since the MRLs are closely linked to the Good Agricultural Practices (GAP), MRLs may be exceeded in cases where the GAP was not respected, such as
• the use of unauthorised pesticides;
• the use of pesticides not authorised for a specific crop;
• the use of an authorised pesticide on a crop for which an authorisation was granted, but not in compliance with the authorised GAP (e.g. higher application rate or shorter pre-harvest intervals).
For products originating from third countries, the lack of import tolerance at EU level may also be a reason for MRL exceedance. Before September 2008, the lack of harmonisation for certain active substances which were covered by national MRL provisions was also a reason for exceeding MRLs, although the food was lawfully produced in the Member State of origin.
In exceptional cases, MRL exceedance was observed for other reasons, such as:
• spray drift from neighbouring treated fields;
• contamination of crops at storage or packaging level;
• unfavourable weather conditions associated with a reduced residue decline rate.
Finally, MRLs might be exceeded because the legal limits (MRLs) were set at inappropriate levels. MRLs are derived from relatively small data sets generated in supervised field trials. On rare occasion applications at the critical GAP may also lead to values above the MRL. Careful analysis of the monitoring data should make it possible to decide if certain MRLs need to be revised.
In the context of this report the term MRL exceedance refers to a situation where the legal limit is exceeded numerically, without considering measurement uncertainty. Thus, this term should not be understood as MRL non-compliance that will have legal repercussions. See also MRL compliance/non-compliance.
MRL compliance/non-compliance If the residue level measured in a sample, taking into account the measurement uncertainty, exceeds the legal MRL, the sample is considered as non-compliant and the competent national authorities shall apply the sanctions applicable to the infringements. The sanctions must be effective, proportionate and dissuasive. A sample is compliant with the MRL if the measured value does not exceed the MRL.
Threshold residue/threshold MRL Since the MRL is not the toxicological limits, for the purpose of the risk assessment EFSA introduced two new concepts: the “threshold residue level” and “threshold MRL”.
A threshold residue level is the theoretical, calculated maximum residue in the edible part of the crop which would be acceptable from a consumer safety point of view. The threshold residue gives an intake corresponding to 100% of the ARfD and it is calculated on the basis of the consumer group with the highest consumption per unit body weight (i.e. the most critical consumer) identified among all the national consumer groups for which consumption data are available to EFSA. The threshold MRL is the residue concentration that refers to the whole commodity, e.g. the unpeeled orange, and which gives an intake corresponding to 100% of the ARfD. For crops that are consumed in peeled and/or processed form, a peeling factor and/or processing factor has to be applied to the threshold
2008 Annual Report on Pesticide Residues
14
EFSA Journal 2010; 8(6):1646
residue to derive the threshold MRL. If the crop of concern can be consumed as a whole without any processing/peeling- the calculated threshold residue and threshold MRL have the same value.
Dietary exposure assessment and risk assessment Dietary exposure assessment is the quantitative evaluation of the intake of pesticides via food. In the chronic and acute risk assessment, the estimated long-term and short-term dietary exposure, calculated per kg body weight, is compared with the relevant toxicological reference values, i.e. the acceptable daily intake (ADI) and the Acute Reference Dose (ARfD), respectively (see “ADI” and “ARfD” above). A consumer health risk is identified if the estimated dietary exposure to a pesticide, taking into account the scientific uncertainties, exceeds the ADI and/or the ARfD.
Acceptable Daily Intake (ADI) The Acceptable Daily Intake (ADI) is the estimated amount of substance in food, expressed on a body weight basis, that can be ingested daily over a lifetime, without appreciable chronic, long-term risk to any consumer. The ADI is set on the basis of all known facts at the time of evaluation, taking into account sensitive groups within the population (e.g. children and the unborn).
Acute Reference Dose (ARfD) The Acute Reference Dose (ARfD) is the estimated amount of substance in food, expressed on a body weight basis, that can be ingested over a short period of time, usually during one day, without appreciable risk to the consumer (Regulation (EC) No. 396/2005 (EC 2005a)). The ARfD is set on the basis of the data produced by appropriate studies and taking into account sensitive groups within the population (e.g. children and the unborn).
Analytical methods The results of monitoring analysis are strongly influenced by the analytical methods used to analyse the samples. The analytical methods used in pesticide residue analysis have to fulfil certain criteria regarding specificity, sensitivity, precision accuracy, robustness and linearity which are defined in guidance documents ((EC 2007b), post-registration guidance document). Also the scope of the analytical methods (the list of pesticides included in the analytical methods) has an impact on the number of positive findings in samples analysed. If the analytical method applied is not capable of detecting a certain pesticide active substance applied to the crop – or its toxicologically relevant metabolites or break-down products - the sample may be considered by mistake to be free of pesticide residues. Additionally, if the analytical method is not sensitive enough, the pesticide will not be detected in cases where the residue occurs at a low concentration. Therefore, the results reported by reporting countries have to be considered in the context of the analytical methods used.
The analytical methods used today to detect and quantify pesticide residues in food commodities fall into two general types of method: multi-residue and single-residue methods. Multi-residue methods are able to analyse a high number of different pesticide residues in the same sample. However, certain pesticides and metabolites cannot be included in multi-residue methods because of their physical-chemical properties (e.g. acidic or polar chemicals). In these cases, single-residue methods have to be applied. Single-residue methods allow the identification and quantification of only one or a few pesticide residues in one sample. Since these two types of method require a comparable processing time per sample, multi-residue methods are usually preferred over single-residue methods, as they are generally more efficient in terms of cost/benefit ratio. Single-residue methods are therefore preferable for samples where previous experience shows that it is likely that residues of the pesticides in question will be found.
European Reference Laboratory (EURL) The European Reference Laboratories (EURLs), in the past called “Community Reference Laboratories” - CRLs), are appointed by the European Commission, co-ordinate, train staff, develop methods of analysis and organise tests to evaluate the skills of the different national control
2008 Annual Report on Pesticide Residues
15
EFSA Journal 2010; 8(6):1646
laboratories. The overall objective of the EURLs is to improve the quality, accuracy and comparability of the results from official control laboratories.
Limit of Quantification (LOQ) The Limit of Quantification (LOQ) is the lowest validated residue concentration, which can be quantified and reported by routine monitoring with validated methods (EC 2009). In the context of this report, when samples are reported as having residues below the LOQ it can mean that no pesticide residues occurs or that very low concentration are present at a level that cannot be quantified with acceptable certainty. In the present report, the term Reporting Level (see “Reporting Level” below) is also used as a synonym of the LOQ9.
Reporting Level (RL) The Reporting Level is lowest level at which residues will be reported as absolute numbers. It may represent the practical LOQ, or it may be above that level to limit costs. For EU monitoring purposes, where samples for surveys are analysed over a 12-month period, the same reporting limit should be achievable throughout the whole year (EC 2009).
Interval of confidence Several tables show information on frequency (percentage) of e.g. number of samples with residues above MRL. The precision of the value is dependent on the sample size. To express the uncertainty of the estimation, 95% confidence intervals were calculated using the Clopper Pearson approach with F distribution (Johnson 2005). The true proportion of samples is most likely equal to the calculated value with 95% confidence that lies between the upper and lower confidence limits (UCI and LCI). It is important to note that when no exceedance of the MRL was observed, there is still the statistical possibility that the MRL is exceeded by other samples of the same food commodity. The one-sided confidence interval for no observed exceedance describes this possibility.
Sampling methodology To ensure that a sample taken is representative for a given food lot/consignment, the sampling has to be performed according to the sampling methodology for the official control of pesticide residues, as established by Commission Directive 2002/63/EC (EC 2002). For most plant products the minimum size of a laboratory sample is between one or two kilograms of the food item.
Sampling strategy The sampling strategy is the approach used to select the units of the target population subject to control. Implementation of an efficient, targeted sampling strategy would result in a higher percentage of positive findings and non-compliant results. Thus, it is important to stress that, for a correct interpretation of the results obtained in control programmes, information about the sampling strategy applied is indispensable. In the report, the following terminology has been used to distinguish between more, or less, targeted sampling.
Surveillance sampling: samples are collected without any particular suspicion towards a particular producer, consignment, etc. Surveillance samples could be targeted for specific food products and countries, but the selection of samples is randomised. The samples taken in the framework of the EC coordinated programme are considered to be surveillance samples.
Enforcement sampling: samples are taken if there is suspicion about the safety of a product and/or as a follow-up of violations found previously. The selection of the samples is not randomised and therefore
9 In the EU MRL legislation, the term LOD (Limit of Determination) is used instead of the term of LOQ. However, EFSA
prefers using the term LOQ in order to avoid possible confusion with the term LOD that is used to indicate the Limit of Detection.
2008 Annual Report on Pesticide Residues
16
EFSA Journal 2010; 8(6):1646
cannot be considered representative of the food available on the European market. Follow-up or enforcement sampling is directed to a specific grower/producer or to a specific consignment.
Thus, the key difference between surveillance and enforcement sampling is not so much targeting but randomisation of the selected samples.
In Appendix I to the present report more details on the general sampling strategies applied at national level are reported.
Quality assurance All laboratories performing analysis of pesticide residues in food should be accredited to certain standards (EC 2004). However, until 31 December 2009, these analyses could also be carried out by non-accredited laboratories, provided that the laboratories had initiated the accreditation procedures, and that quality control schemes were in place (EC 2005b).
Commission Recommendation 2008/103/EC (EC 2008a) requires Member States to provide information about the details of accreditation of the laboratories which carry out the analysis for the monitoring programme, about the application of the EU Quality Control Procedures for Pesticide Residue Analysis (EC 2009) and about their participation in proficiency and ring tests. It also requires the reporting countries contributing to the monitoring to provide the accreditation certificates.
Rapid Alert System for Food and Feed (RASFF) If in control activities pesticides are found at a concentration level of concern for consumer health, the Rapid Alert System for Food and Feed (RASFF) circulates the information among competent authorities and measures are taken to protect the consumer. Thus, RASFF is to ensure that urgent notifications are sent, received and responded to in the shortest time possible by all members of the RASFF (EU Member States, Commission, EFSA and Norway, Liechtenstein and Iceland).
2008 Annual Report on Pesticide Residues
17
EFSA Journal 2010; 8(6):1646
2. Design and background on the monitoring programmes
To fulfil the requirements of Regulation (EC) No. 882/2004 (EC 2004), EU Member States perform official controls to ensure the compliance of feed and food samples with regard to the pesticide MRL legislation.
Typically, in each European reporting country, two monitoring programmes are in place: a national control/monitoring programme (designed by each country) and a coordinated European programme which gives clear guidance on which specific control activities should be performed by the Member States.
2.1. EU coordinated programme
The EU coordinated programme aims to provide statistically representative data regarding pesticide residues in food available to European consumers (EC 2005a). The lots sampled should be chosen without any particular suspicion towards a specific producer and/or consignment. Thus, the results obtained in the coordinated programme are considered as an indicator for the MRL compliance rate in food placed on the European common market and they allow an estimation of the actual consumer exposure.
The establishment of a coordinated community programme was initiated in 1996. Since then, the number of participating reporting countries has increased; in 1996, 15 EU Member States and one EFTA State (Norway) reported their monitoring results, whereas in 2008 the number of participating countries was 29: 27 EU Member States and two EFTA countries (Norway and Iceland) who have signed the Agreement on the European Economic Area (EEA agreement). Over time, the programme was also extended with regard to the number of samples, the food commodities and the active substances to be analysed each monitoring year.
The coordinated monitoring programme is laid down in Commission Recommendation 2008/103/EC concerning a coordinated Community monitoring programme for 2008 (EC 2008a).
2.1.1. Food commodities analysed
The major components of the European diet are constituted by 20 to 30 food products. Monitoring the pesticide residues in these commodities should provide a representative basis for estimating the exposure to pesticide residues in food of European consumers. In view of the resources available at national level, participating countries focus on the sampling and analysis of eight to nine products each year, which are tested in a three-year cycle, covering in total the major food items. Food commodities to be analysed in 2008, 2009, and 2010 in the framework of the EU coordinated programme are shown in table 2.1.1-1.

2008 Annual Report on Pesticide Residues
18
EFSA Journal 2010; 8(6):1646
Table 2.1.1-1: Food commodities (plant origin) to be monitored in the calendar years 2008, 2009, and 2010 in the framework of the EU coordinated programme (EC 2008a; EC 2008b).
2008 2009 2010Beans without pods (a) Aubergines Apples Carrots Bananas Head cabbage Cucumbers Cauliflower Leek Mandarins Grapes Lettuce Oranges Orange juice (b) Peaches (c) Pears Peas without pods (a) Rye or oats Potatoes Pepper (sweet) Swine meat Rice Wheat Strawberries Spinach (a) Tomatoes
(a): Fresh or frozen (b): For orange juice, reporting countries should specify the source, e.g. concentrate or fresh fruit (c): Peaches including nectarines and similar hybrids
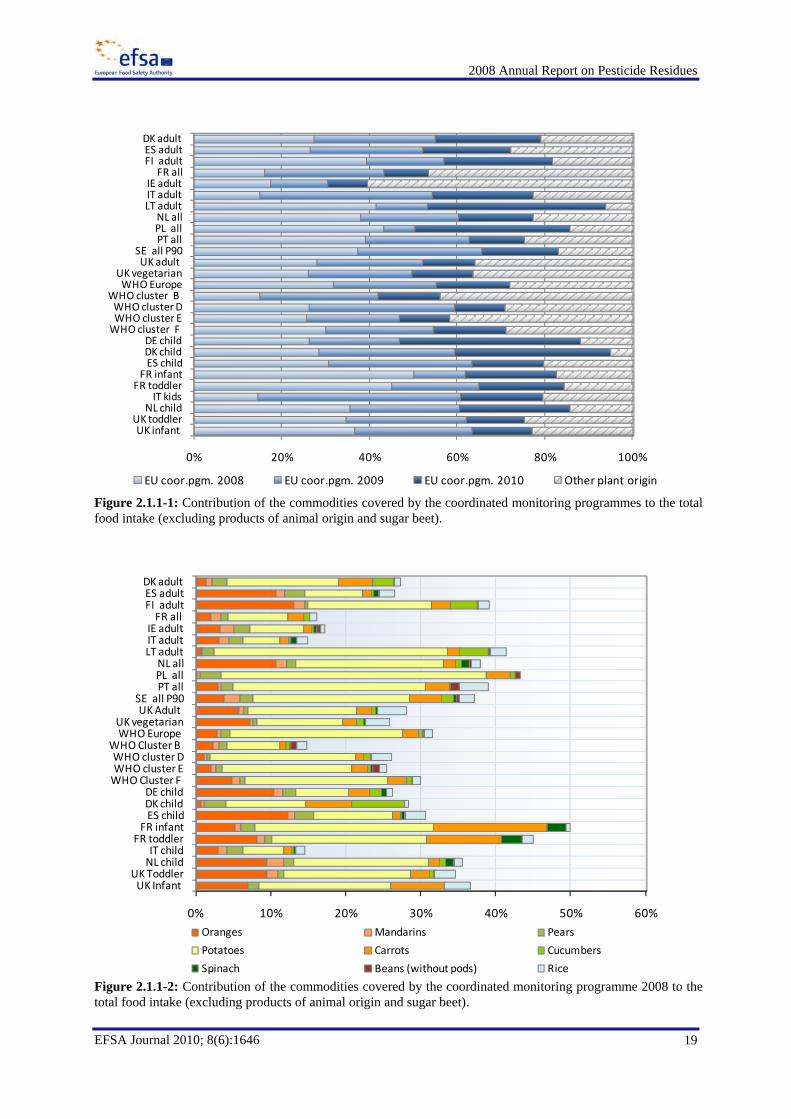
Figure 2.1.1-1 shows the proportion of the food commodities included in the EU coordinated residue monitoring programme for 2008 and the next two years, compared with the total food consumption of food items of plant origin. The food consumption data were retrieved from national food consumption surveys either for the whole population, adults, children or selected consumer groups (e.g. vegetarians) or other sources of information suitable to conclude on the food habits of the European population such as food balance sheets (e.g. WHO diets). The data regarding the national food consumption were submitted to EFSA in the framework of the development of the EFSA PRIMo (Pesticide Residue Intake Model) and the details of the diet in each Member State can be found in the EFSA report on temporary MRLs (EFSA 2007). It should be noted that not all participating countries had submitted food consumption data to EFSA at that time and therefore are not represented in the graph.
2008 Annual Report on Pesticide Residues
19
EFSA Journal 2010; 8(6):1646
Figure 2.1.1-1: Contribution of the commodities covered by the coordinated monitoring programmes to the total food intake (excluding products of animal origin and sugar beet).
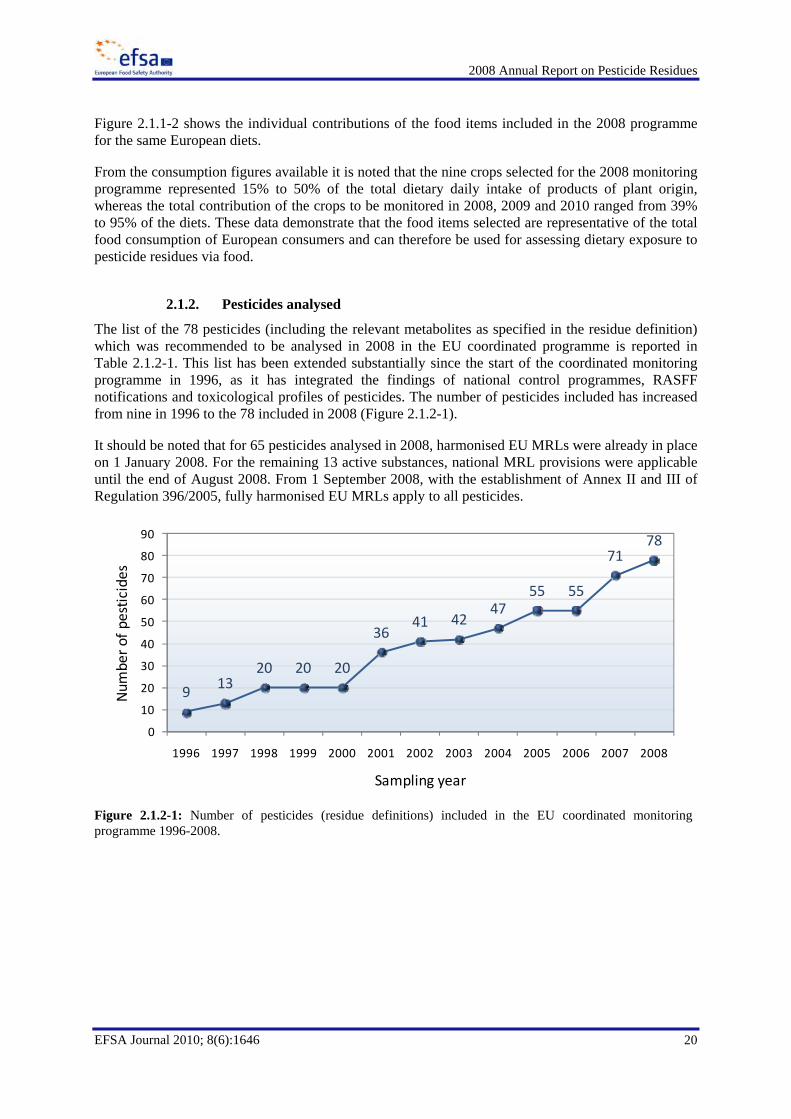
Figure 2.1.1-2: Contribution of the commodities covered by the coordinated monitoring programme 2008 to the total food intake (excluding products of animal origin and sugar beet).
0% 20% 40% 60% 80% 100%
DK adultES adultFI adult
FR allIE adultIT adultLT adultNL allPL allPT all
SE all P90UK adult
UK vegetarianWHO Europe
WHO cluster B WHO cluster DWHO cluster EWHO cluster F
DE childDK childES child
FR infantFR toddler
IT kidsNL child
UK toddlerUK infant
EU coor.pgm. 2008 EU coor.pgm. 2009 EU coor.pgm. 2010 Other plant origin
0% 10% 20% 30% 40% 50% 60%
DK adultES adultFI adultFR all
IE adultIT adultLT adultNL allPL allPT all
SE all P90UK Adult
UK vegetarianWHO Europe
WHO Cluster B WHO cluster DWHO cluster EWHO Cluster F
DE childDK childES child
FR infantFR toddler
IT childNL child
UK ToddlerUK Infant
Oranges Mandarins Pears
Potatoes Carrots Cucumbers
Spinach Beans (without pods) Rice
2008 Annual Report on Pesticide Residues
20
EFSA Journal 2010; 8(6):1646
Figure 2.1.1-2 shows the individual contributions of the food items included in the 2008 programme for the same European diets.
From the consumption figures available it is noted that the nine crops selected for the 2008 monitoring programme represented 15% to 50% of the total dietary daily intake of products of plant origin, whereas the total contribution of the crops to be monitored in 2008, 2009 and 2010 ranged from 39% to 95% of the diets. These data demonstrate that the food items selected are representative of the total food consumption of European consumers and can therefore be used for assessing dietary exposure to pesticide residues via food.
2.1.2. Pesticides analysed
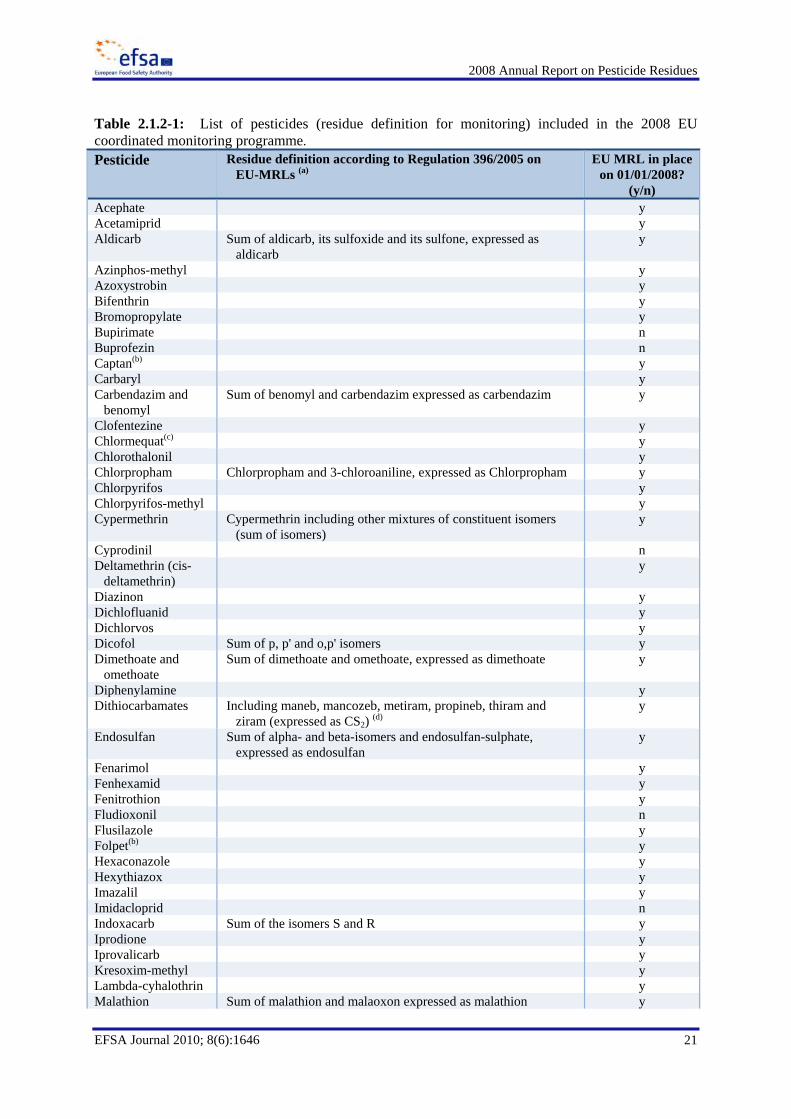
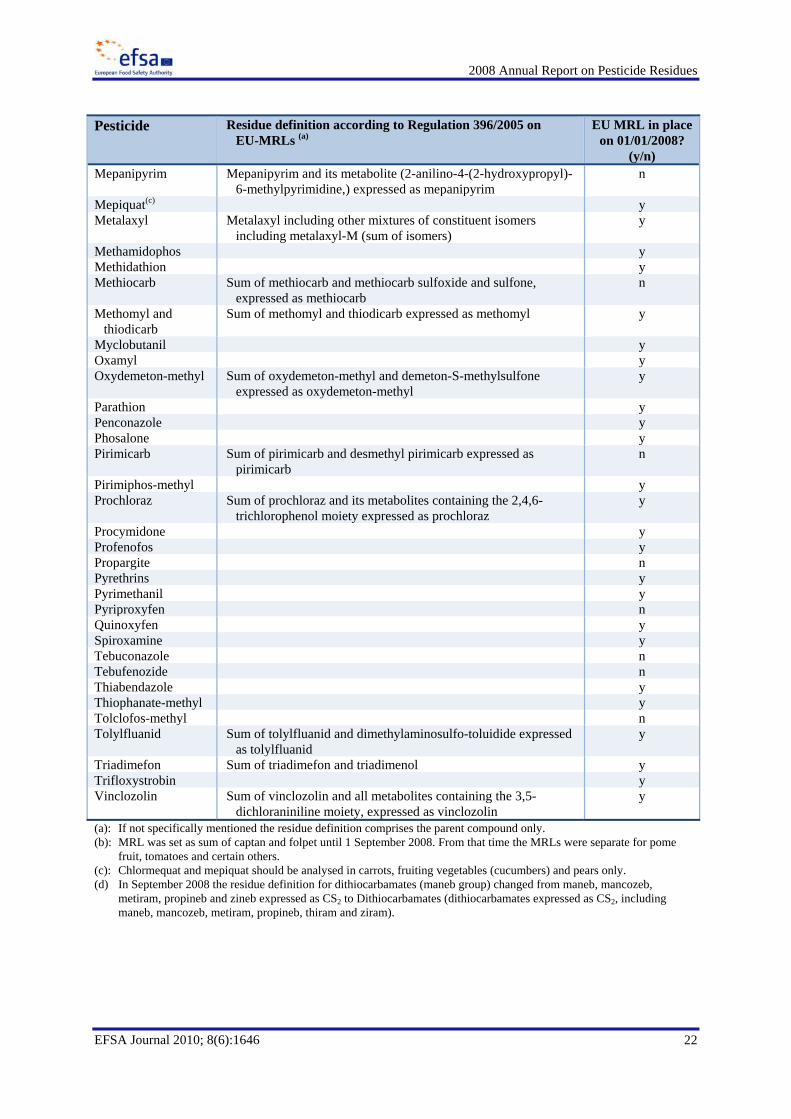
The list of the 78 pesticides (including the relevant metabolites as specified in the residue definition) which was recommended to be analysed in 2008 in the EU coordinated programme is reported in Table 2.1.2-1. This list has been extended substantially since the start of the coordinated monitoring programme in 1996, as it has integrated the findings of national control programmes, RASFF notifications and toxicological profiles of pesticides. The number of pesticides included has increased from nine in 1996 to the 78 included in 2008 (Figure 2.1.2-1).
It should be noted that for 65 pesticides analysed in 2008, harmonised EU MRLs were already in place on 1 January 2008. For the remaining 13 active substances, national MRL provisions were applicable until the end of August 2008. From 1 September 2008, with the establishment of Annex II and III of Regulation 396/2005, fully harmonised EU MRLs apply to all pesticides.
Figure 2.1.2-1: Number of pesticides (residue definitions) included in the EU coordinated monitoring programme 1996-2008.
9 1320 20 20
3641 42
4755 55
7178
0
10
20
30
40
50
60
70
80
90
1996 1997 1998 1999 2000 2001 2002 2003 2004 2005 2006 2007 2008
Num
ber o
f pesticides
Sampling year
2008 Annual Report on Pesticide Residues
21
EFSA Journal 2010; 8(6):1646
Table 2.1.2-1: List of pesticides (residue definition for monitoring) included in the 2008 EU coordinated monitoring programme. Pesticide Residue definition according to Regulation 396/2005 on
EU-MRLs (a) EU MRL in place
on 01/01/2008? (y/n)
Acephate y Acetamiprid y Aldicarb Sum of aldicarb, its sulfoxide and its sulfone, expressed as
aldicarb y
Azinphos-methyl y Azoxystrobin y Bifenthrin y Bromopropylate y Bupirimate n Buprofezin n Captan(b) y Carbaryl y Carbendazim and
benomyl Sum of benomyl and carbendazim expressed as carbendazim y
Clofentezine y Chlormequat(c) y Chlorothalonil y Chlorpropham Chlorpropham and 3-chloroaniline, expressed as Chlorpropham y Chlorpyrifos y Chlorpyrifos-methyl y Cypermethrin Cypermethrin including other mixtures of constituent isomers
(sum of isomers) y
Cyprodinil n Deltamethrin (cis-
deltamethrin) y
Diazinon y Dichlofluanid y Dichlorvos y Dicofol Sum of p, p' and o,p' isomers y Dimethoate and
omethoate Sum of dimethoate and omethoate, expressed as dimethoate y
Diphenylamine y Dithiocarbamates Including maneb, mancozeb, metiram, propineb, thiram and
ziram (expressed as CS2) (d) y
Endosulfan Sum of alpha- and beta-isomers and endosulfan-sulphate, expressed as endosulfan
y
Fenarimol y Fenhexamid y Fenitrothion y Fludioxonil n Flusilazole y Folpet(b) y Hexaconazole y Hexythiazox y Imazalil y Imidacloprid n Indoxacarb Sum of the isomers S and R y Iprodione y Iprovalicarb y Kresoxim-methyl y Lambda-cyhalothrin y Malathion Sum of malathion and malaoxon expressed as malathion y
2008 Annual Report on Pesticide Residues
22
EFSA Journal 2010; 8(6):1646
Pesticide Residue definition according to Regulation 396/2005 on EU-MRLs (a)
EU MRL in place on 01/01/2008?
(y/n) Mepanipyrim Mepanipyrim and its metabolite (2-anilino-4-(2-hydroxypropyl)-
6-methylpyrimidine,) expressed as mepanipyrim n
Mepiquat(c) y Metalaxyl Metalaxyl including other mixtures of constituent isomers
including metalaxyl-M (sum of isomers) y
Methamidophos y Methidathion y Methiocarb Sum of methiocarb and methiocarb sulfoxide and sulfone,
expressed as methiocarb n
Methomyl and thiodicarb
Sum of methomyl and thiodicarb expressed as methomyl y
Myclobutanil y Oxamyl y Oxydemeton-methyl Sum of oxydemeton-methyl and demeton-S-methylsulfone
expressed as oxydemeton-methyl y
Parathion y Penconazole y Phosalone y Pirimicarb Sum of pirimicarb and desmethyl pirimicarb expressed as
pirimicarb n
Pirimiphos-methyl y Prochloraz Sum of prochloraz and its metabolites containing the 2,4,6-
trichlorophenol moiety expressed as prochloraz y
Procymidone y Profenofos y Propargite n Pyrethrins y Pyrimethanil y Pyriproxyfen n Quinoxyfen y Spiroxamine y Tebuconazole n Tebufenozide n Thiabendazole y Thiophanate-methyl y Tolclofos-methyl n Tolylfluanid Sum of tolylfluanid and dimethylaminosulfo-toluidide expressed
as tolylfluanid y
Triadimefon Sum of triadimefon and triadimenol y Trifloxystrobin y Vinclozolin Sum of vinclozolin and all metabolites containing the 3,5-
dichloraniniline moiety, expressed as vinclozolin y
(a): If not specifically mentioned the residue definition comprises the parent compound only. (b): MRL was set as sum of captan and folpet until 1 September 2008. From that time the MRLs were separate for pome
fruit, tomatoes and certain others. (c): Chlormequat and mepiquat should be analysed in carrots, fruiting vegetables (cucumbers) and pears only. (d) In September 2008 the residue definition for dithiocarbamates (maneb group) changed from maneb, mancozeb,
metiram, propineb and zineb expressed as CS2 to Dithiocarbamates (dithiocarbamates expressed as CS2, including maneb, mancozeb, metiram, propineb, thiram and ziram).
2008 Annual Report on Pesticide Residues
23
EFSA Journal 2010; 8(6):1646
Comparing the data submitted by the reporting countries with the Recommendation, it becomes evident that some Member States did not analyse the requested pesticides in all samples. 13 pesticides were analysed in less than 50% of the samples, 30 in less than 60% of the samples. These are mainly substances which can only be analysed with single-residue methods and are considered to be very resource consuming. However, it should be noted that in 2008 participation in the EU coordinated programme was not yet mandatory.
2.1.3. Number of samples
The Monitoring Recommendation (EC 2008a) indicates the minimum number of samples to be analysed in the framework of the 2008 EU coordinated programme, varying from 12 or 15 to 93 samples per product depending on the population of the Member State10. Table 2.1.3-1 gives an overview of the number of samples requested and the actual number of samples taken by each reporting country for each commodity.
A total number of 11,610 samples of nine different commodities were analysed in the 2008 EU coordinated pesticide monitoring programme (Figure 2.1.3-1).
Figure 2.1.3-1: Number of surveillance samples in 2008 EU coordinated programme taken by reporting 10 The number of samples to be analysed was derived on the basis of a binomial probability distribution, which estimated that
the examination of 642 samples allows with a certainty of more than 99 %, the detection of a sample containing pesticide residues above the limit of determination (LOD), provided that not less than 1 % of products of plant origin contain residues above that limit. According to Recommendation 2008/10//EC the collection of these samples should be apportioned between Member States on the basis of population and consumer numbers, with a minimum of 12 samples per product and per year.
Italy; 1747
United Kingdom; 936France; 813
Netherlands; 808
Romania; 796
Germany; 729
Spain; 537
Portugal; 462
Denmark; 445
Poland; 409
Sweden; 380Finland; 365
Norway; 362Slovenia; 318
Belgium; 292Ireland; 283
Bulgaria; 278Cyprus; 262
Czech Republic; 254
Greece; 215
Hungary; 150Estonia; 121Lithuania; 114
Slovakia; 112
Austria; 103
Latvia; 100
Luxembourg; 96
Malta; 77
Iceland; 46
2008 Annual Report on Pesticide Residues
24
EFSA Journal 2010; 8(6):1646
countries. Total number of samples: 11,610
2008 Annual Report on Pesticide Residues
25
EFSA Journal 2010; 8(6):1646
Table 2.1.3-1: Number of samples taken by each reporting country for the 2008 EU coordinated programme by commodity. Country Minimum number of
samples per commodity
Beans without
pods
Carrots Cucumber Mandarins**
Oranges **
Pears Potatoes Rice Spinach
Austria 12/15* 0 15 15 2 13 16 15 15 12 Belgium 12/15* 1 52 21 25 56 42 61 4 30 Bulgaria 12/15* 15 48 59 15 16 16 67 15 27 Cyprus 12/15* 0 33 30 13 18 29 79 28 32 Czech Republic 12/15* 24 38 44 15 27 35 27 24 20 Denmark 12/15* 0 55 51 51 85 61 75 28 39 Estonia 12/15* 2 21 12 14 0 13 34 12 13 Finland 12/15* 4 39 48 54 92 31 35 39 23 France 66 2 126 70 80 99 95 155 115 71 Germany 93 0 105 94 106 0 121 113 88 102 Greece 12/15* 22 27 26 18 25 26 25 23 23 Hungary 12/15* 13 15 13 15 18 24 24 13 15 Iceland Not specified 0 11 15 9 0 11 0 0 0 Ireland 12/15* 15 33 14 59 45 37 47 17 16 Italy 65 123 197 104 189 272 343 290 153 76 Latvia 12/15* 11 15 15 0 10 15 14 13 7 Lithuania 12/15* 16 15 17 5 12 13 13 13 10 Luxembourg 12/15* 0 12 12 5 10 13 13 20 11 Malta 12/15* 3 13 7 0 15 8 19 0 12 Netherlands 17 0 93 149 135 184 91 66 36 54 Norway Not specified 0 85 46 32 57 49 46 25 22 Poland 45 47 49 50 11 40 50 61 50 51 Portugal 12/15* 58 64 51 17 50 54 57 56 55 Romania 17 0 89 103 38 142 90 200 68 66 Slovakia 12/15* 0 15 14 4 13 18 17 15 16 Slovenia 12/15* 8 47 55 13 23 52 84 15 21 Spain 45 16 96 69 22 68 110 70 38 48 Sweden 12/15* 1 26 29 61 65 62 46 65 25 United Kingdom 66 0 96 96 24 95 144 301 72 108 Total 381 1530 1329 1032 1550 1669 2054 1060 1005 *: The minimum of 12 samples has to be taken if a single residue method has to be applied. Otherwise (i.e. multi residue methods) 15 samples are the minimum. **: The minimum number of samples refers to the sum of mandarins and oranges.
2008 Annual Report on Pesticide Residues
26
EFSA Journal 2010; 8(6):1646
It was noted that for beans without pods, 17 reporting countries did not report the number of samples as specified in the Monitoring Recommendation, probably because this food commodity is not available in these countries. EFSA therefore recommends replacing beans without pods with an alternative food commodity commonly available in all reporting countries and which is relevant regarding the food consumption. As an alternative product green beans with pods are proposed. For the other food commodities most Member States could comply with the Monitoring Recommendations or they even significantly exceeded the number of samples.
The 2008 Monitoring Recommendations (EC 2008a) proposed a list of food commodities, a list of pesticides to be analysed in these commodities and the number of samples of these commodities to be analysed by each country. From the actual number of determinations performed in 2008 it can be seen that the expected number of determinations (calculated from the recommended number of substances and the recommended number of samples taken) has not been achieved (Figure 2.1.3-2). This could be caused by resource limitation in the reporting countries or by analytical difficulties. However, it should be recalled that participation to the EU coordinated monitoring programme was not yet mandatory in 2008.
Figure 2.1.3-2: Number of actual determinations reported as a percentage of the expected number for each commodity for the 2008 EU coordinated programme.
2.2. National programmes
The official controls carried out at national level in the framework of the national monitoring programmes are complementary to the control performed in the context of the EU coordinated programme and are performed to ensure compliance with the provisions established in food legislation regarding pesticide residues. Member States and EFTA countries are free to decide on the design of the national monitoring programmes for pesticide residues in food.
In designing their national control plans, the reporting countries typically take into account the following factors:
• Importance of a commodity in national food consumption;
28575
119340
103662
78432
117800
128513
156104
80560
76380
55%
70%
70%
76%
70%
72%
73%
56%
73%
0 50000 100000 150000 200000
Beans (without pods)
Carrots
Cucumbers
Mandarins
Oranges
Pears
Potatoes
Rice
Spinach
Number of determinations reported Expected number of determinations
2008 Annual Report on Pesticide Residues
27
EFSA Journal 2010; 8(6):1646
• Food commodities with high residues/non-compliance rate in previous years;
• Food consumed fresh or in processed form;
• Balance of organic/conventional production;
• Origin of food: domestic, EU or third countries;
• Sampling at different marketing levels: farm gates, wholesaler, retailer, processing industry, schools or restaurants;
• Seasonal availability of food commodities;
• RASFF notifications;
• Food for sensitive groups of the population, e.g. baby food;
• Geographic representatives for the reporting country/cultivation area;
• Food produced by producers with non-compliance in the past;
• Food commodities not included in the EU coordinated programme.
Regarding the pesticides included in the national control programmes, the reporting countries consider:
• Use pattern of pesticides;
• Toxicity of the active substances;
• Cost of the analysis: single methods /multiple methods;
• Capacity of laboratories.
More details on the design of the national monitoring programmes are reported in Appendix II of the current report. The number of samples and the analytical scope of the analysis performed by the participating countries are strongly determined by national budgets. Thus, reporting countries have to focus on specific aspects which are considered most relevant for their national control activities. These results are of value for consumer exposure assessment at national level; however, due to the variability of the programme designs, they should not be used for between-country comparisons at European level or for exposure assessment for the European population.
2.2.1. Number of samples – national programmes
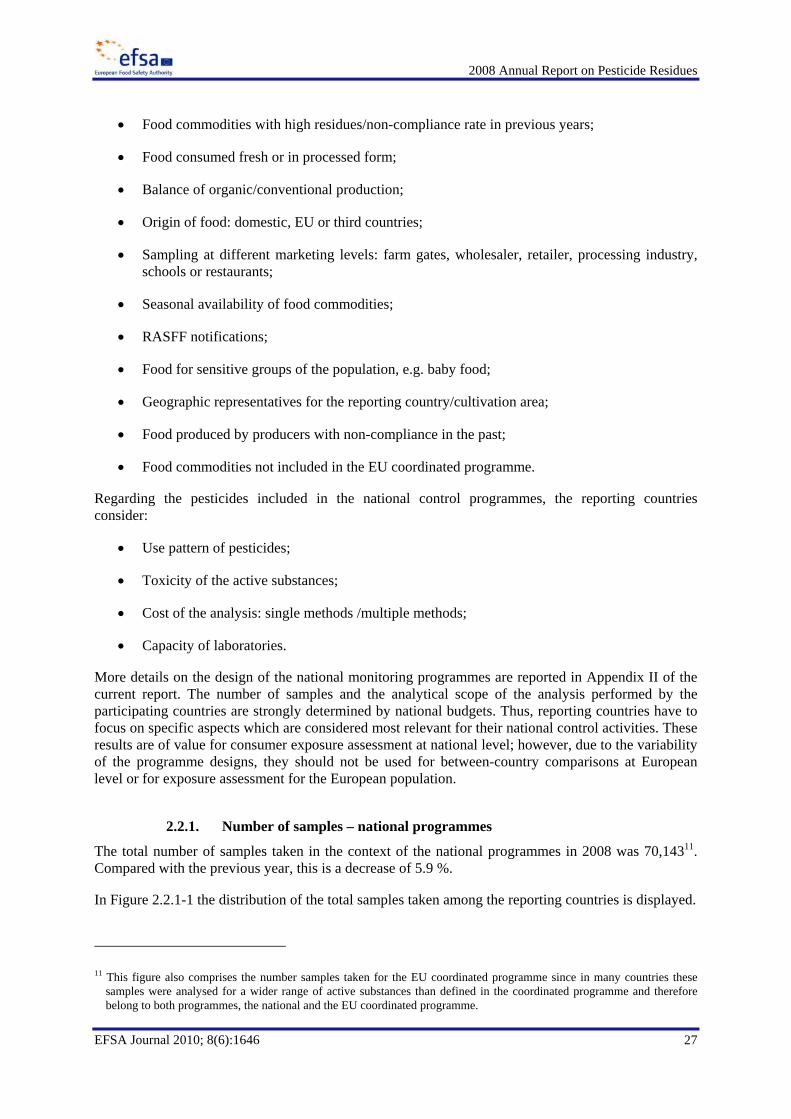
The total number of samples taken in the context of the national programmes in 2008 was 70,14311. Compared with the previous year, this is a decrease of 5.9 %.
In Figure 2.2.1-1 the distribution of the total samples taken among the reporting countries is displayed.
11 This figure also comprises the number samples taken for the EU coordinated programme since in many countries these
samples were analysed for a wider range of active substances than defined in the coordinated programme and therefore belong to both programmes, the national and the EU coordinated programme.
2008 Annual Report on Pesticide Residues
28
EFSA Journal 2010; 8(6):1646
Figure 2.2.1-1: Total number of samples taken in 2008 by each reporting country (surveillance and enforcement samples of fruit, vegetables, cereals, processed commodities and baby food).
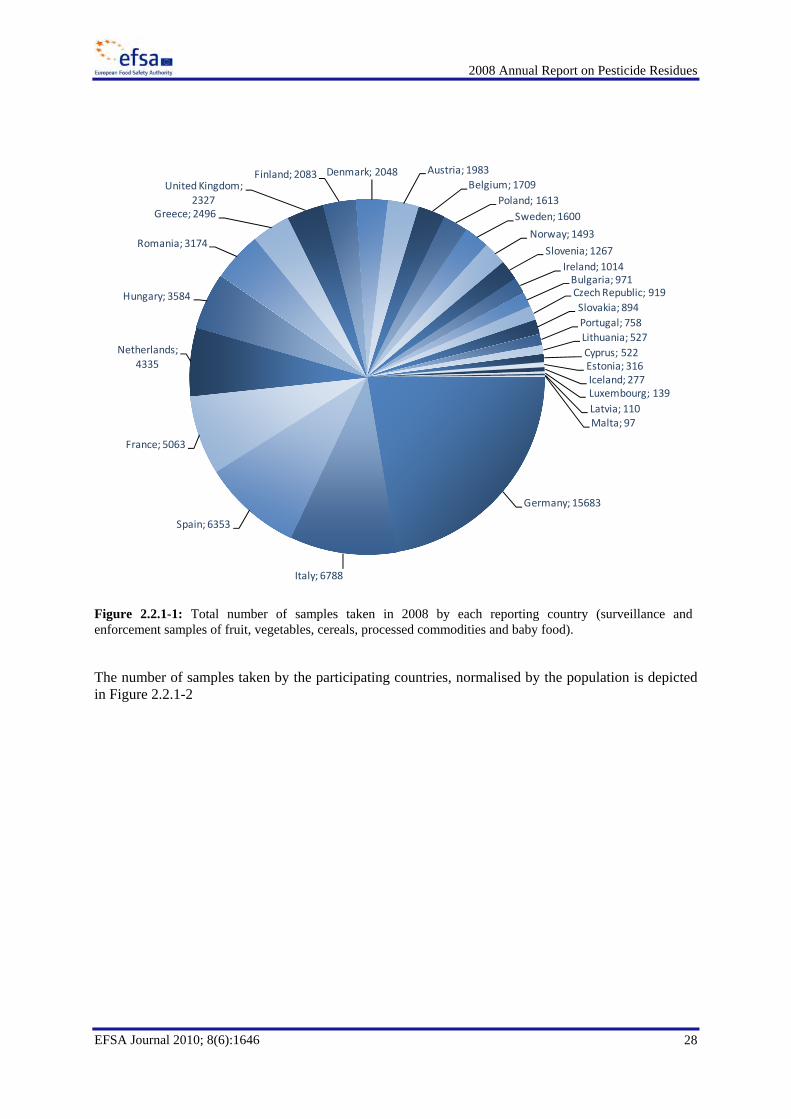
The number of samples taken by the participating countries, normalised by the population is depicted in Figure 2.2.1-2
Germany; 15683
Italy; 6788
Spain; 6353
France; 5063
Netherlands;4335
Hungary; 3584
Romania; 3174
Greece; 2496
United Kingdom; 2327
Finland; 2083 Denmark; 2048 Austria; 1983Belgium; 1709
Poland; 1613Sweden; 1600
Norway; 1493
Slovenia; 1267Ireland; 1014Bulgaria; 971Czech Republic; 919Slovakia; 894Portugal; 758Lithuania; 527Cyprus; 522Estonia; 316Iceland; 277Luxembourg; 139Latvia; 110Malta; 97
2008 Annual Report on Pesticide Residues
29
EFSA Journal 2010; 8(6):1646
Depending on the sampling strategy applied, i.e. the degree of targeting in selecting the samples to be analysed for pesticide residues, the national programmes are classified as either surveillance or enforcement programmes.
In the surveillance programmes, samples are taken without any particular suspicion towards a specific producer and/or consignment. The EU coordinated programme is an example of surveillance programme. However, the national surveillance programmes are in most cases more targeted to achieve the objectives defined in the national control programmes and are therefore already focussed on specific pre-selected consignments or lots.
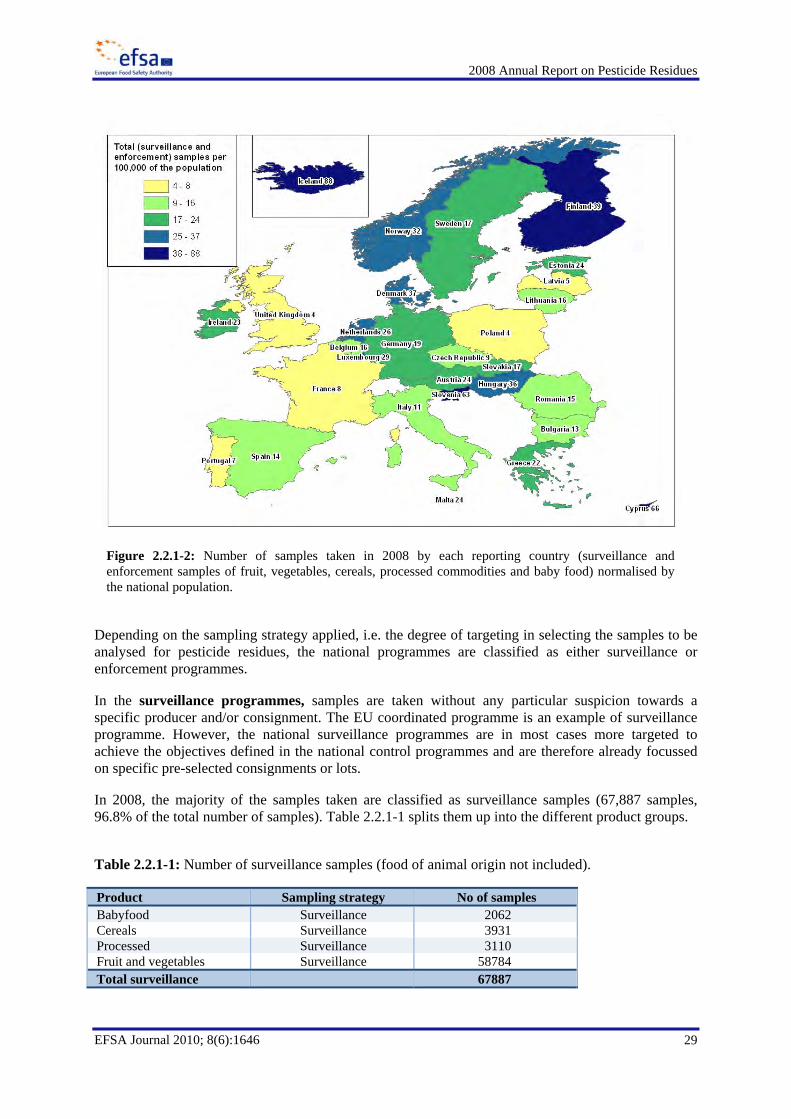
In 2008, the majority of the samples taken are classified as surveillance samples (67,887 samples, 96.8% of the total number of samples). Table 2.2.1-1 splits them up into the different product groups.
Table 2.2.1-1: Number of surveillance samples (food of animal origin not included).
Product Sampling strategy No of samples Babyfood Surveillance 2062 Cereals Surveillance 3931 Processed Surveillance 3110 Fruit and vegetables Surveillance 58784 Total surveillance 67887
Figure 2.2.1-2: Number of samples taken in 2008 by each reporting country (surveillance and enforcement samples of fruit, vegetables, cereals, processed commodities and baby food) normalised by the national population.
2008 Annual Report on Pesticide Residues
30
EFSA Journal 2010; 8(6):1646
The number of surveillance samples taken and normalised per 100,000 inhabitants varied from 3 (Poland) to 88 (Iceland) (Figure 2.2.1-2).
Figure 2.2.1-2: Number of surveillance samples of fruit, vegetables, cereals normalised by the national population (100,000 inhabitants)
In enforcement programmes, the probability of finding samples with positive results or samples exceeding the legal limits is higher than in surveillance programmes in which, by definition, the selection of samples is randomised and not directed towards a specific food sample/consignment of a defined population of a given crop (e.g. apples). Thus, the key difference between surveillance and enforcement sampling is not so much targeting but randomisation of the selected samples. Surveillance samples could be targeted for specific food products and countries, but the selection of samples is randomised. In enforcement sampling the samples are not taken randomly and therefore cannot be considered representative of the food item available in the market place. Typically, enforcement samples are collected if there is a suspicion about the safety of a product and/or as follow-up of violations found previously. Follow-up or enforcement sampling is directed to a specific-grower/producer or to a specific food consignment.
The reader should be aware that because of this difference the results reported by different countries on the enforcement sampling cannot directly be compared with the results of surveillance sampling.
The total number of enforcement samples taken by all reporting countries was 2,256 (3.2% of the total number of samples). In Table 2.2.1-1, the breakdown of the total enforcement samples according to the food products is reported.
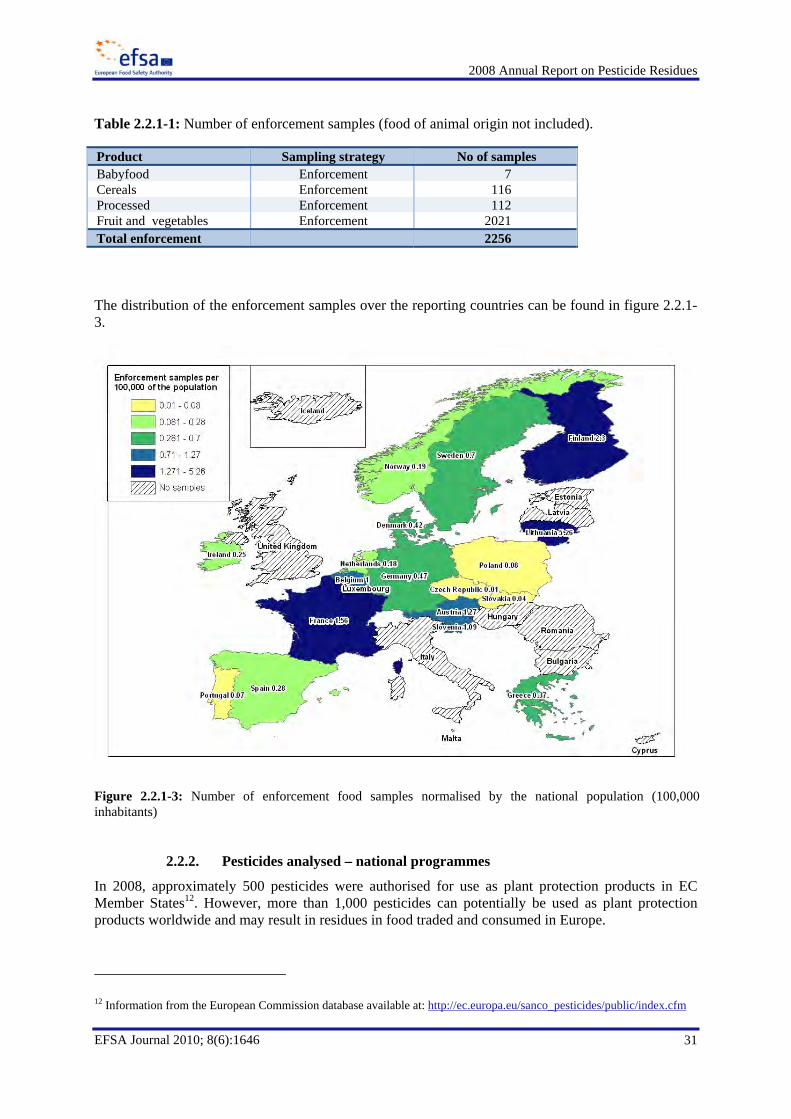
2008 Annual Report on Pesticide Residues
31
EFSA Journal 2010; 8(6):1646
Table 2.2.1-1: Number of enforcement samples (food of animal origin not included).
Product Sampling strategy No of samples Babyfood Enforcement 7 Cereals Enforcement 116 Processed Enforcement 112 Fruit and vegetables Enforcement 2021 Total enforcement 2256
The distribution of the enforcement samples over the reporting countries can be found in figure 2.2.1-3.
Figure 2.2.1-3: Number of enforcement food samples normalised by the national population (100,000 inhabitants)
2.2.2. Pesticides analysed – national programmes
In 2008, approximately 500 pesticides were authorised for use as plant protection products in EC Member States12. However, more than 1,000 pesticides can potentially be used as plant protection products worldwide and may result in residues in food traded and consumed in Europe.
12 Information from the European Commission database available at: http://ec.europa.eu/sanco_pesticides/public/index.cfm
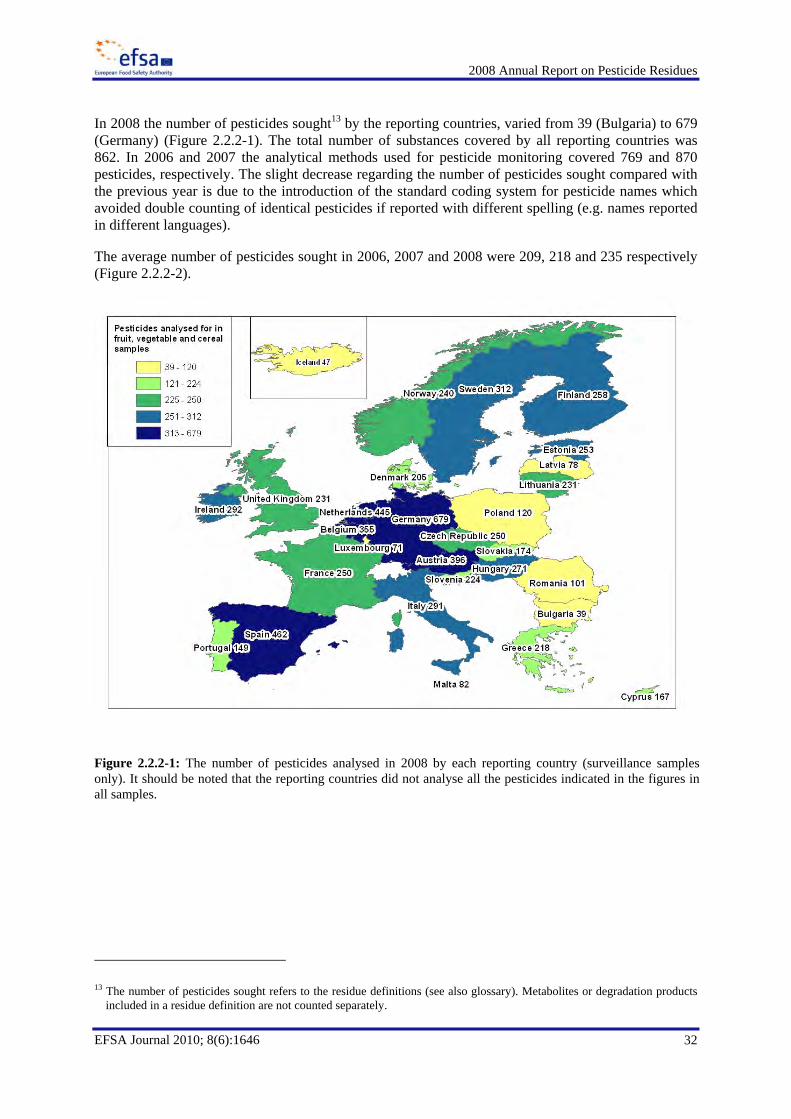
2008 Annual Report on Pesticide Residues
32
EFSA Journal 2010; 8(6):1646
In 2008 the number of pesticides sought13 by the reporting countries, varied from 39 (Bulgaria) to 679 (Germany) (Figure 2.2.2-1). The total number of substances covered by all reporting countries was 862. In 2006 and 2007 the analytical methods used for pesticide monitoring covered 769 and 870 pesticides, respectively. The slight decrease regarding the number of pesticides sought compared with the previous year is due to the introduction of the standard coding system for pesticide names which avoided double counting of identical pesticides if reported with different spelling (e.g. names reported in different languages).
The average number of pesticides sought in 2006, 2007 and 2008 were 209, 218 and 235 respectively (Figure 2.2.2-2).
Figure 2.2.2-1: The number of pesticides analysed in 2008 by each reporting country (surveillance samples only). It should be noted that the reporting countries did not analyse all the pesticides indicated in the figures in all samples.
13 The number of pesticides sought refers to the residue definitions (see also glossary). Metabolites or degradation products
included in a residue definition are not counted separately.
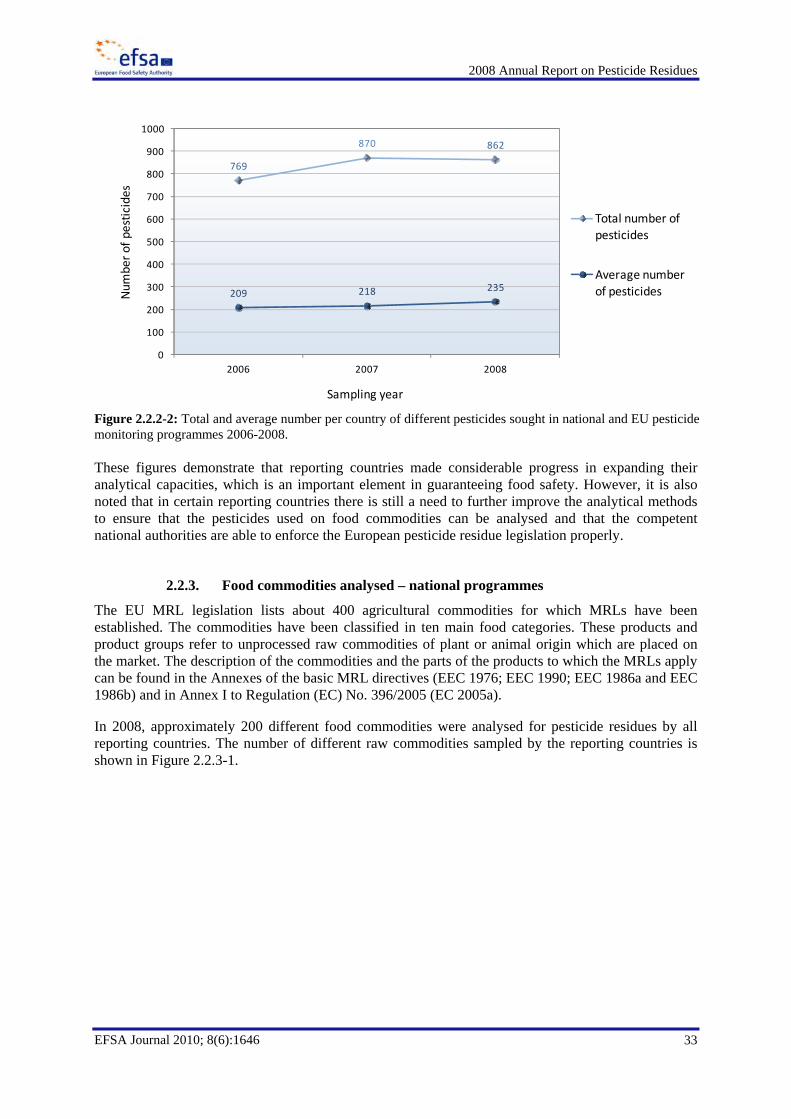
2008 Annual Report on Pesticide Residues
33
EFSA Journal 2010; 8(6):1646
Figure 2.2.2-2: Total and average number per country of different pesticides sought in national and EU pesticide monitoring programmes 2006-2008. These figures demonstrate that reporting countries made considerable progress in expanding their analytical capacities, which is an important element in guaranteeing food safety. However, it is also noted that in certain reporting countries there is still a need to further improve the analytical methods to ensure that the pesticides used on food commodities can be analysed and that the competent national authorities are able to enforce the European pesticide residue legislation properly.
2.2.3. Food commodities analysed – national programmes
The EU MRL legislation lists about 400 agricultural commodities for which MRLs have been established. The commodities have been classified in ten main food categories. These products and product groups refer to unprocessed raw commodities of plant or animal origin which are placed on the market. The description of the commodities and the parts of the products to which the MRLs apply can be found in the Annexes of the basic MRL directives (EEC 1976; EEC 1990; EEC 1986a and EEC 1986b) and in Annex I to Regulation (EC) No. 396/2005 (EC 2005a).
In 2008, approximately 200 different food commodities were analysed for pesticide residues by all reporting countries. The number of different raw commodities sampled by the reporting countries is shown in Figure 2.2.3-1.
769
870 862
209 218 235
0
100
200
300
400
500
600
700
800
900
1000
2006 2007 2008
Num
ber o
f pesticides
Sampling year
Total number of pesticides
Average number of pesticides
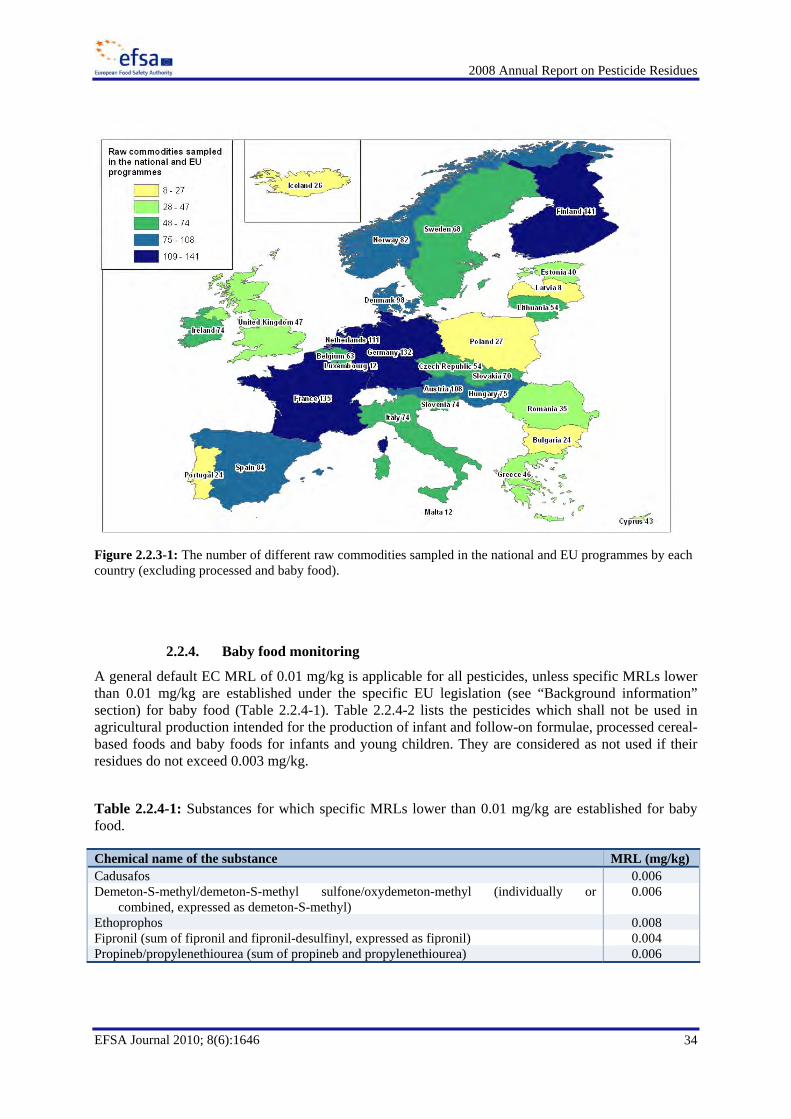
2008 Annual Report on Pesticide Residues
34
EFSA Journal 2010; 8(6):1646
Figure 2.2.3-1: The number of different raw commodities sampled in the national and EU programmes by each country (excluding processed and baby food).
2.2.4. Baby food monitoring
A general default EC MRL of 0.01 mg/kg is applicable for all pesticides, unless specific MRLs lower than 0.01 mg/kg are established under the specific EU legislation (see “Background information” section) for baby food (Table 2.2.4-1). Table 2.2.4-2 lists the pesticides which shall not be used in agricultural production intended for the production of infant and follow-on formulae, processed cereal-based foods and baby foods for infants and young children. They are considered as not used if their residues do not exceed 0.003 mg/kg.
Table 2.2.4-1: Substances for which specific MRLs lower than 0.01 mg/kg are established for baby food.
Chemical name of the substance MRL (mg/kg) Cadusafos 0.006 Demeton-S-methyl/demeton-S-methyl sulfone/oxydemeton-methyl (individually or
combined, expressed as demeton-S-methyl) 0.006
Ethoprophos 0.008 Fipronil (sum of fipronil and fipronil-desulfinyl, expressed as fipronil) 0.004 Propineb/propylenethiourea (sum of propineb and propylenethiourea) 0.006
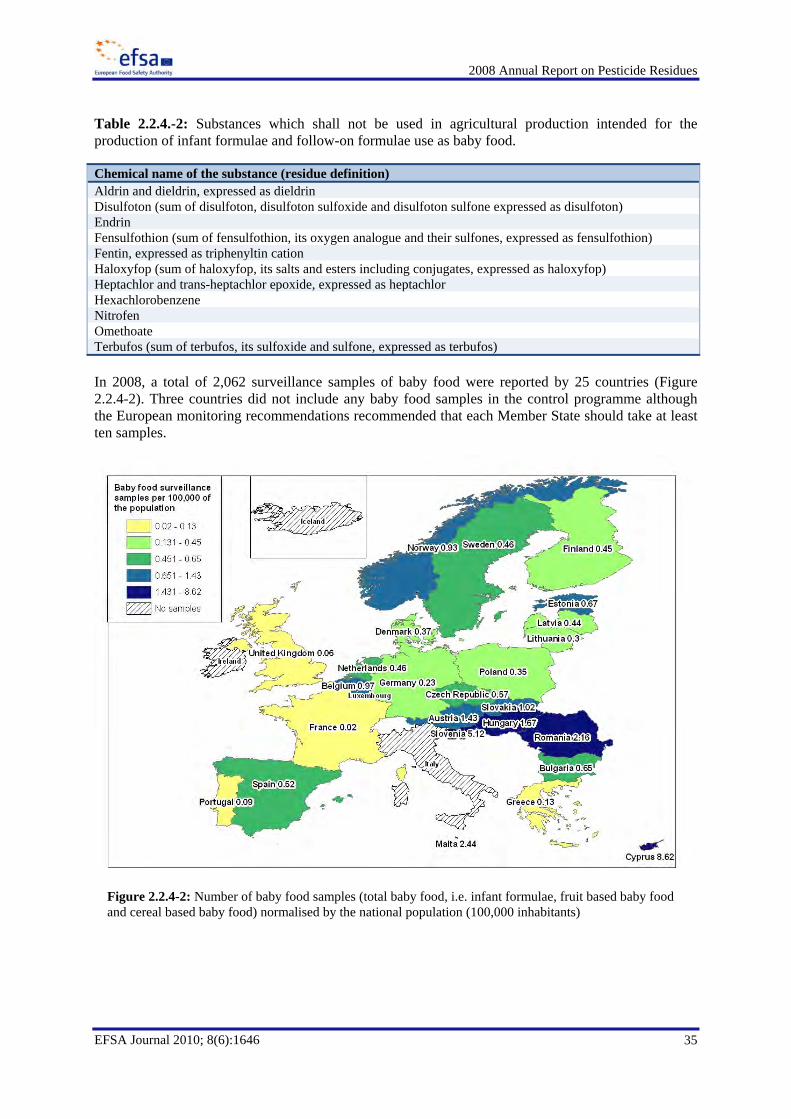
2008 Annual Report on Pesticide Residues
35
EFSA Journal 2010; 8(6):1646
Table 2.2.4.-2: Substances which shall not be used in agricultural production intended for the production of infant formulae and follow-on formulae use as baby food.
Chemical name of the substance (residue definition)Aldrin and dieldrin, expressed as dieldrin Disulfoton (sum of disulfoton, disulfoton sulfoxide and disulfoton sulfone expressed as disulfoton) Endrin Fensulfothion (sum of fensulfothion, its oxygen analogue and their sulfones, expressed as fensulfothion) Fentin, expressed as triphenyltin cation Haloxyfop (sum of haloxyfop, its salts and esters including conjugates, expressed as haloxyfop) Heptachlor and trans-heptachlor epoxide, expressed as heptachlor Hexachlorobenzene Nitrofen Omethoate Terbufos (sum of terbufos, its sulfoxide and sulfone, expressed as terbufos) In 2008, a total of 2,062 surveillance samples of baby food were reported by 25 countries (Figure 2.2.4-2). Three countries did not include any baby food samples in the control programme although the European monitoring recommendations recommended that each Member State should take at least ten samples.
Figure 2.2.4-2: Number of baby food samples (total baby food, i.e. infant formulae, fruit based baby food and cereal based baby food) normalised by the national population (100,000 inhabitants)
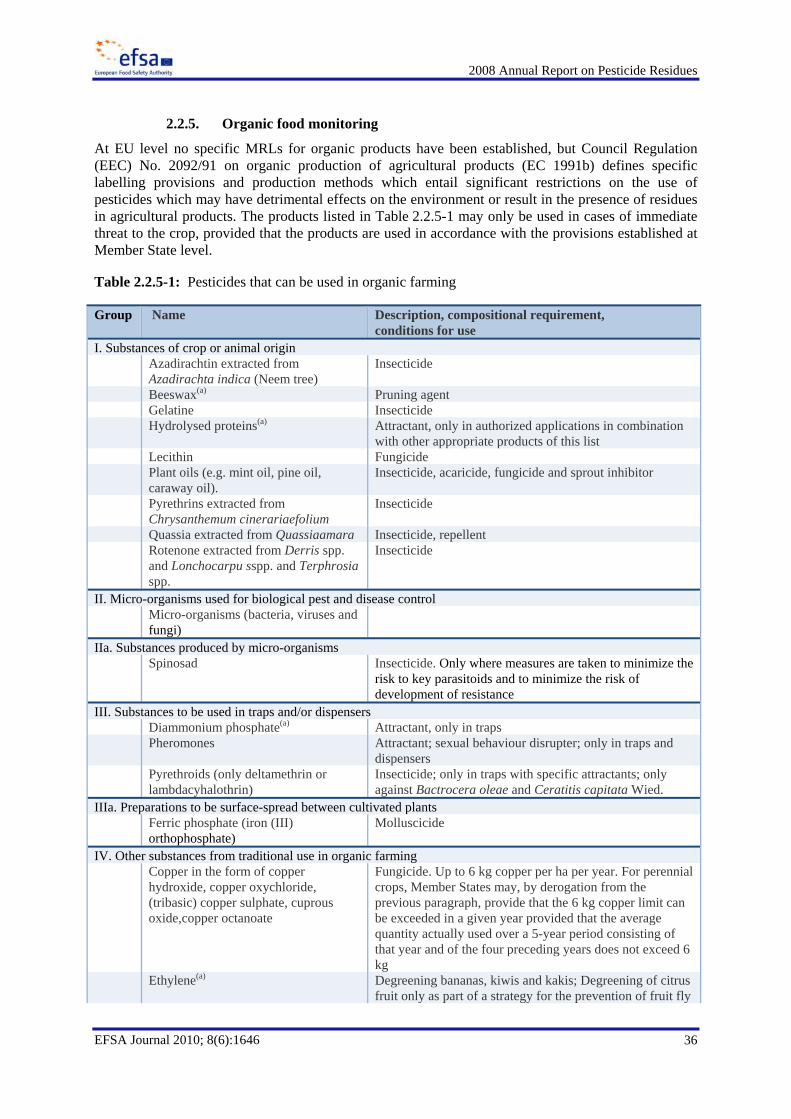
2008 Annual Report on Pesticide Residues
36
EFSA Journal 2010; 8(6):1646
2.2.5. Organic food monitoring
At EU level no specific MRLs for organic products have been established, but Council Regulation (EEC) No. 2092/91 on organic production of agricultural products (EC 1991b) defines specific labelling provisions and production methods which entail significant restrictions on the use of pesticides which may have detrimental effects on the environment or result in the presence of residues in agricultural products. The products listed in Table 2.2.5-1 may only be used in cases of immediate threat to the crop, provided that the products are used in accordance with the provisions established at Member State level.
Table 2.2.5-1: Pesticides that can be used in organic farming
Group Name Description, compositional requirement, conditions for use
I. Substances of crop or animal origin Azadirachtin extracted from
Azadirachta indica (Neem tree) Insecticide
Beeswax(a) Pruning agent Gelatine Insecticide Hydrolysed proteins(a) Attractant, only in authorized applications in combination
with other appropriate products of this list Lecithin Fungicide Plant oils (e.g. mint oil, pine oil,
caraway oil). Insecticide, acaricide, fungicide and sprout inhibitor
Pyrethrins extracted from Chrysanthemum cinerariaefolium
Insecticide
Quassia extracted from Quassiaamara Insecticide, repellent Rotenone extracted from Derris spp.
and Lonchocarpu sspp. and Terphrosia spp.
Insecticide
II. Micro-organisms used for biological pest and disease control Micro-organisms (bacteria, viruses and
fungi)
IIa. Substances produced by micro-organisms Spinosad Insecticide. Only where measures are taken to minimize the
risk to key parasitoids and to minimize the risk of development of resistance
III. Substances to be used in traps and/or dispensers Diammonium phosphate(a) Attractant, only in traps Pheromones Attractant; sexual behaviour disrupter; only in traps and
dispensers Pyrethroids (only deltamethrin or
lambdacyhalothrin) Insecticide; only in traps with specific attractants; only against Bactrocera oleae and Ceratitis capitata Wied.
IIIa. Preparations to be surface-spread between cultivated plants Ferric phosphate (iron (III)
orthophosphate) Molluscicide
IV. Other substances from traditional use in organic farming Copper in the form of copper
hydroxide, copper oxychloride, (tribasic) copper sulphate, cuprous oxide,copper octanoate
Fungicide. Up to 6 kg copper per ha per year. For perennial crops, Member States may, by derogation from the previous paragraph, provide that the 6 kg copper limit can be exceeded in a given year provided that the average quantity actually used over a 5-year period consisting of that year and of the four preceding years does not exceed 6 kg
Ethylene(a) Degreening bananas, kiwis and kakis; Degreening of citrus fruit only as part of a strategy for the prevention of fruit fly
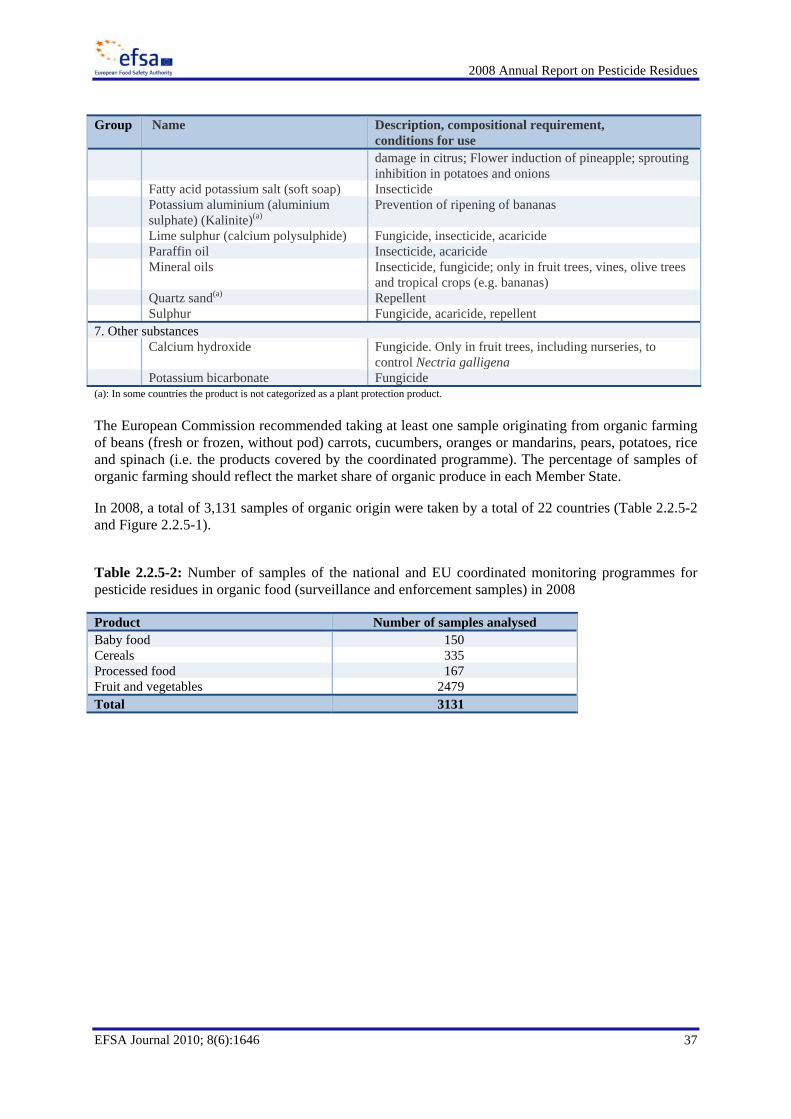
2008 Annual Report on Pesticide Residues
37
EFSA Journal 2010; 8(6):1646
Group Name Description, compositional requirement, conditions for use damage in citrus; Flower induction of pineapple; sprouting inhibition in potatoes and onions
Fatty acid potassium salt (soft soap) Insecticide Potassium aluminium (aluminium
sulphate) (Kalinite)(a) Prevention of ripening of bananas
Lime sulphur (calcium polysulphide) Fungicide, insecticide, acaricide Paraffin oil Insecticide, acaricide Mineral oils Insecticide, fungicide; only in fruit trees, vines, olive trees
and tropical crops (e.g. bananas) Quartz sand(a) Repellent Sulphur Fungicide, acaricide, repellent 7. Other substances Calcium hydroxide Fungicide. Only in fruit trees, including nurseries, to
control Nectria galligena Potassium bicarbonate Fungicide (a): In some countries the product is not categorized as a plant protection product. The European Commission recommended taking at least one sample originating from organic farming of beans (fresh or frozen, without pod) carrots, cucumbers, oranges or mandarins, pears, potatoes, rice and spinach (i.e. the products covered by the coordinated programme). The percentage of samples of organic farming should reflect the market share of organic produce in each Member State.
In 2008, a total of 3,131 samples of organic origin were taken by a total of 22 countries (Table 2.2.5-2 and Figure 2.2.5-1).
Table 2.2.5-2: Number of samples of the national and EU coordinated monitoring programmes for pesticide residues in organic food (surveillance and enforcement samples) in 2008
Product Number of samples analysed Baby food 150 Cereals 335 Processed food 167 Fruit and vegetables 2479 Total 3131
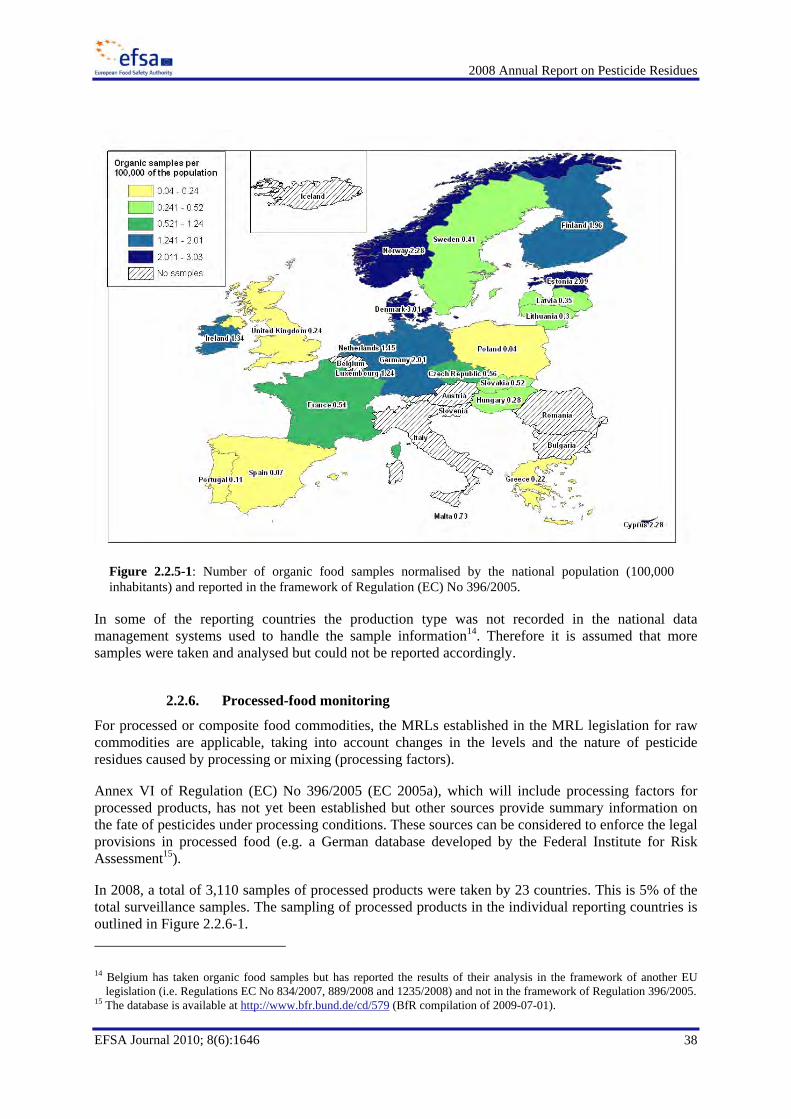
2008 Annual Report on Pesticide Residues
38
EFSA Journal 2010; 8(6):1646
In some of the reporting countries the production type was not recorded in the national data management systems used to handle the sample information14. Therefore it is assumed that more samples were taken and analysed but could not be reported accordingly.
2.2.6. Processed-food monitoring
For processed or composite food commodities, the MRLs established in the MRL legislation for raw commodities are applicable, taking into account changes in the levels and the nature of pesticide residues caused by processing or mixing (processing factors).
Annex VI of Regulation (EC) No 396/2005 (EC 2005a), which will include processing factors for processed products, has not yet been established but other sources provide summary information on the fate of pesticides under processing conditions. These sources can be considered to enforce the legal provisions in processed food (e.g. a German database developed by the Federal Institute for Risk Assessment15).
In 2008, a total of 3,110 samples of processed products were taken by 23 countries. This is 5% of the total surveillance samples. The sampling of processed products in the individual reporting countries is outlined in Figure 2.2.6-1. 14 Belgium has taken organic food samples but has reported the results of their analysis in the framework of another EU
legislation (i.e. Regulations EC No 834/2007, 889/2008 and 1235/2008) and not in the framework of Regulation 396/2005. 15 The database is available at http://www.bfr.bund.de/cd/579 (BfR compilation of 2009-07-01).
Figure 2.2.5-1: Number of organic food samples normalised by the national population (100,000inhabitants) and reported in the framework of Regulation (EC) No 396/2005.
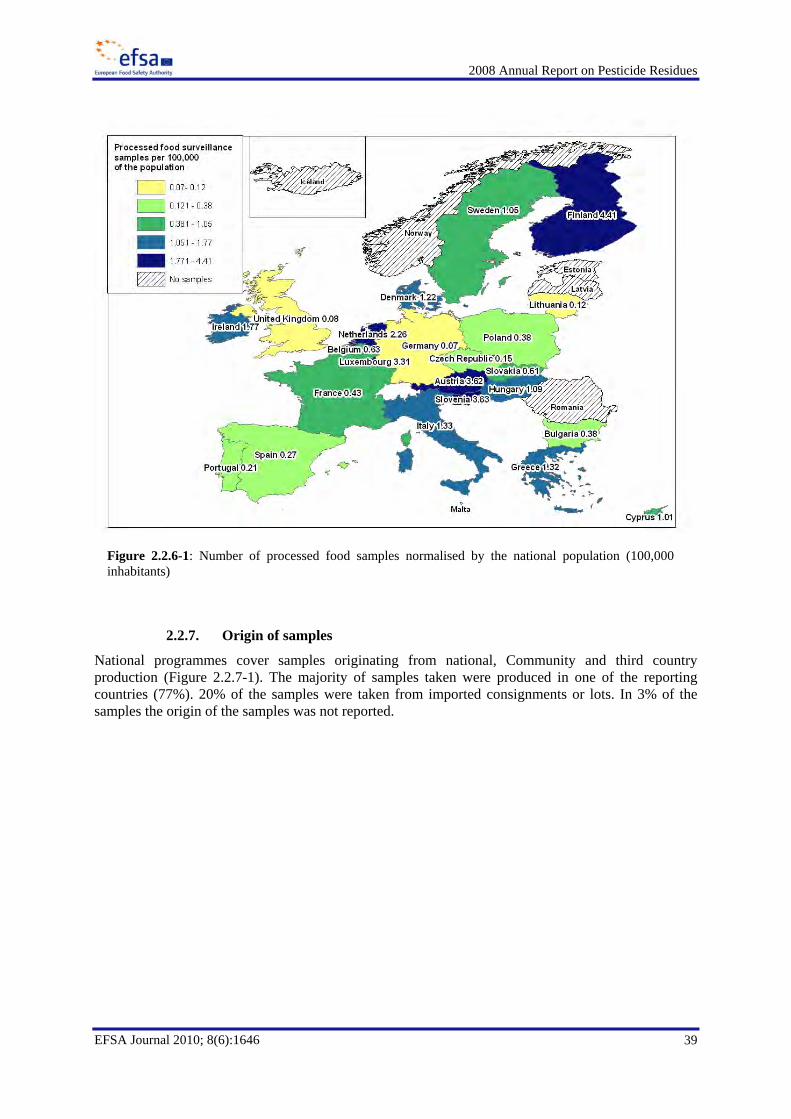
2008 Annual Report on Pesticide Residues
39
EFSA Journal 2010; 8(6):1646
2.2.7. Origin of samples
National programmes cover samples originating from national, Community and third country production (Figure 2.2.7-1). The majority of samples taken were produced in one of the reporting countries (77%). 20% of the samples were taken from imported consignments or lots. In 3% of the samples the origin of the samples was not reported.
Figure 2.2.6-1: Number of processed food samples normalised by the national population (100,000inhabitants)
2008 Annual Report on Pesticide Residues
40
EFSA Journal 2010; 8(6):1646
Imported20%
Unknown3%
EU77%
Figure 2.2.7-1: Origin of samples (EU: EU, Iceland and Norway; Imported: third countries); surveillance and enforcement samples of fruit, vegetables, cereals, processed commodities and baby food.
The data submitted by the reporting countries demonstrate that the ratio of samples with EU provenience and samples imported from third countries varied significantly; this ratio is affected by the percentage of imported food consumed in a specific country (e.g. in the Nordic countries). In addition, some countries focus their national monitoring programmes on domestic production. Finally, the level of enforcement sampling can affect this value: in the case of e.g. Lithuania, the majority of imported samples come from enforcement sampling of fruit and vegetables (Figure 2.2.7-2).
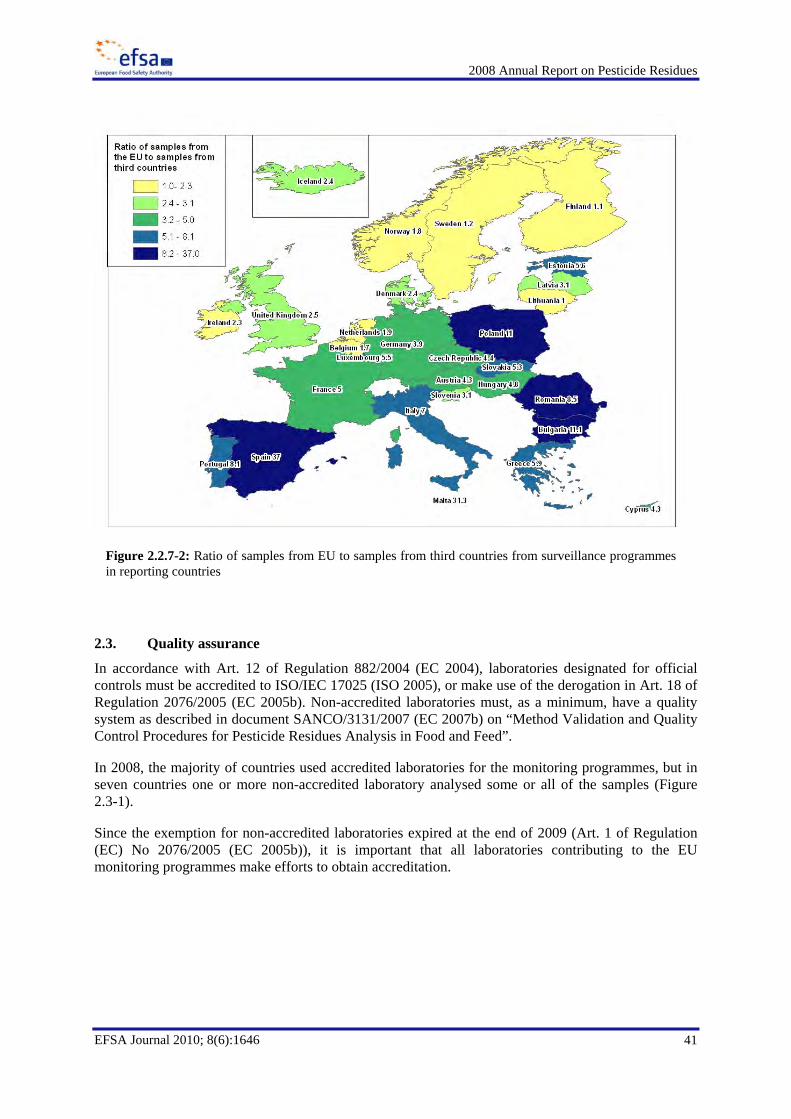
2008 Annual Report on Pesticide Residues
41
EFSA Journal 2010; 8(6):1646
2.3. Quality assurance
In accordance with Art. 12 of Regulation 882/2004 (EC 2004), laboratories designated for official controls must be accredited to ISO/IEC 17025 (ISO 2005), or make use of the derogation in Art. 18 of Regulation 2076/2005 (EC 2005b). Non-accredited laboratories must, as a minimum, have a quality system as described in document SANCO/3131/2007 (EC 2007b) on “Method Validation and Quality Control Procedures for Pesticide Residues Analysis in Food and Feed”.
In 2008, the majority of countries used accredited laboratories for the monitoring programmes, but in seven countries one or more non-accredited laboratory analysed some or all of the samples (Figure 2.3-1).
Since the exemption for non-accredited laboratories expired at the end of 2009 (Art. 1 of Regulation (EC) No 2076/2005 (EC 2005b)), it is important that all laboratories contributing to the EU monitoring programmes make efforts to obtain accreditation.
Figure 2.2.7-2: Ratio of samples from EU to samples from third countries from surveillance programmesin reporting countries
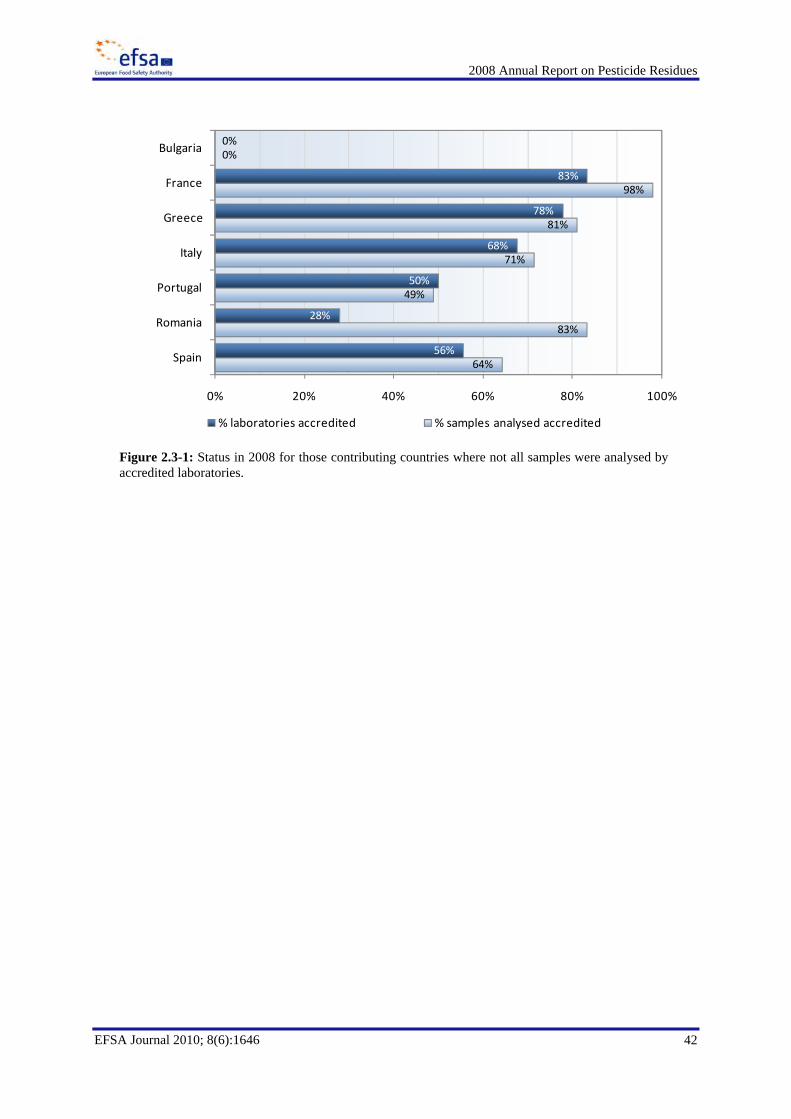
2008 Annual Report on Pesticide Residues
42
EFSA Journal 2010; 8(6):1646
64%
83%
49%
71%
81%
98%
0%
56%
28%
50%
68%
78%
83%
0%
0% 20% 40% 60% 80% 100%
Spain
Romania
Portugal
Italy
Greece
France
Bulgaria
% laboratories accredited % samples analysed accredited
Figure 2.3-1: Status in 2008 for those contributing countries where not all samples were analysed byaccredited laboratories.
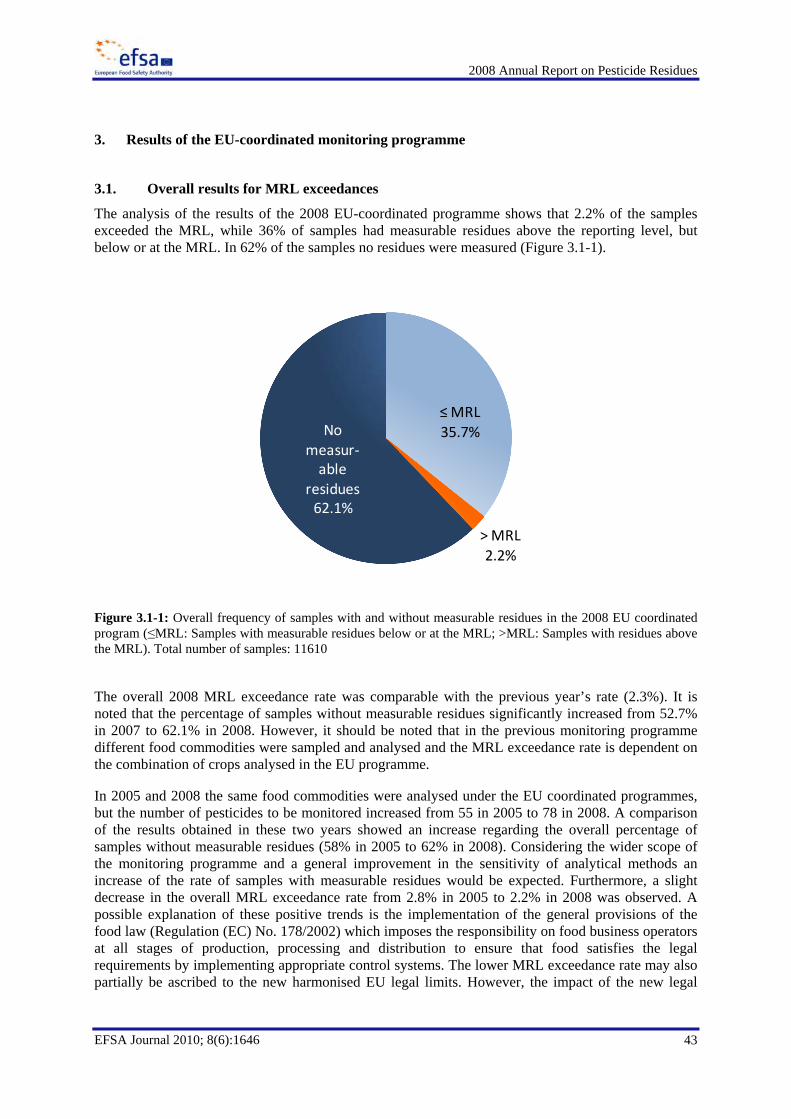
2008 Annual Report on Pesticide Residues
43
EFSA Journal 2010; 8(6):1646
3. Results of the EU-coordinated monitoring programme
3.1. Overall results for MRL exceedances
The analysis of the results of the 2008 EU-coordinated programme shows that 2.2% of the samples exceeded the MRL, while 36% of samples had measurable residues above the reporting level, but below or at the MRL. In 62% of the samples no residues were measured (Figure 3.1-1).
≤ MRL35.7%
> MRL2.2%
No measur‐able
residues62.1%
Figure 3.1-1: Overall frequency of samples with and without measurable residues in the 2008 EU coordinated program (≤MRL: Samples with measurable residues below or at the MRL; >MRL: Samples with residues above the MRL). Total number of samples: 11610
The overall 2008 MRL exceedance rate was comparable with the previous year’s rate (2.3%). It is noted that the percentage of samples without measurable residues significantly increased from 52.7% in 2007 to 62.1% in 2008. However, it should be noted that in the previous monitoring programme different food commodities were sampled and analysed and the MRL exceedance rate is dependent on the combination of crops analysed in the EU programme.
In 2005 and 2008 the same food commodities were analysed under the EU coordinated programmes, but the number of pesticides to be monitored increased from 55 in 2005 to 78 in 2008. A comparison of the results obtained in these two years showed an increase regarding the overall percentage of samples without measurable residues (58% in 2005 to 62% in 2008). Considering the wider scope of the monitoring programme and a general improvement in the sensitivity of analytical methods an increase of the rate of samples with measurable residues would be expected. Furthermore, a slight decrease in the overall MRL exceedance rate from 2.8% in 2005 to 2.2% in 2008 was observed. A possible explanation of these positive trends is the implementation of the general provisions of the food law (Regulation (EC) No. 178/2002) which imposes the responsibility on food business operators at all stages of production, processing and distribution to ensure that food satisfies the legal requirements by implementing appropriate control systems. The lower MRL exceedance rate may also partially be ascribed to the new harmonised EU legal limits. However, the impact of the new legal
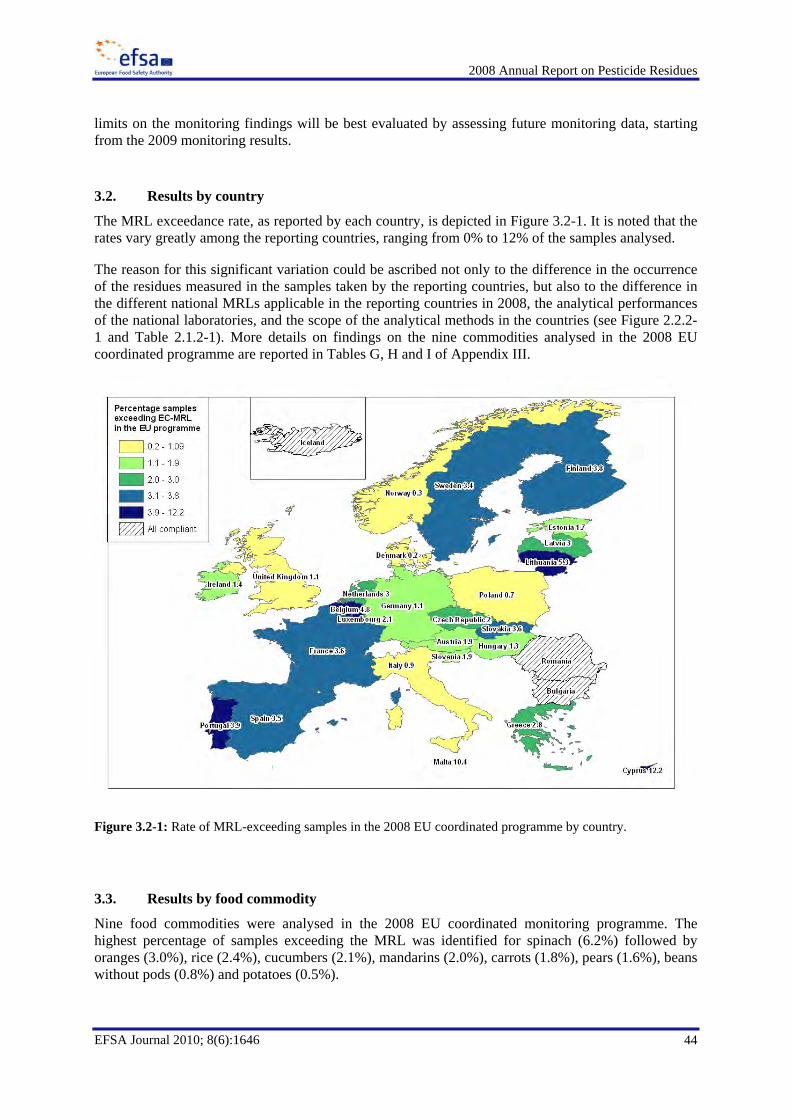
2008 Annual Report on Pesticide Residues
44
EFSA Journal 2010; 8(6):1646
limits on the monitoring findings will be best evaluated by assessing future monitoring data, starting from the 2009 monitoring results.
3.2. Results by country
The MRL exceedance rate, as reported by each country, is depicted in Figure 3.2-1. It is noted that the rates vary greatly among the reporting countries, ranging from 0% to 12% of the samples analysed.
The reason for this significant variation could be ascribed not only to the difference in the occurrence of the residues measured in the samples taken by the reporting countries, but also to the difference in the different national MRLs applicable in the reporting countries in 2008, the analytical performances of the national laboratories, and the scope of the analytical methods in the countries (see Figure 2.2.2-1 and Table 2.1.2-1). More details on findings on the nine commodities analysed in the 2008 EU coordinated programme are reported in Tables G, H and I of Appendix III.
Figure 3.2-1: Rate of MRL-exceeding samples in the 2008 EU coordinated programme by country.
3.3. Results by food commodity
Nine food commodities were analysed in the 2008 EU coordinated monitoring programme. The highest percentage of samples exceeding the MRL was identified for spinach (6.2%) followed by oranges (3.0%), rice (2.4%), cucumbers (2.1%), mandarins (2.0%), carrots (1.8%), pears (1.6%), beans without pods (0.8%) and potatoes (0.5%).
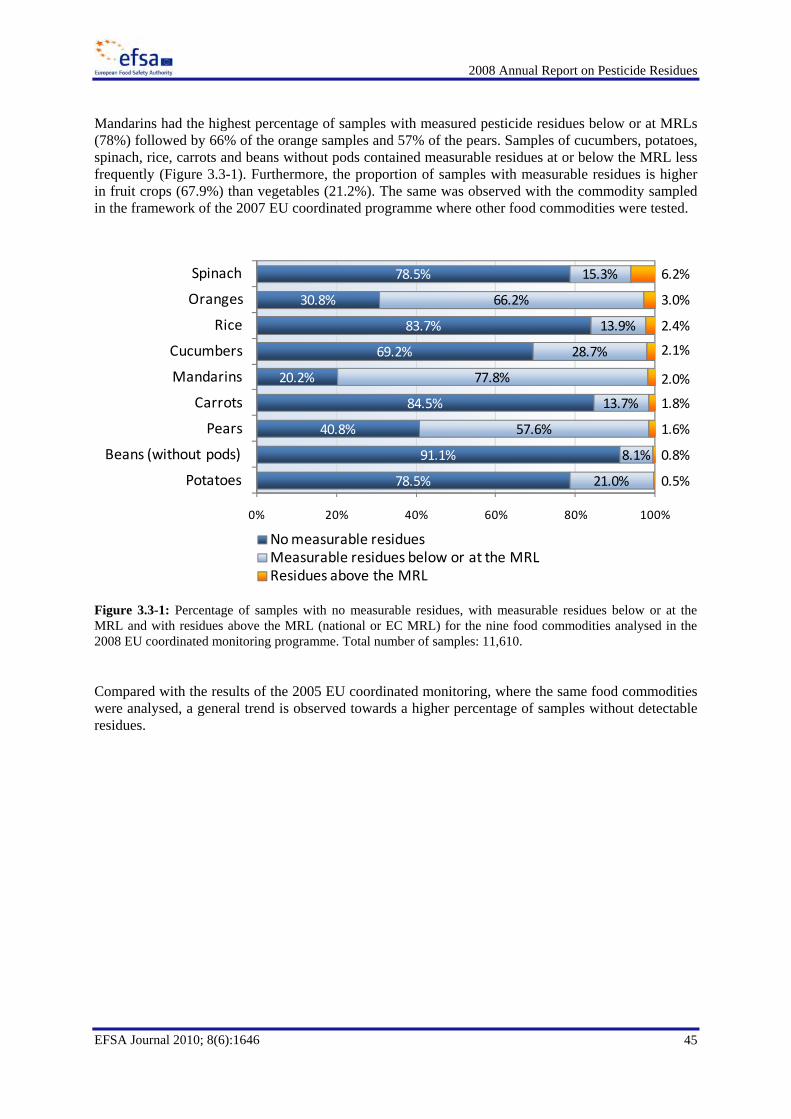
2008 Annual Report on Pesticide Residues
45
EFSA Journal 2010; 8(6):1646
Mandarins had the highest percentage of samples with measured pesticide residues below or at MRLs (78%) followed by 66% of the orange samples and 57% of the pears. Samples of cucumbers, potatoes, spinach, rice, carrots and beans without pods contained measurable residues at or below the MRL less frequently (Figure 3.3-1). Furthermore, the proportion of samples with measurable residues is higher in fruit crops (67.9%) than vegetables (21.2%). The same was observed with the commodity sampled in the framework of the 2007 EU coordinated programme where other food commodities were tested.
Figure 3.3-1: Percentage of samples with no measurable residues, with measurable residues below or at the MRL and with residues above the MRL (national or EC MRL) for the nine food commodities analysed in the 2008 EU coordinated monitoring programme. Total number of samples: 11,610. Compared with the results of the 2005 EU coordinated monitoring, where the same food commodities were analysed, a general trend is observed towards a higher percentage of samples without detectable residues.
78.5%
91.1%
40.8%
84.5%
20.2%
69.2%
83.7%
30.8%
78.5%
21.0%
8.1%
57.6%
13.7%
77.8%
28.7%
13.9%
66.2%
15.3%
0.5%
0.8%
1.6%
1.8%
2.0%
2.1%
2.4%
3.0%
6.2%
0% 20% 40% 60% 80% 100%
Potatoes
Beans (without pods)
Pears
Carrots
Mandarins
Cucumbers
Rice
Oranges
Spinach
No measurable residuesMeasurable residues below or at the MRLResidues above the MRL
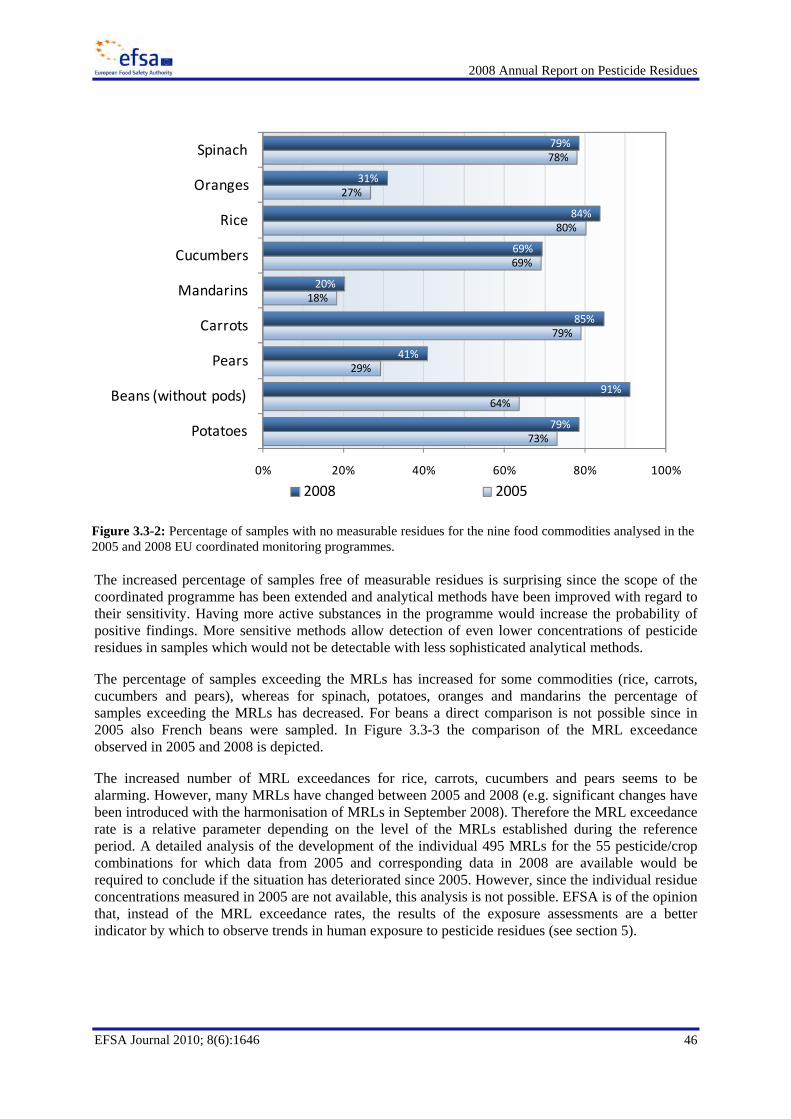
2008 Annual Report on Pesticide Residues
46
EFSA Journal 2010; 8(6):1646
The increased percentage of samples free of measurable residues is surprising since the scope of the coordinated programme has been extended and analytical methods have been improved with regard to their sensitivity. Having more active substances in the programme would increase the probability of positive findings. More sensitive methods allow detection of even lower concentrations of pesticide residues in samples which would not be detectable with less sophisticated analytical methods.
The percentage of samples exceeding the MRLs has increased for some commodities (rice, carrots, cucumbers and pears), whereas for spinach, potatoes, oranges and mandarins the percentage of samples exceeding the MRLs has decreased. For beans a direct comparison is not possible since in 2005 also French beans were sampled. In Figure 3.3-3 the comparison of the MRL exceedance observed in 2005 and 2008 is depicted.
The increased number of MRL exceedances for rice, carrots, cucumbers and pears seems to be alarming. However, many MRLs have changed between 2005 and 2008 (e.g. significant changes have been introduced with the harmonisation of MRLs in September 2008). Therefore the MRL exceedance rate is a relative parameter depending on the level of the MRLs established during the reference period. A detailed analysis of the development of the individual 495 MRLs for the 55 pesticide/crop combinations for which data from 2005 and corresponding data in 2008 are available would be required to conclude if the situation has deteriorated since 2005. However, since the individual residue concentrations measured in 2005 are not available, this analysis is not possible. EFSA is of the opinion that, instead of the MRL exceedance rates, the results of the exposure assessments are a better indicator by which to observe trends in human exposure to pesticide residues (see section 5).
Figure 3.3-2: Percentage of samples with no measurable residues for the nine food commodities analysed in the2005 and 2008 EU coordinated monitoring programmes.
73%
64%
29%
79%
18%
69%
80%
27%
78%
79%
91%
41%
85%
20%
69%
84%
31%
79%
0% 20% 40% 60% 80% 100%
Potatoes
Beans (without pods)
Pears
Carrots
Mandarins
Cucumbers
Rice
Oranges
Spinach
2008 2005
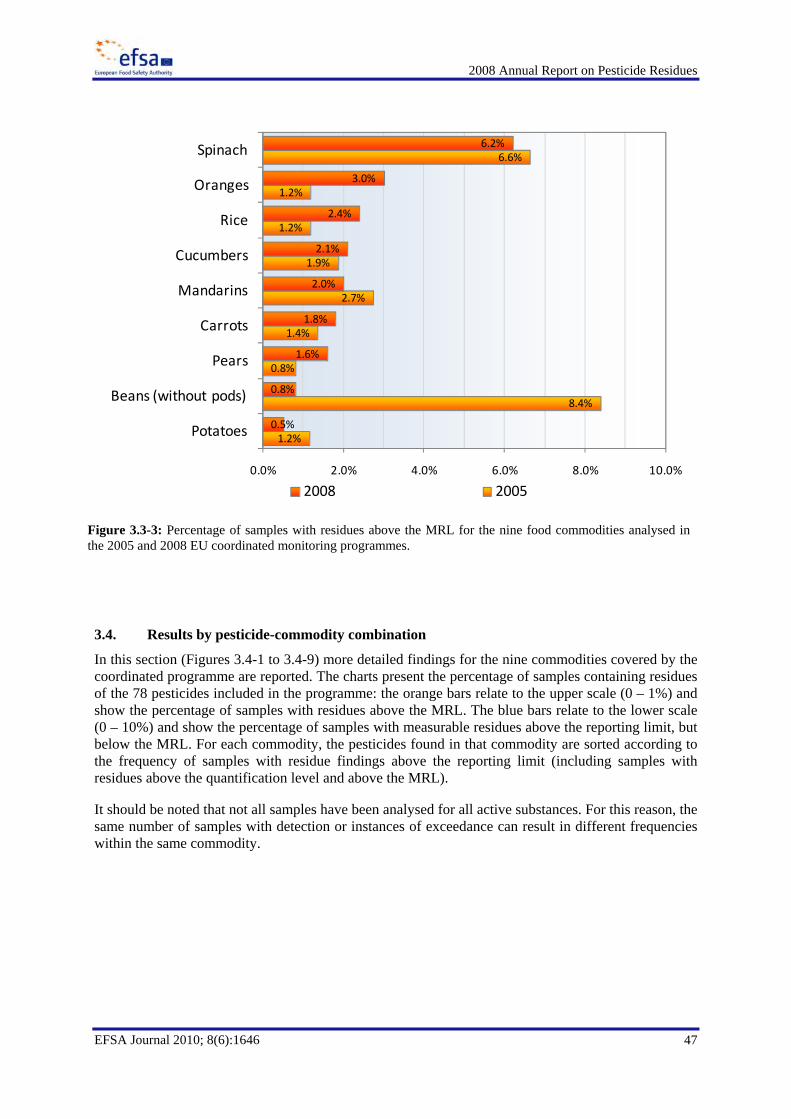
2008 Annual Report on Pesticide Residues
47
EFSA Journal 2010; 8(6):1646
3.4. Results by pesticide-commodity combination
In this section (Figures 3.4-1 to 3.4-9) more detailed findings for the nine commodities covered by the coordinated programme are reported. The charts present the percentage of samples containing residues of the 78 pesticides included in the programme: the orange bars relate to the upper scale (0 – 1%) and show the percentage of samples with residues above the MRL. The blue bars relate to the lower scale (0 – 10%) and show the percentage of samples with measurable residues above the reporting limit, but below the MRL. For each commodity, the pesticides found in that commodity are sorted according to the frequency of samples with residue findings above the reporting limit (including samples with residues above the quantification level and above the MRL).
It should be noted that not all samples have been analysed for all active substances. For this reason, the same number of samples with detection or instances of exceedance can result in different frequencies within the same commodity.
1.2%
8.4%
0.8%
1.4%
2.7%
1.9%
1.2%
1.2%
6.6%
0.5%
0.8%
1.6%
1.8%
2.0%
2.1%
2.4%
3.0%
6.2%
0.0% 2.0% 4.0% 6.0% 8.0% 10.0%
Potatoes
Beans (without pods)
Pears
Carrots
Mandarins
Cucumbers
Rice
Oranges
Spinach
2008 2005
Figure 3.3-3: Percentage of samples with residues above the MRL for the nine food commodities analysed in the 2005 and 2008 EU coordinated monitoring programmes.
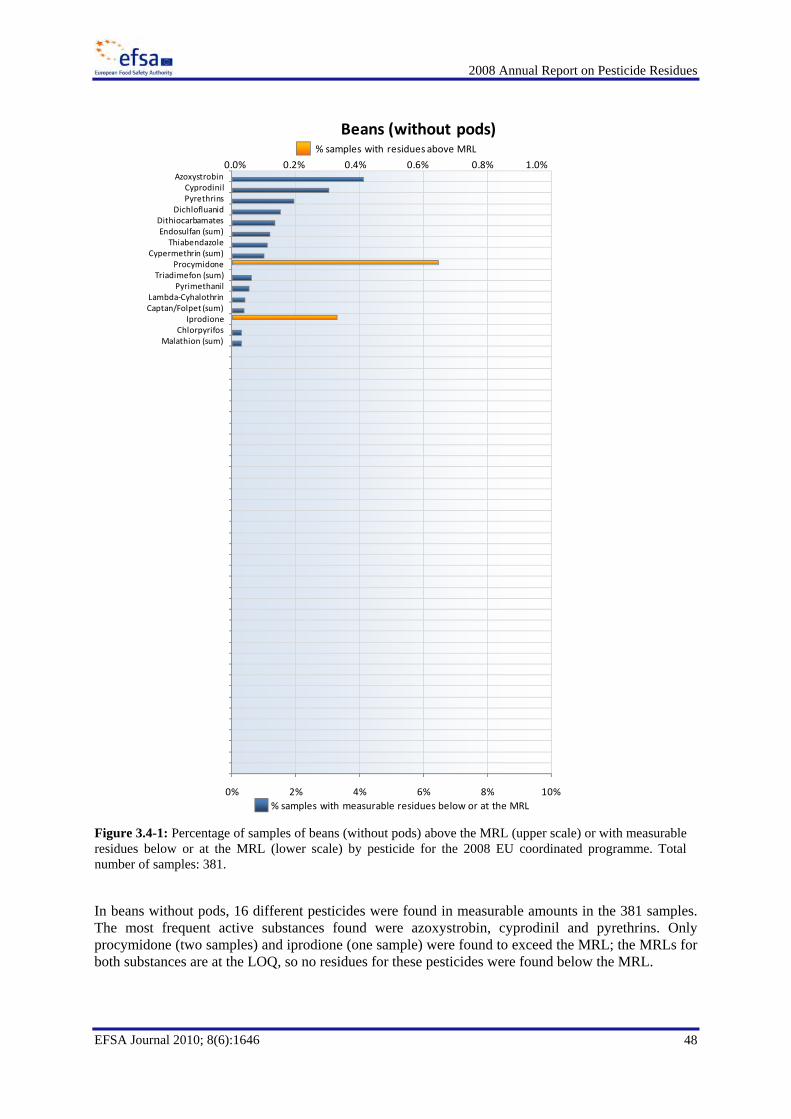
2008 Annual Report on Pesticide Residues
48
EFSA Journal 2010; 8(6):1646
In beans without pods, 16 different pesticides were found in measurable amounts in the 381 samples. The most frequent active substances found were azoxystrobin, cyprodinil and pyrethrins. Only procymidone (two samples) and iprodione (one sample) were found to exceed the MRL; the MRLs for both substances are at the LOQ, so no residues for these pesticides were found below the MRL.
0% 2% 4% 6% 8% 10%
AzoxystrobinCyprodinilPyrethrins
DichlofluanidDithiocarbamatesEndosulfan (sum)Thiabendazole
Cypermethrin (sum)Procymidone
Triadimefon (sum)Pyrimethanil
Lambda‐CyhalothrinCaptan/Folpet (sum)
IprodioneChlorpyrifos
Malathion (sum)
Beans (without pods)
0.0% 0.2% 0.4% 0.6% 0.8% 1.0%
% samples with residues above MRL
% samples with measurable residues below or at the MRL
Figure 3.4-1: Percentage of samples of beans (without pods) above the MRL (upper scale) or with measurable residues below or at the MRL (lower scale) by pesticide for the 2008 EU coordinated programme. Totalnumber of samples: 381.
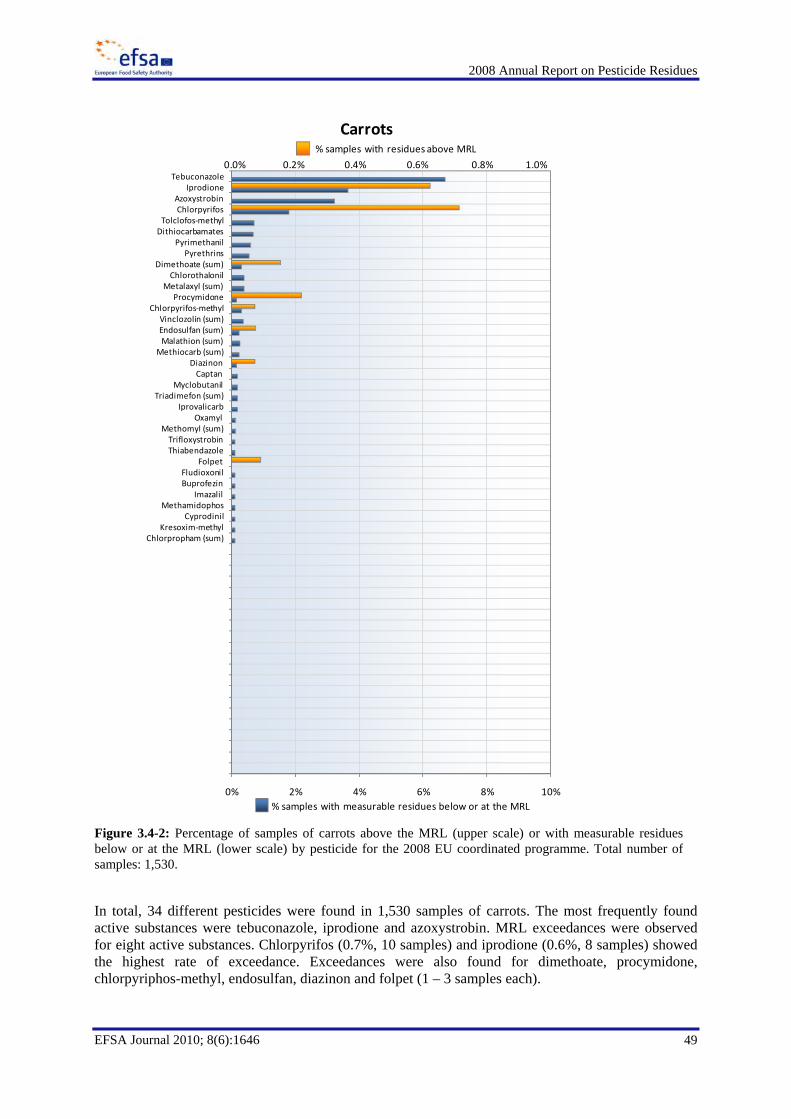
2008 Annual Report on Pesticide Residues
49
EFSA Journal 2010; 8(6):1646
In total, 34 different pesticides were found in 1,530 samples of carrots. The most frequently found active substances were tebuconazole, iprodione and azoxystrobin. MRL exceedances were observed for eight active substances. Chlorpyrifos (0.7%, 10 samples) and iprodione (0.6%, 8 samples) showed the highest rate of exceedance. Exceedances were also found for dimethoate, procymidone, chlorpyriphos-methyl, endosulfan, diazinon and folpet (1 – 3 samples each).
0% 2% 4% 6% 8% 10%
TebuconazoleIprodione
AzoxystrobinChlorpyrifos
Tolclofos‐methylDithiocarbamates
PyrimethanilPyrethrins
Dimethoate (sum)Chlorothalonil
Metalaxyl (sum)Procymidone
Chlorpyrifos‐methylVinclozolin (sum)Endosulfan (sum)Malathion (sum)
Methiocarb (sum)DiazinonCaptan
MyclobutanilTriadimefon (sum)
IprovalicarbOxamyl
Methomyl (sum)TrifloxystrobinThiabendazole
FolpetFludioxonilBuprofezin
ImazalilMethamidophos
CyprodinilKresoxim‐methyl
Chlorpropham (sum)
Carrots
0.0% 0.2% 0.4% 0.6% 0.8% 1.0%
% samples with residues above MRL
% samples with measurable residues below or at the MRL
Figure 3.4-2: Percentage of samples of carrots above the MRL (upper scale) or with measurable residuesbelow or at the MRL (lower scale) by pesticide for the 2008 EU coordinated programme. Total number ofsamples: 1,530.

2008 Annual Report on Pesticide Residues
50
EFSA Journal 2010; 8(6):1646
In total, 50 different pesticides were found in 1,329 cucumber samples. The most frequent found active substances were azoxystrobin, chlorothalonil and dithiocarbamates. MRL exceedances were observed for 14 active substances. The highest rate of exceedance was found for carbendazim/benomyl and methomyl (0.6%, 5 samples each).
0% 2% 4% 6% 8% 10%
AzoxystrobinChlorothalonil
DithiocarbamatesProcymidone
Metalaxyl (sum)CyprodinilIprodione
ImidaclopridCarbendazim and benomyl
PyrimethanilTriadimefon (sum)
FludioxonilCypermethrin (sum)
Methomyl (sum)Endosulfan (sum)
BupirimateImazalil
Methiocarb (sum)Chlormequat
OxamylMyclobutanilFenhexamidAcetamipridIndoxacarb
Kresoxim‐methylThiophanate‐methyl
BifenthrinChlorpyrifos
Vinclozolin (sum)Thiabendazole
Pirimicarb (sum)Penconazole
Dimethoate (sum)Spiroxamine
TrifloxystrobinBuprofezinPyrethrins
MethamidophosTolylfluanid
TebufenozideChlorpyrifos‐methyl
ClofentezineHexythiazoxMepanipyrimHexaconazole
CaptanLambda‐Cyhalothrin
Malathion (sum)Bromopropylate
Pirimiphos‐methyl
Cucumbers
0.0% 0.2% 0.4% 0.6% 0.8% 1.0%
% samples with residues above MRL
% samples with measurable residues below or at the MRL
Figure 3.4-3: Percentage of samples of cucumbers above the MRL (upper scale) or with measurable residuesbelow or at the MRL (lower scale) by pesticide for the 2008 EU coordinated programme. Total number of samples: 1,329.
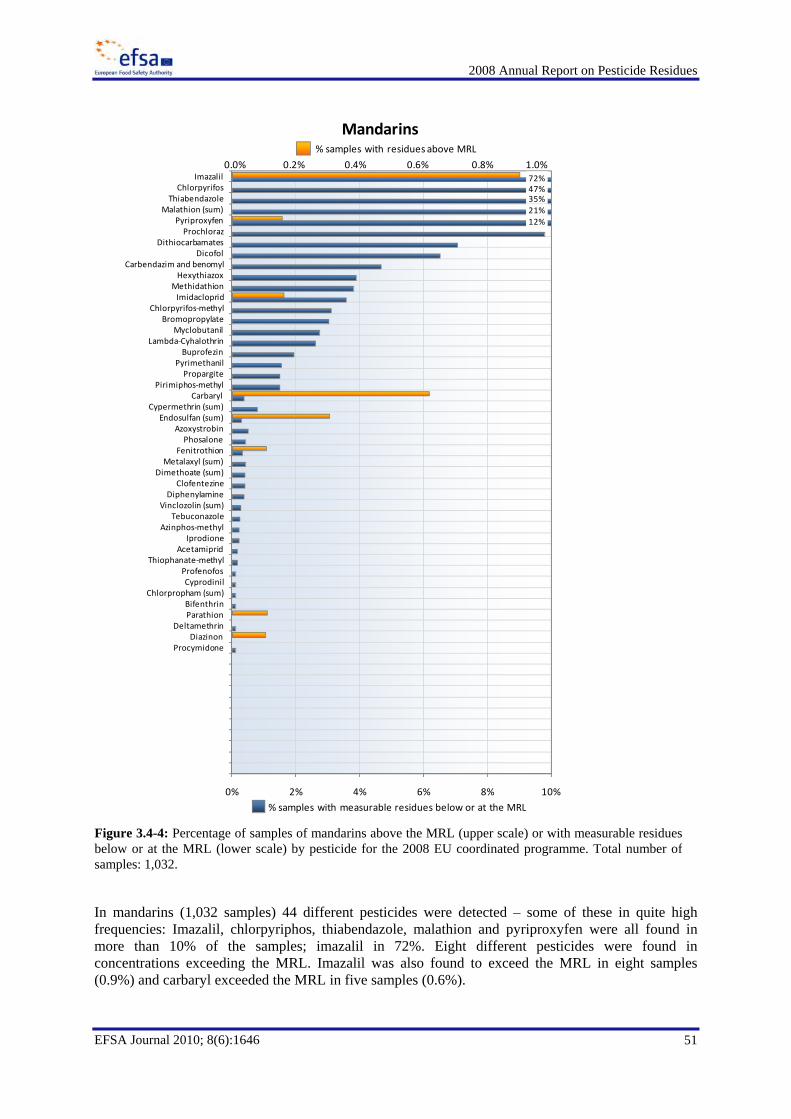
2008 Annual Report on Pesticide Residues
51
EFSA Journal 2010; 8(6):1646
In mandarins (1,032 samples) 44 different pesticides were detected – some of these in quite high frequencies: Imazalil, chlorpyriphos, thiabendazole, malathion and pyriproxyfen were all found in more than 10% of the samples; imazalil in 72%. Eight different pesticides were found in concentrations exceeding the MRL. Imazalil was also found to exceed the MRL in eight samples (0.9%) and carbaryl exceeded the MRL in five samples (0.6%).
0% 2% 4% 6% 8% 10%
ImazalilChlorpyrifos
ThiabendazoleMalathion (sum)
PyriproxyfenProchloraz
DithiocarbamatesDicofol
Carbendazim and benomylHexythiazox
MethidathionImidacloprid
Chlorpyrifos‐methylBromopropylate
MyclobutanilLambda‐Cyhalothrin
BuprofezinPyrimethanilPropargite
Pirimiphos‐methylCarbaryl
Cypermethrin (sum)Endosulfan (sum)
AzoxystrobinPhosalone
FenitrothionMetalaxyl (sum)
Dimethoate (sum)Clofentezine
DiphenylamineVinclozolin (sum)
TebuconazoleAzinphos‐methyl
IprodioneAcetamiprid
Thiophanate‐methylProfenofosCyprodinil
Chlorpropham (sum)BifenthrinParathion
DeltamethrinDiazinon
Procymidone
Mandarins
0.0% 0.2% 0.4% 0.6% 0.8% 1.0%
% samples with residues above MRL
% samples with measurable residues below or at the MRL
72%47%35%21%12%
Figure 3.4-4: Percentage of samples of mandarins above the MRL (upper scale) or with measurable residuesbelow or at the MRL (lower scale) by pesticide for the 2008 EU coordinated programme. Total number of samples: 1,032.
2008 Annual Report on Pesticide Residues
52
EFSA Journal 2010; 8(6):1646
In oranges, 46 different pesticides were detected in 1,550 samples analysed - three of these (imazalil, thiabendazole and chlorpyrifos) in more than 10% of the samples. Imazalil was found in 70% of the oranges. 14 different pesticides were found in concentrations exceeding the MRLs. The highest rates of exceedance (0.9 – 1.0%) were found for diazinon and dimethoate.
0% 2% 4% 6% 8% 10%
ImazalilThiabendazoleChlorpyrifos
Malathion (sum)ImidaclopridProchloraz
MethidathionPyriproxyfen
BromopropylateDithiocarbamates
DicofolLambda‐Cyhalothrin
Carbendazim and benomylPirimiphos‐methyl
PropargiteChlorpyrifos‐methyl
TrifloxystrobinDiazinon
Dimethoate (sum)AzoxystrobinMyclobutanil
Cypermethrin (sum)PyrimethanilProfenofos
CarbarylBuprofezin
DeltamethrinMetalaxyl (sum)
FenitrothionAcetamipridHexythiazoxPhosalone
Thiophanate‐methylCaptan
FludioxonilIprodione
Endosulfan (sum)Methomyl (sum)
HexaconazoleFolpet
FenhexamidDiphenylamine
Pirimicarb (sum)Bifenthrin
DichlofluanidChlorpropham (sum)
Oranges
0.0% 0.2% 0.4% 0.6% 0.8% 1.0%
% samples with residues above MRL
% samples with measurable residues below or at the MRL
70%40%29%
Figure 3.4-5: Percentage of samples of oranges above the MRL (upper scale) or with measurable residuesbelow or at the MRL (lower scale) by pesticide for the 2008 EU coordinated programme. Total number ofsamples: 1,550.

2008 Annual Report on Pesticide Residues
53
EFSA Journal 2010; 8(6):1646
In pears, 55 different pesticides have been detected. The most frequent pesticides were dithiocarbamates, chlorpyrifos and carbendazim (including benomyl). 13 different pesticides were found in concentrations exceeding the MRLs. Chlormequat was found to exceed the MRL in four samples (0.9%). Five samples (0.3%) exceeded the MRL for diazinon.
0% 2% 4% 6% 8% 10%
DithiocarbamatesChlorpyrifos
Carbendazim and benomylCaptan/Folpet (sum)
ChlormequatDiphenylamineThiabendazole
Azinphos‐methylImazalil
IprodioneThiophanate‐methyl
ImidaclopridCyprodinilIndoxacarb
TrifloxystrobinFludioxonil
AcetamipridTebuconazole
Lambda‐CyhalothrinChlorpyrifos‐methylCypermethrin (sum)
Malathion (sum)Pyrimethanil
Kresoxim‐methylBifenthrin
Methomyl (sum)ProcymidoneTebufenozideChlorothalonil
PhosaloneHexythiazoxBuprofezin
DeltamethrinBromopropylatePirimicarb (sum)
PyrethrinsDichlofluanid
Dimethoate (sum)DiazinonCarbaryl
PropargiteEndosulfan (sum)
MethidathionChlorpropham (sum)Triadimefon (sum)
TolylfluanidAcephate
MyclobutanilFenitrothionIprovalicarbClofentezineFenarimol
DicofolPenconazole
Metalaxyl (sum)
Pears
0.0% 0.2% 0.4% 0.6% 0.8% 1.0%
% samples with residues above MRL
% samples with measurable residues below or at the MRL
39%17%15%14%13%13%
Figure 3.4-6: Percentage of samples of pears above the MRL (upper scale) or with measurable residuesbelow or at the MRL (lower scale) by pesticide for the 2008 EU coordinated programme. Total number ofsamples: 1,669.
2008 Annual Report on Pesticide Residues
54
EFSA Journal 2010; 8(6):1646
In potatoes, 23 different pesticides were found (2,054 samples). The most frequent pesticides found were chlorpropham (in 21% of the samples), dithiocarbamates and metalaxyl. MRL exceedances were observed for seven active substances.
0% 2% 4% 6% 8% 10%
ChlorprophamDithiocarbamatesMetalaxyl (sum)
ImidaclopridAzoxystrobinChlorpyrifos
ImazalilThiabendazoleDiphenylamine
Malathion (sum)OxamylCarbaryl
Endosulfan (sum)Methomyl (sum)
Methiocarb (sum)MethamidophosVinclozolin (sum)
TebuconazoleDichlofluanidDeltamethrin
Dimethoate (sum)Fenitrothion
Pirimiphos‐methyl
Potatoes
0.0% 0.2% 0.4% 0.6% 0.8% 1.0%
% samples with residues above MRL
% samples with measurable residues below or at the MRL
21%
Figure 3.4-7: Percentage of samples of potatoes above the MRL (upper scale) or with measurable residuesbelow or at the MRL (lower scale) by pesticide for the 2008 EU coordinated programme. Total number ofsamples: 2,054.
2008 Annual Report on Pesticide Residues
55
EFSA Journal 2010; 8(6):1646
In 1,060 rice samples, 23 different pesticides were observed. The most frequently found pesticides were pirimiphos-methyl, tebufenozide and carbendazim (including benomyl). Seven pesticides were found in concentrations exceeding the MRLs. Two of these pesticides (carbendazim/benomyl and tebufenozide) were found to exceed the MRL in 2.2% (12 samples) and 1.5% (5 samples) respectively of the samples.
0% 2% 4% 6% 8% 10%
Pirimiphos‐methylCarbendazim and benomyl
TebufenozideDeltamethrinTebuconazoleImidaclopridAzoxystrobin
Malathion (sum)Chlorpyrifos
HexaconazoleAcetamiprid
IprodioneProchloraz
Chlorpyrifos‐methylDithiocarbamates
Cypermethrin (sum)BupirimateBuprofezinCyprodinil
Triadimefon (sum)Metalaxyl (sum)
DichlorvosFenitrothion
Rice
0.0% 0.2% 0.4% 0.6% 0.8% 1.0%
% samples with residues above MRL
2.2%
1.5%
% samples with measurable residues below or at the MRL
Figure 3.4-8: Percentage of samples of rice above the MRL (upper scale) or with measurable residues below or at the MRL (lower scale) by pesticide for the 2008 EU coordinated programme. Total number of samples:1,060.
2008 Annual Report on Pesticide Residues
56
EFSA Journal 2010; 8(6):1646
In spinach, 33 different pesticides were detected in 1,005 samples. The most frequent pesticides found were the dithiocarbamates, followed by lambda-cyhalothrin, cypermethrin and deltamethrin. 22 pesticides were found in concentrations exceeding the MRL. Dithiocarbamates showed the highest rate of MRL exceedance (4.9%, 25 samples). Also chlorpyrifos, azoxystrobin and methomyl were found to exceed the MRL in more than 0.5% of the samples (0.6 – 1.1 %, 5 – 7 samples).
0% 2% 4% 6% 8% 10%
DithiocarbamatesLambda‐CyhalothrinCypermethrin (sum)
DeltamethrinImidaclopridIndoxacarbChlorpyrifosAzoxystrobin
Methomyl (sum)Carbendazim and benomyl
BifenthrinIprodione
Pirimicarb (sum)Endosulfan (sum)
FludioxonilThiabendazole
CaptanDimethoate (sum)
PyrethrinsChlorpropham (sum)
CyprodinilMetalaxyl (sum)Tolclofos‐methyl
Chlorpyrifos‐methylProcymidone
PropargiteMethamidophos
DichlofluanidImazalil
PyrimethanilChlorothalonil
DicofolMalathion (sum)
Spinach
0.0% 0.2% 0.4% 0.6% 0.8% 1.0%
% samples with residues above MRL
% samples with measurable residues below or at the MRL
4.9%
1.1%
Figure 3.4-9: Percentage of samples of spinach above the MRL (upper scale) or with measurable residuesbelow or at the MRL (lower scale) by pesticide for the 2008 EU coordinated programme. Total number ofsamples: 1,005.
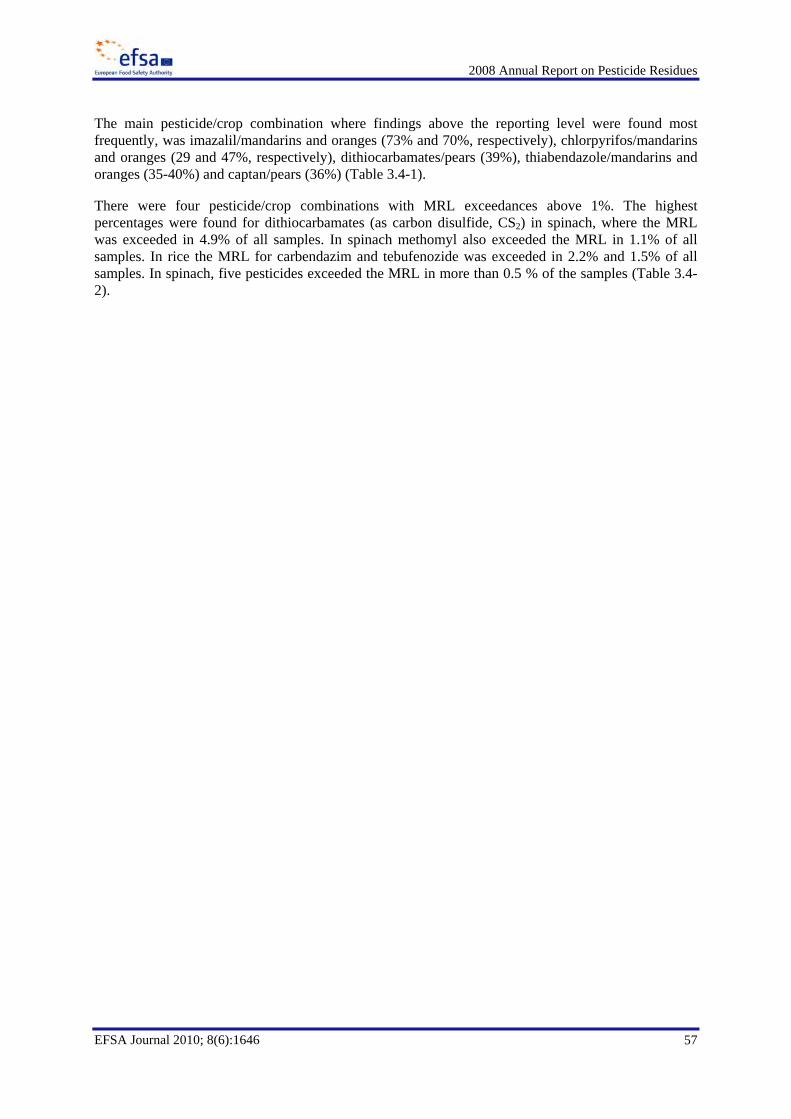
2008 Annual Report on Pesticide Residues
57
EFSA Journal 2010; 8(6):1646
The main pesticide/crop combination where findings above the reporting level were found most frequently, was imazalil/mandarins and oranges (73% and 70%, respectively), chlorpyrifos/mandarins and oranges (29 and 47%, respectively), dithiocarbamates/pears (39%), thiabendazole/mandarins and oranges (35-40%) and captan/pears (36%) (Table 3.4-1).
There were four pesticide/crop combinations with MRL exceedances above 1%. The highest percentages were found for dithiocarbamates (as carbon disulfide, CS2) in spinach, where the MRL was exceeded in 4.9% of all samples. In spinach methomyl also exceeded the MRL in 1.1% of all samples. In rice the MRL for carbendazim and tebufenozide was exceeded in 2.2% and 1.5% of all samples. In spinach, five pesticides exceeded the MRL in more than 0.5 % of the samples (Table 3.4-2).
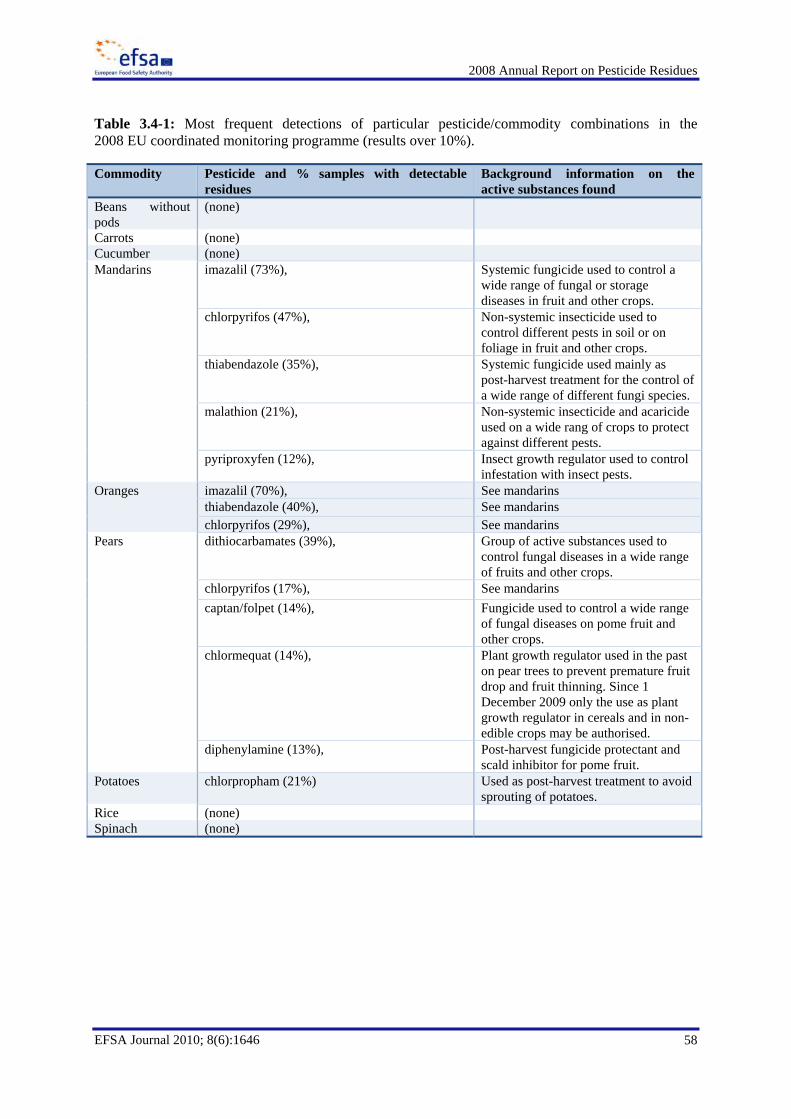
2008 Annual Report on Pesticide Residues
58
EFSA Journal 2010; 8(6):1646
Table 3.4-1: Most frequent detections of particular pesticide/commodity combinations in the 2008 EU coordinated monitoring programme (results over 10%).
Commodity Pesticide and % samples with detectable residues
Background information on the active substances found
Beans without pods
(none)
Carrots (none) Cucumber (none) Mandarins imazalil (73%), Systemic fungicide used to control a
wide range of fungal or storage diseases in fruit and other crops.
chlorpyrifos (47%), Non-systemic insecticide used to control different pests in soil or on foliage in fruit and other crops.
thiabendazole (35%), Systemic fungicide used mainly as post-harvest treatment for the control of a wide range of different fungi species.
malathion (21%), Non-systemic insecticide and acaricide used on a wide rang of crops to protect against different pests.
pyriproxyfen (12%), Insect growth regulator used to control infestation with insect pests.
Oranges imazalil (70%), See mandarins thiabendazole (40%), See mandarins chlorpyrifos (29%), See mandarins
Pears dithiocarbamates (39%), Group of active substances used to control fungal diseases in a wide range of fruits and other crops.
chlorpyrifos (17%), See mandarins captan/folpet (14%), Fungicide used to control a wide range
of fungal diseases on pome fruit and other crops.
chlormequat (14%), Plant growth regulator used in the past on pear trees to prevent premature fruit drop and fruit thinning. Since 1 December 2009 only the use as plant growth regulator in cereals and in non-edible crops may be authorised.
diphenylamine (13%), Post-harvest fungicide protectant and scald inhibitor for pome fruit.
Potatoes chlorpropham (21%) Used as post-harvest treatment to avoid sprouting of potatoes.
Rice (none) Spinach (none)
2008 Annual Report on Pesticide Residues
59
EFSA Journal 2010; 8(6):1646
Table 3.4-2: Most frequent MRL exceedances of pesticide/commodity combinations in the 2008 EU coordinated monitoring programme (results over 0.5% only).
Commodity Pesticide and % MRL exceedances Beans without pods Procymidone (0.6%) Carrots Iprodione (0.6%), chlorpyrifos (0.7%) Cucumber Carbendazim /benomyl (0.6%), methomyl (0.6%) Mandarins Imazalil (0.9%), carbaryl (0.6%) Oranges Dimethoate (1.0%), diazinon (0.9%) Pears Chlormequat (0.9%) Potatoes (none) Rice Carbendazim/benomyl (2.2%), tebufenozide (1.5%), acetamiprid (0.7%), Spinach dithiocarbamates (5%), methomyl (1.1%), chlorpyrifos (0.8%),
azoxystrobin (0.6%), iprodione (0.5%)
3.5. Results by pesticides
In the EU coordinated programme residues exceeding the MRL were found for 47 different pesticides (Figure 3.5-1). Residues of dithiocarbamates were found most often exceeding the MRL (0.6% of samples); all of these samples were spinach (see also Table 3.4-2) originating from EU countries (see Table 5.2.2-2). Therefore, EFSA recommends the reporting countries to investigate the reason explaining these findings on spinach. Chlormequat (which was only analysed in carrots, cucumber and pears) exceeded the MRL in 0.4% of these samples, all in pears. Carbendazim/benomyl residues above MRL were found in cucumbers, pears, rice and spinach (in total 0.3% of all samples). Exceedance of the MRL for chlorpyrifos, dimethoate, methomyl, diazinon, iprodione, imazalil and endosulfan was found in 0.3 – 0.1% of samples (distributed among several commodities), while tebufenozide only exceeded the MRL in rice (0.1% of samples). Carbaryl exceeded the MRL in mandarins, oranges, pears and potatoes (0.1% total). The rates of exceedance for the remaining pesticides were all below 0.1%.
Measurable residues were found for 69 different pesticides out of 78 pesticides included in the coordinated programme; 47 of them are shown in Figure 3.5-2. The remaining pesticides were each found in less than 0.2% of the samples. No positive detections were found for folpet, acephate, parathion, dichlorvos, aldicarb (sum), flusilazole, mepiquat, oxydemeton-methyl(sum) and quinoxyfen.
Chlorpropham (only reported for potatoes16) was found most frequently (21%). Imazalil had measurable residues in 18.3% of the samples; most (17%) were from mandarins and oranges. Chlorpyrifos, captan/folpet, thiabendazole and dithiocarbamates were each found in between 10 - 12% of the samples; chlorpyrifos (8.6%) and thiabendazole (9.3%) mainly in mandarins and oranges, while captan/folpet17 (12%) and dithiocarbamates (7.6%) were mainly found in pears. Residues of chlormequat (only analysed for in carrots, cucumber and pears) were found in 6.4% of these samples, most of which (6.2%) were in pears. Malathion, carbendazim/benomyl, imidacloprid, pyriproxyfen and diphenylamine were each found in 4 – 2 % of samples. Furthermore, 13 pesticides were found in 2 – 1% of the samples. 22 pesticides were found in 1 – 0.2% of the samples.
16 In other commodities, residues of chlorpropham were reported as a sum of chlorpropham and 3-chloroaniline, expressed as
chlorpropham according to the residue definition). 17 Captan and folpet was reported as a sum for beans (without pod) and pears only. For the remaining commodities in the EU
programme, residues of captan and folpet were reported individually.
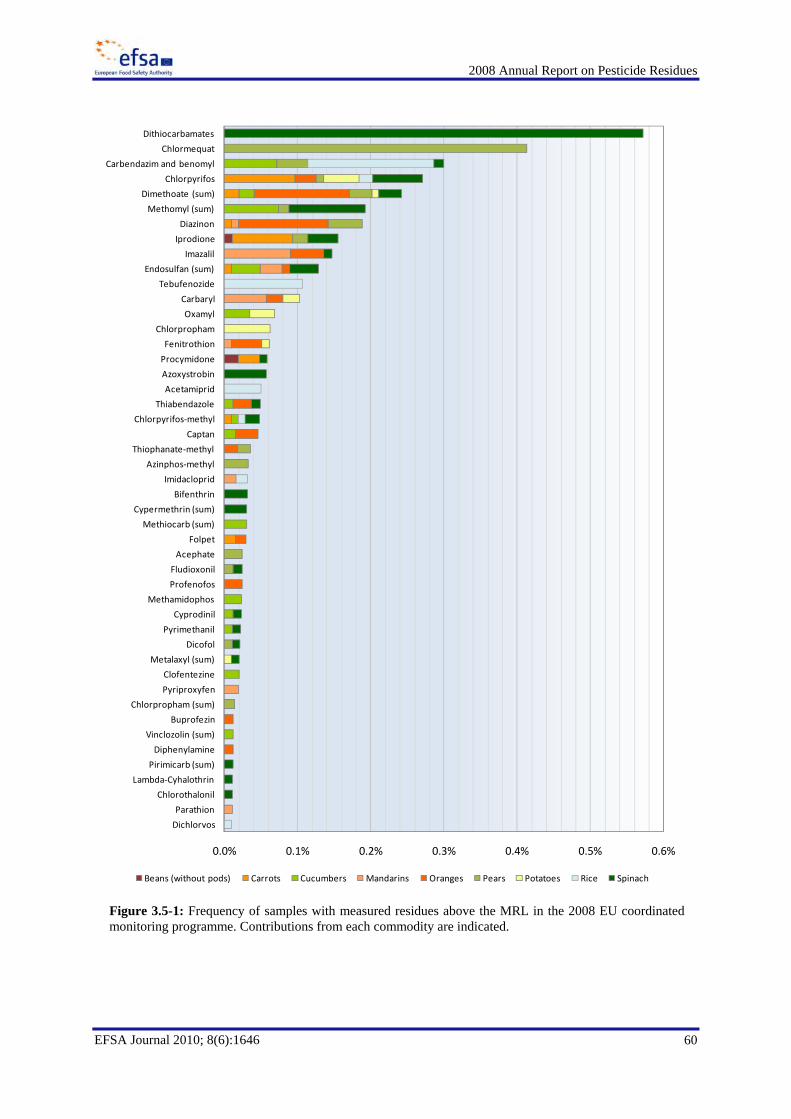
2008 Annual Report on Pesticide Residues
60
EFSA Journal 2010; 8(6):1646
0.0% 0.1% 0.2% 0.3% 0.4% 0.5% 0.6%
Dithiocarbamates
Chlormequat
Carbendazim and benomyl
Chlorpyrifos
Dimethoate (sum)
Methomyl (sum)
Diazinon
Iprodione
Imazalil
Endosulfan (sum)
Tebufenozide
Carbaryl
Oxamyl
Chlorpropham
Fenitrothion
Procymidone
Azoxystrobin
Acetamiprid
Thiabendazole
Chlorpyrifos‐methyl
Captan
Thiophanate‐methyl
Azinphos‐methyl
Imidacloprid
Bifenthrin
Cypermethrin (sum)
Methiocarb (sum)
Folpet
Acephate
Fludioxonil
Profenofos
Methamidophos
Cyprodinil
Pyrimethanil
Dicofol
Metalaxyl (sum)
Clofentezine
Pyriproxyfen
Chlorpropham (sum)
Buprofezin
Vinclozolin (sum)
Diphenylamine
Pirimicarb (sum)
Lambda‐Cyhalothrin
Chlorothalonil
Parathion
Dichlorvos
Beans (without pods) Carrots Cucumbers Mandarins Oranges Pears Potatoes Rice Spinach
Figure 3.5-1: Frequency of samples with measured residues above the MRL in the 2008 EU coordinated monitoring programme. Contributions from each commodity are indicated.
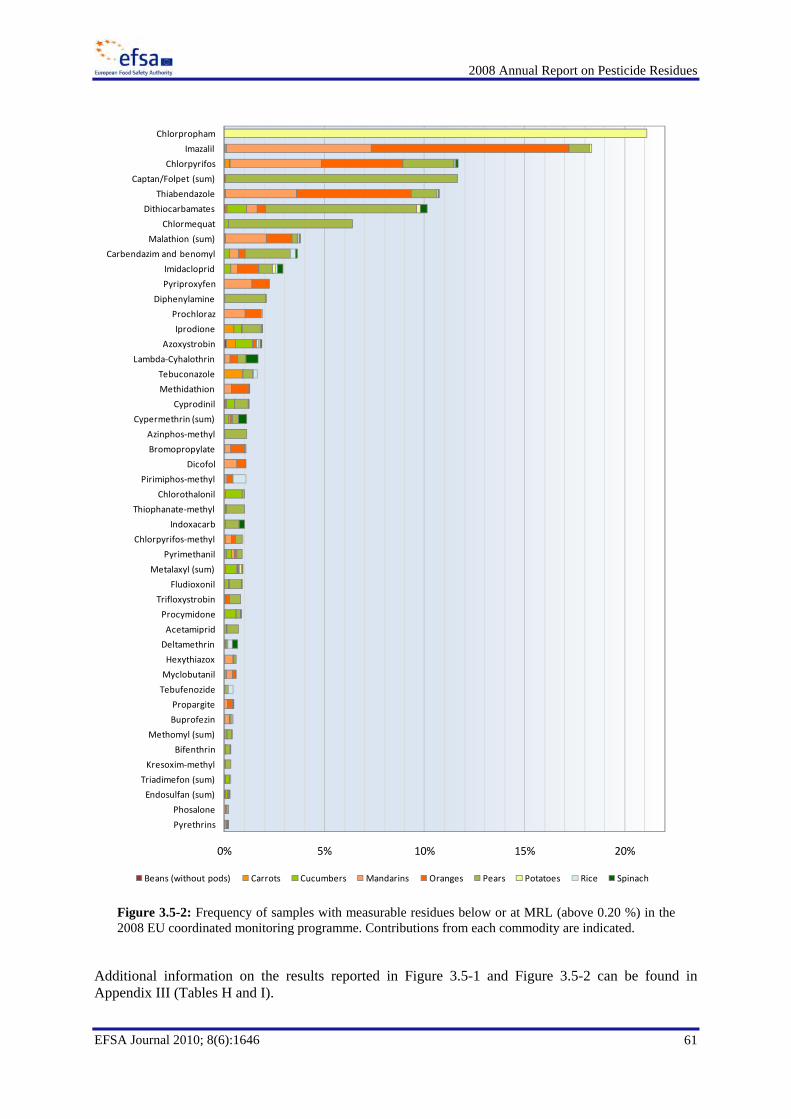
2008 Annual Report on Pesticide Residues
61
EFSA Journal 2010; 8(6):1646
Additional information on the results reported in Figure 3.5-1 and Figure 3.5-2 can be found in Appendix III (Tables H and I).
0% 5% 10% 15% 20%
Chlorpropham
Imazalil
Chlorpyrifos
Captan/Folpet (sum)
Thiabendazole
Dithiocarbamates
Chlormequat
Malathion (sum)
Carbendazim and benomyl
Imidacloprid
Pyriproxyfen
Diphenylamine
Prochloraz
Iprodione
Azoxystrobin
Lambda‐Cyhalothrin
Tebuconazole
Methidathion
Cyprodinil
Cypermethrin (sum)
Azinphos‐methyl
Bromopropylate
Dicofol
Pirimiphos‐methyl
Chlorothalonil
Thiophanate‐methyl
Indoxacarb
Chlorpyrifos‐methyl
Pyrimethanil
Metalaxyl (sum)
Fludioxonil
Trifloxystrobin
Procymidone
Acetamiprid
Deltamethrin
Hexythiazox
Myclobutanil
Tebufenozide
Propargite
Buprofezin
Methomyl (sum)
Bifenthrin
Kresoxim‐methyl
Triadimefon (sum)
Endosulfan (sum)
Phosalone
Pyrethrins
Beans (without pods) Carrots Cucumbers Mandarins Oranges Pears Potatoes Rice Spinach
Figure 3.5-2: Frequency of samples with measurable residues below or at MRL (above 0.20 %) in the2008 EU coordinated monitoring programme. Contributions from each commodity are indicated.
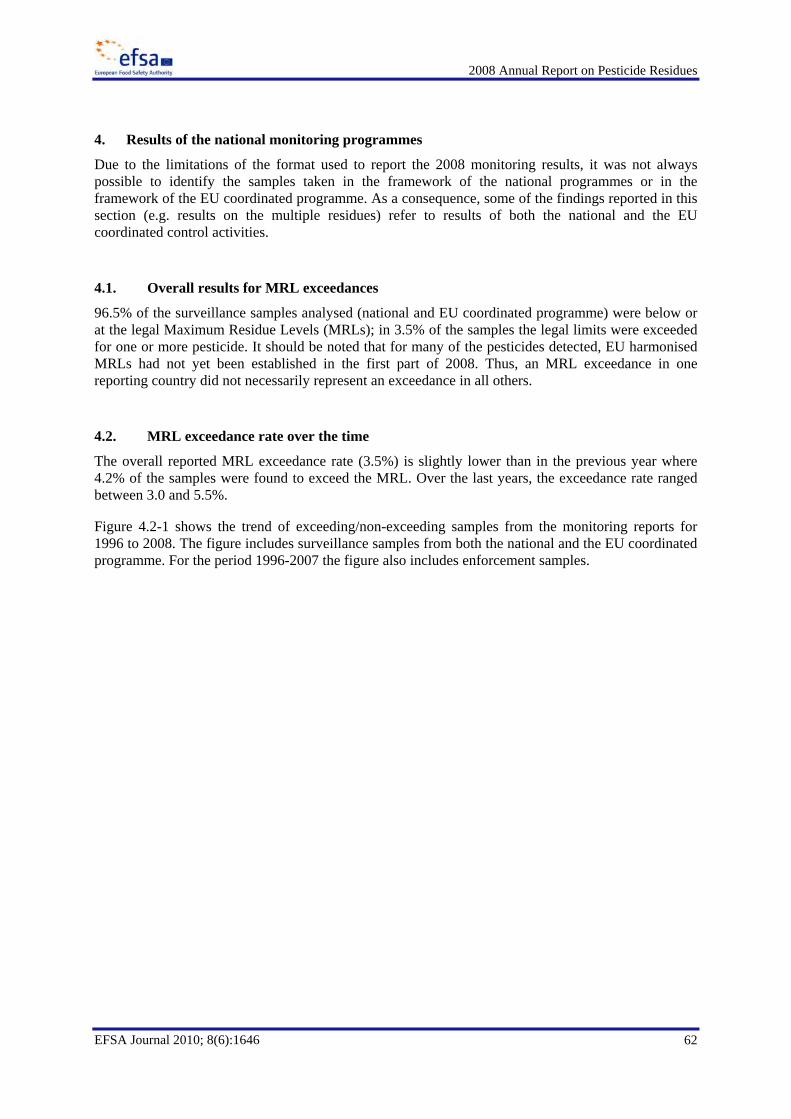
2008 Annual Report on Pesticide Residues
62
EFSA Journal 2010; 8(6):1646
4. Results of the national monitoring programmes
Due to the limitations of the format used to report the 2008 monitoring results, it was not always possible to identify the samples taken in the framework of the national programmes or in the framework of the EU coordinated programme. As a consequence, some of the findings reported in this section (e.g. results on the multiple residues) refer to results of both the national and the EU coordinated control activities.
4.1. Overall results for MRL exceedances
96.5% of the surveillance samples analysed (national and EU coordinated programme) were below or at the legal Maximum Residue Levels (MRLs); in 3.5% of the samples the legal limits were exceeded for one or more pesticide. It should be noted that for many of the pesticides detected, EU harmonised MRLs had not yet been established in the first part of 2008. Thus, an MRL exceedance in one reporting country did not necessarily represent an exceedance in all others.
4.2. MRL exceedance rate over the time
The overall reported MRL exceedance rate (3.5%) is slightly lower than in the previous year where 4.2% of the samples were found to exceed the MRL. Over the last years, the exceedance rate ranged between 3.0 and 5.5%.
Figure 4.2-1 shows the trend of exceeding/non-exceeding samples from the monitoring reports for 1996 to 2008. The figure includes surveillance samples from both the national and the EU coordinated programme. For the period 1996-2007 the figure also includes enforcement samples.
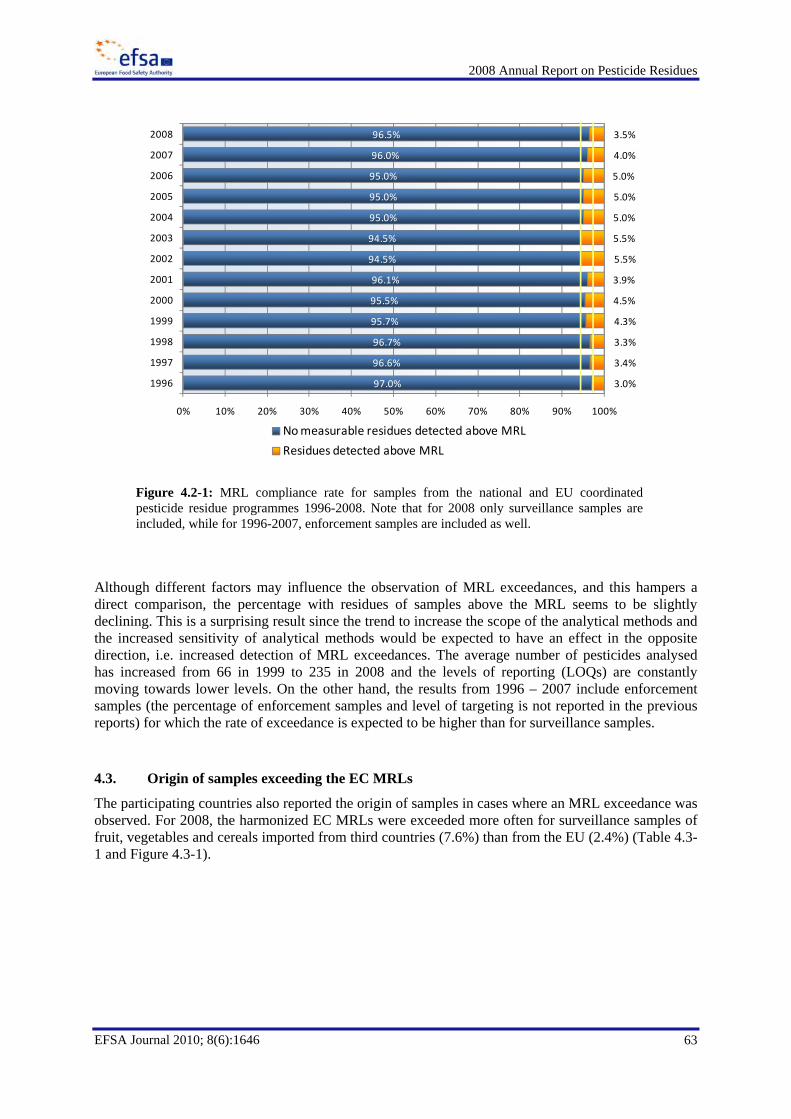
2008 Annual Report on Pesticide Residues
63
EFSA Journal 2010; 8(6):1646
Although different factors may influence the observation of MRL exceedances, and this hampers a direct comparison, the percentage with residues of samples above the MRL seems to be slightly declining. This is a surprising result since the trend to increase the scope of the analytical methods and the increased sensitivity of analytical methods would be expected to have an effect in the opposite direction, i.e. increased detection of MRL exceedances. The average number of pesticides analysed has increased from 66 in 1999 to 235 in 2008 and the levels of reporting (LOQs) are constantly moving towards lower levels. On the other hand, the results from 1996 – 2007 include enforcement samples (the percentage of enforcement samples and level of targeting is not reported in the previous reports) for which the rate of exceedance is expected to be higher than for surveillance samples.
4.3. Origin of samples exceeding the EC MRLs
The participating countries also reported the origin of samples in cases where an MRL exceedance was observed. For 2008, the harmonized EC MRLs were exceeded more often for surveillance samples of fruit, vegetables and cereals imported from third countries (7.6%) than from the EU (2.4%) (Table 4.3-1 and Figure 4.3-1).
97.0%
96.6%
96.7%
95.7%
95.5%
96.1%
94.5%
94.5%
95.0%
95.0%
95.0%
96.0%
96.5%
3.0%
3.4%
3.3%
4.3%
4.5%
3.9%
5.5%
5.5%
5.0%
5.0%
5.0%
4.0%
3.5%
0% 10% 20% 30% 40% 50% 60% 70% 80% 90% 100%
1996
1997
1998
1999
2000
2001
2002
2003
2004
2005
2006
2007
2008
No measurable residues detected above MRL
Residues detected above MRL
Figure 4.2-1: MRL compliance rate for samples from the national and EU coordinated pesticide residue programmes 1996-2008. Note that for 2008 only surveillance samples are included, while for 1996-2007, enforcement samples are included as well.
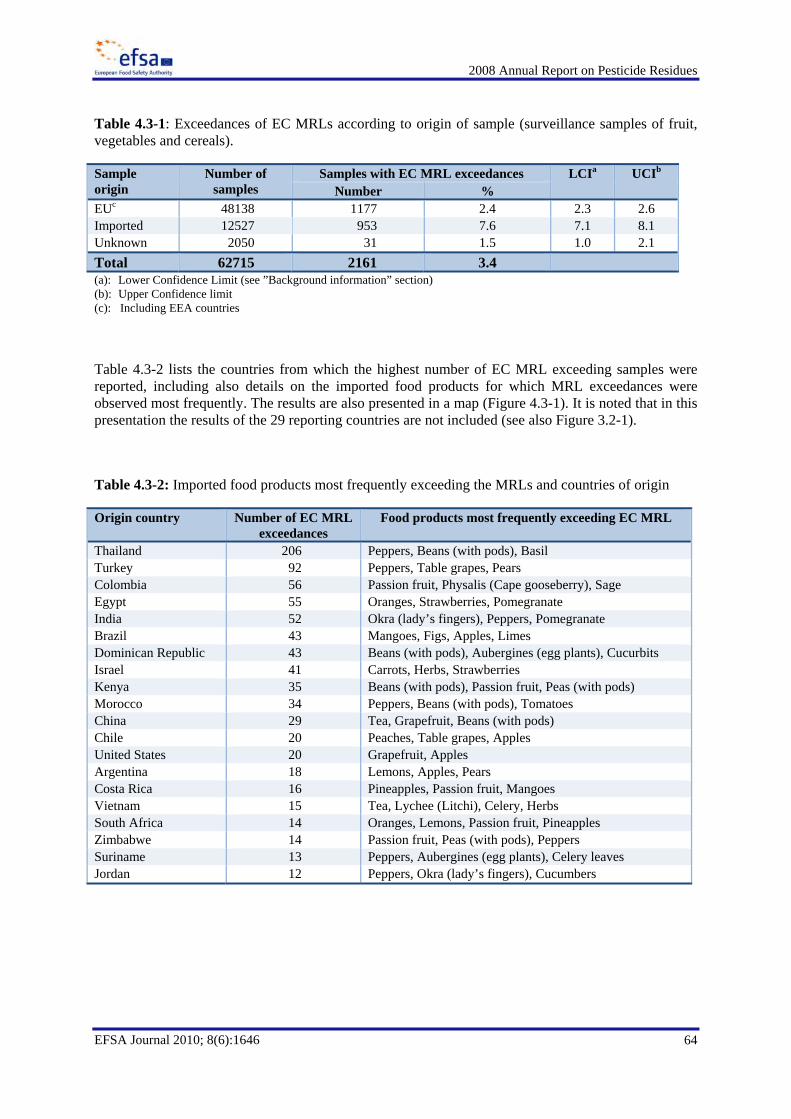
2008 Annual Report on Pesticide Residues
64
EFSA Journal 2010; 8(6):1646
Table 4.3-1: Exceedances of EC MRLs according to origin of sample (surveillance samples of fruit, vegetables and cereals).
Sample origin
Number of samples
Samples with EC MRL exceedances LCIa UCIb Number %
EUc 48138 1177 2.4 2.3 2.6 Imported 12527 953 7.6 7.1 8.1 Unknown 2050 31 1.5 1.0 2.1 Total 62715 2161 3.4 (a): Lower Confidence Limit (see ”Background information” section) (b): Upper Confidence limit (c): Including EEA countries
Table 4.3-2 lists the countries from which the highest number of EC MRL exceeding samples were reported, including also details on the imported food products for which MRL exceedances were observed most frequently. The results are also presented in a map (Figure 4.3-1). It is noted that in this presentation the results of the 29 reporting countries are not included (see also Figure 3.2-1).
Table 4.3-2: Imported food products most frequently exceeding the MRLs and countries of origin
Origin country Number of EC MRL exceedances
Food products most frequently exceeding EC MRL
Thailand 206 Peppers, Beans (with pods), Basil Turkey 92 Peppers, Table grapes, Pears Colombia 56 Passion fruit, Physalis (Cape gooseberry), Sage Egypt 55 Oranges, Strawberries, Pomegranate India 52 Okra (lady’s fingers), Peppers, Pomegranate Brazil 43 Mangoes, Figs, Apples, Limes Dominican Republic 43 Beans (with pods), Aubergines (egg plants), Cucurbits Israel 41 Carrots, Herbs, Strawberries Kenya 35 Beans (with pods), Passion fruit, Peas (with pods) Morocco 34 Peppers, Beans (with pods), Tomatoes China 29 Tea, Grapefruit, Beans (with pods) Chile 20 Peaches, Table grapes, Apples United States 20 Grapefruit, Apples Argentina 18 Lemons, Apples, Pears Costa Rica 16 Pineapples, Passion fruit, Mangoes Vietnam 15 Tea, Lychee (Litchi), Celery, Herbs South Africa 14 Oranges, Lemons, Passion fruit, Pineapples Zimbabwe 14 Passion fruit, Peas (with pods), Peppers Suriname 13 Peppers, Aubergines (egg plants), Celery leaves Jordan 12 Peppers, Okra (lady’s fingers), Cucumbers
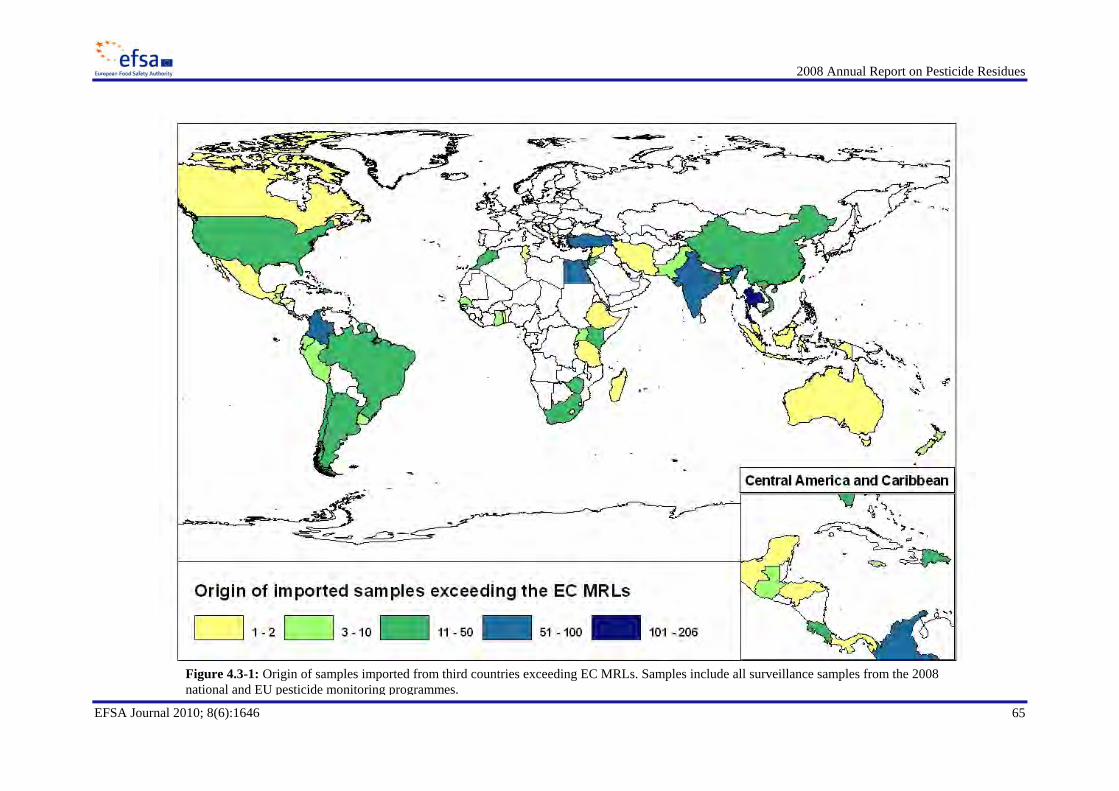
2008 Annual Report on Pesticide Residues
65
EFSA Journal 2010; 8(6):1646
Figure 4.3-1: Origin of samples imported from third countries exceeding EC MRLs. Samples include all surveillance samples from the 2008national and EU pesticide monitoring programmes.
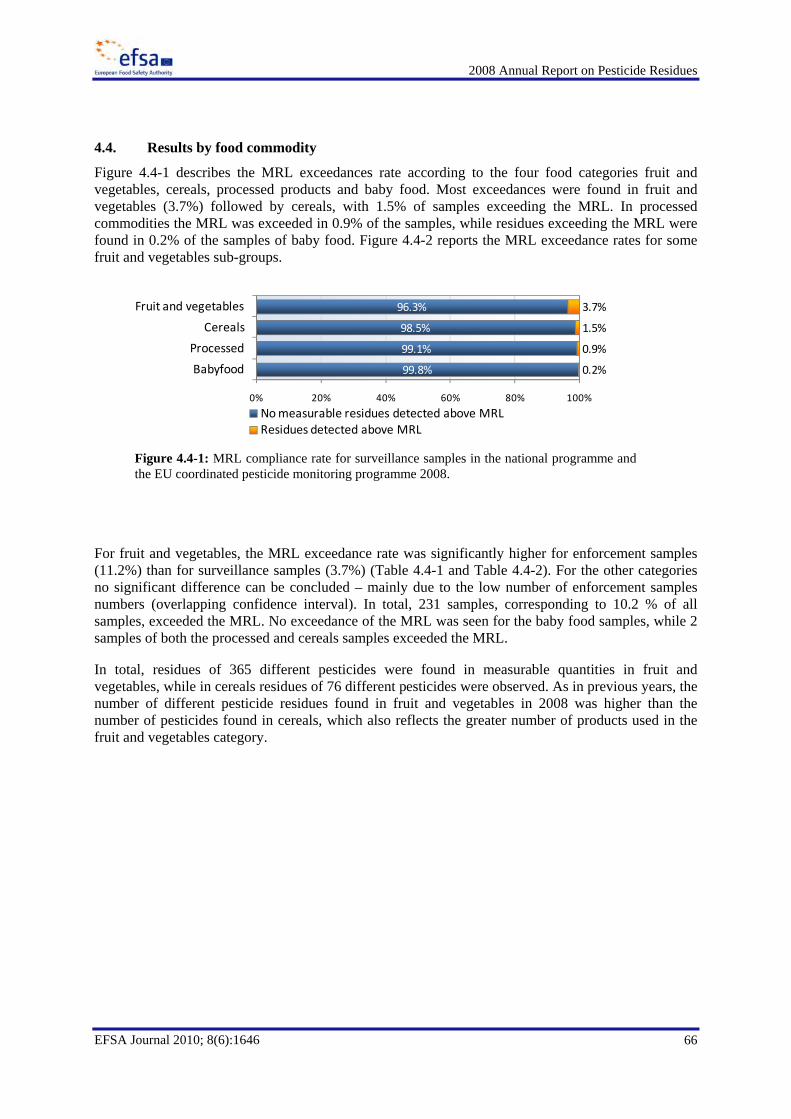
2008 Annual Report on Pesticide Residues
66
EFSA Journal 2010; 8(6):1646
4.4. Results by food commodity
Figure 4.4-1 describes the MRL exceedances rate according to the four food categories fruit and vegetables, cereals, processed products and baby food. Most exceedances were found in fruit and vegetables (3.7%) followed by cereals, with 1.5% of samples exceeding the MRL. In processed commodities the MRL was exceeded in 0.9% of the samples, while residues exceeding the MRL were found in 0.2% of the samples of baby food. Figure 4.4-2 reports the MRL exceedance rates for some fruit and vegetables sub-groups.
For fruit and vegetables, the MRL exceedance rate was significantly higher for enforcement samples (11.2%) than for surveillance samples (3.7%) (Table 4.4-1 and Table 4.4-2). For the other categories no significant difference can be concluded – mainly due to the low number of enforcement samples numbers (overlapping confidence interval). In total, 231 samples, corresponding to 10.2 % of all samples, exceeded the MRL. No exceedance of the MRL was seen for the baby food samples, while 2 samples of both the processed and cereals samples exceeded the MRL.
In total, residues of 365 different pesticides were found in measurable quantities in fruit and vegetables, while in cereals residues of 76 different pesticides were observed. As in previous years, the number of different pesticide residues found in fruit and vegetables in 2008 was higher than the number of pesticides found in cereals, which also reflects the greater number of products used in the fruit and vegetables category.
99.8%
99.1%
98.5%
96.3%
0.2%
0.9%
1.5%
3.7%
0% 20% 40% 60% 80% 100%
Babyfood
Processed
Cereals
Fruit and vegetables
No measurable residues detected above MRLResidues detected above MRL
Figure 4.4-1: MRL compliance rate for surveillance samples in the national programme andthe EU coordinated pesticide monitoring programme 2008.
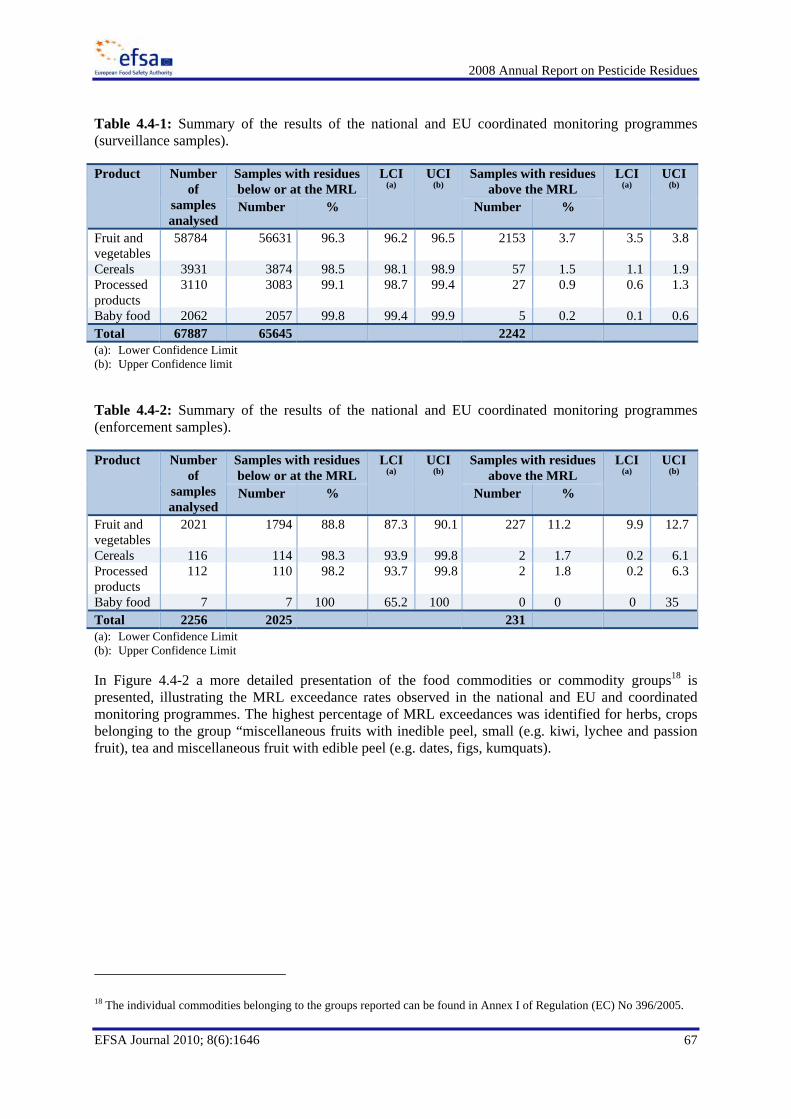
2008 Annual Report on Pesticide Residues
67
EFSA Journal 2010; 8(6):1646
Table 4.4-1: Summary of the results of the national and EU coordinated monitoring programmes (surveillance samples).
Product Number of
samples analysed
Samples with residues below or at the MRL
LCI (a)
UCI (b)
Samples with residues above the MRL
LCI (a)
UCI (b)
Number % Number %
Fruit and vegetables
58784 56631 96.3 96.2 96.5 2153 3.7 3.5 3.8
Cereals 3931 3874 98.5 98.1 98.9 57 1.5 1.1 1.9 Processed products
3110 3083 99.1 98.7 99.4 27 0.9 0.6 1.3
Baby food 2062 2057 99.8 99.4 99.9 5 0.2 0.1 0.6 Total 67887 65645 2242 (a): Lower Confidence Limit (b): Upper Confidence limit
Table 4.4-2: Summary of the results of the national and EU coordinated monitoring programmes (enforcement samples).
Product Number of
samples analysed
Samples with residues below or at the MRL
LCI (a)
UCI (b)
Samples with residues above the MRL
LCI (a)
UCI (b)
Number % Number %
Fruit and vegetables
2021 1794 88.8 87.3 90.1 227 11.2 9.9 12.7
Cereals 116 114 98.3 93.9 99.8 2 1.7 0.2 6.1 Processed products
112 110 98.2 93.7 99.8 2 1.8 0.2 6.3
Baby food 7 7 100 65.2 100 0 0 0 35 Total 2256 2025 231 (a): Lower Confidence Limit (b): Upper Confidence Limit In Figure 4.4-2 a more detailed presentation of the food commodities or commodity groups18 is presented, illustrating the MRL exceedance rates observed in the national and EU and coordinated monitoring programmes. The highest percentage of MRL exceedances was identified for herbs, crops belonging to the group “miscellaneous fruits with inedible peel, small (e.g. kiwi, lychee and passion fruit), tea and miscellaneous fruit with edible peel (e.g. dates, figs, kumquats).
18 The individual commodities belonging to the groups reported can be found in Annex I of Regulation (EC) No 396/2005.
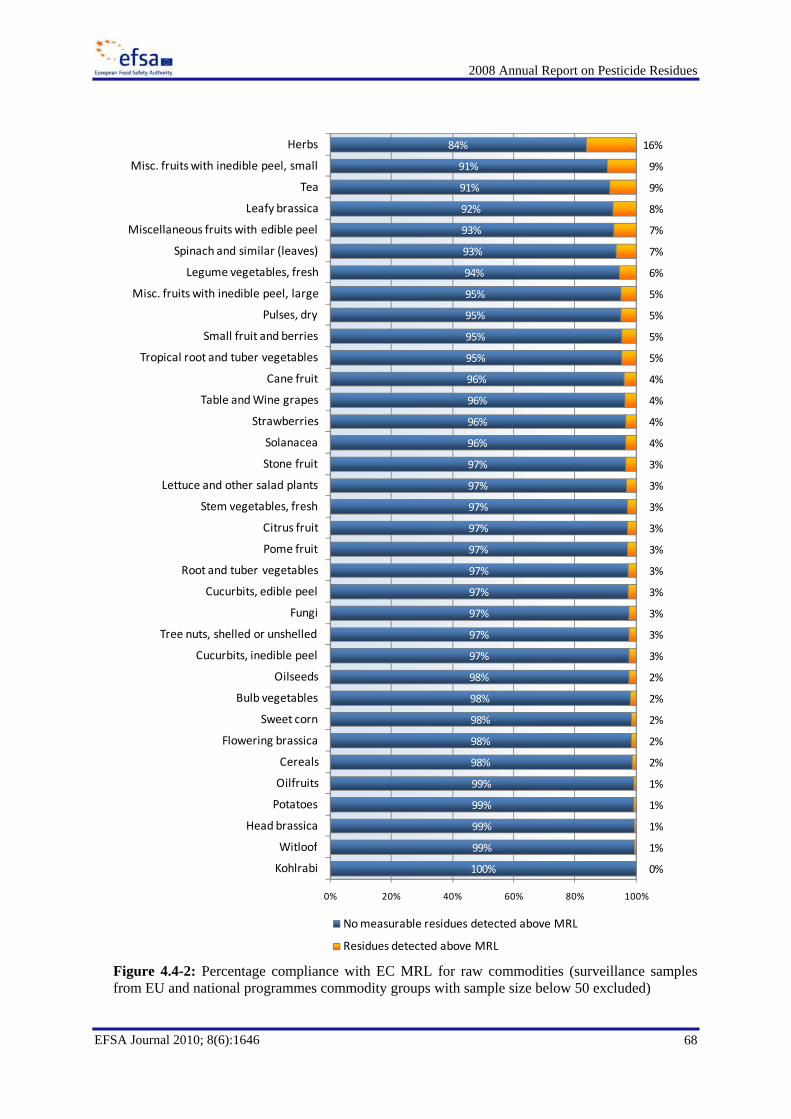
2008 Annual Report on Pesticide Residues
68
EFSA Journal 2010; 8(6):1646
Figure 4.4-2: Percentage compliance with EC MRL for raw commodities (surveillance samples from EU and national programmes commodity groups with sample size below 50 excluded)
84%
91%
91%
92%
93%
93%
94%
95%
95%
95%
95%
96%
96%
96%
96%
97%
97%
97%
97%
97%
97%
97%
97%
97%
97%
98%
98%
98%
98%
98%
99%
99%
99%
99%
100%
16%
9%
9%
8%
7%
7%
6%
5%
5%
5%
5%
4%
4%
4%
4%
3%
3%
3%
3%
3%
3%
3%
3%
3%
3%
2%
2%
2%
2%
2%
1%
1%
1%
1%
0%
0% 20% 40% 60% 80% 100%
Herbs
Misc. fruits with inedible peel, small
Tea
Leafy brassica
Miscellaneous fruits with edible peel
Spinach and similar (leaves)
Legume vegetables, fresh
Misc. fruits with inedible peel, large
Pulses, dry
Small fruit and berries
Tropical root and tuber vegetables
Cane fruit
Table and Wine grapes
Strawberries
Solanacea
Stone fruit
Lettuce and other salad plants
Stem vegetables, fresh
Citrus fruit
Pome fruit
Root and tuber vegetables
Cucurbits, edible peel
Fungi
Tree nuts, shelled or unshelled
Cucurbits, inedible peel
Oilseeds
Bulb vegetables
Sweet corn
Flowering brassica
Cereals
Oilfruits
Potatoes
Head brassica
Witloof
Kohlrabi
No measurable residues detected above MRL
Residues detected above MRL
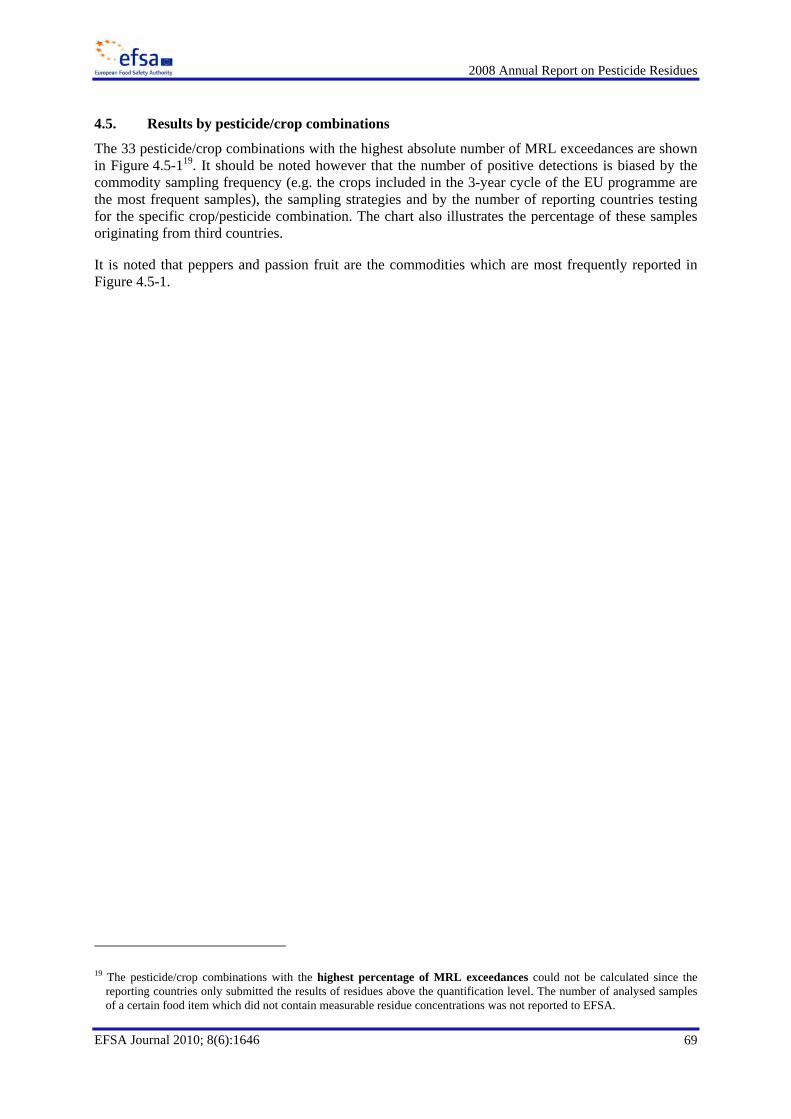
2008 Annual Report on Pesticide Residues
69
EFSA Journal 2010; 8(6):1646
4.5. Results by pesticide/crop combinations
The 33 pesticide/crop combinations with the highest absolute number of MRL exceedances are shown in Figure 4.5-119. It should be noted however that the number of positive detections is biased by the commodity sampling frequency (e.g. the crops included in the 3-year cycle of the EU programme are the most frequent samples), the sampling strategies and by the number of reporting countries testing for the specific crop/pesticide combination. The chart also illustrates the percentage of these samples originating from third countries.
It is noted that peppers and passion fruit are the commodities which are most frequently reported in Figure 4.5-1.
19 The pesticide/crop combinations with the highest percentage of MRL exceedances could not be calculated since the
reporting countries only submitted the results of residues above the quantification level. The number of analysed samples of a certain food item which did not contain measurable residue concentrations was not reported to EFSA.
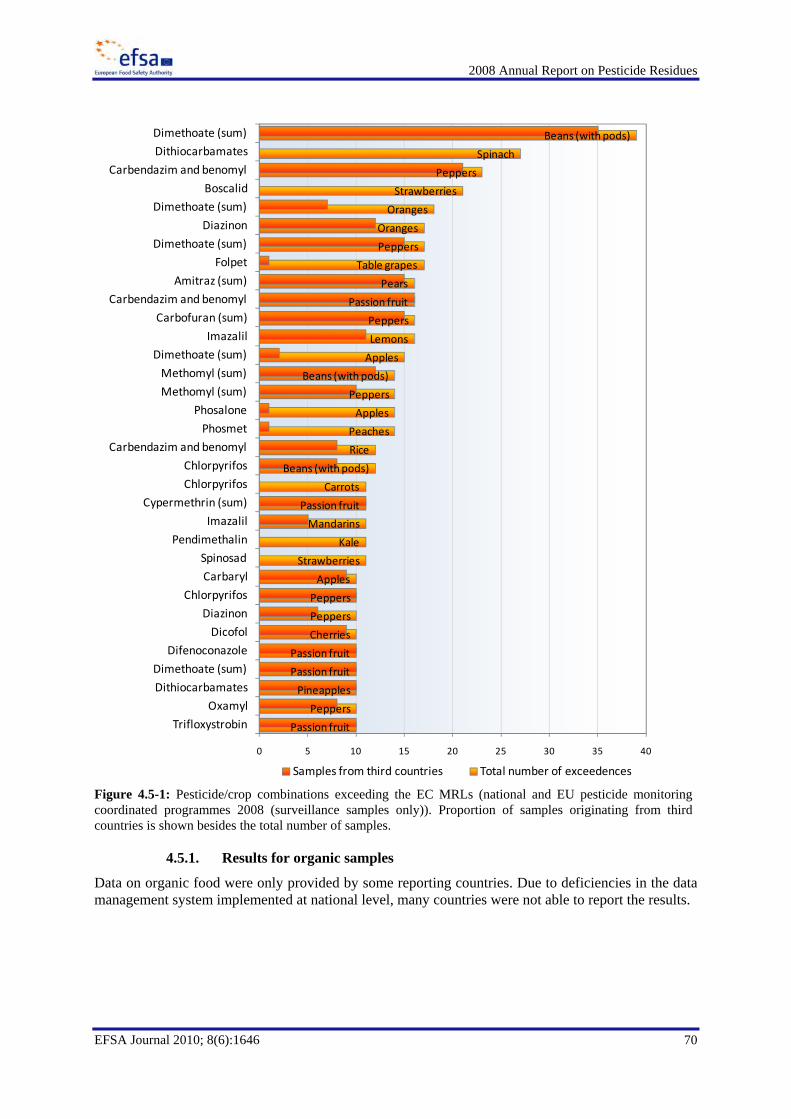
2008 Annual Report on Pesticide Residues
70
EFSA Journal 2010; 8(6):1646
Figure 4.5-1: Pesticide/crop combinations exceeding the EC MRLs (national and EU pesticide monitoring coordinated programmes 2008 (surveillance samples only)). Proportion of samples originating from third countries is shown besides the total number of samples.
4.5.1. Results for organic samples
Data on organic food were only provided by some reporting countries. Due to deficiencies in the data management system implemented at national level, many countries were not able to report the results.
Passion fruit
Peppers
Pineapples
Passion fruit
Passion fruit
Cherries
Peppers
Peppers
Apples
Strawberries
Kale
Mandarins
Passion fruit
Carrots
Beans (with pods)
Rice
Peaches
Apples
Peppers
Beans (with pods)
Apples
Lemons
Peppers
Passion fruit
Pears
Table grapes
Peppers
Oranges
Oranges
Strawberries
Peppers
Spinach
Beans (with pods)
0 5 10 15 20 25 30 35 40
Trifloxystrobin
Oxamyl
Dithiocarbamates
Dimethoate (sum)
Difenoconazole
Dicofol
Diazinon
Chlorpyrifos
Carbaryl
Spinosad
Pendimethalin
Imazalil
Cypermethrin (sum)
Chlorpyrifos
Chlorpyrifos
Carbendazim and benomyl
Phosmet
Phosalone
Methomyl (sum)
Methomyl (sum)
Dimethoate (sum)
Imazalil
Carbofuran (sum)
Carbendazim and benomyl
Amitraz (sum)
Folpet
Dimethoate (sum)
Diazinon
Dimethoate (sum)
Boscalid
Carbendazim and benomyl
Dithiocarbamates
Dimethoate (sum)
Samples from third countries Total number of exceedences
2008 Annual Report on Pesticide Residues
71
EFSA Journal 2010; 8(6):1646
Table 4.5.1-1: Summary of the results of the national and EU coordinated monitoring programmes for pesticides residues in organic food (surveillance and enforcement samples) in 2008.
Product Number of samples analysed
Samples without detected residues or none above the MRL
LCL (a)
UCL (b)
Samples with residues above the
MRL
LCL (a)
UCL (b)
Number % Number % Fruit and vegetables
2479 2456 99.1 98.6 99.4 23 0.9 0.6 1.4
Cereals 335 330 98.5 96.6 99.5 5 1.5 0.5 3.4 Processed 167 167 100 98.2 100 0 0 0 1.8 Babyfood 150 148 98.7 95.3 99.8 2 1.3 0.2 4.7 Total 3131 3101 30 1.0 (a): Lower Confidence Limit (b): Upper Confidence limit
For fruit and vegetables, a lower rate of MRL exceedances (0.9%) in comparison to conventionally grown fruit and vegetables (3.7%) was found (Table 4.4-1 and Table 4.5.1-1). However, when comparing the rate of exceedances in organic and conventional products it should be also born in mind that the results of the organic samples comprise data for surveillance and enforcement samples whereas the data for conventional products only refers to surveillance samples.
Due to the structure of the reported data, no information is available which pesticides were found in organic samples (e.g. the pesticides included in Regulation (EEC) No 2092/91, see Table 2.2.5-1). Therefore a further analysis of the reasons explaining the occurrence of residues in organic food and/or MRL exceedances is not possible.
In order to gain further knowledge in this area, reporting countries are encouraged to enable the data management systems to differentiate between organic and conventional products. A new data collection system for reporting this information to EFSA is under implementation.
4.5.2. Results for baby-food samples
A general default EC MRL of 0.01 mg/kg is applicable for all active substances unless specific MRLs lower than 0.01 mg/kg were established in Commission Directive 2006/141/EC for infant formulae and follow-on formulae and in Commission Directive 2006/125/EC for processed cereal-based foods and baby foods for infants and young children. In 2008 25 countries reported data on analysis of baby food. Overall 2,062 samples were analysed. Residues above the reporting level were found in 76 samples, while the MRL was exceeded only in 4 samples (0.2%). The four samples exceeding the MRL were samples of baby food based on fruit and vegetables and the measured residue exceeding the legal limits were boscalid (2 samples), thiabendazole (1 sample) and thiacloprid (1 sample).
Due to the limitation of the format used for the data reporting, further analysis of the baby food results could not be performed.
4.5.3. Results for processed products
The MRLs applicable for processed commodities are based on the MRLs established for raw agricultural commodities, taking into account changes in levels of pesticide residues caused by processing or mixing. In 2008, 23 countries reported data on analysis of processed products. A total of 3,110 samples were analysed. Residues above the MRL were found in 27 samples (0.9%). It is not reported which processing factors were applied to derive the MRL for processed commodities.
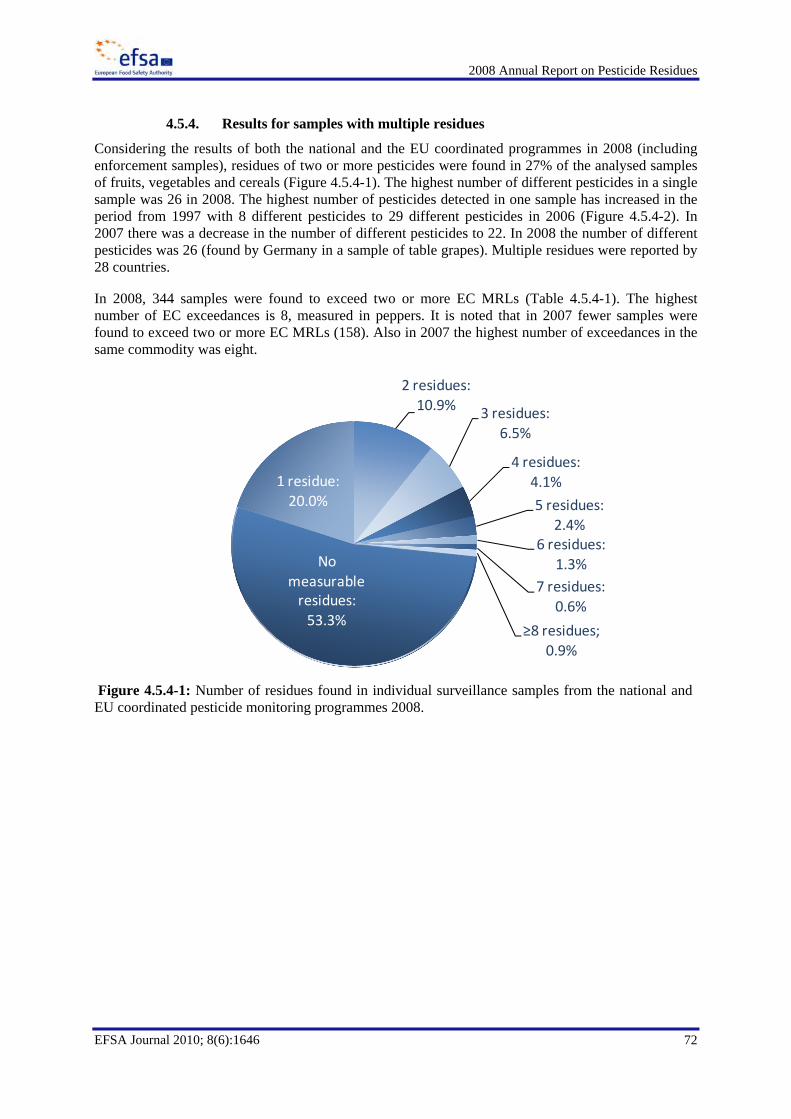
2008 Annual Report on Pesticide Residues
72
EFSA Journal 2010; 8(6):1646
4.5.4. Results for samples with multiple residues
Considering the results of both the national and the EU coordinated programmes in 2008 (including enforcement samples), residues of two or more pesticides were found in 27% of the analysed samples of fruits, vegetables and cereals (Figure 4.5.4-1). The highest number of different pesticides in a single sample was 26 in 2008. The highest number of pesticides detected in one sample has increased in the period from 1997 with 8 different pesticides to 29 different pesticides in 2006 (Figure 4.5.4-2). In 2007 there was a decrease in the number of different pesticides to 22. In 2008 the number of different pesticides was 26 (found by Germany in a sample of table grapes). Multiple residues were reported by 28 countries.
In 2008, 344 samples were found to exceed two or more EC MRLs (Table 4.5.4-1). The highest number of EC exceedances is 8, measured in peppers. It is noted that in 2007 fewer samples were found to exceed two or more EC MRLs (158). Also in 2007 the highest number of exceedances in the same commodity was eight.
Figure 4.5.4-1: Number of residues found in individual surveillance samples from the national and EU coordinated pesticide monitoring programmes 2008.
No measurable residues: 53.3%
1 residue: 20.0%
2 residues: 10.9% 3 residues:
6.5%
4 residues: 4.1%
5 residues: 2.4%
6 residues: 1.3%
7 residues: 0.6%
≥8 residues; 0.9%
2008 Annual Report on Pesticide Residues
73
EFSA Journal 2010; 8(6):1646
Figure 4.5.4-2: Highest reported number of different pesticides in one sample from 1997 to 2008 in fruit, vegetables and cereals.
Table 4.5.4-1: Summary of results for unprocessed samples with multiple EC MRL exceedances.
Commodity Number of EC exceedances in one sample Total number of samples with multiple exceedances 2 3 4 5 6 8
Peppers 27 12 11 2 1 1 54 Beans (with pods) 26 9 5 1 41 Passion fruit 12 5 4 1 22 Basil 13 6 2 21 Celery leaves 11 2 1 14 Strawberries 10 4 14 Lettuce 8 4 1 13 Spinach 9 2 1 12 Okra, lady’s fingers 4 5 9 Peaches 9 9 Lemons 7 7 Tea 3 2 1 1 7 Carrots 6 6 Aubergines (egg plants) 4 1 5 Celery 2 1 2 5 Lychee (Litchi) 1 4 5 Yams 4 1 5 Pomegranate 5 5 Tomatoes 3 1 4 Rocket, Rucola 4 4 Table grapes 4 4 Currants (red, black and white) 4 4 Parsley 4 4 Oranges 4 4 Apples 3 1 4 Pears 3 3 Beet leaves (chard) 2 1 3 Apricots 3 3 Cucumbers 3 3 Pineapples 3 3 Spring onions 1 2 3
810 10 10 11
16 1618
23
29
2226
0
5
10
15
20
25
30
35
1997 1998 1999 2000 2001 2002 2003 2004 2005 2006 2007 2008
Num
ber o
f pesticides
Sampling year
2008 Annual Report on Pesticide Residues
74
EFSA Journal 2010; 8(6):1646
Commodity Number of EC exceedances in one sample Total number of samples with multiple exceedances 2 3 4 5 6 8
Potatoes 2 2 Lamb's lettuce 1 1 2 Herbal infusions (leaves) 1 1 2 Grapefruit 2 2 Blueberries 2 2 Globe artichokes 2 2 Peas (with pods) 1 1 2 Blackberries 2 2 Courgettes 2 2 Mangoes 1 1 2 Bananas 2 2 Asparagus 1 1 2 Legume vegetables, fresh 2 2 Barley 1 1 Cassava 1 1 Kale 1 1 Gooseberries 1 1 Ginger 1 1 Garlic 1 1 Figs 1 1 Almonds 1 1 Beans (dry) 1 1 Mandarins 1 1 Celeriac 1 1 Turnips 1 1 Rosemary 1 1 Thyme 1 1 Table and Wine grapes 1 1 Wheat 1 1 Raspberries 1 1 Walnuts 1 1
Multiple residues in one sample can result from the application of different types of pesticides used to protect the crop against different pests or diseases, e.g. insecticides, fungicides and herbicides. However, as an European database on the authorised GAPs and pesticide uses is not available it is not possible to ascertain if multiple residues are due to the application of different pesticides on the same crop.
Another reason for the increasing number of samples with multiple residues could be that laboratories are improving the sensitivity of analytical methods and increasing the number of substances for which the samples are analysed for.
2008 Annual Report on Pesticide Residues
75
EFSA Journal 2010; 8(6):1646
Table 4.5.4-2: Percentage of samples (surveillance and enforcement) from the national and EU coordinated pesticide monitoring programme 2008 with multiple residues.
Commodity Number of
samples
Percentage of samples with multiple residues 2 3 4 5 More
than 5 Total
Citrus fruit (e.g. oranges, grapefruits and lemons) 5505 21.5 15.7 10.6 5.5 3.5 56.9
Cane fruit (e.g. blackberries and raspberries) 390 18.2 17.9 9.7 4.9 4.4 55.1 Other small fruit and berries (e.g. blueberries/goosberries) 687 13.7 12.2 10.9 8.0 9.0 53.9
Strawberries 2760 13.6 11.9 10.8 7.6 7.2 51.0 Table and Wine grapes 3153 16.8 10.9 7.1 6.1 10.0 50.8 Pome fruit (e.g. apples and pears) 6048 15.2 10.6 8.2 5.1 5.8 44.8 Lettuce and other salad plants, including Brassica 3214 12.8 9.5 5.7 4.0 5.9 37.8
Herbs (e.g. parsley) 800 11.5 9.9 4.3 2.9 4.5 33.0 Tea, dried leaves and stalks, fermented or otherwise of Camellia sinensis 240 12.9 6.7 3.8 3.3 5.8 32.5
Stone fruit (e.g. apricots, cherries and peaches) 3933 14.0 7.8 4.3 2.2 2.7 31.0 Miscellaneous fruits with inedible peel, large (e.g. banana, mango and papaya) 2007 19.0 6.6 1.7 0.4 0.2 27.9
Solanacea (e.g. tomatoes, peppers and aubergines) 7436 9.6 4.9 2.6 1.5 2.3 21.0
Miscellaneous fruits with inedible peel, small (e.g. kiwi, lychee and passion fruit) 1180 9.9 3.5 2.1 1.4 1.2 18.1
Leafy brassica (e.g. Chinese cabbage and kale) 431 11.1 3.2 1.6 0.5 0.5 16.9 Cucurbits, edible peel (e.g. cucumbers and curgettes) 3177 7.9 3.8 1.9 0.8 0.8 15.3
Cucurbits, inedible peel (e.g. melons, pumpkins) 996 8.2 4.3 1.3 0.7 0.7 15.3
Other root and tuber vegetables except sugar beet (e.g. beetroot, carrots and radishes) 2862 8.2 3.4 1.9 0.7 0.7 14.8
Miscellaneous fruits with edible peel (e.g. figs, table olives and dates) 300 10.3 2.0 1.0 0.7 0.0 14.0
Legume vegetables, fresh (e.g. beans and peas) 2114 7.6 3.2 1.6 0.6 0.9 13.9 Stem vegetables, fresh (e.g. fennel, asparagus and celery) 1355 6.9 2.9 1.0 0.7 0.4 12.0
Head brassica (e.g. head cabbage and Brussels sprouts) 973 6.4 2.4 1.4 0.4 0.2 10.8
Spinach and similar (leaves) 1315 5.4 2.3 0.9 0.2 0.4 9.2 Cereals 3720 6.0 1.7 0.5 0.1 0.1 8.4 Witloof 167 7.2 0.0 0.0 0.0 0.0 7.2 Tropical root and tuber vegetables (e.g. cassava) 226 5.8 0.9 0.0 0.0 0.0 6.6
Fungi 476 3.4 0.2 0.0 0.8 1.5 5.9 Bulb vegetables (e.g. garlic and onion) 953 2.5 1.3 0.8 0.6 0.4 5.7 Kohlrabi 81 4.9 0.0 0.0 0.0 0.0 4.9 Potatoes 3092 2.7 0.5 0.2 0.0 0.0 3.4 Oilseeds (e.g. linseed and sunflower seed) 183 1.6 1.1 0.0 0.0 0.0 2.7 Tree nuts (e.g. almonds and hazelnuts) 166 2.4 0.0 0.0 0.0 0.0 2.4 Flowering brassica (e.g. broccoli) 817 1.6 0.4 0.2 0.0 0.0 2.2 Pulses, dry (e.g. dry lentils and beans) 267 0.7 0.4 0.4 0.0 0.0 1.5 Oilfruits (e.g. olives for oil production) 409 0.2 0.2 0.0 0.0 0.0 0.5
2008 Annual Report on Pesticide Residues
76
EFSA Journal 2010; 8(6):1646
In addition to the reasons for multiple residues justified by agricultural practices mentioned above, other possible reasons for the occurrence of multiple residues are:
• mixing of lots which were treated with different pesticides, either during the sampling or in the course of sorting the commodities (e.g. sorting for quality classes);
• residues resulting from uptake via soil in cases where pesticides have high persistence in soil;
• residues resulting from spray drift from neighbouring plots or cross-contamination in the processing of the crops (e.g. by washing practices);
• contamination during storage.
4.5.5. Reasons for MRL exceedances
In 2008, 2,242 samples (including enforcement samples) were found to exceed national or EC MRLs. The reporting countries indicated reasons for MRL exceedances in only 232 events of MRL exceedance. 173 out of these 232 events were not considered useful for evaluating the reasons for MRL exceedances (e.g. “Only omethoate”, “Not known”). The remaining 59 explanations provided are listed in Table 4.5.5-1. Due to the limited number of reported explanations, these are not considered to be representative for all MRL exceedances reported in 2008. As a result, general conclusions on the reasons for MRL exceedances cannot be provided and possible risk management options cannot be formulated. It is therefore recommended that national authorities improve the reporting of this information; this may need improvement of the collaboration with national authorities involved in pesticide use and monitoring and in the traceability of samples.
Since no European database on the authorised GAPs is available it is not possible to check if some of the reported MRL exceedances are related to unauthorised uses.
Table 4.5.5-1: Reasons for MRL exceedances as reported by the participating countries
Reasons for exceedances Number of samples Differences in national MRLs 1 Inadequate or incorrect use of the pesticide 16 Misuse - no further information 9 Misuse (authorized many years ago) 1 Misuse (authorized till recently) 26 Misuse (few products available against the pest) 6 Total 59
2008 Annual Report on Pesticide Residues
77
EFSA Journal 2010; 8(6):1646
5. Dietary exposure and dietary risk assessment
Dietary exposure assessment is defined by Codex Alimentarius as “the qualitative and/or quantitative evaluation of the likely intake of chemical agents via food as well as exposure from other sources, if relevant” (FAO 2006). Exposure is basically a function of the amount of consumed food and the concentration of the chemical (e.g. pesticide residue concentration) and can be expressed by the following equation:
Dietary exposure = Σ(residue concentration food consumption)
body weight
In the chronic (long-term) and acute (short-term) risk assessment, the estimated dietary exposure is compared to the relevant toxicological reference values, i.e. the acceptable daily intake (ADI) and the Acute Reference Dose (ARfD), respectively (see “Background information” in Section 1), which were derived after a full hazard characterisation of the compound.
The consumer is considered to be adequately protected if the estimated dietary intake of a pesticide residue does not exceed the ADI or the ARfD. The ADI and ARfD are derived after a full hazard characterization of a compound.
In the context of this Annual Report, EFSA performs the risk assessment to estimate the actual dietary pesticide exposure of the European population. In this case, the residue data used to calculate the consumer’s exposures are mainly derived from the 2008 EU programme, which aims at representing the actual residue concentrations in food consumed by the population. As the 2008 EU coordinated programme only covered 9 food commodities, residue data for additional food commodities relevant for the chronic exposure assessment were retrieved from the national control programmes. Since the 2008 residue data were provided by the participating countries in aggregated format, accurate calculations on the actual dietary exposure could not be performed. Thus, the calculations should be regarded as an approximate indication of the actual short-term and long-term exposure of European consumers only which is affected by uncertainties.
Regulation (EC) No. 396/2005 also requires that for the risk assessment, other relevant data sources such as the report submitted under Directive 96/23/EC (EC 1996b) should be taken into account. In 2009, EFSA published the 2008 annual technical report on the results from monitoring veterinary medicinal product residues and other substances in food of animal origin in the Member States (EFSA 2010). Some of the substances covered by this technical report are substances that may also be used as plant protection products. If residues of these substances occur in food of animal origin, these could be considered as an additional source of exposure for the estimation of consumer exposure. However, data submitted by Member States under Directive 96/23/EC for products of animal origin could not be considered in the present Annual Report, as in most cases only the number of samples exceeding or not exceeding the MRL were reported but not the actual concentrations of residues measured in the samples. In addition, the data are generated from targeted sampling strategies and therefore are not representative for all products of animal origin available on the EU market.
As no agreed international or European methodology for estimating the actual chronic and acute exposure to pesticide residues measured in monitoring activities is available, EFSA decided to adapt the risk assessment methodology developed for the pre-regulatory risk assessment EFSA 2007). The model implements the principle of the WHO methodologies for short-term and long-term risk assessment. The assumptions and considerations made for the development of the new risk assessment methodology are outlined in the next sections.
EFSA did not perform a Cumulative Risk Assessment (CRA) since an agreed European methodology for the assessment of the combined effect of mixtures of pesticides in food is not yet available.
2008 Annual Report on Pesticide Residues
78
EFSA Journal 2010; 8(6):1646
5.1. Model assumptions for the short-term exposure assessment
For the calculation of the short-term intake EFSA calculated the International Estimation of Short Term Intake (IESTI) as described by JMPR (FAO 2009). The calculation methodology implements the coincidence of the following events:
• A consumer who eats a large portion size of the food item under consideration (normally 97.5th percentile of the daily food consumption reported in a food surveys, considering only persons who have consumed the pertinent food item during the reference period) consumes a food item belonging to the lot which contains the highest residue measured (HRM) in the coordinated programme 2008.
• The HRM is multiplied with a factor (variability factor) which accommodates for potential inhomogeneous residue distribution among the individual units in the same lot. The variability factors depend on the unit size of the food item: for food commodities with a unit weight between 25 and 250 g a factor of 7 is applied20 (i.e. carrots, mandarins, oranges, pears and potatoes). The underlying assumption is that the consumer may pick out a highly contaminated unit which contains the seven-fold residues compared with the composite sample which was analysed in a monitoring programme. For food commodities with a unit weight of more than 250 g, a variability factor of 5 is applied (i.e. cucumbers). No variability factor is used for commodities with unit weights less than 25 g (i.e. beans without pods, rice and spinach). It is noted that the model approach used in EU Member States differs from the currently used JMPR methodology, which uses a variability factor of 3 for all commodities with unit weight greater than 25 g.
It should be stressed that the co-occurrence of the above events (i.e. large portion size, highest residue measured and inhomogeneous residue distribution) is extremely unlikely. In case the estimated consumer exposure based on these very conservative assumptions leads to an exceedance of the toxicological reference values, the severity of the critical event should take into account the degree of exceedance (expressed in percent of the ARfD) and the probability that such an event needs to be considered. Therefore not only the degree of exceedance of the ARfD but also the frequency of samples found to exceed the threshold is of relevance.
A total of 19 national diets are included in the EFSA model used for estimating the dietary exposure of consumers (EFSA PRIMo-Pesticide Residue Intake Model) (EFSA 2007). Nine of these diets reflect food consumption habits of children, while the remaining ten concern adult dietary habits.
The short-term assessment is carried out separately for each pesticide/crop combination as it is considered unlikely that a consumer will eat two or more different commodities in large portions within a short period of time, all of these commodities containing residues of the same pesticide at the highest level. In the framework of this report the short-term exposure has been performed for the nine food commodities included in the 2008 EU coordinated programme (i.e. beans (without pods), carrots, cucumbers, mandarins, oranges, pears, potatoes, rice and spinach).
The acute consumer health risk is calculated using the following input parameters:
• The highest residues measured (HRM) identified for each pesticide/crop combination with findings above the limit of quantification reported by EEA and Member States (see section 5.1.1).
• Processing/peeling factor (see section 5.1.2)
• Large portion food consumption data retrieved from the EFSA PRIMo (EFSA, 2007)
20 At present, the choice of the variability factor to be used for the acute risk assessment at European level is still under
discussion. At international level a different factor can be applied.
2008 Annual Report on Pesticide Residues
79
EFSA Journal 2010; 8(6):1646
• Unit weight for the individual food commodities (retrieved from the EFSA PRIMo, EFSA, 2007)
• Acute Reference Dose values (see section 5.1.3)
In Figure 5.1-1, the tiered approach used in assessing the acute risk is represented.
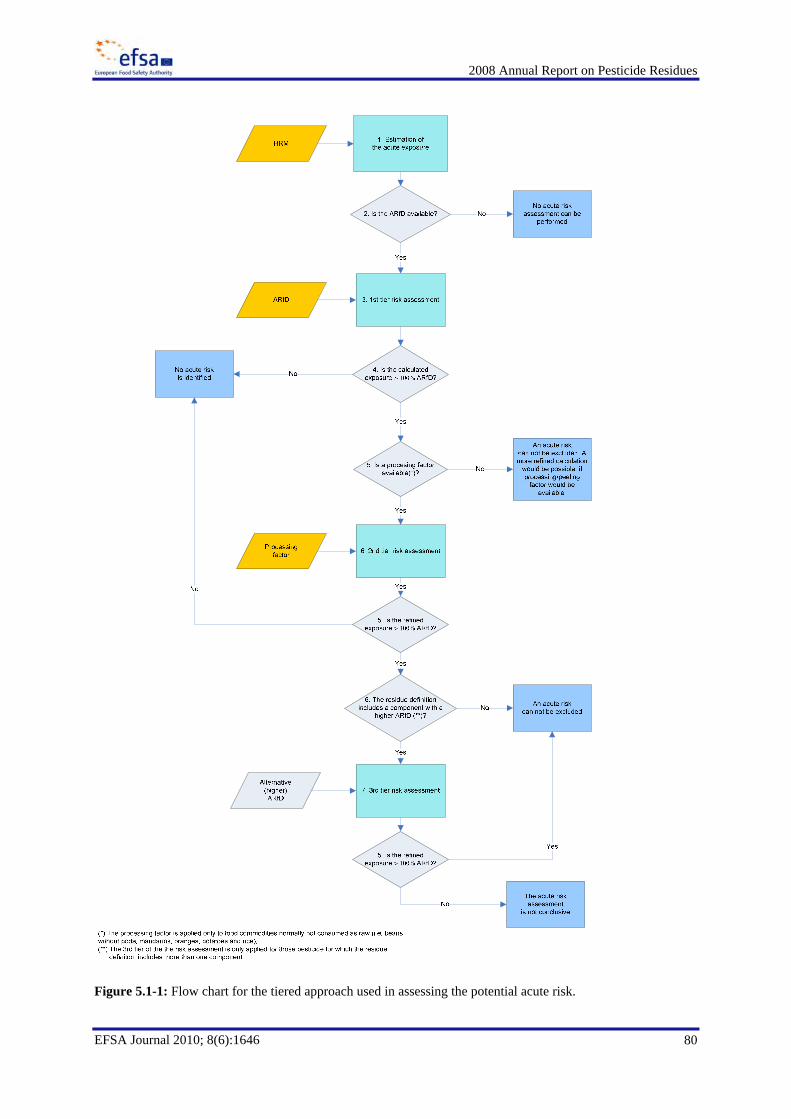
2008 Annual Report on Pesticide Residues
80
EFSA Journal 2010; 8(6):1646
Figure 5.1-1: Flow chart for the tiered approach used in assessing the potential acute risk.
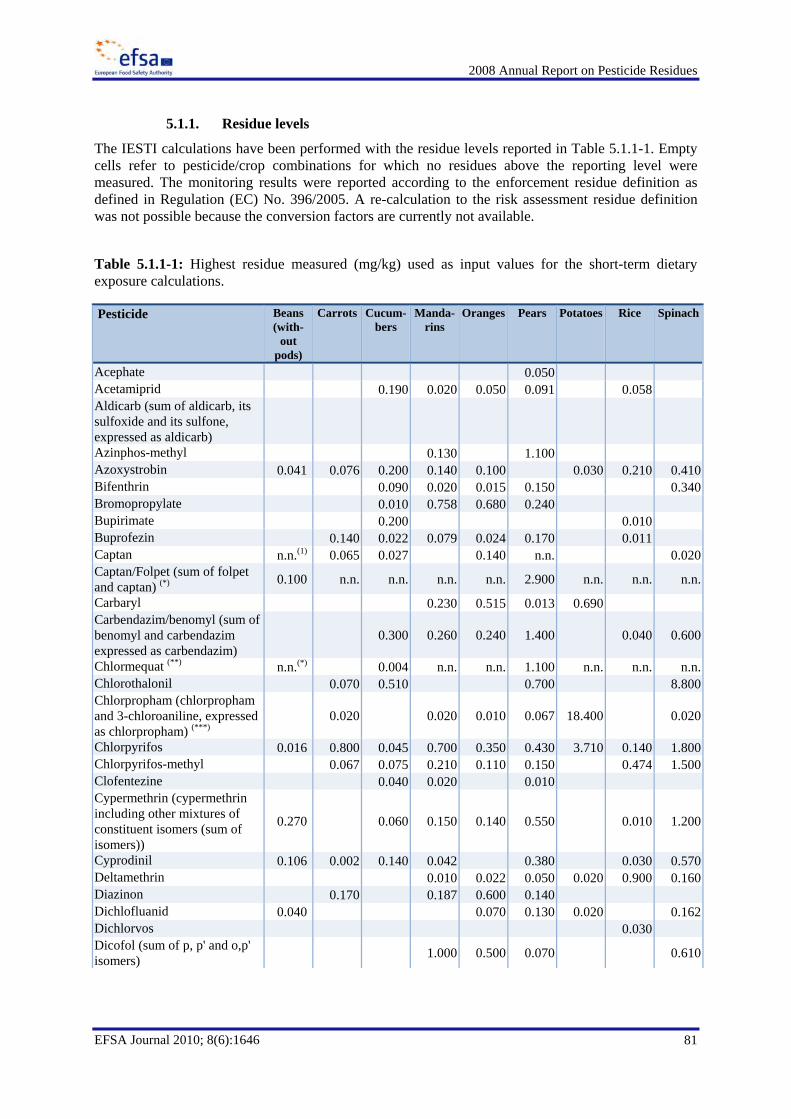
2008 Annual Report on Pesticide Residues
81
EFSA Journal 2010; 8(6):1646
5.1.1. Residue levels
The IESTI calculations have been performed with the residue levels reported in Table 5.1.1-1. Empty cells refer to pesticide/crop combinations for which no residues above the reporting level were measured. The monitoring results were reported according to the enforcement residue definition as defined in Regulation (EC) No. 396/2005. A re-calculation to the risk assessment residue definition was not possible because the conversion factors are currently not available.
Table 5.1.1-1: Highest residue measured (mg/kg) used as input values for the short-term dietary exposure calculations.
Pesticide Beans (with-
out pods)
Carrots Cucum-bers
Manda-rins
Oranges Pears Potatoes Rice Spinach
Acephate 0.050 Acetamiprid 0.190 0.020 0.050 0.091 0.058 Aldicarb (sum of aldicarb, its sulfoxide and its sulfone, expressed as aldicarb)
Azinphos-methyl 0.130 1.100 Azoxystrobin 0.041 0.076 0.200 0.140 0.100 0.030 0.210 0.410Bifenthrin 0.090 0.020 0.015 0.150 0.340Bromopropylate 0.010 0.758 0.680 0.240 Bupirimate 0.200 0.010 Buprofezin 0.140 0.022 0.079 0.024 0.170 0.011 Captan n.n.(1) 0.065 0.027 0.140 n.n. 0.020Captan/Folpet (sum of folpet and captan) (*) 0.100 n.n. n.n. n.n. n.n. 2.900 n.n. n.n. n.n.
Carbaryl 0.230 0.515 0.013 0.690 Carbendazim/benomyl (sum of benomyl and carbendazim expressed as carbendazim)
0.300 0.260 0.240 1.400 0.040 0.600
Chlormequat (**) n.n.(*) 0.004 n.n. n.n. 1.100 n.n. n.n. n.n.Chlorothalonil 0.070 0.510 0.700 8.800Chlorpropham (chlorpropham and 3-chloroaniline, expressed as chlorpropham) (***)
0.020 0.020 0.010 0.067 18.400 0.020
Chlorpyrifos 0.016 0.800 0.045 0.700 0.350 0.430 3.710 0.140 1.800Chlorpyrifos-methyl 0.067 0.075 0.210 0.110 0.150 0.474 1.500Clofentezine 0.040 0.020 0.010 Cypermethrin (cypermethrin including other mixtures of constituent isomers (sum of isomers))
0.270 0.060 0.150 0.140 0.550 0.010 1.200
Cyprodinil 0.106 0.002 0.140 0.042 0.380 0.030 0.570Deltamethrin 0.010 0.022 0.050 0.020 0.900 0.160Diazinon 0.170 0.187 0.600 0.140 Dichlofluanid 0.040 0.070 0.130 0.020 0.162Dichlorvos 0.030 Dicofol (sum of p, p' and o,p' isomers) 1.000 0.500 0.070 0.610
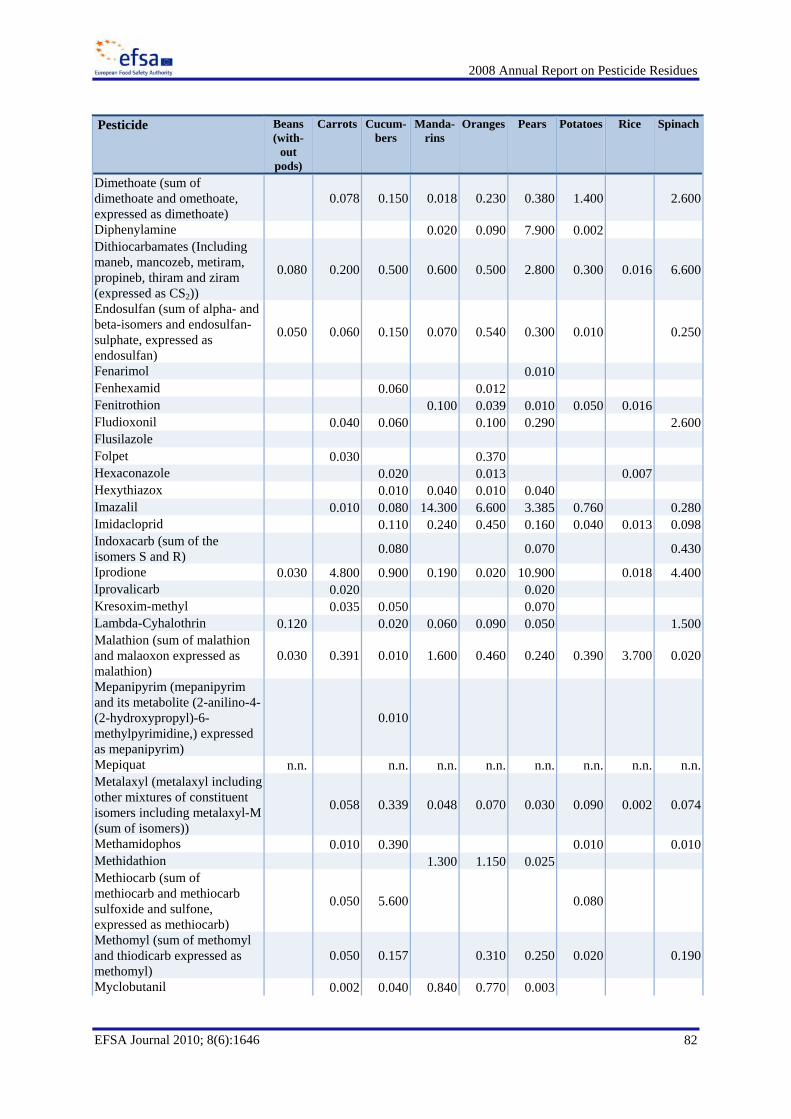
2008 Annual Report on Pesticide Residues
82
EFSA Journal 2010; 8(6):1646
Pesticide Beans (with-
out pods)
Carrots Cucum-bers
Manda-rins
Oranges Pears Potatoes Rice Spinach
Dimethoate (sum of dimethoate and omethoate, expressed as dimethoate)
0.078 0.150 0.018 0.230 0.380 1.400 2.600
Diphenylamine 0.020 0.090 7.900 0.002 Dithiocarbamates (Including maneb, mancozeb, metiram, propineb, thiram and ziram (expressed as CS2))
0.080 0.200 0.500 0.600 0.500 2.800 0.300 0.016 6.600
Endosulfan (sum of alpha- and beta-isomers and endosulfan-sulphate, expressed as endosulfan)
0.050 0.060 0.150 0.070 0.540 0.300 0.010 0.250
Fenarimol 0.010 Fenhexamid 0.060 0.012 Fenitrothion 0.100 0.039 0.010 0.050 0.016 Fludioxonil 0.040 0.060 0.100 0.290 2.600Flusilazole Folpet 0.030 0.370 Hexaconazole 0.020 0.013 0.007 Hexythiazox 0.010 0.040 0.010 0.040 Imazalil 0.010 0.080 14.300 6.600 3.385 0.760 0.280Imidacloprid 0.110 0.240 0.450 0.160 0.040 0.013 0.098Indoxacarb (sum of the isomers S and R) 0.080 0.070 0.430
Iprodione 0.030 4.800 0.900 0.190 0.020 10.900 0.018 4.400Iprovalicarb 0.020 0.020 Kresoxim-methyl 0.035 0.050 0.070 Lambda-Cyhalothrin 0.120 0.020 0.060 0.090 0.050 1.500Malathion (sum of malathion and malaoxon expressed as malathion)
0.030 0.391 0.010 1.600 0.460 0.240 0.390 3.700 0.020
Mepanipyrim (mepanipyrim and its metabolite (2-anilino-4-(2-hydroxypropyl)-6-methylpyrimidine,) expressed as mepanipyrim)
0.010
Mepiquat n.n. n.n. n.n. n.n. n.n. n.n. n.n. n.n.Metalaxyl (metalaxyl including other mixtures of constituent isomers including metalaxyl-M (sum of isomers))
0.058 0.339 0.048 0.070 0.030 0.090 0.002 0.074
Methamidophos 0.010 0.390 0.010 0.010Methidathion 1.300 1.150 0.025 Methiocarb (sum of methiocarb and methiocarb sulfoxide and sulfone, expressed as methiocarb)
0.050 5.600 0.080
Methomyl (sum of methomyl and thiodicarb expressed as methomyl)
0.050 0.157 0.310 0.250 0.020 0.190
Myclobutanil 0.002 0.040 0.840 0.770 0.003
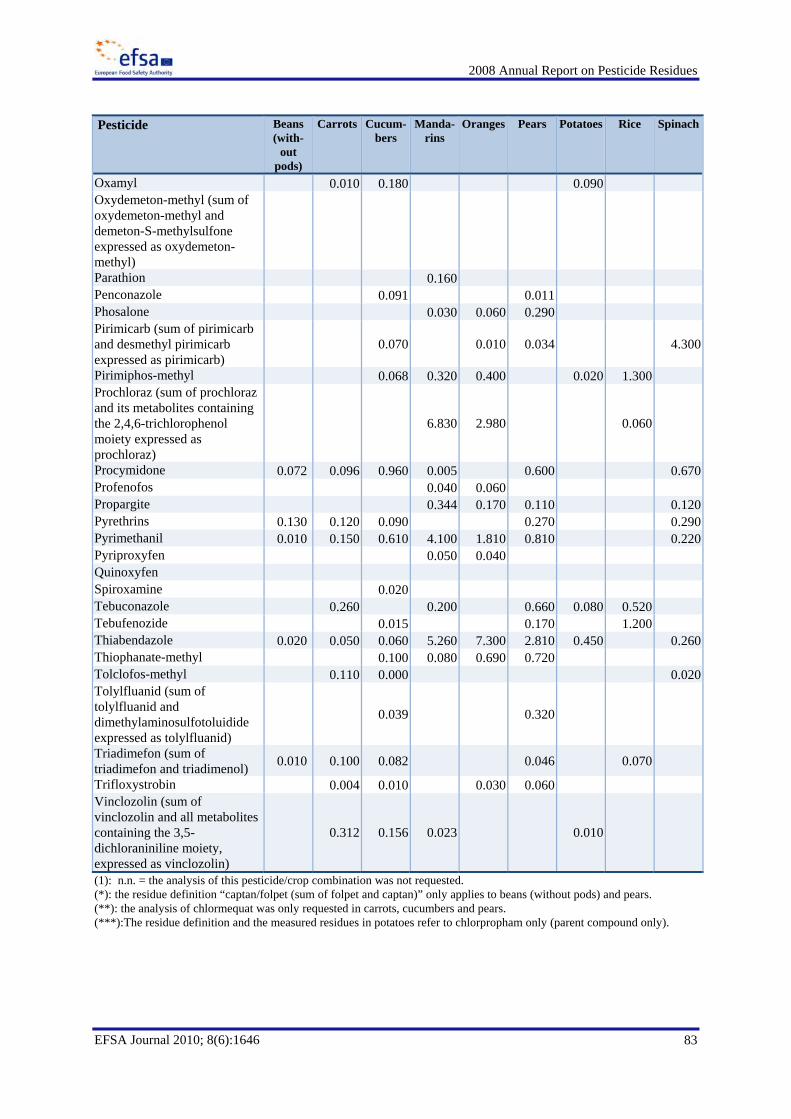
2008 Annual Report on Pesticide Residues
83
EFSA Journal 2010; 8(6):1646
Pesticide Beans (with-
out pods)
Carrots Cucum-bers
Manda-rins
Oranges Pears Potatoes Rice Spinach
Oxamyl 0.010 0.180 0.090 Oxydemeton-methyl (sum of oxydemeton-methyl and demeton-S-methylsulfone expressed as oxydemeton-methyl)
Parathion 0.160 Penconazole 0.091 0.011 Phosalone 0.030 0.060 0.290 Pirimicarb (sum of pirimicarb and desmethyl pirimicarb expressed as pirimicarb)
0.070 0.010 0.034 4.300
Pirimiphos-methyl 0.068 0.320 0.400 0.020 1.300 Prochloraz (sum of prochloraz and its metabolites containing the 2,4,6-trichlorophenol moiety expressed as prochloraz)
6.830 2.980 0.060
Procymidone 0.072 0.096 0.960 0.005 0.600 0.670Profenofos 0.040 0.060 Propargite 0.344 0.170 0.110 0.120Pyrethrins 0.130 0.120 0.090 0.270 0.290Pyrimethanil 0.010 0.150 0.610 4.100 1.810 0.810 0.220Pyriproxyfen 0.050 0.040 Quinoxyfen Spiroxamine 0.020 Tebuconazole 0.260 0.200 0.660 0.080 0.520 Tebufenozide 0.015 0.170 1.200 Thiabendazole 0.020 0.050 0.060 5.260 7.300 2.810 0.450 0.260Thiophanate-methyl 0.100 0.080 0.690 0.720 Tolclofos-methyl 0.110 0.000 0.020Tolylfluanid (sum of tolylfluanid and dimethylaminosulfotoluidide expressed as tolylfluanid)
0.039 0.320
Triadimefon (sum of triadimefon and triadimenol) 0.010 0.100 0.082 0.046 0.070
Trifloxystrobin 0.004 0.010 0.030 0.060 Vinclozolin (sum of vinclozolin and all metabolites containing the 3,5-dichloraniniline moiety, expressed as vinclozolin)
0.312 0.156 0.023 0.010
(1): n.n. = the analysis of this pesticide/crop combination was not requested. (*): the residue definition “captan/folpet (sum of folpet and captan)” only applies to beans (without pods) and pears. (**): the analysis of chlormequat was only requested in carrots, cucumbers and pears. (***):The residue definition and the measured residues in potatoes refer to chlorpropham only (parent compound only).

2008 Annual Report on Pesticide Residues
84
EFSA Journal 2010; 8(6):1646
5.1.2. Processing/peeling factors
Five crops included in the 2008 coordinated monitoring programme (beans (without pods), mandarins, oranges, potatoes and rice) are usually only consumed in processed form or after peeling. A possible reduction or concentration of the residues as a result of peeling and processing should be taken into account in a refined exposure assessment. However, processing/peeling factors are not always available.
The factors summarised in Table 5.1.2-1 have been selected from the database21 developed by the Federal Institute for Risk Assessment (BfR), which includes a collection of processing factors from annually published reports and evaluations by the FAO/WHO Joint Meeting on Pesticide Residues (JMPR), from draft assessment reports (DAR) prepared in the European Pesticide Risk Assessment Peer Review programme (PRAPeR) and from residue data which have been submitted within the framework of national authorisation procedures. Additional data concerning pulp/peel distribution have been provided for BfR by retailers and have been collected within the framework of national food monitoring programmes. If peeling factors were available for oranges they have also been applied for mandarins, since a similar distribution of residues between pulp and peel can be assumed.
In the event that the IESTI calculation in tier 1 exceeded 100% of the ARfD and processing or peeling factors were available, EFSA performed a refined risk assessment (2nd tier).
Table 5.1.2-1: Processing and peeling factors applied in the refined IESTI calculations.
Pesticide Crop PF Processed/peeled crop Bromopropylate Oranges 0.02 Orange pulp Bromopropylate Mandarins 0.02 Orange pulp Carbaryl Oranges 0.47 Orange pulp Carbaryl Mandarins 0.47 Orange pulp Carbendazim/benomyl Oranges 0.20 Orange pulp Chlorpropham Potatoes 0.33 Cooked potatoes Deltamethrin Rice 0.15 Rice grain to brown rice Dimethoate Oranges 0.14 Orange pulp Dithiocarbamates Oranges 0.88 Orange pulp Imazalil Oranges 0.05 Orange pulp Imazalil Mandarins 0.05 Clementine pulp Methidathion Oranges 0.03 Orange pulp Methidathion Mandarins 0.03 Orange pulp Prochloraz Oranges 0.01 Orange pulp Prochloraz Mandarins 0.11 Clementine pulp
5.1.3. Acute Reference Dose values (ARfDs)
In order to perform the risk assessment, the calculated exposure for a certain pesticide/crop combination was compared with the ARfD value. In Table 5.1.3-1 the ARfD values used for the acute risk assessment are listed. It should be mentioned that some of the ARfD values were derived recently and were not in place in 2008 when the monitoring results were generated.
21 The database is available at http://www.bfr.bund.de/cd/579 (BfR compilation of 2009-07-01).
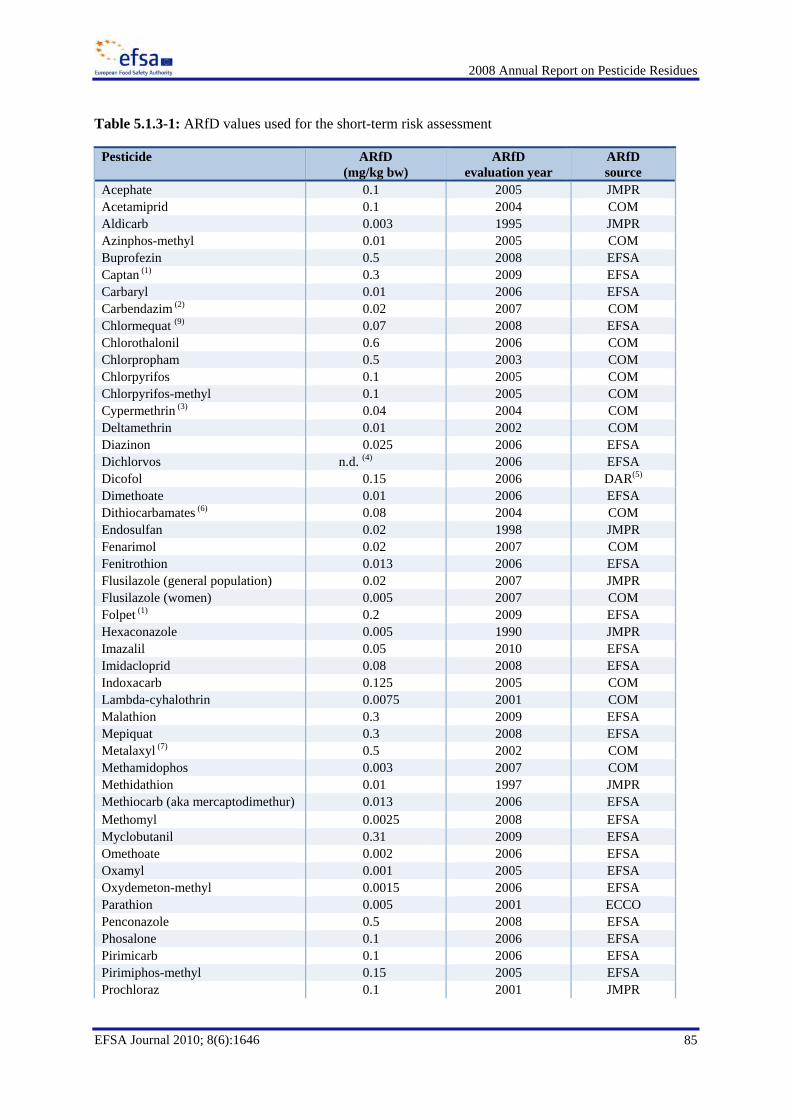
2008 Annual Report on Pesticide Residues
85
EFSA Journal 2010; 8(6):1646
Table 5.1.3-1: ARfD values used for the short-term risk assessment
Pesticide ARfD (mg/kg bw)
ARfD evaluation year
ARfD source
Acephate 0.1 2005 JMPR Acetamiprid 0.1 2004 COM Aldicarb 0.003 1995 JMPR Azinphos-methyl 0.01 2005 COM Buprofezin 0.5 2008 EFSA Captan (1) 0.3 2009 EFSA Carbaryl 0.01 2006 EFSA Carbendazim (2) 0.02 2007 COM Chlormequat (9) 0.07 2008 EFSA Chlorothalonil 0.6 2006 COM Chlorpropham 0.5 2003 COM Chlorpyrifos 0.1 2005 COM Chlorpyrifos-methyl 0.1 2005 COM Cypermethrin (3) 0.04 2004 COM Deltamethrin 0.01 2002 COM Diazinon 0.025 2006 EFSA Dichlorvos n.d. (4) 2006 EFSA Dicofol 0.15 2006 DAR(5) Dimethoate 0.01 2006 EFSA Dithiocarbamates (6) 0.08 2004 COM Endosulfan 0.02 1998 JMPR Fenarimol 0.02 2007 COM Fenitrothion 0.013 2006 EFSA Flusilazole (general population) 0.02 2007 JMPR Flusilazole (women) 0.005 2007 COM Folpet (1) 0.2 2009 EFSA Hexaconazole 0.005 1990 JMPR Imazalil 0.05 2010 EFSA Imidacloprid 0.08 2008 EFSA Indoxacarb 0.125 2005 COM Lambda-cyhalothrin 0.0075 2001 COM Malathion 0.3 2009 EFSA Mepiquat 0.3 2008 EFSA Metalaxyl (7) 0.5 2002 COM Methamidophos 0.003 2007 COM Methidathion 0.01 1997 JMPR Methiocarb (aka mercaptodimethur) 0.013 2006 EFSA Methomyl 0.0025 2008 EFSA Myclobutanil 0.31 2009 EFSA Omethoate 0.002 2006 EFSA Oxamyl 0.001 2005 EFSA Oxydemeton-methyl 0.0015 2006 EFSA Parathion 0.005 2001 ECCO Penconazole 0.5 2008 EFSA Phosalone 0.1 2006 EFSA Pirimicarb 0.1 2006 EFSA Pirimiphos-methyl 0.15 2005 EFSA Prochloraz 0.1 2001 JMPR
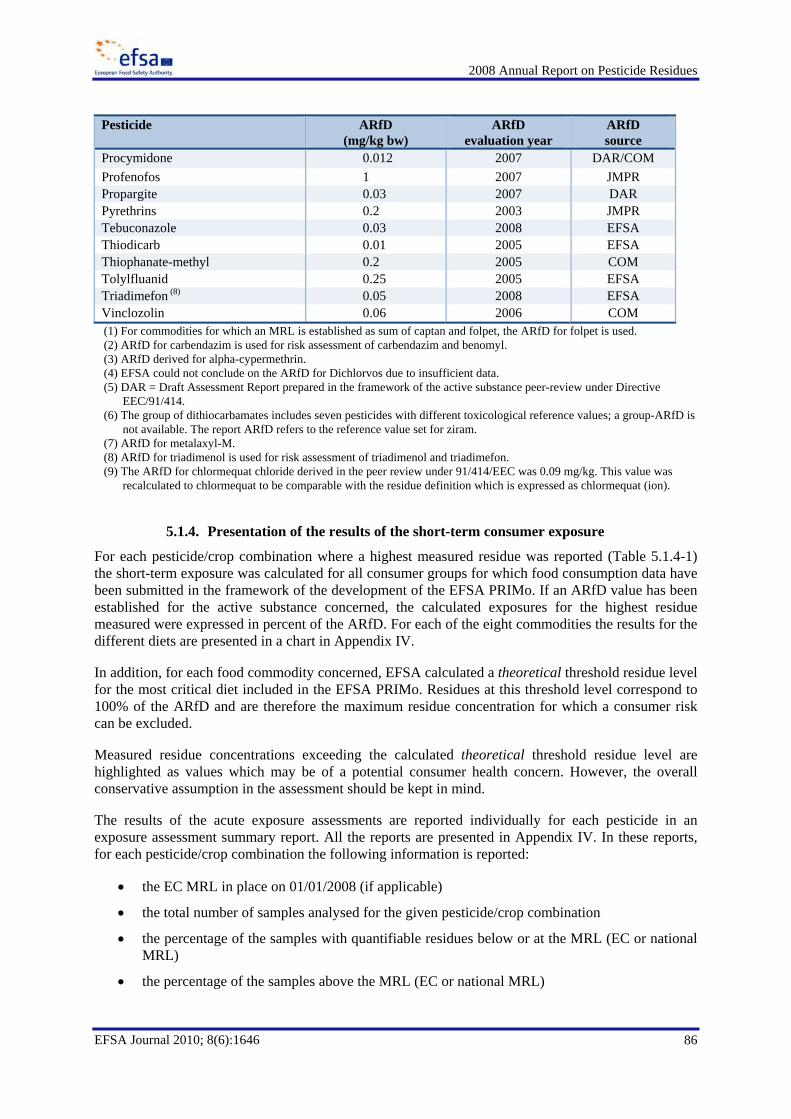
2008 Annual Report on Pesticide Residues
86
EFSA Journal 2010; 8(6):1646
Pesticide ARfD (mg/kg bw)
ARfD evaluation year
ARfD source
Procymidone 0.012 2007 DAR/COM Profenofos 1 2007 JMPR Propargite 0.03 2007 DAR Pyrethrins 0.2 2003 JMPR Tebuconazole 0.03 2008 EFSA Thiodicarb 0.01 2005 EFSA Thiophanate-methyl 0.2 2005 COM Tolylfluanid 0.25 2005 EFSA Triadimefon (8) 0.05 2008 EFSA Vinclozolin 0.06 2006 COM (1) For commodities for which an MRL is established as sum of captan and folpet, the ARfD for folpet is used. (2) ARfD for carbendazim is used for risk assessment of carbendazim and benomyl. (3) ARfD derived for alpha-cypermethrin. (4) EFSA could not conclude on the ARfD for Dichlorvos due to insufficient data. (5) DAR = Draft Assessment Report prepared in the framework of the active substance peer-review under Directive
EEC/91/414. (6) The group of dithiocarbamates includes seven pesticides with different toxicological reference values; a group-ARfD is
not available. The report ARfD refers to the reference value set for ziram. (7) ARfD for metalaxyl-M. (8) ARfD for triadimenol is used for risk assessment of triadimenol and triadimefon. (9) The ARfD for chlormequat chloride derived in the peer review under 91/414/EEC was 0.09 mg/kg. This value was
recalculated to chlormequat to be comparable with the residue definition which is expressed as chlormequat (ion).
5.1.4. Presentation of the results of the short-term consumer exposure
For each pesticide/crop combination where a highest measured residue was reported (Table 5.1.4-1) the short-term exposure was calculated for all consumer groups for which food consumption data have been submitted in the framework of the development of the EFSA PRIMo. If an ARfD value has been established for the active substance concerned, the calculated exposures for the highest residue measured were expressed in percent of the ARfD. For each of the eight commodities the results for the different diets are presented in a chart in Appendix IV.
In addition, for each food commodity concerned, EFSA calculated a theoretical threshold residue level for the most critical diet included in the EFSA PRIMo. Residues at this threshold level correspond to 100% of the ARfD and are therefore the maximum residue concentration for which a consumer risk can be excluded.
Measured residue concentrations exceeding the calculated theoretical threshold residue level are highlighted as values which may be of a potential consumer health concern. However, the overall conservative assumption in the assessment should be kept in mind.
The results of the acute exposure assessments are reported individually for each pesticide in an exposure assessment summary report. All the reports are presented in Appendix IV. In these reports, for each pesticide/crop combination the following information is reported:
• the EC MRL in place on 01/01/2008 (if applicable)
• the total number of samples analysed for the given pesticide/crop combination
• the percentage of the samples with quantifiable residues below or at the MRL (EC or national MRL)
• the percentage of the samples above the MRL (EC or national MRL)
2008 Annual Report on Pesticide Residues
87
EFSA Journal 2010; 8(6):1646
• the identified Highest Residue Measured (HRM)
• the number of the national diets in which the theoretical threshold residue was exceeded
• the maximum acute exposure for the most critical diet represented in the EFSA PRIMo, expressed in percent of the ARfD
• the most critical diet for which the highest consumer exposure was calculated
The percentage of samples with a residue level exceeding the lowest calculated threshold residue is taken as an indicator of the frequency of a potential critical consumer exposure for each pesticide/crop combination. If the exceedance of the threshold occurred in less than 0.1% of the samples which were analysed for the pesticide, the event was considered to be exceptional, a frequency of 0.1 to 1% was considered to be a seldom event, and a frequency above 1% was classified as non-seldom.
The format used for reporting the 2008 monitoring results of the residue analysis required that reporting countries submitted the data in an aggregated form; only the number of samples with residue levels falling in one of 13 predefined residue classes was reported (e.g. samples with residues between 0.02 and 0.05 mg/kg, samples with residues between 0.05 and 0.10 mg/kg, etc.); the individual measured residue concentrations for the samples were not reported. Therefore, when the number of samples exceeding the threshold residue had to be counted it was considered the upper or lower bound of the predefined residue classes which was closer to the theoretical threshold residue.
5.1.5. Limitation and uncertainties affecting the short-term exposure assessment
The routine risk assessment methodology, based on the IESTI calculations, contains several sources of uncertainty. Due to the complexity of combining all the relevant uncertainty sources, a quantification of the uncertainty inherent in the risk assessment methodology cannot be achieved.
The most important sources of uncertainty are the following:
• Inaccuracies related to the consumption data - high consumption at the 97.5th percentile of the consumption distribution;
• Inaccuracies related to the consumption data - in some cases the 97.5th consumption values represent aggregates of consumption of all forms of the raw agricultural commodities, therefore appropriate processing factors cannot be applied to the different forms (e.g. orange consumption may represent orange flesh and orange juice);
• Inaccuracies related to the highest pesticide residue levels (HRM) used in the short-term risk assessment;
• Inaccuracies related to the applied variability factors.
A qualitative estimation of uncertainties and a description of the constraints of the model used for assessing potential acute consumer risks is reported elsewhere (EFSA 2009).
Not all food lots which were identified by the competent authorities exceeding the MRL legislation have been available to the European consumers. Some of these lots may have been withdrawn by the national authorities from the market before being consumed or may have been rejected at the border before import to the EU. However, since these cases were specifically labelled in the national reports, they were also used to calculate the consumer exposure.
Overall, it is concluded that the methodology applied to assess the short-term risk over-estimates the actual dietary exposure and the potential consumer risk. In future, if the results of the coordinated monitoring programmes are to be provided in a non-aggregate form, EFSA will be able to perform
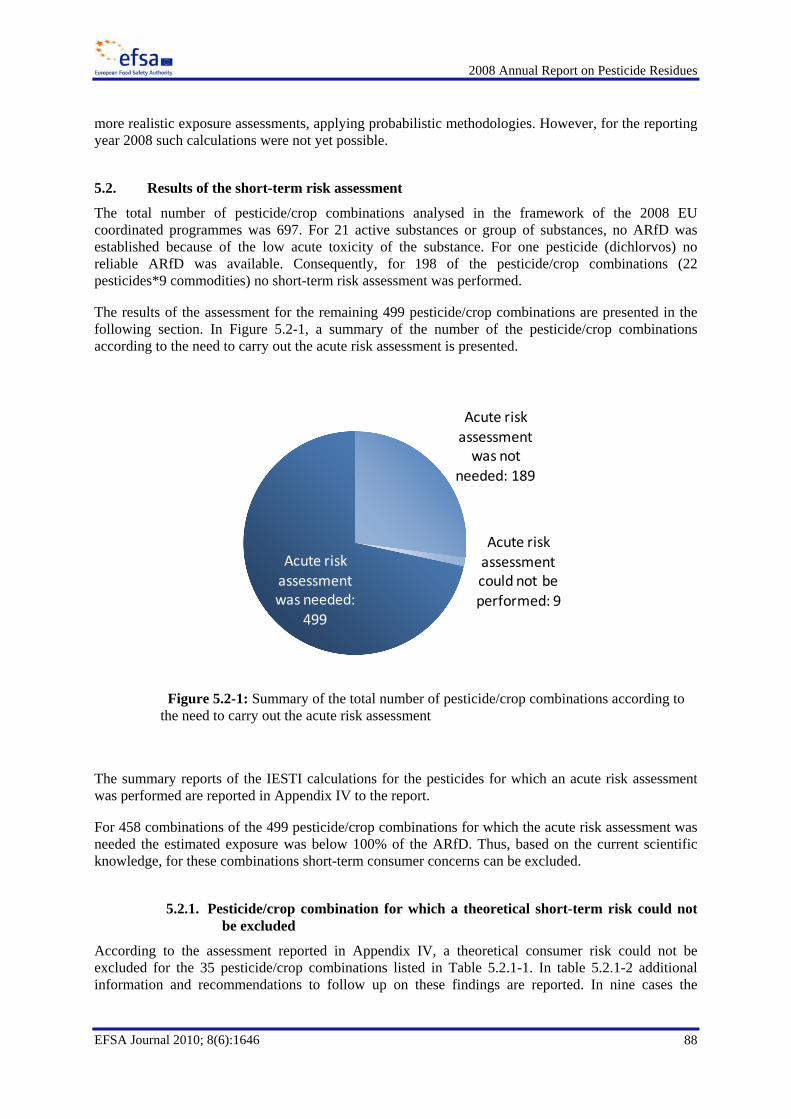
2008 Annual Report on Pesticide Residues
88
EFSA Journal 2010; 8(6):1646
more realistic exposure assessments, applying probabilistic methodologies. However, for the reporting year 2008 such calculations were not yet possible.
5.2. Results of the short-term risk assessment
The total number of pesticide/crop combinations analysed in the framework of the 2008 EU coordinated programmes was 697. For 21 active substances or group of substances, no ARfD was established because of the low acute toxicity of the substance. For one pesticide (dichlorvos) no reliable ARfD was available. Consequently, for 198 of the pesticide/crop combinations (22 pesticides*9 commodities) no short-term risk assessment was performed.
The results of the assessment for the remaining 499 pesticide/crop combinations are presented in the following section. In Figure 5.2-1, a summary of the number of the pesticide/crop combinations according to the need to carry out the acute risk assessment is presented.
Figure 5.2-1: Summary of the total number of pesticide/crop combinations according to the need to carry out the acute risk assessment
The summary reports of the IESTI calculations for the pesticides for which an acute risk assessment was performed are reported in Appendix IV to the report.
For 458 combinations of the 499 pesticide/crop combinations for which the acute risk assessment was needed the estimated exposure was below 100% of the ARfD. Thus, based on the current scientific knowledge, for these combinations short-term consumer concerns can be excluded.
5.2.1. Pesticide/crop combination for which a theoretical short-term risk could not be excluded
According to the assessment reported in Appendix IV, a theoretical consumer risk could not be excluded for the 35 pesticide/crop combinations listed in Table 5.2.1-1. In table 5.2.1-2 additional information and recommendations to follow up on these findings are reported. In nine cases the
Acute risk assessment was not
needed: 189
Acute risk assessment could not be performed: 9
Acute risk assessment was needed:
499
2008 Annual Report on Pesticide Residues
89
EFSA Journal 2010; 8(6):1646
estimated exposure was less than 150% of the ARfD. Bearing in mind the overall uncertainties and overall conservatism of the calculation, these events are considered as non significant exceedances.
For 33 out of the 35 pesticide/crop combinations for which a theoretical consumer risk could not be excluded, the potential risk identified was considered to be an exceptional or seldom event; for two single combinations (azinphos-methyl/pears and omethoate-dimethoate/oranges) the threshold level was exceeded in more than 1% of the samples analysed for this pesticide/commodity combination and the event was therefore classified as non seldom. Details on these findings are reported in the following paragraphs.
It is noted that in all cases the most critical sub group of the population were children.
2008 Annual Report on Pesticide Residues
90
EFSA Journal 2010; 8(6):1646
Table 5.2.1-1: Summary results of the short-term risk assessment of the active substances for which an acute risk could not be excluded.
Pesticide Crop 2008 MR
L
(whole crop) (1)
mg/kg
Total num
ber of sam
ples analysed
% sam
ples exceeding the M
RL
(*)
Highest residue
measured
(HR
M) m
g/kg
Highest residue
measured corrected
with PF (H
RM
c) m
g/kg
Max IESTI
(% ARfD)
Most critical diet
Thres-hold
residue in edible
portion (2)(mg/kg)
Number of
samples above the threshold residue
% samples above the threshold residue
Exceedence of ARfD is
considered "Exceptional".
"seldom" or "not seldom" event?
(3)
Azinphos-methyl Pears 0.5 1441 0.21 1.1 1001.8 DE child 0.110 38 2.64 non seldom Carbaryl Oranges 0.05* 1161 0.17 0.51 0.242 320.9 UK infant 0.075 2 0.17 seldom Carbaryl Potatoes 0.05* 1671 0.12 0.69 1060.9 UK infant 0.065 2 0.12 seldom Carbendazim/Benomyl Pears 0.2 1054 0.28 1.4 637.5 DE child 0.220 3 0.28 seldom Chlormequat Pears 0.2 455 0.88 1.1 143.1 DE child 0.770 1 0.22 seldom Chlorpropham Potatoes 10 1611 0.06 18.39 6.07 186.7 UK infant 3.251 6 0.37 seldom Chlorpyrifos Potatoes 0.05* 1830 0.27 3.71 570.4 UK infant 0.650 1 0.05 exceptional Diazinon Oranges 0.01* 1478 0.88 0.6 318.3 UK infant 0.189 2 0.14 seldom Dimethoate/omethoate Oranges 0.02* 1355 0.96 0.23 1525.1 UK infant 0.015 16 1.18 non seldom Dimethoate/omethoate Pears 0.02* 1421 0.21 0.38 1730.4 DE child 0.022 3 0.21 seldom Dimethoate/omethoate Potatoes 0.02* 1758 0.06 1.4 10763.1 UK infant 0.013 1 0.06 exceptional Dimethoate/omethoate Carrots 0.02* 1318 0.15 0.078 247.3 UK infant 0.032 2 0.15 seldom Dimethoate/omethoate Cucumbers 0.02* 1122 0.18 0.15 438.6 NL child 0.034 2 0.18 seldom Dimethoate/omethoate Spinach 0.02* 897 0.33 2.6 2938.2 BE child 0.088 3 0.33 seldom Endosulfan Oranges 0.05* 1323 0.08 0.54 358.1 UK infant 0.151 1 0.08 exceptional Endosulfan Pears 0.3 1441 0.00 0.3 136.6 DE child 0.220 1 0.07 exceptional Imazalil Pears 5 1414 0.00 3.385 145.3 NL (GP) 2.329 3 0.21 seldom Imazalil Potatoes 5 1500 0.00 0.76 116.9 UK infant 0.650 1 0.07 exceptional lambda-Cyhalothrin Oranges 0.1 1212 0.00 0.09 159.1 UK infant 0.057 2 0.17 seldom
2008 Annual Report on Pesticide Residues
91
EFSA Journal 2010; 8(6):1646
Pesticide Crop 2008 MR
L
(whole crop) (1)
mg/kg
Total num
ber of sam
ples analysed
% sam
ples exceeding the M
RL
(*)
Highest residue
measured
(HR
M) m
g/kg
Highest residue
measured corrected
with PF (H
RM
c) m
g/kg
Max IESTI
(% ARfD)
Most critical diet
Thres-hold
residue in edible
portion (2)(mg/kg)
Number of
samples above the threshold residue
% samples above the threshold residue
Exceedence of ARfD is
considered "Exceptional".
"seldom" or "not seldom" event?
(3)
lambda-Cyhalothrin Spinach 0.5 849 0.12 1.5 452.0 BE child 0.332 5 0.59 seldom Methamidophos Cucumbers 0.01* 1001 0.20 0.39 760.2 NL child 0.051 2 0.20 seldom Methiocarb (aka mercaptodimethur) Cucumbers 0.2 761 0.26 5.6 2519.1 NL child 0.222 2 0.26 seldom
Methomyl/thiodicarb Oranges 0.5 813 0.00 0.31 1644.5 UK infant 0.019 1 0.12 seldom Methomyl/thiodicarb Pears 0.2 1058 0.09 0.25 910.7 DE child 0.027 7 0.66 seldom Methomyl/thiodicarb Potatoes 0.05* 1193 0.00 0.02 123.0 UK infant 0.016 1 0.08 exceptional Methomyl/thiodicarb Carrots 0.05* 855 0.00 0.05 126.8 UK infant 0.039 1 0.12 seldom Methomyl/thiodicarb Cucumbers 0.05* 806 0.62 0.157 367.3 NL child 0.043 5 0.62 seldom Methomyl/thiodicarb Spinach 0.05 646 1.08 0.19 171.8 BE child 0.111 2 0.31 seldom Oxamyl Potatoes 0.01* 1057 0.19 0.09 1383.8 UK infant 0.007 2 0.19 seldom Oxamyl Cucumbers 0.02 693 0.29 0.18 1052.6 NL child 0.017 2 0.29 seldom Parathion Mandarins 0.05* 914 0.11 0.16 178.1 UK toddler 0.090 1 0.11 seldom Procymidone Pears 1 1538 0.00 0.6 455.4 DE child 0.132 4 0.26 seldom Procymidone Cucumbers 1 1223 0.00 0.96 467.8 NL child 0.205 6 0.49 seldom Procymidone Spinach 0.05* 910 0.11 0.67 126.2 BE child 0.531 1 0.11 seldom Tebuconazole Pears 1 1286 0.00 0.66 200.4 DE child 0.329 2 0.16 seldom
(1) EC MRL in place 01/01/2008; when the MRL figure is followed by an asterisk (*) the MRL is set at the LOQ. (2) The threshold residue is the theoretical calculated residue level that represents the 100% of the ARfD exhaustion. This value is calculated singularly for each pesticide/crop combination and
for each diet. (3) See section 5.1.3 for more details on the event classification.
2008 Annual Report on Pesticide Residues
92
EFSA Journal 2010; 8(6):1646
Table 5.2.1-2: Details on the MRL exceedances and sample origin for the samples for which a short-term risk could not be excluded.
Pesticide Crop No sam
ples above the threshold residue
Num
ber samples >
2008 EC
MR
L
Origin of samples > 2008 EC
MRL (1)
Pesticide authorisation
status in EU (any crop) in 2008
(y/n)
2008 EC MRL (whole crop) mg/kg
2010 EC MRL (whole crop) mg/kg
PF missing?
(y/n)
ThresholdEC MRL
(whole crop) mg/kg
2010 EC
MRL >thres-hold
MRL?(y/n)
EFSA Recom-
mendations
Azinphos-methyl Pears 38 3 2 IT, 1 ZA n 0.50 0.05* n.a. 0.110 n (2) + (3) Carbaryl Oranges 2 2 1 IT, 1US n 0.05* 0.05* n 0.160 n (2) + (3) Carbaryl Potatoes 2 2 2 MT n 0.05* 0.05* y (2) + (3) Carbendazim/ Benomyl Pears 3 3 1 CY, 2 ES n 0.20 0.20 n.a. 0.220 n (3)
Chlormequat Pears 1 4 1BE, 1 NL, 2 SI n 0.20 0.10 n.a. 0.770 n (4)
Chlorpropham Potatoes 6 1 1 FR y 10.00 10.00 n 9.851 y (4) Chlorpyrifos Potatoes 1 5 1 ES, 4 MT y 0.05* 0.05* y (3) + (5) Diazinon Oranges 2 13 12 EG, 1 ES n 0.01* 0.01* y (2) + (3)
Dimethoate/omethoate Oranges 16 133 BR, 1 CY, 4 EG, 1 ES, 2
IT, 2 PT
n (omethoate) y (dimethoate) 0.02* 0.02* y (6)
Dimethoate/omethoate Pears 3 3 1 GR, 2 PT n (omethoate) y (dimethoate) 0.02* 0.02* n.a. 0.022 n (3) + (6)
Dimethoate/omethoate Potatoes 1 1 1 MT n (omethoate) y (dimethoate) 0.02* 0.02* y (3) + (6)
Dimethoate/omethoate Carrots 2 2 2 BE n (omethoate) y (dimethoate) 0.02* 0.02* n.a. 0.032 n (6)
Dimethoate/omethoate Cucumbers 2 2 1 RO, 1 TH n (omethoate)
y (dimethoate) 0.02* 0.02* n.a. 0.034 n (6)
Dimethoate/omethoate Spinach 3 3 2 IT, 1 CY n (omethoate) y (dimethoate) 0.02* 0.02* n.a. 0.088 n (3) + (6)
Endosulfan Oranges 1 1 1 PT n 0.05* 0.05* y (3)
2008 Annual Report on Pesticide Residues
93
EFSA Journal 2010; 8(6):1646
Pesticide Crop No sam
ples above the threshold residue
Num
ber samples >
2008 EC
MR
L
Origin of samples > 2008 EC
MRL (1)
Pesticide authorisation
status in EU (any crop) in 2008
(y/n)
2008 EC MRL (whole crop) mg/kg
2010 EC MRL (whole crop) mg/kg
PF missing?
(y/n)
ThresholdEC MRL
(whole crop) mg/kg
2010 EC
MRL >thres-hold
MRL?(y/n)
EFSA Recom-
mendations
Endosulfan Pears 1 0 y (until 20/06/2007 in Greece) 0.30 0.05*(a) n.a. 0.220 y (4)
Imazalil Pears 3 0 y 5.00 2.00 n.a. 2.329 n (8) Imazalil Potatoes 1 0 y 5.00 3.00 y (7) + (9) lambda-Cyhalothrin Oranges 2 0 y 0.10 0.10 y (9) lambda-Cyhalothrin Spinach 5 1 1 FR y 0.50 0.50 n.a. 0.332 y (7)
Methamidophos Cucumbers 2 2 1 GR, 1SR y (until 01/07/2008) 0.01* 0.01* n.a. 0.051 n (2) + (3)
Methiocarb Cucumbers 2 2 2 DO y 0.20 0.20 n.a. 0.222 n (2)
Methomyl/thiodicarb Oranges 1 0 y (methomyl)
n (thiodicarb from 25/11/2008)
0.50 0.02 y (8) + (10)
Methomyl/thiodicarb Pears 7 1 1 IT y (methomyl)
n (thiodicarb from 25/11/2008)
0.20 0.20 n.a. 0.027 y (3) + (7) + (10)
Methomyl/thiodicarb Potatoes 1 0 y (methomyl)
n (thiodicarb from 25/11/2008)
0.05* 0.05* y (11)
Methomyl/thiodicarb Carrots 1 0 y (methomyl)
n (thiodicarb from 25/11/2008)
0.05* 0.05* n.a. 0.039 y (10)
Methomyl/thiodicarb Cucumbers 5 5 2 IT, 3 NL
y (methomyl) n (thiodicarb from
25/11/2008) 0.05* 0.05* n.a. 0.043 y (10)
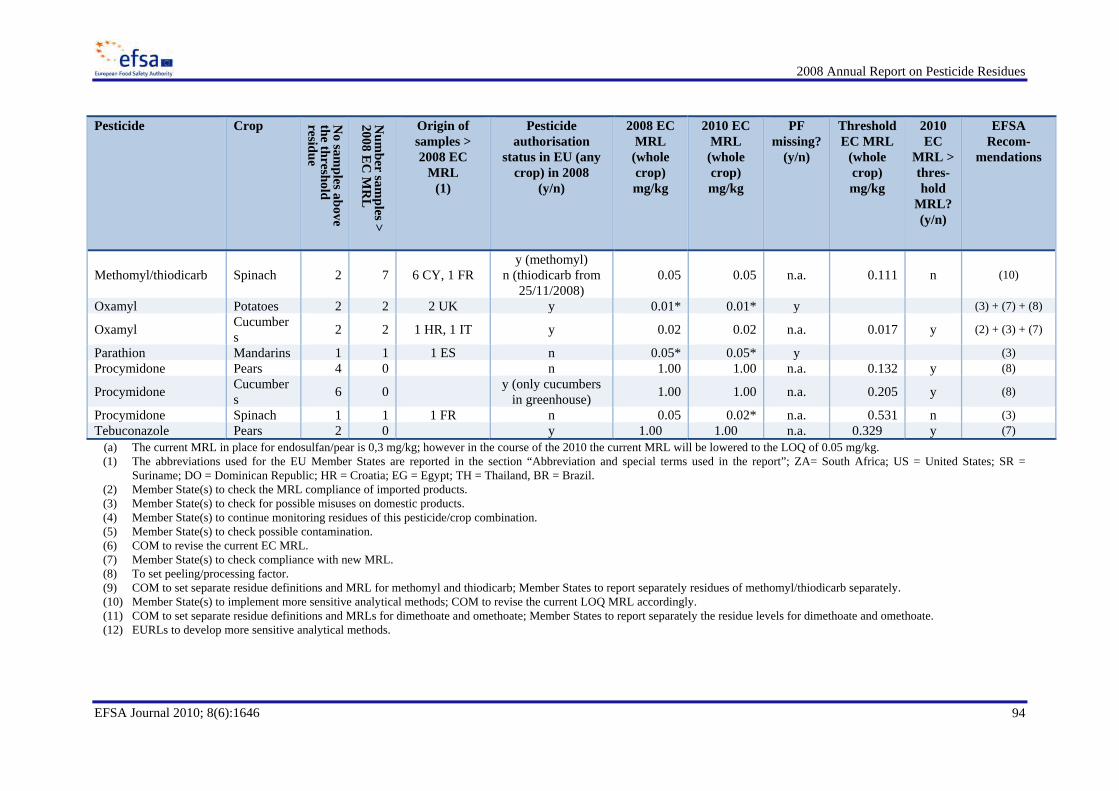
2008 Annual Report on Pesticide Residues
94
EFSA Journal 2010; 8(6):1646
Pesticide Crop No sam
ples above the threshold residue
Num
ber samples >
2008 EC
MR
L
Origin of samples > 2008 EC
MRL (1)
Pesticide authorisation
status in EU (any crop) in 2008
(y/n)
2008 EC MRL (whole crop) mg/kg
2010 EC MRL (whole crop) mg/kg
PF missing?
(y/n)
ThresholdEC MRL
(whole crop) mg/kg
2010 EC
MRL >thres-hold
MRL?(y/n)
EFSA Recom-
mendations
Methomyl/thiodicarb Spinach 2 7 6 CY, 1 FR y (methomyl)
n (thiodicarb from 25/11/2008)
0.05 0.05 n.a. 0.111 n (10)
Oxamyl Potatoes 2 2 2 UK y 0.01* 0.01* y (3) + (7) + (8)
Oxamyl Cucumbers 2 2 1 HR, 1 IT y 0.02 0.02 n.a. 0.017 y (2) + (3) + (7)
Parathion Mandarins 1 1 1 ES n 0.05* 0.05* y (3) Procymidone Pears 4 0 n 1.00 1.00 n.a. 0.132 y (8)
Procymidone Cucumbers 6 0 y (only cucumbers
in greenhouse) 1.00 1.00 n.a. 0.205 y (8)
Procymidone Spinach 1 1 1 FR n 0.05 0.02* n.a. 0.531 n (3) Tebuconazole Pears 2 0 y 1.00 1.00 n.a. 0.329 y (7)
(a) The current MRL in place for endosulfan/pear is 0,3 mg/kg; however in the course of the 2010 the current MRL will be lowered to the LOQ of 0.05 mg/kg. (1) The abbreviations used for the EU Member States are reported in the section “Abbreviation and special terms used in the report”; ZA= South Africa; US = United States; SR =
Suriname; DO = Dominican Republic; HR = Croatia; EG = Egypt; TH = Thailand, BR = Brazil. (2) Member State(s) to check the MRL compliance of imported products. (3) Member State(s) to check for possible misuses on domestic products. (4) Member State(s) to continue monitoring residues of this pesticide/crop combination. (5) Member State(s) to check possible contamination. (6) COM to revise the current EC MRL. (7) Member State(s) to check compliance with new MRL. (8) To set peeling/processing factor. (9) COM to set separate residue definitions and MRL for methomyl and thiodicarb; Member States to report separately residues of methomyl/thiodicarb separately. (10) Member State(s) to implement more sensitive analytical methods; COM to revise the current LOQ MRL accordingly. (11) COM to set separate residue definitions and MRLs for dimethoate and omethoate; Member States to report separately the residue levels for dimethoate and omethoate. (12) EURLs to develop more sensitive analytical methods.
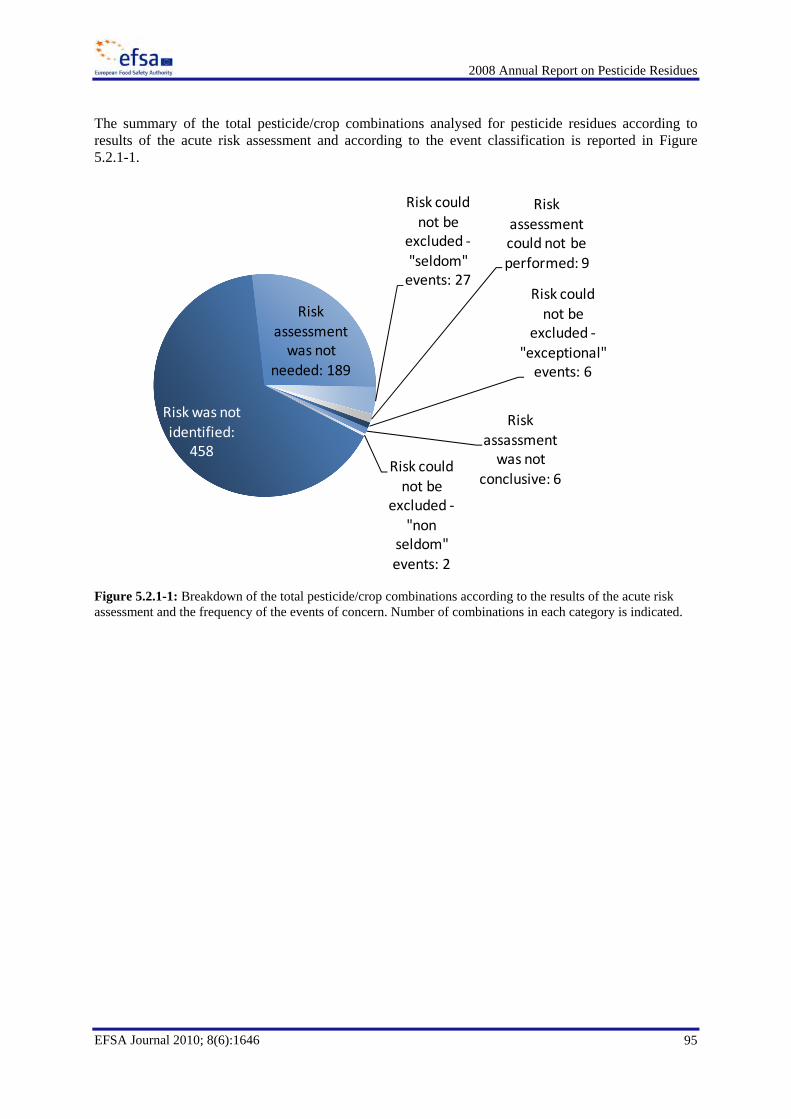
2008 Annual Report on Pesticide Residues
95
EFSA Journal 2010; 8(6):1646
The summary of the total pesticide/crop combinations analysed for pesticide residues according to results of the acute risk assessment and according to the event classification is reported in Figure 5.2.1-1.
Figure 5.2.1-1: Breakdown of the total pesticide/crop combinations according to the results of the acute risk assessment and the frequency of the events of concern. Number of combinations in each category is indicated.
Risk was not identified:
458
Risk assessment was not
needed: 189
Risk could not be
excluded ‐"seldom" events: 27
Risk assessment could not be performed: 9
Risk could not be
excluded ‐"exceptional" events: 6
Risk assassment was not
conclusive: 6Risk could not be
excluded ‐"non
seldom" events: 2
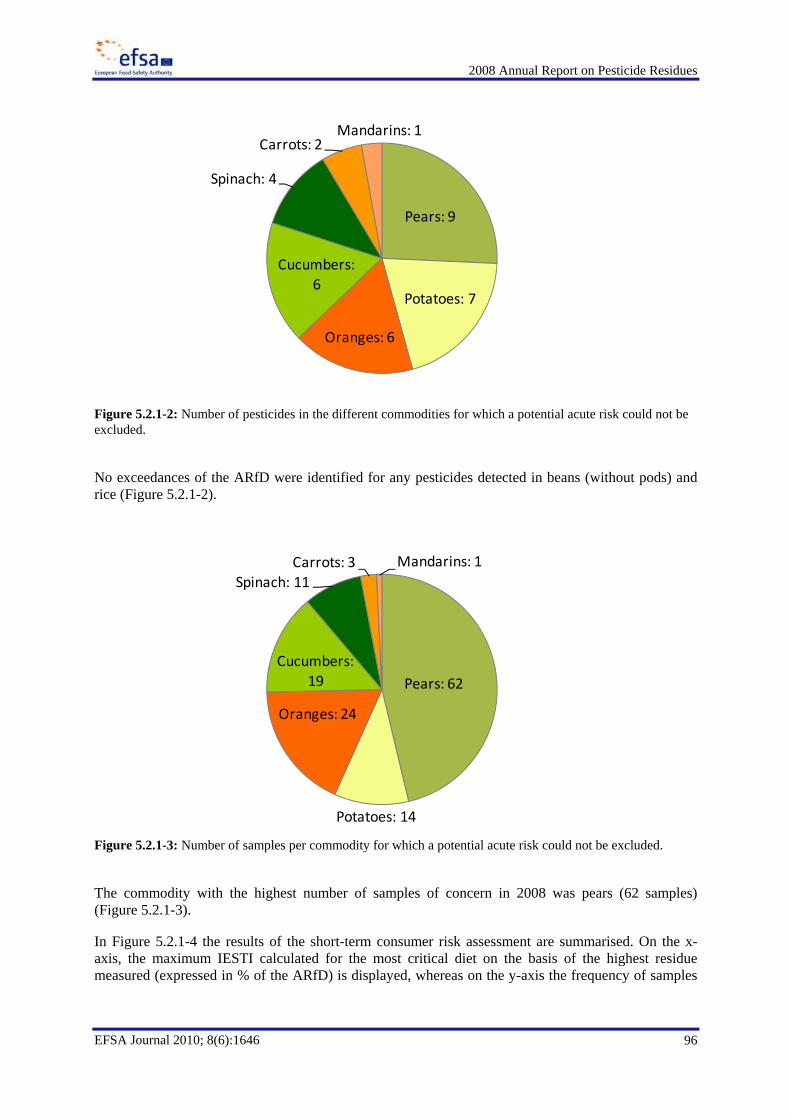
2008 Annual Report on Pesticide Residues
96
EFSA Journal 2010; 8(6):1646
Figure 5.2.1-2: Number of pesticides in the different commodities for which a potential acute risk could not be excluded.
No exceedances of the ARfD were identified for any pesticides detected in beans (without pods) and rice (Figure 5.2.1-2).
Figure 5.2.1-3: Number of samples per commodity for which a potential acute risk could not be excluded.
The commodity with the highest number of samples of concern in 2008 was pears (62 samples) (Figure 5.2.1-3).
In Figure 5.2.1-4 the results of the short-term consumer risk assessment are summarised. On the x-axis, the maximum IESTI calculated for the most critical diet on the basis of the highest residue measured (expressed in % of the ARfD) is displayed, whereas on the y-axis the frequency of samples
Pears: 9
Potatoes: 7
Oranges: 6
Cucumbers: 6
Spinach: 4
Carrots: 2Mandarins: 1
Pears: 62
Potatoes: 14
Oranges: 24
Cucumbers: 19
Spinach: 11Carrots: 3 Mandarins: 1

2008 Annual Report on Pesticide Residues
97
EFSA Journal 2010; 8(6):1646
exceeding the threshold residue (% of samples above the threshold) is depicted (see section 5.1.4 for the explanation of the frequency classification). For better readability a logarithmic scale was selected.
Figure 5.2.1-4: Summary of the results of the short-term consumer risk assessment for the pesticide/crop combinations for which a potential consumer risk could not be excluded.
5.2.1.1. Azinphos-methyl
In 2008, 38 samples of pears (2.64% of the pear samples analysed for azinphos-methyl) exceeded the threshold residue level. Thus, for these samples a potential consumer risk could not be excluded. The finding was classified as a non-seldom event.
The highest residue measured exceeded the ARfD significantly in 18 diets included in the EFSA PRIMo (maximum 1002% of the ARfD) (Figure 5.2.1.1-1).
Procymidone
Methomyl Omethoate
Lambda‐cyhalothrin
Chlorpyrifos
Imazalil
Methomyl
CarbarylOxamyl
Chlorpropham
Imazalil
TebuconazoleImazalil Omethoate
Chlormequat Procymidone
Carbendazim
Methomyl
Azinphos‐methyl
Endosulfan
MethomylDiazinonLambda‐cyhalothrin
Carbaryl
Omethoate
Omethoate MethamidophosMethiocarb
Oxamyl
Procymidon
Methomyl
MethomylOmethoate
0.01
0.1
1
100 1000 10000
Freq
uency of excee
dance of th
reshold residu
e (%
of sam
ples abo
ve the
thresho
ld)
Maximum IESTI (in % of ARfD)
Spinach
Potatoes
Pears
Oranges
Cucumbers
Carrots

2008 Annual Report on Pesticide Residues
98
EFSA Journal 2010; 8(6):1646
Figure 5.2.1.1-1: Acute exposure of the European population to azinphos-methyl in pears, expressed as percent of the ARfD. Of the 38 pear samples of concern, only three samples exceeded the EC MRL in place in 2008; two of these samples were produced in Italy, one is originating from South Africa.
It is noted that EC MRLs were amended in 2007 and in 2008. The current EC MRL for pears is established at the LOQ of 0.05 mg/kg, while in 2008 an EC MRL of 0.5 mg/kg was applicable. The current EC MRL which is below the threshold EC MRL (0.11 mg/kg) is considered protective for the European population. The use of azinphos-methyl is no longer authorised in Europe. Authorisations for its use had to be withdrawn by 1 January 2007.
Based on these findings EFSA recommends that Member States check the possible misuse of azinphos-methyl at national level and that monitoring continues under the EU coordinated programme.
5.2.1.2. Carbaryl
In 2008, two orange and two potato samples exceeded the threshold residue levels calculated for these pesticide/crop combinations.
The highest residue measured for oranges exceeded the ARfD in 6 diets included in the EFSA calculation model, the maximum value, taking into account a reduction by peeling, was 321% of the ARfD (Figure 5.2.1.2-1). For potatoes, the ARfD was exceeded for 14 diets; for 11 diets it was exceeded significantly (more than 150%). The highest calculated exposure accounted for 1061% of the ARfD (Figure 5.2.1.2-2). For potatoes refined IESTI calculation could not be performed as no processing factor is yet available.
Taking into account the number of orange and potato samples taken in 2008, the occurrence of these events was considered seldom.
0 200 400 600 800 1 000 1 200
DE childUK toddlerUK infantBE childNL childUK 4‐6 yrDK childES childIT childNL (GP)PL (GP)
UK vegetarianES adultLT adultUK adultIT adultIE adultDK adultFI adult
Intake in % of the ARfD
Acute exposure: azinphos‐methyl/pears

2008 Annual Report on Pesticide Residues
99
EFSA Journal 2010; 8(6):1646
Figure 5.2.1.2-1: Acute exposure of the European population to carbaryl in oranges, expressed as percent of the ARfD.
0 50 100 150 200 250 300 350
UK infantUK toddler
DE childUK 4‐6 yrBE childNL childDK childES childIT child
UK vegetarianUK adultNL (GP)ES adultPL (GP)IT adultFI adultIE adultDK adult
Intake in % of the ARfD
Acute exposure: carbaryl/oranges

2008 Annual Report on Pesticide Residues
100
EFSA Journal 2010; 8(6):1646
Figure 5.2.1.2-2: Acute exposure of the European population to carbaryl in potatoes, expressed as percent of the ARfD.
In Europe, the authorizations for the use of plant protection products containing carbaryl had to be withdrawn by 21 November 2007. Three of the four samples of concern originated from Europe (Italy and Malta), one sample was originating from the US. The EC MRLs, which are set at the LOQ for both commodities, have not been amended since 2008.
Taking into consideration that the use of carbaryl was not authorised in 2008, EFSA recommends that Member States check the possible misuse of carbaryl at national level.
0 200 400 600 800 1 000 1 200
UK infantUK toddlerUK 4‐6 yrNL childDE childBE child
UK vegetarianES childIT child
UK adultPL (GP)LT adultIE adultNL (GP)ES adultFI adultIT adultDK adult
Intake in % of the ARfD
Acute exposure: carbaryl/potatoes

2008 Annual Report on Pesticide Residues
101
EFSA Journal 2010; 8(6):1646
5.2.1.3. Benomyl/carbendazim
Carbendazim residues posing potential acute risks were found only in 3 samples of pears; the highest calculated IESTI accounted for about 637% of the carbendazim ARfD (Figure 5.2.1.3-1). In the short-term risk assessment the ARfD set for carbendazim (0.02 mg/kg bw) was used. If the risk assessment was performed with the ARfD set for benomyl (0.03 mg/kg bw) the IESTI would still exhaust more than 100% of the ARfD (425%).
The exceedance of the threshold residue levels by these samples represents a seldom event.
Figure 5.2.1.3-1: Acute exposure of the European population to benomyl/carbendazim residues in pears, expressed as percent of the ARfD set for carbendazim.
It is noted that the three pear samples for which a potential short-term risk could not be excluded were also found exceeding the EC MRL applicable in 2008 and that these samples have European origin (Cyprus and Spain).
The use of benomyl has not been authorised in Europe since 2002. Since January 2007, the use of carbendazim has been restricted for the following crops: cereals, rapeseed, sugar beet and maize. The presence of carbendazim residues may also result from the use of thiophanate-methyl.
EFSA recommends that Member States check the possible misuse of carbendazim/benomyl at national level and that monitoring of carbendazim continue under the coordinated EU programme.
0 100 200 300 400 500 600 700
DE childUK toddlerUK infantBE childNL childUK 4‐6 yrDK childES childIT childNL (GP)PL (GP)
UK vegetarianES adultLT adultUK adultIT adultIE adultDK adultFI adult
Intake in % of the ARfD
Acute exposure: carbendazim‐benomyl/pears

2008 Annual Report on Pesticide Residues
102
EFSA Journal 2010; 8(6):1646
5.2.1.4. Chlormequat
In 2008, a potential acute risk could not be excluded for only one single sample out of the 455 samples of pears analysed. This event has been considered as seldom and the ARfD was exceeded (143%) (Figure 5.2.1.4-1).
Since 1 December 2009, only uses of chlormequat as a plant growth regulator on cereals or non-edible crops can been authorised in Europe. However, it is known that chlormequat is quite persistent in pears trees and the current residues may result from treatments of pear trees which were made several years ago (Maas, 2006). For a phase-out period an interim EC MRL has been established which is revisited at regular intervals; the MRLs in place in 2008 and 2010 were 0.2 and 0.1 mg/kg, respectively.
Figure 5.2.1.4-1: Acute exposure of the European population to chlormequat residues in pears, expressed as percent of the ARfD.
The single pear sample of concern was also found exceeding the MRL and originated from the EU (Belgium, Netherlands and Slovenia). EFSA recommends continued monitoring of chlormequat residues in pears in the future monitoring programmes.
0 20 40 60 80 100 120 140 160
DE childUK toddlerUK infantBE childNL childUK 4‐6 yrDK childES childIT childNL (GP)PL (GP)
UK vegetarianES adultLT adultUK adultIT adultIE adultDK adultFI adult
Intake in % of the ARfD
Acute exposure: chlormequat/pears

2008 Annual Report on Pesticide Residues
103
EFSA Journal 2010; 8(6):1646
5.2.1.5. Chlorpropham
A potential consumer risk could not be excluded for six potato samples out of 1,611 samples analysed in 2008. Therefore, these events were considered as seldom. The highest calculated IESTI amounted to 187% of the ARfD, taking into account the reduction after cooking. Chlorpropham is typically used in Europe for post-harvest treatment of potatoes to suppress sprouting.
Figure 5.2.1.5-1: Acute exposure of the European population to chlorpropham residues in potatoes, expressed as percent of the ARfD.
Only one sample originating from France exceeded the EC MRL of 10 mg/kg. However it is noted that the threshold MRL (i.e. the theoretical MRL that would correspond to 100% of the ARfD) is very close (9.8 mg/kg) to the current MRL.
EFSA recommends continued monitoring of chlorpropham residues in potatoes.
0 50 100 150 200
UK infantUK toddlerUK 4‐6 yrNL childDE childBE child
UK vegetarianES childIT child
UK adultPL (GP)LT adultIE adultNL (GP)ES adultFI adultIT adultDK adult
Intake in % of the ARfD
Acute exposure: chlorpropham/potatoes

2008 Annual Report on Pesticide Residues
104
EFSA Journal 2010; 8(6):1646
5.2.1.6. Chlorpyriphos
A potential acute risk with regard to chlorpyriphos residue was identified for one potato sample (HRM 3.71 mg/kg); the occurrence of this event was considered exceptional. The maximum calculated IESTI exhausted up to 570% of the ARfD (figure 5.2.1.6-1). As no processing factor is available for this pesticide/crop combination, a refined intake calculation could not be performed.
Figure 5.2.1.6-1: Acute exposure of the European population to chlorpyriphos residues in potatoes, expressed as percent of the ARfD.
The critical potato sample exceeded the EC MRL set at the LOQ of 0.05 mg/kg. The origin of this sample is Malta.
Based on the above findings EFSA recommends control of the possible misuse of chlorpyriphos at national level and identification of possible sources of contamination of stored potatoes.
0 100 200 300 400 500 600
UK infantUK toddlerUK 4‐6 yrNL childDE childBE child
UK vegetarianES childIT child
UK adultPL (GP)LT adultIE adultNL (GP)ES adultFI adultIT adultDK adult
Intake in % of the ARfD
Acute exposure: chlorpyriphos/potatoes

2008 Annual Report on Pesticide Residues
105
EFSA Journal 2010; 8(6):1646
5.2.1.7. Diazinon
Two orange samples with residues exceeding the existing MRL, which is set at the LOQ of 0.01 mg/kg, posed a potential acute consumer risk. The maximum exposure was calculated to be 318% of the ARfD (figure 5.2.1.7-1). According to the 2008 data analysis, the findings above the threshold residue level can be considered as seldom events.
Figure 5.2.1.7-1: Acute exposure of the European population to diazinon residues in oranges, expressed as percent of the ARfD.
In total 13 orange samples found were exceeding the legal limit; one of these samples was produced in Europe (Spain), while the remaining 12 samples originated from outside Europe (Egypt).
The authorisations for plant protection products containing diazinon had to be withdrawn by 6 December 2007 at European level; any period of grace granted by Member States had to expire on 6 December 2008 at the latest.
On the basis of the above findings, EFSA recommends continued monitoring of diazinon residues in oranges produced within and outside Europe.
0 50 100 150 200 250 300 350
UK infantUK toddler
DE childUK 4‐6 yrBE childNL childDK childES childIT child
UK vegetarianUK adultNL (GP)ES adultPL (GP)IT adultFI adultIE adultDK adult
Intake in % of the ARfD
Acute exposure: diazinon/oranges

2008 Annual Report on Pesticide Residues
106
EFSA Journal 2010; 8(6):1646
5.2.1.8. Dimethoate/omethoate
The use of dimethoate is authorised in Europe, while the use of omethoate has not been authorised since 2003. Nevertheless, residues of omethoate in food commodities may occur as omethoate is a plant metabolite of dimethoate. The results are reported according to the enforcement residue definition: sum of dimethoate and omethoate, expressed as dimethoate. However, these substances have distinct toxicological profiles: the ARfD value derived for dimethoate being five times higher than the ARfD for omethoate (0.01 mg/kg bw and 0.002 mg/kg body weight, respectively)22.
Following a conservative approach an indicative exposure assessment was performed, assuming that the measured residues only contain the more toxic compound omethoate. According to these calculations, a theoretical acute risk could not be excluded for several samples: carrots (two samples), cucumbers (two samples), oranges (16 samples), pears (three samples), potatoes (one sample) and spinach (three samples). Except for the orange findings, the potential acute risks identified for these crops are considered seldom or exceptional events. For oranges, it was considered that the 16 samples above the residue threshold represent a non-seldom event.
The calculated IESTI for these six crops of concern ranged from 10,763% (potatoes) to 247% (carrots) of the ARfD set for omethoate.
Also under the assumption that the residues reported comprised only the less toxic molecule dimethoate, a theoretical acute risk could not be excluded for pears (one sample), potatoes (one sample) and spinach (two samples). In this case, the IESTI calculations ranged from 2,153% (potatoes) to 346% (pears) of the ARfD established for dimethoate (figure 5.2.1.8-1 to figure 5.2.1.8-3).
It is noted that the highest residues measured for the crops mentioned exceeded the existing MRLs which were in all cases established at the LOQ of 0.02 mg/kg.
In order to be in a position to perform a more accurate risk assessment, EFSA recommends the following:
• To establish separate MRLs for dimethoate and omethoate;
• To report separately the measured residue levels of dimethoate and omethoate;
• To amend the residue definition, taking into account the conclusions of the peer review of dimethoate performed in the framework of Directive 91/414/EEC (EFSA, 2006b).
• To continue monitoring of dimethoate and omethoate.
22 As the compounds included in the residue definition for dimethoate/omethaote have additional effects, but have different
toxicological potencies, a toxic equivalence factor based approach shall be used for risk assessment. For the acute risk assessment a factor of 6 shall be used for accounting the contribution of omethoate.

2008 Annual Report on Pesticide Residues
107
EFSA Journal 2010; 8(6):1646
Figure 5.2.1.8-1: Acute exposure of the European population to dimethoate/omethoate residues in pears, expressed as percent of the ARfD set for dimethoate.
Figure 5.2.1.8-2: Acute exposure of the European population to dimethoate/omethoate residues in potatoes, expressed as percent of the ARfD set for dimethoate.
0 50 100 150 200 250 300 350 400
DE childUK toddlerUK infantBE childNL childUK 4‐6 yrDK childES childIT childNL (GP)PL (GP)
UK vegetarianES adultLT adultUK adultIT adultIE adultDK adultFI adult
Intake in % of the ARfD
Acute exposure: dimethoate‐omethoate/pears
0 500 1 000 1 500 2 000 2 500
UK infantUK toddlerUK 4‐6 yrNL childDE childBE child
UK vegetarianES childIT child
UK adultPL (GP)LT adultIE adultNL (GP)ES adultFI adultIT adultDK adult
Intake in % of the ARfD
Acute exposure: dimethoate‐omethoate/potatoes

2008 Annual Report on Pesticide Residues
108
EFSA Journal 2010; 8(6):1646
Figure 5.2.1.8-3: Acute exposure of the European population to dimethoate/omethoate residues in spinach, expressed as percent of the ARfD set for dimethoate.
5.2.1.9. Endosulfan
According to the results of the short-term exposure calculation, a potential acute consumer risk could not be excluded for two crops: oranges (one sample) and pears (one sample). The threshold residue level exceedances in these two crops were classified as exceptional. The highest IESTI calculated for orange and pear amounted to 358% and 137% of the ARfD (figure 5.2.1.9-1 and figure 5.2.1.9-2). No processing factor is available to refine the short-term exposure calculated for oranges.
The orange sample exceeded the EC MRL which was set at the LOQ of 0.05 mg/kg. This sample originated from Europe (Portugal). The pear sample for which an acute risk could not be excluded (0.3 mg/kg) was found exceeding the EC MRL of 0.3 mg/kg and its origin was not reported. All uses of plant protection products containing endosulfan had to be withdrawn by June 2006. A restricted use of products containing endosulfan in pears was still permitted in Greece until 30 June 2007. Currently, no national authorisations for products containing endosulfan are in place.
EFSA recommends revising the current EC MRL set for pears and checking the possible misuse at national level of products containing endosulfan.
0 100 200 300 400 500 600 700
BE childNL childDE childNL (GP)
UK 4‐6 yrUK infant
UK toddlerUK vegetarian
UK adultES childPL (GP)DK childES adultIT childIT adultDK adultIE adultFI adult
Intake in % of the ARfD
Acute exposure: dimethoate‐omethoate/spinach

2008 Annual Report on Pesticide Residues
109
EFSA Journal 2010; 8(6):1646
Figure 5.2.1.9-1: Acute exposure of the European population to endosulfan residues in oranges, expressed as percent of the ARfD.
Figure 5.2.1.9-2: Acute exposure of the European population to endosulfan residues in pear, expressed as percent of the ARfD.
0 50 100 150 200 250 300 350 400
UK infantUK toddler
DE childUK 4‐6 yrBE childNL childDK childES childIT child
UK vegetarianUK adultNL (GP)ES adultPL (GP)IT adultFI adultIE adultDK adult
Intake in % of the ARfD
Acute exposure: endosulfan/oranges
0 20 40 60 80 100 120 140 160
DE childUK toddlerUK infantBE childNL childUK 4‐6 yrDK childES childIT childNL (GP)PL (GP)
UK vegetarianES adultLT adultUK adultIT adultIE adultDK adultFI adult
Intake in % of the ARfD
Acute exposure: endosulfan/pears

2008 Annual Report on Pesticide Residues
110
EFSA Journal 2010; 8(6):1646
5.2.1.10. Imazalil
In 2008, exceedances of the threshold residue level were identified for three pear and one potato sample; for these samples a potential consumer risk could not be excluded and the highest IESTI exhausted 617% and 237% of the ARfD, respectively (figure 5.2.1.10-1 and figure 5.2.1.10-2). The occurrence of these events of concern was considered seldom for pears and exceptional for potatoes.
The IESTI calculated for potato could have been refined if a processing factor for peeled/cooked potatoes was available.
Figure 5.2.1.10-1: Acute exposure of the European population to imazalil residues in pears, expressed as percent of the ARfD.
0 100 200 300 400 500 600 700
DE childUK toddlerUK infantBE childNL childUK 4‐6 yrDK childES childIT childNL (GP)PL (GP)
UK vegetarianES adultLT adultUK adultIT adultIE adultDK adultFI adult
Intake in % of the ARfD
Acute exposure: imazalil/pears

2008 Annual Report on Pesticide Residues
111
EFSA Journal 2010; 8(6):1646
Figure 5.2.1.10-2: Acute exposure of the European population to imazalil residues in potatoes, expressed as percent of the ARfD.
The samples for which potential acute risks were identified did not exceed the EC MRL in place in 2008. However, these EC MRLs for both pears and potatoes have been lowered recently. It is also noted that in 2008 no ARfD was assigned for imazalil. Since a ARfD established in 2010 the existing MRLs should be reviewed regarding potential acute consumer health risks.
EFSA recommends the setting of a processing factor for imazalil/cooked potatoes and revisiting the existing MRLs, taking into account the recently established ARfD.
5.2.1.11. Lambda-Cyhalothrin
In two orange and five spinach samples the residues of lambda-cyhalothrin exceeded the threshold residue concentration. The events in which a potential acute risk could not be excluded were considered seldom. The highest IESTI calculated for these two pesticide/crop combinations accounted for 159% and 452% of the ARfD (figure 5.2.1.11-1 and figure 5.2.1.11-2).
The IESTI calculated for oranges could not be refined since a processing factor for this crop is not available.
0 50 100 150 200 250
UK infantUK toddlerUK 4‐6 yrNL childDE childBE child
UK vegetarianES childIT child
UK adultPL (GP)LT adultIE adultNL (GP)ES adultFI adultIT adultDK adult
Intake in % of the ARfD
Acute exposure: imazalil/potatoes

2008 Annual Report on Pesticide Residues
112
EFSA Journal 2010; 8(6):1646
Figure 5.2.1.11-1: Acute exposure of the European population to lambda-cyhalothrin residues in oranges, expressed as percent of the ARfD.
Figure 5.2.1.11-2: Acute exposure of the European population to lambda-cyhalothrin residues in spinach, expressed as percent of the ARfD.
0 50 100 150 200
UK infantUK toddler
DE childUK 4‐6 yrBE childNL childDK childES childIT child
UK vegetarianUK adultNL (GP)ES adultPL (GP)IT adultFI adultIE adultDK adult
Intake in % of the ARfD
Acute exposure: Lambda‐cyhalothrin/oranges
0 100 200 300 400 500
BE childNL childDE childNL (GP)
UK 4‐6 yrUK infant
UK toddlerUK vegetarian
UK adultES childPL (GP)DK childES adultIT childIT adultDK adultIE adultFI adult
Intake in % of the ARfD
Acute exposure: lambda‐cyhalothrin/spinach

2008 Annual Report on Pesticide Residues
113
EFSA Journal 2010; 8(6):1646
The orange samples that posed a potential risk were found to be below the MRL , while of the five spinach samples of concern only one was exceeding the EC MRL in place in 2008.
Plant protection products containing lambda-cyhalothrin are authorised in Europe. EFSA recommends that a processing factor for lambda-cyhalothrin be derived and/or that the EC MRLs for oranges and spinach be reconsidered.
5.2.1.12. Methamidophos
The use of products containing metamidophos is no longer authorised in Europe. National authorisations had to be withdrawn by 1st July 2008. In two samples of cucumbers a potential acute consumer risk could not be excluded. The occurrence of these residue levels can be considered as a seldom event. The highest IESTI calculated for cucumbers exhausted 760% of the ARfD (figure 5.2.1.12-1)
Figure 5.2.1.12-1: Acute exposure of the European population to metamidophos residues in cucumbers, expressed as percent of the ARfD.
The two samples with highest residues measured were also found exceeding the EC MRL; one of these samples was produced in Europe (Greece) and one originated from outside Europe (Suriname). Since the use of metamidophos is no longer authorised in Europe, EFSA recommends that the Member States check the possible misuse of the product containing metamidophos at national level.
0 100 200 300 400 500 600 700 800
NL childBE childDE childDK child
UK toddlerUK 4‐6 yrNL (GP)DK adultLT adult
UK vegetarianUK infantUK adultES childIT childIT adultFI adultPL (GP)ES adultIE adult
Intake in % of the ARfD
Acute exposure: methamidophos/cucumber

2008 Annual Report on Pesticide Residues
114
EFSA Journal 2010; 8(6):1646
5.2.1.13. Methiocarb
The use of products containing Methiocarb is authorised in Europe. The two cucumber samples for which a potential acute risk could not be excluded can be classified as seldom events. However, the highest estimated exposure largely exceeded the ARfD (2519%) (figure 5.2.1.13-1)
Figure 5.2.1.13-1: Acute exposure of the European population to methiocarb residues in cucumbers, expressed as percent of the ARfD.
The two cucumber samples of concern were also found to exceed the EC MRL in place in 2008. These samples were produced outside Europe (Dominican Republic). EFSA recommends continued monitoring of methiocarb residues in cucumbers in future monitoring programmes.
5.2.1.14. Methomyl/thiodicarb
The use of methomyl in plant protection products was authorised in 2008 in Europe. Authorisations for thiodicarb uses should have been withdrawn by 25 November 2007, with a period of grace until 25 November 2008.
The results of the monitoring were reported as “Sum of methomyl and thiodicarb, expressed as methomyl”.
Following a conservative approach, assuming that the measured residues comprise only the more toxic compound methomyl, EFSA performed an indicative risk assessment based on the ARfD for methomyl. According to these calculations, a theoretical acute risk could not be excluded for several samples: carrots (one sample), cucumbers (five samples), oranges (one sample), pears (seven samples), potatoes (one sample) and spinach (two samples). Except for the potatoes findings, the potential acute
0 500 1 000 1 500 2 000 2 500 3 000
NL childBE childDE childDK child
UK toddlerUK 4‐6 yrNL (GP)DK adultLT adult
UK vegetarianUK infantUK adultES childIT childIT adultFI adultPL (GP)ES adultIE adult
Intake in % of the ARfD
Acute exposure: methamidophos/cucumber

2008 Annual Report on Pesticide Residues
115
EFSA Journal 2010; 8(6):1646
risks identified for these crops are considered seldom events. For potatoes, it was considered that only the sample above the residue threshold represents an exceptional event.
The calculated IESTI for these six crops of concern ranged from 123% (potatoes) to 1,645% (oranges) of the ARfD set for methomyl (figure 5.2.1.14-1 to figure 5.2.1.14-6). Processing factors to refine the IESTI calculated for oranges and potatoes were not available.
Assuming that the measured residues consist only of thiodicarb, the calculated exposure exceeded the ARfD of thiodicarb (0.01 mg/kg bw, EFSA 2005) for oranges and pears (411 and 228% of the ARfD set for thiodicarb). For the other commodities, the IESTI calculated was below the ARfD (32%, 92%, 31% and 43% of the ARfD for carrots, cucumbers potatoes and spinach).
Figure 5.2.1.14-1: Acute exposure of the European population to methomyl/thiodicarb residues in carrots, expressed as percent of the ARfD set for methomyl.
0 20 40 60 80 100 120 140
UK infantBE child
UK toddlerNL childDE childUK 4‐6 yrDK childNL (GP)IT child
UK vegetarianDK adultUK adultLT adultIT adultFI adultIE adultES childES adultPL (GP)
Intake in % of the ARfD
Acute exposure: methomyl‐thiodicarb/carrot

2008 Annual Report on Pesticide Residues
116
EFSA Journal 2010; 8(6):1646
Figure 5.2.1.14-2: Acute exposure of the European population to methomyl/thiodicarb residues in cucumbers, expressed as percent of the ARfD set for methomyl.
Figure 5.2.1.14-3: Acute exposure of the European population to methomyl/thiodicarb residues in oranges, expressed as percent of the ARfD set for methomyl.
0 50 100 150 200 250 300 350 400
NL childBE childDE childDK child
UK toddlerUK 4‐6 yrNL (GP)DK adultLT adult
UK vegetarianUK infantUK adultES childIT childIT adultFI adultPL (GP)ES adultIE adult
Intake in % of the ARfD
Acute exposure: methomyl‐thiodicarb/cucumber
0 500 1 000 1 500 2 000
UK infantUK toddler
DE childUK 4‐6 yrBE childNL childDK childES childIT child
UK vegetarianUK adultNL (GP)ES adultPL (GP)IT adultFI adultIE adultDK adult
Intake in % of the ARfD
Acute exposure: methomyl‐thiodicarb/oranges

2008 Annual Report on Pesticide Residues
117
EFSA Journal 2010; 8(6):1646
Figure 5.2.1.14-4: Acute exposure of the European population to methomyl/thiodicarb residues in pears, expressed as percent of the ARfD set for methomyl.
0 200 400 600 800 1 000
DE childUK toddlerUK infantBE childNL childUK 4‐6 yrDK childES childIT childNL (GP)PL (GP)
UK vegetarianES adultLT adultUK adultIT adultIE adultDK adultFI adult
Intake in % of the ARfD
Acute exposure: methomyl‐thiodicarb/pears

2008 Annual Report on Pesticide Residues
118
EFSA Journal 2010; 8(6):1646
Figure 5.2.1.14-5: Acute exposure of the European population to methomyl/thiodicarb residues in potatoes, expressed as percent of the ARfD set for methomyl.
0 20 40 60 80 100 120 140
UK infantUK toddlerUK 4‐6 yrNL childDE childBE child
UK vegetarianES childIT child
UK adultPL (GP)LT adultIE adultNL (GP)ES adultFI adultIT adultDK adult
Intake in % of the ARfD
Acute exposure: methomyl‐thiodicarb/potatoes

2008 Annual Report on Pesticide Residues
119
EFSA Journal 2010; 8(6):1646
Figure 5.2.1.14-6: Acute exposure of the European population to methomyl/thiodicarb residues in spinach, expressed as percent of the ARfD set for methomyl.
It is noted that the MRLs in place for oranges and pears (0.5 mg/kg and 0.2 mg/kg, respectively) exceed the calculated threshold values for these crops (0.08 mg/kg and 0.11 mg/kg). For potatoes and carrots, the identified acute risk was due to measured residue levels (0.02 and 0.05 mg/kg) below or at the EC MRLs, which are both set at the LOQ (0.05 mg/kg). Since EFSA identified potential consumer risks related to the MRLs in place in 2008, it was recommended to lower certain MRLs of concern. Regulation (EC) No 1097/2009, entering into force on 7 June 2010, implements the EFSA recommendations.
As a general recommendation EFSA proposes the setting of separate EC MRLs for active substances like methomyl and thiodicarb for which different toxicological reference values have been established.
5.2.1.15. Oxamyl
For two potato samples and two cucumber samples, the highest residues measured exceeded the threshold residue concentration. The occurrence of both events was considered seldom. The degree of exceedance of the ARfD is very high, amounting to 1,384% and 1,053% for potatoes and cucumbers, respectively (figure 5.2.1.15-1 and 5.2.1.15-2).
0 50 100 150 200
BE childNL childDE childNL (GP)
UK 4‐6 yrUK infant
UK toddlerUK vegetarian
UK adultES childPL (GP)DK childES adultIT childIT adultDK adultIE adultFI adult
Intake in % of the ARfD
Acute exposure: methomyl‐thiodicarb/spinach

2008 Annual Report on Pesticide Residues
120
EFSA Journal 2010; 8(6):1646
Figure 5.2.1.15-1: Acute exposure of the European population to oxamyl residues in potatoes, expressed as percent of the ARfD.
Figure 5.2.1.15-2: Acute exposure of the European population to oxamyl residues in cucumbers, expressed as percent of the ARfD.
0 200 400 600 800 1 000 1 200 1 400 1 600
UK infantUK toddlerUK 4‐6 yrNL childDE childBE child
UK vegetarianES childIT child
UK adultPL (GP)LT adultIE adultNL (GP)ES adultFI adultIT adultDK adult
Intake in % of the ARfD
Acute exposure: oxamyl/potatoes
0 200 400 600 800 1 000 1 200
NL childBE childDE childDK child
UK toddlerUK 4‐6 yrNL (GP)DK adultLT adult
UK vegetarianUK infantUK adultES childIT childIT adultFI adultPL (GP)ES adultIE adult
Intake in % of the ARfD
Acute exposure: oxamyl/cucumber

2008 Annual Report on Pesticide Residues
121
EFSA Journal 2010; 8(6):1646
In Europe, the use of products containing oxamyl is allowed. All four samples, where a potential consumer risk was identified, exceeded the EC MRLs established in September 2008. However, before this date, national MRLs were applicable for oxamyl. It is noted that some of the current MRLs are also established above the threshold residue level.
EFSA recommends continuing monitoring residues of oxamyl in food commodities in the future control programmes, reviewing the existing EC MRLs for cucumbers and potatoes and developing more sensitive analytical methods to set MRL at a lower LOQ level.
5.2.1.16. Parathion
At present, the use of plant protection products containing parathion is not authorised in Europe.
According to the IESTI calculations, potential intake concerns were identified for one out of the 914 mandarin samples taken (seldom event). In this case, the IESTI exceeded 178% if the ARfD (figure 5.2.1.16-1).
Figure 5.2.1.16-1: Acute exposure of the European population to parathion residues in mandarins, expressed as percent of the ARfD.
It is noted that the mandarin sample of concern exceeded the EC MRL; the sample originated from Spain. Therefore, EFSA recommends controlling the possible misuse of parathion at national level.
0 50 100 150 200
UK toddlerDE childUK 4‐6 yrNL childBE child
UK infantDK childES childIT child
UK vegetarianPL (GP)
UK adultIT adultNL (GP)ES adultIE adultFI adultDK adult
Intake in % of the ARfD
Acute exposure: parathion/mandarin

2008 Annual Report on Pesticide Residues
122
EFSA Journal 2010; 8(6):1646
5.2.1.17. Procymidone
Since 1 January 2007, the use of procymidone has been restricted to cucumbers in greenhouses and plums (for processing). Since June 2008 all procymidone uses have been prohibited in Europe.
The assessment of the acute consumer exposure indicated a possible acute intake above the threshold value in three crops: cucumbers (six samples), pears (four samples) and spinach (one sample). Considering the total number of samples taken for each of these crops, it was considered that the samples of concern are seldom events. The calculated IESTI for these three crops accounted for 468%, 455% and 126% of the ARfD (figure 5.2.1.17-1 to figure 5.2.1.17-3).
Figure 5.2.1.17-1: Acute exposure of the European population to procymidone residues in cucumbers, expressed as percent of the ARfD.
0 100 200 300 400 500
NL childBE childDE childDK child
UK toddlerUK 4‐6 yrNL (GP)DK adultLT adult
UK vegetarianUK infantUK adultES childIT childIT adultFI adultPL (GP)ES adultIE adult
Intake in % of the ARfD
Acute exposure: Procymidone/cucumber

2008 Annual Report on Pesticide Residues
123
EFSA Journal 2010; 8(6):1646
Figure 5.2.1.17-2: Acute exposure of the European population to procymidone residues in pears, expressed as percent of the ARfD.
0 100 200 300 400 500
DE childUK toddlerUK infantBE childNL childUK 4‐6 yrDK childES childIT childNL (GP)PL (GP)
UK vegetarianES adultLT adultUK adultIT adultIE adultDK adultFI adult
Intake in % of the ARfD
Acute exposure: procymidone/pears

2008 Annual Report on Pesticide Residues
124
EFSA Journal 2010; 8(6):1646
Figure 5.2.1.17-3: Acute exposure of the European population to procymidone residues in spinach, expressed as percent of the ARfD.
The spinach sample of concern was produced in Europe (France) and exceeded the 2008 EC MRLs set for procymidone in this crop.
The cucumber and pear samples of concern were found not exceeding the EC MRL in place in 2008. It is noted that the MRLs for procymidone are to be lowered, following advice given by (EFSA 2009). The new MRLs will become applicable as from 07 June 2010 (EC 2009).
5.2.1.18. Tebuconazole
According to the IESTI calculation, potential acute risks to consumer health could not be excluded for only two samples of pears out of the 1286 samples analysed. The occurrence of this event was therefore considered as seldom. The calculated exposure accounted for 200% of the ARfD (figure 5.2.1.18-1).
0 20 40 60 80 100 120 140
BE childNL childDE childNL (GP)
UK 4‐6 yrUK infant
UK toddlerUK vegetarian
UK adultES childPL (GP)DK childES adultIT childIT adultDK adultIE adultFI adult
Intake in % of the ARfD
Acute exposure: procymidone/spinach

2008 Annual Report on Pesticide Residues
125
EFSA Journal 2010; 8(6):1646
Figure 5.2.1.18-1: Acute exposure of the European population to tebuconazole residues in pears, expressed as percent of the ARfD.
EC MRLs for tebuconazole were set for the first time in 2008, based on a risk assessment which was performed with a proposed ARfD of 0.1 mg/kg (Denmark, 2007). Since the ARfD has been lowered in the meantime, the MRLs should be revised accordingly.
5.2.2. Pesticide/crop combinations for which the short-term risk assessment was not conclusive
For three groups of chemicals - the dithiocarbamates, the cypermethrins, folpet and captan (expressed as sum) - the residue definition for enforcement includes two or more components for which different toxicological reference values have been derived. The consumer risk assessment is impeded by the fact that the contribution of the single component to the total measured residues was not reported to EFSA. Therefore, Two different scenario were calculated. In the first one it was assumed that the measured residue refers only to the component of the residue definition with the lowest ARfD; in the second scenario, the highest ARfD was considered. For three group of pesticides (cypermethrins, dithiocarbamates and folpet/captan) in the two calculated scenarios the rate of ARfD exhaustion would respectively exceed and not exceeded 100% of the ARfD. As a result, for these groups of substances a final conclusion on the potential health risk related to measured residues could not be drawn.
Tables 5.2.2-1 and 5.2.2-2 report the details and the risk assessment recommendations for the pesticide/crop combinations for which the short-term risk assessment were not conclusive.
0 50 100 150 200 250
DE childUK toddlerUK infantBE childNL childUK 4‐6 yrDK childES childIT childNL (GP)PL (GP)
UK vegetarianES adultLT adultUK adultIT adultIE adultDK adultFI adult
Intake in % of the ARfD
Acute exposure: tebuconazole/pears

2008 Annual Report on Pesticide Residues
126
EFSA Journal 2010; 8(6):1646
Table 5.2.2-1: Summary results of the short-term risk assessment of the active substances for which the short-term risk assessment was not conclusive.
Pesticide Crop 2008 MR
L
(whole crop) (1)
mg/kg
Total num
ber of sam
ples analysed
% sam
ples exceeding the M
RL
Highest residue
measured
(HR
M) m
g/kg
Highest residue
measured corrected
with PF (H
RM
c) m
g/kg
Max IESTI
(% ARfD)
Most critical diet
Thres-hold
residue in edible
portion (mg/kg)
(2)
Number of
samples above the threshold residue
% samples
above the threshold residue
Exceedence of ARfD is
considered "Exceptional". "seldom" or "not seldom"
event? (3)
Cypermethrin Pears 1 1452 0.55 125.22 DE child 0.439 1 0.07 exceptional Dithiocarbamates Oranges 5 375 4.53 1.00 0.884 146.61 UK infant 0.600 3 0.80 seldom Dithiocarbamates Potatoes 0.3 584 1.37 0.603 115.90 UK infant 0.520 1 0.17 seldom Dithiocarbamates Pears 3 845 0.00 5.63 640.69 DE child 0.880 46 1.54 non seldom Dithiocarbamates Spinach 0.05 510 4.90 13.27 374.78 BE child 3.540 4 0.20 seldom Folpet/Captan Pears 3 1238 0.00 2.9 132.05 DE child 2.196 2 0.16 seldom
(1) EC MRL in place 01/01/2008; when the MRL figure is followed by an asterisk (*) the MRL is set at the LOQ. (2) The threshold residue is the theoretical calculated residue level that represents the 100% of the ARfD exhaustion. This value is calculated individually for each pesticide/crop combination
and for each diet. (3) See section 5.1.3 for more details on the event classification.

2008 Annual Report on Pesticide Residues
127
EFSA Journal 2010; 8(6):1646
Table 5.2.2-2: Details on the MRL exceedances and sample origin for the samples for which the short-term risk assessment was not conclusive.
Pesticide Crop No sam
ples above the threshold residue
Num
ber samples >
2008 EC
MR
L
Origin of samples > 2008
EC MRL (1)
Pesticide authorisation status in EU (any crop) in
2008 (y/n)
2008 EC MRL (whole crop) mg/kg
2010 EC MRL (whole crop) mg/kg
PF missing?
(y/n)
ThresholdEC MRL
(whole crop) mg/kg
2010 EC
MRL >thres-hold
MRL?(y/n)
EFSA recom-menda-
tion
Cypermethrin Pears 1 0 y 1.00 1.00 n.a. 0.439 y (2) Folpet/Captan Pears 2 0 y 3.00 3.00 n.a. 2.196 y (3) Dithiocarbamates Oranges 3 0 5.00 5.00 y (4) Dithiocarbamates Potatoes 1 0 0.30 0.30 y (4) Dithiocarbamates Pears 46 0 3.00 5.00 n.a. 0.880 y (5) Dithiocarbamates Spinach 4 25 1 AT, 1 BE,
4 CY, 4 ES, 6 FR, 1 IT, 1 PL, 5 PT,
2 Unknown
0.05 0.05 n.a. 3.540 n (6)
(1) AT= Austria; BE = Belgium; CY = Cyprus; ES = Spain; FR = France; IT = Italy; PL = Poland; PT= Portugal. (2) EURL to investigate possible solutions to distinguish the isomers contributing to the total cypermethrins measured in food samples. (3) COM to set separate MRLs for pears for folpet and captan; Member State(s) to report separately residues of folpet and captan in pears. (4) To set a processing/peeling factor for oranges; Member State(s) to analyse the samples with the analytical methods developed specifically for ziram, thiram and propineb when the MRL
for the dithiocarbamets (CS2) is exceeded. (5) Member State(s) to analyse the samples with the analytical methods developed specifically for ziram, thiram and propineb when the MRL for the dithiocarbamets (CS2) is exceeded. (6) Member State(s) to check possible misuses on spinach; when the MRL for the dithiocarbamets (CS2) is exceeded to analyse the samples with the analytical methods developed specifically
for ziram, thiram and propineb.

2008 Annual Report on Pesticide Residues
128
EFSA Journal 2010; 8(6):1646
5.2.2.1. Cypermethrin
The use of cypermethrin, alpha-cypermethrin and zeta-cypermethrin is authorised in Europe. No authorisations are granted for beta-cypermethrin.
The residue definition for enforcement is set to the sum of mixture of constituent cypermethrin isomers. Therefore, the identity of the measured residue in samples is not known. As a result, the short-term risk assessment has been initially performed by comparing the estimated exposure to the ARfD of alpha-cypermethrin (0.04 mg/kg bw), the isomer with the lowest acute toxicological reference value.
A potential consumer risk could not be excluded for one pear sample. The exceedance of the lowest threshold residue levels was considered as exceptional event and the rate of the ARfD exceedance was slight (125%) (figure 5.2.2.1-1).
Figure 5.2.2.1-1: Acute exposure of the European population to cypermethrin residues in pear, expressed as percent of the ARfD of alpha-cypermethrin.
It should be noted that the pear sample of concern was not reported to exceed the 2008 EC MRL of 1.0 mg/kg. For this pesticide/crop combination a threshold residue concentration of 0.44 mg/kg has been calculated which is about the half of the current EC MRL (1.0 mg/kg).
If the risk assessment is performed with the ARfD set for zeta-cypermethrin (0.125 mg/kg bw, EFSA, 2008), the calculated exposure is well below the ARfD (40%) and therefore a consumer risk is to be excluded.
0 20 40 60 80 100 120 140
DE childUK toddlerUK infantBE childNL childUK 4‐6 yrDK childES childIT childNL (GP)PL (GP)
UK vegetarianES adultLT adultUK adultIT adultIE adultDK adultFI adult
Intake in % of the ARfD
Acute exposure: cypermethrin/pears

2008 Annual Report on Pesticide Residues
129
EFSA Journal 2010; 8(6):1646
EFSA recommends that EURLs investigate possible solutions to distinguish the isomers contributing to the total measured cypermethrin in food samples and to establish separate residue definitions.
5.2.2.2. Dithiocarbamates
The dithiocarbamates are a group of active substances which have a comparable chemical structure, but which have different toxicological properties. The analytical method used to analyse the samples for residues resulting from the use of dithiocarbamates determines the residue concentration of CS2 without identifying the active substance that has been applied to the crop. For the risk assessment EFSA used the ARfD value established for ziram, which is the dithiocarbamate compound with the lowest ARfD (0.08 mg/kg bw) and the ARfD for mancozeb (0.6 mg/kg bw), which is the dithiocarbamate which is most commonly used.
Assuming that all CS2 is due to the use of ziram, the residue values reported as CS2 were recalculated to ziram by using the molecular weight conversion factor of 2.01. According to IESTI calculations, the samples that gave rise to theoretical acute intake concerns were three orange samples, one potato sample, forty-six pear samples, and four spinach samples. The eight exceedances were classified as seldom events (figure 5.2.2.2-1 to figure 5.2.2.2-4). The 46 exceedances of the residue threshold in pears were considered as non seldom events. It is noted that the EC MRL set for dithiocarbamates in pears was 3 mg/kg in 2008, while the current MRL is 5 mg/kg. The threshold MRL calculated on the basis of the ARfD set for ziram is 0.88 mg/kg.
Figure 5.2.2.2-1: Acute exposure of the European population to dithiocarbamate residues in oranges, expressed as percent of the ARfD set for ziram.
0 20 40 60 80 100 120 140 160
UK infantUK toddler
DE childUK 4‐6 yrBE childNL childDK childES childIT child
UK vegetarianUK adultNL (GP)ES adultPL (GP)IT adultFI adultIE adultDK adult
Intake in % of the ARfD
Acute exposure: dithiocarbamate/oranges

2008 Annual Report on Pesticide Residues
130
EFSA Journal 2010; 8(6):1646
Figure 5.2.2.2-2: Acute exposure of the European population to dithiocarbamate residues in pears, expressed as percent of the ARfD set for ziram.
Figure 5.2.2.2-3: Acute exposure of the European population to dithiocarbamate residues in potatoes, expressed as percent of the ARfD set for ziram.
0 100 200 300 400 500 600 700
DE childUK toddlerUK infantBE childNL childUK 4‐6 yrDK childES childIT childNL (GP)PL (GP)
UK vegetarianES adultLT adultUK adultIT adultIE adultDK adultFI adult
Intake in % of the ARfD
Acute exposure: dithiocarbamate/pears
0 20 40 60 80 100 120 140
UK infantUK toddlerUK 4‐6 yrNL childDE childBE child
UK vegetarianES childIT child
UK adultPL (GP)LT adultIE adultNL (GP)ES adultFI adultIT adultDK adult
Intake in % of the ARfD
Acute exposure: dithiocarbamate/potatoes

2008 Annual Report on Pesticide Residues
131
EFSA Journal 2010; 8(6):1646
Figure 5.2.2.2-4: Acute exposure of the European population to dithiocarbamate residues in spinach, expressed as percent of the ARfD set for ziram.
Assuming that all CS2 is due to the use of mancozeb, the residue values reported as CS2 were recalculated to mancozeb by using the molecular weight conversion factor of 1.78. According to IESTI calculations, no samples gave rise to theoretical acute intake concern. However, a final conclusion regarding the potential health risk related to the observed CS2 residues cannot be drawn as the sources of the CS2 residues are unknown and therefore the appropriate toxicological reference value could not be identified.
EFSA recommends that the reporting countries do the following; if the total CS2 measured complies with the EC MRL, the reporting countries should report the total CS2 (i.e. it is therefore assumed that the dithiocarbamates have been applied correctly); if the total CS2 measured exceeds the EC MRL set for the dithiocarbamate group, the reporting countries should also analyse the samples with the analytical methods developed specifically for ziram, thiram and propineb. The residue results should be reported separately for these three pesticides to allow a refined risk assessment.
5.2.2.3. Folpet/Captan
The use of products containing folpet and captan is authorised in Europe. Except for two single samples of pears, all the samples analysed for captan and folpet (as sum) contained residues levels for which a potential acute consumer risk could be excluded. The exceedance of the ARfD is considered a seldom event.
0 50 100 150 200 250 300 350 400
BE childNL childDE childNL (GP)
UK 4‐6 yrUK infant
UK toddlerUK vegetarian
UK adultES childPL (GP)DK childES adultIT childIT adultDK adultIE adultFI adult
Intake in % of the ARfD
Acute exposure: dithiocarbamate/spinach

2008 Annual Report on Pesticide Residues
132
EFSA Journal 2010; 8(6):1646
The residue definition for certain commodities included in the 2008 EU coordinated programme (i.e. pears and beans without pods) is set to the sum of folpet and captan. The contribution of the two single pesticides to the total residues measured in the pear sample of concern was not reported to EFSA. Therefore, a potential short-term risk was identified by comparing the highest estimated exposure with the ARfD set for folpet (0.2 mg/kg bw). The highest IESTI exceeded 132% of the folpet ARfD (figure 5.2.2.3-1).
Figure 5.2.2.3-1: Acute exposure of the European population to folpet/captan residues in pears, expressed as percent of the ARfD set for captan.
The two pear samples of concern were found not exceeding the EC MRL in place in 2008 (3 mg/kg) but exceeding the lowest residue threshold (2.2 mg/kg), based on the assumption that the measured residues of folpet and captan in pears are solely due to the pesticide with lower ARfD (folpet).
If the short-term exposure is performed with the ARfD of captan (0.3 mg/kg bw), the calculated IESTI does not exceed the ARfD. Under this scenario no consumer risk is identified.
It is noted that no potential short-term risks were identified for captan and folpet residues measured separately in food commodities for which the residue definition and EC MRLs are set singularly for captan and folpet.
Due to the uncertainty relating to contribution of folpet and captan to the total residue measured, a conclusive risk assessment could not be performed. Therefore, EFSA recommends setting separate MRLs for captan and folpet.
0 20 40 60 80 100 120 140
DE childUK toddlerUK infantBE childNL childUK 4‐6 yrDK childES childIT childNL (GP)PL (GP)
UK vegetarianES adultLT adultUK adultIT adultIE adultDK adultFI adult
Intake in % of the ARfD
Acute exposure: captan‐folpet/pears

2008 Annual Report on Pesticide Residues
133
EFSA Journal 2010; 8(6):1646
5.2.3. Pesticide/crop combinations for which the short-term risk assessment could not be performed
No acute (short-term) risk assessment could be performed for dichlorvos because no toxicological reference value is available. During the peer-review of this substance in the framework of Directive 91/414/EEC (EC 1991a), it was concluded that due to insufficient information available no ARfD can be derived.
Dichlorvos is an active substance that is no longer authorised for use in plant protection products in Europe. Authorisations for plant protection products containing dichlorvos had to be withdrawn by 6 December 2007; any period of grace granted by Member States had to expire at the latest by December 2008.
It was noted that in the nine food commodities analysed in 2008 measurable residues of this substance were only quantified in one single sample of rice out of 768 rice samples analysed. In this sample, the residue measured amounted to 0.03 mg/kg and therefore it exceeded the EC MRL, which corresponds to the default MRL of 0.01 mg/kg. It is noted that the rice sample of concern has EU origin (Italy).
EFSA recommends making efforts to derive toxicological reference values for dichlorvos on the basis of the open scientific literature and the available, limited, scientific dossier and studies to allow a conclusion on the potential consumer risks due to dichlorvos residues measured in food samples.
5.3. Model assumptions for long-term risk assessment
The chronic or long-term exposure assesses the average exposure of an individual over their lifetime. Ideally, the long-term exposure should be calculated by means of probabilistic modelling, using the distributions of the individual food consumption reported by the respondents of food surveys and the distribution of the measured residue concentration identified in the monitoring programmes. Since currently the necessary input values for such calculations are not yet available, EFSA decided to calculated the long-term exposure with a deterministic model, analogous to the calculation of the Theoretical Maximum Daily Intake. The TMDI is calculated according to the following equation which was developed for the assessment of the long-term dietary intake in the framework of setting MRLs (WHO, 1997):
TMDI = Σ (MRLi * Fi)
MRLi: Maximum residue level for food commodity i
Fi: Food consumption of food commodity i
The modelling of the actual exposure is done with a deterministic methodology by multiplying a residue concentration by an average daily food consumption estimated for each commodity for which food consumption data are available. The MRL that is used in the TMDI calculation has been replaced with a relevant residue concentration. If the calculated exposure is below the toxicological reference value derived for long-term exposure, i.e. the Acceptable Daily Intake (ADI, see “Background information” section), the consumer is considered as adequately protected.
The following input values are required to calculate the actual exposure:
• Residue concentration to which the consumer is exposed (see section 5.3.1)
• Processing/peeling factors (see section 5.3.2)

2008 Annual Report on Pesticide Residues
134
EFSA Journal 2010; 8(6):1646
• Mean food consumption from the EFSA PRIMo (EFSA, 2007). These food consumption data were derived from national food surveys. Data for in total 27 diets representing different food habits of European population sub-groups, including children are available.
As reported in section 2.1.1, the contribution of the 9 food commodities monitored in the 2008 EU coordinated programme represent 15 to 50% of the total dietary daily intake of the European consumers. In order to be more representative for the total intake, the chronic risk assessment also included commodities of plant origin that will be included in the coordinated programme in 2009 and 2010 (see section 3.1.1) 23 (EC 2007). With this approach, 40.0% to 95.1% of the total dietary intake will be represented.
If in the first tier assessment a potential chronic risk could not be excluded on the basis of the calculation performed as described above, EFSA tried to perform more refined calculations, taking into account processing factors. The available processing/peeling factors are reported in section 5.1.2 In Figure 5.3-1 the tiered approach used in assessing the chronic risk is represented.
23 Orange juice has not been included in the exposure calculations.

2008 Annual Report on Pesticide Residues
135
EFSA Journal 2010; 8(6):1646
Figure 5.3-1: Flow chart for the tiered approach used in assessing the chronic risk.

2008 Annual Report on Pesticide Residues
136
EFSA Journal 2010; 8(6):1646
5.3.1. Residue levels
In order to perform an actual long-term exposure assessment, a residue concentration describing the long-term exposure of consumers to a certain pesticide has to be derived; the calculated mean residue concentrations derived from the monitoring results are suitable for this purpose. However, a direct calculation of a mean residue concentration from the 2008 monitoring results reported by Member States was not possible since the format currently used for reporting the results of the residue analysis requires that reporting countries submit the data in an aggregated form; only the number of samples with residue level falling in one of the 13 predefined residue classes are reported (e.g. samples with residues between 0.02 and 0.05 mg/kg); the individual measured residue concentrations for the samples are not reported.
To derive an appropriate input value for the chronic exposure assessment, EFSA analysed the data submitted in the framework of a pilot project which was launched in 2009 with six Member States volunteering to test the data submission according to a new format. This new data format was developed to submit the detailed results obtained in the national monitoring laboratories at the level of the single chemical determination, without aggregation of the results. The six Member States were able to provide EFSA with detailed results for about 6 million chemical determinations, which related to about 27,000 samples. The samples reported in line with the new format accounted for about 40% of the total samples taken by all the reporting countries. The pesticide residues measured in each sample allowed investigation of the distribution of the residues within each of the 13 predefined residue classes. The results submitted for about 700 pesticide/crop combinations demonstrated that, with the following calculation methodology, an appropriate descriptor of the mean residue value can be derived:
• For each class in the current reporting system the mid-value was determined (e.g. the mid-value for the class 0.051 to 0.1 mg/kg is 0.0755 mg/kg).
• For each sample analysed for a specific pesticide/commodity combination which was reported to fall in a specific residue class it was assumed that the real residue was equivalent to the calculated mid-value of the class.
• For the pesticide/residue combination, an overall mean value was calculated, using the mid-class values derived for the individual samples. However, for samples with residues below the LOQ, EFSA assumed the real value was the LOQ, as information on the use of the pesticide concerned in the specific commodity was not available.
• Samples for which the reporting levels were not indicated were disregarded.
• If for a given pesticide/crop combination no positive findings were reported among all the reporting countries, then the contribution of these crops to the total dietary intake was not considered since a “no use/no residue” situation was assumed.

2008 Annual Report on Pesticide Residues
137
EFSA Journal 2010; 8(6):1646
The usage of the midpoint of each class was considered a conservative estimator, but more realistic than the upper class limit which was used in the chronic exposure assessment in the 2007 Annual Report24.
The residue values reported according to the residue definition for enforcement (as in the MRL legislation) were not recalculated to the residue definition for risk assessment because no reliable conversion factors are available at the moment.
The residue levels used as input values for the calculation of the long-term exposure are reported in Table 5.3.1-1a and Table 5.3.1-1b. Empty cells refer to pesticide/crop combinations for which all results were reported to be below the reporting level and therefore a no use/no residue situation was assumed.
24 In the 2007 Annual Report of Pesticide Residues EFSA used a different approach (EFSA 2009): for each group of samples
within a residue class the residue level was considered to be the upper bound (e.g. for samples with residue levels falling in the class “between 0.02 and 0.05 mg/kg” the concentration level is assumed to be 0.05 mg/kg). The upper bound for non quantifiable residue levels was assumed to correspond to the LOQ. Hence, the chronic exposure assessment was performed using the mean value derived from these “upper bound” concentration values. This approach was considered very conservative and was overestimating the real exposure.

2008 Annual Report on Pesticide Residues
138
EFSA Journal 2010; 8(6):1646
Table 5.3.1-1a: Mean residue level (mg/kg) for the commodities included in the 2008-2010 EU coordinated programmes used as input values for the long-term dietary exposure calculations.
Pesticide Apples Aubergines (egg plants)
Bananas Beans (without
pods)
Carrots Cauli-flower
Cucumbers Head cabbage
Leek Lettuce Mandarins Oats Oranges
Acephate Acetamiprid 0.0072 0.0076 0.0084 0.0168 0.0081 0.0067 Azinphos-methyl 0.0590 0.0200 0.0493 Azoxystrobin 0.0271 0.0118 0.0190 0.0288 0.0143 0.0166 0.0180 0.0092 0.0717 0.0151 0.0053 0.0166 Bifenthrin 0.0129 0.0226 0.0142 0.0131 0.0193 0.0226 0.0153 0.0152 Bromopropylate 0.0237 0.0157 0.0255 0.0279 Bupirimate 0.0097 0.0150 Buprofezin 0.4134 0.0124 0.0130 0.0153 0.0123 Captan 0.0625 0.0050 0.0196 0.0343 0.0288 0.0366 0.0313 Captan/Folpet sum 0.0536 0.0320 0.0653 Carbaryl 0.0259 0.0247 0.0153 0.0050 0.0179 0.0226 Carbendazim and benomyl 0.0188 0.0148 0.0346 0.0152 0.0347 0.0281 0.0129 0.0185
Chlormequat 0.0170 0.0700 Chlorothalonil 0.0240 0.0389 0.0177 0.0373 0.0051 0.0249 0.0129 0.0554 Chlorpropham (sum) 0.0332 0.0066 0.0180 0.0151 0.0147 0.0149
Chlorpyrifos 0.0200 0.0072 0.0356 0.0279 0.0194 0.0309 0.0138 0.0214 0.0229 0.0819 0.0317 Chlorpyrifos-methyl 0.0102 0.0141 0.0141 0.0154 0.1864 0.0169
Clofentezine 0.0135 0.0099 0.0103 0.0083 Cypermethrin (sum) 0.0140 0.0254 0.0353 0.0242 0.0244 0.0138 0.0306 0.0296 0.0292
Cyprodinil 0.0259 0.0143 0.0348 0.0193 0.0095 0.0050 0.0126 0.0311 0.0115 Deltamethrin 0.0084 0.0233 0.0356 0.0252 0.0227 0.0222 0.0273 0.0215 Diazinon 0.0187 0.0060 0.0125 0.0078 0.0068 0.0055 0.0091 0.0088 Dichlofluanid 0.0447 0.0313 0.0284 0.0156 0.0174 Dichlorvos 0.0050 0.0060

2008 Annual Report on Pesticide Residues
139
EFSA Journal 2010; 8(6):1646
Pesticide Apples Aubergines (egg plants)
Bananas Beans (without
pods)
Carrots Cauli-flower
Cucumbers Head cabbage
Leek Lettuce Mandarins Oats Oranges
Dicofol 0.0167 0.0430 0.0287 Dimethoate (sum) 0.0221 0.0155 0.0178 0.0128 0.0156 0.0137 0.0253 0.0147 0.0101 0.0116 Diphenylamine 0.1024 0.0348 0.0301 0.0388 0.0146 Dithiocarbamates 0.1306 0.1366 0.1203 0.0780 0.0438 0.1881 0.0866 0.2158 0.2396 0.296 0.1687 0.0883 Endosulfan (sum) 0.0068 0.0093 0.0240 0.0182 0.0161 0.0294 0.0162 0.0191 Fenarimol Fenhexamid 0.0277 0.0355 0.0347 0.0162 0.0058 0.1052 0.0168 Fenitrothion 0.0126 0.0066 0.0299 0.0131 0.0141 Fludioxonil 0.0213 0.0098 0.0122 0.0144 0.0215 0.0364 0.0259 Flusilazole 0.0050 Folpet 0.0154 0.0062 0.0466 0.0826 0.0275 Hexaconazole 0.0103 0.0072 0.0090 Hexythiazox 0.0051 0.0120 0.0107 0.0083 Imazalil 0.0366 0.1043 0.0366 0.0323 0.0052 1.2518 1.0343 Imidacloprid 0.0279 0.0160 0.0104 0.0052 0.0195 0.0070 0.0102 Indoxacarb 0.0177 0.0182 0.0156 0.0180 0.0346 0.0347 Iprodione 0.0251 0.0199 0.0177 0.0387 0.0197 0.0466 0.2744 0.0293 0.0143 Iprovalicarb 0.0137 0.0749 Kresoxim-methyl 0.0275 0.0169 0.0194 0.0121 0.0053 Lambda-cyhalothrin 0.0102 0.0071 0.0099 0.0148 0.0121 0.0137 0.0147 0.0163 0.0132 0.0123
Malathion (sum) 0.0066 0.0155 0.0459 0.0229 0.0050 0.0194 0.0153 0.0512 0.0312 Mepanipyrim 0.0102 Mepiquat Metalaxyl (sum) 0.0193 0.0207 0.0204 0.0347 0.0191 0.0406 Methamidophos 0.0046 0.0084 0.0173 0.0167 0.0377 Methidathion 0.0335 0.0321 0.0261 0.0313 Methiocarb (sum) 0.0529 0.0136 0.0254 0.0364 0.0687 Methomyl (sum) 0.0054 0.0187 0.0152 0.0140 0.0071 0.0236 0.0145 Myclobutanil 0.0194 0.0173 0.0161 0.0129 0.0300 0.0253 0.0154

2008 Annual Report on Pesticide Residues
140
EFSA Journal 2010; 8(6):1646
Pesticide Apples Aubergines (egg plants)
Bananas Beans (without
pods)
Carrots Cauli-flower
Cucumbers Head cabbage
Leek Lettuce Mandarins Oats Oranges
Oxamyl 0.0083 0.0111 0.0095 0.0221 Parathion 0.0213 Penconazole 0.0230 0.0136 Phosalone 0.0205 0.0153 0.0254 0.0310 Pirimicarb (sum) 0.0246 0.0170 0.0148 0.0274 0.0208 Pirimiphos-methyl 0.0050 0.0243 0.0139 0.0095 0.0332 0.0253 0.0986 0.0258 Prochloraz 0.1095 0.0554 Procymidone 0.0097 0.0106 0.0146 0.0138 0.0135 0.0212 0.0136 0.0058 0.0574 0.0142 Profenofos 0.0097 0.0161 0.0150 Propargite 0.0547 0.0067 0.0607 0.0354 0.0356 Pyrethrins 0.0379 0.1654 0.2652 0.0860 Pyrimethanil 0.0258 0.0164 0.0046 0.0646 0.0307 0.0244 0.0084 0.0145 0.0319 0.0371 Pyriproxyfen 0.0051 0.0146 0.0084 0.0079 Quinoxyfen Spiroxamine 0.0324 0.0053 0.0335 0.0167 0.0349 Tebuconazole 0.0215 0.0156 0.0365 0.0226 0.0348 0.0180 0.0328 Tebufenozide 0.0218 0.0078 0.0279 Thiabendazole 0.0774 0.0055 0.0829 0.0224 0.0226 0.0201 0.0051 0.3494 0.3765 Thiophanate-methyl 0.0230 0.0107 0.0191 0.0099
Tolclofos-methyl 0.0130 0.0171 Tolylfluanid 0.0500 0.0196 0.0671 Triadimefon (sum) 0.0200 0.0063 0.0601 0.0375 0.0308 Trifloxystrobin 0.0117 0.0010 0.0092 0.0082 0.0095 0.0110 0.0084 Vinclozolin (sum) 0.0231 0.0178 0.0115 0.0146

2008 Annual Report on Pesticide Residues
141
EFSA Journal 2010; 8(6):1646
Table 5.3.1-1b: Mean residue level (mg/kg) for the commodities included in the 2009-2010 EU coordinated programmes used as input values for the long-term dietary exposure calculations. Empty cells refer to pesticide/crop combinations for which residues above the reporting level were not measured. Pesticides Peaches Pears Peas
(without pods)
Peppers Potatoes Rice Rye Spinach Straw-berries
Table grapes
Tomatoes Wheat
Acephate 0.0174 0.0082 0.0052 0.0328 Acetamiprid 0.0085 0.0101 0.0095 0.0119 0.0056 0.0054 0.0078 Azinphos-methyl 0.0783 0.0325 0.0152 0.0066 0.0239 Azoxystrobin 0.0131 0.0318 0.0143 0.0209 0.0150 0.0164 0.0418 0.0263 0.0245 0.0154 Bifenthrin 0.0188 0.0161 0.0221 0.0159 0.0261 0.0219 0.0203 0.0052 Bromopropylate 0.0185 0.0245 0.0346 0.0194 0.0213 Bupirimate 0.0127 0.0126 0.0162 0.0171 0.0159 0.0127 Buprofezin 0.0300 0.0167 0.0267 0.0270 0.0318 0.0231 0.0369 Captan 0.0248 0.0293 0.0289 0.0526 0.0652 0.0106 Captan/Folpet sum 0.0786 0.0626 0.0344 0.0252 Carbaryl 0.0262 0.0252 0.0272 0.0209 0.0670 0.0728 Carbendazim and benomyl 0.0117 0.0280 0.0050 0.0462 0.0162 0.0115 0.0204 0.0098 0.0090 0.0440 0.0050
Chlormequat 0.0304 0.1499 0.0873 Chlorothalonil 0.0184 0.0465 0.0224 0.0183 0.0301 0.0109 0.0277 Chlorpropham (sum) 0.0226 0.0180 0.2754 0.0176 0.0347 0.0095
Chlorpyrifos 0.0195 0.0271 0.0292 0.0157 0.0178 0.0704 0.0205 0.0253 0.0250 0.0203 0.0305 Chlorpyrifos-methyl 0.0141 0.0178 0.0162 0.0236 0.0180 0.0163 0.0157 0.0133 0.0180 0.0231
Clofentezine 0.0127 0.0162 0.0122 Cypermethrin (sum) 0.0223 0.0328 0.0331 0.0222 0.0348 0.0290 0.0372 0.0207
Cyprodinil 0.0228 0.0180 0.0167 0.0188 0.0092 0.0533 0.0733 0.0195 Deltamethrin 0.0217 0.0396 0.0290 0.0204 0.0380 0.0277 0.0315 0.0220 0.0280 0.0513 Diazinon 0.0105 0.0107 0.0070

2008 Annual Report on Pesticide Residues
142
EFSA Journal 2010; 8(6):1646
Pesticides Peaches Pears Peas (without
pods)
Peppers Potatoes Rice Rye Spinach Straw-berries
Table grapes
Tomatoes Wheat
Dichlofluanid 0.0151 0.0154 0.0165 0.0235 0.0335 Dichlorvos 0.0050 0.0227 0.0363 0.0318 Dicofol 0.0065 0.0225 0.0503 0.0220 0.0145 0.0441 0.0477 Dimethoate (sum) 0.0158 0.0127 0.0102 0.0141 0.0123 0.0276 0.0161 0.0154 0.0139 0.0269 0.0329 Diphenylamine 0.0266 0.1023 0.0160 0.0055 0.0052 0.0349 Dithiocarbamates 0.0771 0.2062 0.0656 0.0542 0.0400 0.0966 0.1046 0.1127 0.1287 Endosulfan (sum) 0.0168 0.0212 0.0244 0.0173 0.0177 0.0302 0.0296 0.0283 0.0567 Fenarimol 0.0154 0.0231 0.0155 0.0108 0.0135 Fenhexamid 0.0425 0.0274 0.1040 0.0927 0.0396 Fenitrothion 0.0342 0.0127 0.0106 0.0196 0.0099 Fludioxonil 0.0185 0.0293 0.0153 0.0188 0.0158 0.0456 0.0466 0.0238 Flusilazole 0.0278 0.0051 0.0275 0.0133 Folpet 0.0153 0.0180 0.0300 0.1824 0.0229 Hexaconazole 0.0092 0.0130 0.0146 0.0115 Hexythiazox 0.0324 0.0117 0.0182 0.0271 0.0223 0.0198 Imazalil 0.0470 0.0752 0.0739 0.0198 0.0218 0.0650 0.0532 0.0551 Imidacloprid 0.0154 0.0132 0.0205 0.0108 0.0074 0.0084 0.0140 0.0134 0.0142 Indoxacarb 0.0205 0.0198 0.0208 0.0215 0.0256 0.0300 0.0198 Iprodione 0.1116 0.0693 0.0113 0.0499 0.0252 0.0251 0.0420 0.0806 0.0363 0.0245 Iprovalicarb 0.0123 0.0277 Kresoxim-methyl 0.0215 0.0183 0.0230 0.0311 0.0214 0.0081 Lambda-cyhalothrin 0.0159 0.0189 0.0119 0.0200 0.0135 0.0101 0.0093
Malathion (sum) 0.0208 0.0306 0.0268 0.0220 0.0329 0.0501 0.0198 0.0324 0.0263 0.0138 0.1721 Mepanipyrim 0.0360 0.0106 0.0130 Mepiquat 0.0200 0.0067 0.0109 Metalaxyl (sum) 0.0331 0.0472 0.0203 0.0180 0.0238 0.0196 0.0314 0.0230 0.0261 Methamidophos 0.0055 0.0058 0.0148 0.0131 0.0086 0.0344 Methidathion 0.0158 0.0066 0.0150 Methiocarb (sum) 0.0499 0.0132 0.0478 0.0488 0.0580

2008 Annual Report on Pesticide Residues
143
EFSA Journal 2010; 8(6):1646
Pesticides Peaches Pears Peas (without
pods)
Peppers Potatoes Rice Rye Spinach Straw-berries
Table grapes
Tomatoes Wheat
Methomyl (sum) 0.0227 0.0211 0.0329 0.0118 0.0127 0.0156 0.0123 0.0170 Myclobutanil 0.0150 0.0149 0.0164 0.0241 0.0230 0.0191 Oxamyl 0.0275 0.0086 0.0078 0.0288 Parathion 0.0213 Penconazole 0.0193 0.0183 0.0234 0.0246 0.0180 0.0061 Phosalone 0.0215 0.0374 0.0134 0.0162 Pirimicarb (sum) 0.0348 0.0257 0.0268 0.0031 0.0164 0.0304 0.0349 Pirimiphos-methyl 0.0243 0.0134 0.0395 0.0485 0.0292 0.0561 Prochloraz 0.0074 0.0216 0.0218 0.0150 Procymidone 0.0452 0.0265 0.0202 0.0254 0.0157 0.0272 0.0303 0.0216 Profenofos 0.0321 0.0395 0.0106 0.0151 Propargite 0.0668 0.0276 0.0160 0.0302 0.0066 0.0506 0.0556 Pyrethrins 0.1685 0.0102 0.1412 Pyrimethanil 0.0148 0.0457 0.0069 0.0194 0.0180 0.0312 0.0552 0.0212 Pyriproxyfen 0.0198 0.0050 0.0175 Quinoxyfen 0.0142 0.0119 0.0153 Spiroxamine 0.0052 0.0197 0.0350 0.0026 Tebuconazole 0.0222 0.0392 0.0309 0.0146 0.0247 0.0736 0.0211 0.0311 0.0650 Tebufenozide 0.0107 0.0209 0.0271 0.0254 0.0349 Thiabendazole 0.0176 0.0550 0.0264 0.0181 0.0169 0.0350 0.0326 0.0230 Thiophanate-methyl 0.0365 0.0142 0.0050 0.0752 0.0600 0.0507 0.0657
Tolclofos-methyl 0.0150 0.0105 0.0151 0.0151 Tolylfluanid 0.0170 0.0671 0.0712 0.0694 Triadimefon (sum) 0.0315 0.0398 0.0173 0.0318 0.0371 0.0717 0.0333 0.0219 0.0287 Trifloxystrobin 0.0084 0.0090 0.0108 0.0157 0.0161 0.0129 Vinclozolin (sum) 0.0151 0.0115 0.0119 0.0157 0.0149 0.0163

2008 Annual Report on Pesticide Residues
144
EFSA Journal 2010; 8(6):1646
5.3.2. Processing/peeling factors
In case the 1st tier calculation exceeded the ADI (see Figure 5.3-1), the processing/peeling factors were applied to refine the TMDI calculations. These factors have been selected from the German database25 developed by the Federal Institute for Risk Assessment (BfR), which includes a collection of processing factors from annually published reports and evaluations by the FAO/WHO Joint Meeting on Pesticide Residues (JMPR), from draft assessment reports (DAR) prepared in the European Pesticide Risk Assessment Peer Review programme (PRAPeR) and from residue data which have been submitted within the framework of national authorisation procedures. Additional data concerning pulp/peel distribution have been provided to BfR by retailers and have been collected within the framework of national food monitoring programmes.
The processing/peeling factors applied to refine the TMDI intake calculation are reported in Table 5.3.2-1.
Table 5.3.2-1: Processing/peeling factors applied in the refined TMDI calculations.
Pesticide Crop PF Processed crop Dithiocarbamates Oranges 0.88 Orange pulp Dithiocarbamates Banana 0.02 Banana pulp
5.3.3. Acceptable Daily Intake values (ADIs)
The long-term risk assessment requires a comparison between the exposure calculated with the mean pesticide residue levels consumed and the ADI. The list of the ADIs used for the assessment of the chronic exposure is reported in Table 5.3.3-1.
Table 5.3.3-1: ADI values used as input values for the long-term risk assessment
Pesticide ADI (mg/kg bw/d)
ADI (*) evaluation year
ADI source
Acephate 0.03 2005 JMPR Acetamiprid 0.07 2004 COM Aldicarb 0.003 1995 JMPR Azinphos-methyl 0.005 2006 COM Azoxystrobin 0.2 2009 PRAPeR Bifenthrin 0.015 2008 EFSA Bromopropylate 0.03 1993 JMPR Bupirimate 0.05 2007 DAR Buprofezin 0.01 2008 EFSA Captan 0.1 2009 EFSA Carbaryl 0.0075 2006 EFSA Carbendazim/benomyl (1) 0.02 2007 COM Chlormequat (8) 0.031 2008 EFSA Chlorothalonil 0.015 2006 COM Chlorpropham 0.05 2003 COM Chlorpyrifos 0.01 2005 COM Chlorpyrifos-methyl 0.01 2005 COM
25 The database is available at http://www.bfr.bund.de/cd/579 (BfR compilation of 2009-07-01).

2008 Annual Report on Pesticide Residues
145
EFSA Journal 2010; 8(6):1646
Pesticide ADI (mg/kg bw/d)
ADI (*) evaluation year
ADI source
Clofentezine 0.02 2009 EFSA Cypermethrin (2) 0.015 2004 COM Cyprodinil 0.03 2005 EFSA Deltamethrin 0.01 2002 COM Diazinon 0.0002 2006 EFSA Dichlofluanid 0.007 2000 NL Dichlorvos n.d. 2006 EFSA Dicofol 0.002 1992 JMPR Dimethoate 0.001 2006 EFSA Diphenylamine 0.075 2008 EFSA Dithiocarbamates (3) 0.006 2004 COM Endosulfan 0.006 1998 JMPR Fenarimol 0.01 2007 COM Fenhexamid 0.2 1998 COM Fenitrothion 0.005 2006 EFSA Fludioxonil 0.37 2007 EFSA Flusilazole (general population) 0.002 2007 COM Folpet 0.1 2009 EFSA Folpet/Captan 0.1 2009 EFSA Hexaconazole 0.005 1990 JMPR Hexythiazox 0.03 1991 JMPR Imazalil 0.025 1997 COM Imidacloprid 0.06 2008 EFSA Indoxacarb 0.006 2005 COM Iprodione 0.06 2002 COM Iprovalicarb 0.015 2002 COM Kresoxim-methyl 0.4 1998 COM lambda-Cyhalothrin 0.005 2001 COM Malathion 0.03 2009 EFSA Mepanipyrim 0.02 2004 COM Mepiquat 0.2 2008 EFSA Metalaxyl (4) 0.08 2002 COM Methamidophos 0.001 2007 COM Methidathion 0.001 1992 JMPR Methiocarb (aka mercaptodimethur) 0.013 2006 EFSA Methomyl/thiodicarb (5) 0.0025 2008 EFSA Myclobutanil 0.025 2009 EFSA Omethoate 0.0003 2006 EFSA Oxamyl 0.001 2005 EFSA Oxydemeton-methyl 0.0003 2006 EFSA Parathion 0.006 2001 ECCO Penconazole 0.03 2008 EFSA Phosalone 0.01 2006 EFSA Pirimicarb 0.035 2006 EFSA Pirimiphos-methyl 0.004 2005 EFSA Prochloraz 0.01 2001 JMPR Procymidone 0.0028 2007 DAR(6)/COM Profenofos 0.03 2007 JMPR Propargite 0.007 2007 DAR Pyrethrins 0.04 2003 JMPR

2008 Annual Report on Pesticide Residues
146
EFSA Journal 2010; 8(6):1646
Pesticide ADI (mg/kg bw/d)
ADI (*) evaluation year
ADI source
Pyrimethanil 0.17 2006 EFSA Pyriproxyfen 0.1 2009 EFSA Quinoxyfen 0.2 2003 COM Spiroxamine 0.025 1999 COM Tebuconazole 0.03 2008 EFSA Tebufenozide 0.02 2007 EFSA Thiabendazole 0.1 2001 COM Thiophanate-methyl 0.08 2005 COM Tolclofos-methyl 0.064 2005 EFSA Tolylfluanid 0.1 2005 EFSA Triadimefon/triadimenol (7) 0.03 2004 JMPR Triadimenol 0.05 2008 EFSA Trifloxystrobin 0.1 2003 COM Vinclozolin 0.005 2006 COM (*) For the long-term risk assessment the most recent ADIs available were used. It should be mentioned that some of the ADI
values were derived recently and were not in place in 2007 when the monitoring results were generated. (1) ADI derived for carbendazim is used for risk assessment of carbendazim and benomyl. (2) ADI derived for alpha-cypermethrin. (3) The group of dithiocarbamates includes seven pesticides with different toxicological reference values: A group-ADI is not
available. The risk assessment was performed with both the value for ziram which is the lowest ADI and the value for mancozeb which is the most commonly used dithiocarbamate.
(4) ADI for metalaxyl-M. (5) ADI derived for methomyl is used for risk assessment of methomyl and thiodicarb. (6) DAR = Draft Assessment Report prepared in the framework of the active substance peer-review under Directive
EEC/91/414 (re-submission of the dossier). (7) ADI for triadimenol is used for risk assessment of triadimenol and triadimefon. (8) ADI value derived for chlormequat chloride was recalculated by applying a molecular weight correction factor to
chlormequat.
5.3.4. Presentation of the results of the long-term consumer exposure
For each pesticide, the chronic risk assessment is performed for all 27 diets of the EFSA PRIMo model. The results of the TMDI calculation are reported separately for each pesticide in an exposure assessment summary report. The summary reports can be found in Appendix IV of this report. For each of the 27 diets, the three commodities representing the largest proportion of the ADI exhaustion are reported, together with the total dietary intake for that commodity as a proportion of the ADI. If the ADI was not exceeded in any diet, a chronic consumer risk can be excluded. In addition, a chart is included in the calculation spreadsheets for each pesticide which presents the contribution of the residues on individual crops to the overall dietary exposure in the individual diets included in the EFSA PRIMo.
5.3.5. Limitations and uncertainties affecting the chronic exposure assessment
The calculation of the modified TMDI is affected by uncertainties related to the following aspects:
• Model uncertainties – e.g. the use of the mean “middle class” approach for the residues above the limit of quantification and “upper class” for the residues below the limit of quantification
• Measurement uncertainty of residue level
• Lack of processing/peeling factors
• Food consumption data: lack of detailed knowledge of consumption of processed products
A qualitative estimation of uncertainties and the constraints of the model used for assessing potential chronic consumer risks are reported elsewhere (EFSA 2009).

2008 Annual Report on Pesticide Residues
147
EFSA Journal 2010; 8(6):1646
The methodology applied to assess the long-term risk, based on the modified TMDI calculations, is expected to over-estimates the actual dietary exposure and the potential consumer risk when using monitoring data.
5.4. Results of the long-term risk assessment
The 2008 EU coordinated monitoring programme included 79 active substances or group of substances.
The detailed results of the TMDI calculations for the substances for which the risk assessment was carried out are reported separately for each pesticide in Appendix IV to this report. In Table 5.4-1, the highest estimated exposure for each pesticide assessed, expressed in percent of the ADI, is reported.

2008 Annual Report on Pesticide Residues
148
EFSA Journal 2010; 8(6):1646
Table 5.4-1: Summary results of the long-term risk assessment.
Pesticide TMDI max (% ADI)
Acephate 0.4 Acetamiprid 0.2 Aldicarb n.a. (*) Azinphos-methyl 16 Azoxystrobin 0.3 Bifenthrin 2.4 Bromopropylate 1.6 Bupirimate 0.4 Buprofezin 10 Captan 1.1 Carbaryl 8.5 Carbendazim/benomyl (1) 2.5 Chlormequat (chloride) 3 Chlorothalonil 3.2 Chlorpropham 1.1 Chlorpyrifos 8.1 Chlorpyrifos-methyl 4.4 Clofentezine 1 Cypermethrin (2) 2.9 Cyprodinil 1.9 Deltamethrin 7.2 Diazinon 151.2 Dichlofluanid 9.8 Dichlorvos (3) - Dicofol 14.8 Dimethoate/omethoate (4) - Diphenylamine 2 Dithiocarbamates (5) 89.2 Endosulfan 11.9 Fenarimol 0.6 Fenhexamid 0.3 Fenitrothion 5.5 Fludioxonil 0.1 Flusilazole 5.9 Folpet 0.6 Folpet/captan (6) 0.8 Hexaconazole 1.4 Hexythiazox 0.6 Imazalil 21.6 Imidacloprid 0.8
Pesticide TMDI max (% ADI)
Indoxacarb 5.9 Iprodione 1.3 Iprovalicarb 0.4 Kresoxim-methyl 0.1 lambda-Cyhalothrin 5.1 Malathion 5.7 Mepanipyrim 0.2 Mepiquat 0.1 Metalaxyl (7) 0.8 Methamidophos 17.7 Methidathion 56.6 Methiocarb (aka mercaptodimethur) 2.4
Methomyl/thiodicarb (8) 9.9 Myclobutanil 1.7 Oxamyl 14.2 Oxydemeton-methyl n.a. (*) Parathion 0.6 Penconazole 1.2 Phosalone 4.3 Pirimicarb 1.4 Pirimiphos-methyl 17.3 Prochloraz 2.9 Procymidone 9.7 Profenofos 0.4 Propargite 14 Pyrethrins 2.1 Pyrimethanil 0.4 Pyriproxyfen 0.1 Quinoxyfen 0.0 Spiroxamine 2.1 Tebuconazole 2.9 Tebufenozide 1.8 Thiabendazole 2.9 Thiophanate-methyl 0.7 Tolclofos-methyl 0.1 Tolylfluanid 0.8 Triadimefon/triadimenol (9) 1.8 Trifloxystrobin 0.2 Vinclozolin 3.1
(*) n.a. = no residue measured above the LOQ in all crops. (1) The toxicological reference values used for carbendazim. (2) Toxicological reference values for alpha-cypermethrin. (3) Toxicological reference values not derived as EFSA could not conclude on the reference values due to insufficient data. (4) Due to the residue definition set for dimethoate and omethoate and the format used to report the residue level data the
long-term exposure assessment was not conclusive. (5) Toxicological reference values for ziram. (6) Toxicological reference values for folpet. (7) Toxicological reference values for metalaxyl-M. (8) Toxicological reference values for methomyl. (9) Toxicological reference values for triadimenol

2008 Annual Report on Pesticide Residues
149
EFSA Journal 2010; 8(6):1646
For dichlorvos, no ADI was established; therefore, no chronic risk assessment could be performed for this substance.
For dimethoate and omethoate the chronic risk assessment is inconclusive (see section 5.4.2).
With the exception of diazinon, for all remaining substances or groups of substances the estimated exposure was below the ADI value. Based on the current scientific knowledge, for these compounds a long-term consumer health risk can be excluded. Furthermore, it is noted that, for 95% of the 79 substances assessed, the estimated exposure accounts for less than 25 % of the ADI and that for two pesticides (aldicarb and oxydemeton-methyl) no positive detections above the LOQ were measured in any of the crops concerned.
5.4.1. Pesticides for which a chronic risk could not be excluded
5.4.1.1. Diazinon
The maximum estimated TMDI for diazinon, calculated under the assumptions reported in section 5.3 was equivalent to 151% of the ADI (Figure 5.4.1.1-1); the ADI was exceeded in only one diet (German child population).
It is noted that the major contributor to the German child total exposure is due to residues of diazinon measured in apples and that the intake from apples alone was more than 100% of the ADI (113% ). However, it is also noted that the German apple consumption data used for the long-term exposure calculation comprise processed and unprocessed apples. 80% of the reported apple consumption refers to processed apple products, mainly apple juice (BfR, 2009). Processing studies demonstrated that the processing of apples to juice significantly reduces the diazinon residues (processing factors for raw and pasteurised apple juice: 0.02 and 0.01, respectively, EFSA, 2006). Thus, EFSA concludes that the long-term consumer exposure to diazinon residues is not likely to exceed the ADI. Thus, also for diazinon, no long-term consumer risk is expected.
The authorisations for plant protection products containing diazinon had to be withdrawn by 6 December 2007 at European level. Any period of grace granted by Member States had to expire on 6 December 2008 at the latest. In December 2007 new, lower EC MRLs entered into force.

2008 Annual Report on Pesticide Residues
150
EFSA Journal 2010; 8(6):1646
Figure 5.4.1.1-1 Estimated long-term exposure (TMDI) for diazinon, expressed in percent of the diazinon ADI.
Due to the change in the authorisation status of products containing diazinon in Europe (the use of diazinon was authorised until December 2007) it is assumed that crops treated legally in 2007 with diazinon, were still on the EC market in 2008. Out of the 1,423 apple samples taken in 2008 in national control programmes, 18 samples contained quantifiable diazinon residues above the reporting level. The MRL was exceeded in 13 samples; of these samples, six were of European origin. It is expected that the residue levels of diazinon will decrease in 2009 following the restrictions regarding authorisation. Nevertheless, it is recommended that control of diazinon residues in food commodities continue.
Member States are recommended to check for the possible misuses at national level on domestic products and check if the LOQ MRLs for the imported products are exceeded.
5.4.2. Pesticides for which the chronic risk assessment was not conclusive
5.4.2.1. Dimethoate/omethoate
Although dimethoate and omethoate belong to the same chemical group, the toxicological properties differ significantly (dimethoate: 0.001 mg/kg body weight/day; omethoate: 0.0003 mg/kg body weight /day). For a more accurate risk assessment, the residue concentrations for the two compounds should
0.00
10.00
20.00
30.00
40.00
50.00
60.00
70.00
80.00
90.00
100.00
110.00
120.00
130.00
140.00
150.00
160.00
Intake
in % of A
DI
Wheat
Rye
Rice
Oats
Leek
Peas (without pods)
Beans (without pods)
Spinach
Lettuce
Head cabbage
Cauliflower
Cucumbers
Aubergines (egg plants)
Peppers
Tomatoes
Carrots
Potatoes
Bananas
Strawberries
Table grapes
Peaches
Pears
Apples
Mandarins
Oranges

2008 Annual Report on Pesticide Residues
151
EFSA Journal 2010; 8(6):1646
be reported separately. In 2008, the residue concentrations were only reported in accordance with the enforcement residue definition as the sum of the two compounds.
On the basis of the data available, the assessment can only be considered to be exploratory and not conclusive.
If all residues reported are assumed to be dimethoate, 63% of the ADI set for dimethoate was exhausted. This situation does not represent a potential risk for the consumer. Alternatively, if all measured residues were attributed to the more toxic omethoate, the ADI would be exceeded by eight diets, being the 210% of the omethoate ADI exceeded in the most critical diet; in this case, the main food contributor to the consumer exposure was apples (89% of the ADI). As this crop can be consumed unprocessed a refined calculation of the long-term consumer exposure could not be performed by applying a processing factor.
EFSA reiterates the recommendations derived in paragraph 5.2.1.8 regarding the need to revise the residue definition and the format for reporting residue results in the framework of the monitoring exercise.
5.4.3. Pesticides for which the chronic risk assessment could not be performed
5.4.3.1. Dichlorvos
The toxicological assessment of dichlorvos revealed data gaps in the dossier which did not allow for conclusion on toxicological reference values for dichlorvos (see section 7.2.3.1). Therefore, no long-term risk assessment could be carried out.
It should be noted that, in Europe, the authorisation for the use of products containing dichlorvos should have been withdrawn by December 2007; any period of grace granted by Member States had to expire on December 2008 at the latest.
From the 2008 data available it is noted that quantifiable residues have been measured in samples of several food commodities; the majority of these food samples were produced in Europe. These results indicated that dichlorvos was still used in Europe in 2007 and/or 2008. Based on the available data, an exposure of 0.76 µg/kg body weight was calculated for the most critical diet.
Therefore, EFSA recommends making efforts to derive toxicological reference values for dichlorvos on the basis of the open scientific literature and the available, limited scientific dossier and studies to allow a conclusion on the potential consumer risks due to dichlorvos residues measured in food samples.
5.4.3.2. Triazoles
The 2008 EU coordinated monitoring programme included seven pesticides belonging to the chemical class of triazoles (i.e. flusilazole, hexaconazole, myclobutanil, penconazole, tebuconazole, and triadimenol/triadimefon). The use of some of these substances is now no longer authorised in Europe, but the triazole pesticides have been used extensively as a fungicide in many different crops in the past since the early 1980’s and many others, which are not included in the EU monitoring programme, are currently in use.
Based on the available information on the plant metabolism of these chemicals (e.g. in the dossiers submitted for the peer-review of the substances under Directive 91/414/EEC) it is known that triazoles pesticides may be metabolised to four main compounds: 1,2,4-triazole (free acid), triazole alanine (TA), triazole lactic acid and triazole acetic acid (TAA). The formation of these triazole derivative

2008 Annual Report on Pesticide Residues
152
EFSA Journal 2010; 8(6):1646
metabolites (TDMs) is very dependent on the substance and on the crops treated. Nevertheless, there are clear indications that triazole derivative metabolites are present in plant storage organs (e.g. cereal and oilseed grains) and rotational crops. From the scientific studies it is also evident that these metabolites are not always rapidly degraded and therefore may accumulate in the soil. Triazole metabolites are also present in animal commodities when livestock is fed with feeding stuff containing residues of triazole compounds. It is noted that, depending on the crop, the formation of TDMs is not observed in harvested crops (e.g. for myclobutanil in apples and grape26) or TDMs account for up to 90% of the total residues, while the parent compound is almost not present (e.g. penconazole in apple27). As an example, for myclobutanil, (included in the 2008 EU coordinated programme) the residue level of metabolites TA and TAA account for 51% and 25% of the total residues in wheat grains at harvest, while the residue of the parent compound amount to only 0.4% of the total residues; for penconazole (also included in the EU coordinated programme), the residue level of metabolites TA and TLA account for 23% and 67% of the total residues in apple, while no residue of the parent is detected in harvested apples. From the 2008 monitoring data it is noted that no countries have detected residues of myclobutanil (parent compound) above the reporting level in cereals in the 613 rice samples analysed; in fruit and vegetables myclobutanil was analysed in more than 51,000 samples and quantified in about 1,200 samples (2.3% of positive detections)28.
In 2006, an EFSA experts meeting considered these three metabolites as toxicologically relevant. Toxicological reference values were proposed for 1,2,4-triazole and the TAA (ADI: 0.02 mg/kg bw/day, ARfD: 0.06 mg/kg bw) and for TA (ADI and ARfD: 0.1 mg/kg bw/(day)). Even though these toxicological reference values are not as low as for many other pesticides the consumer may be exposed to a potential risk due to the presence of potentially significant residue levels in food commodities.
Currently, no EC MRL has been established for the triazole metabolites. An EFSA expert meeting highlighted the difficulty that would be encountered for the setting of the MRLs for the TDMs, because all triazole pesticides need to be considered and assessed together. Moreover, residue trials will most likely not be available for all triazole compounds. However, for the purpose of the actual assessment of the consumer’s exposure to TDMs in food useful, background information on the actual residue levels of triazole metabolites from current and past uses can be derived from monitoring programmes. For the future actual cumulative exposure assessment these monitoring data will be needed, as indicated in the draft EFSA scientific opinion (Guidance on the Use of the Probabilistic Methodology for Modelling Dietary Exposure to Pesticide Residues – Part one: single active substances exposure assessment29). Currently, no TDMs are included in the EU coordinated programme, nor Member States analyse for these compounds in the framework of national control programmes. As a result, EFSA recommends the inclusion in the future EU coordinated monitoring programmes the analysis of the triazole metabolites.
26 EFSA Conclusion on pesticide peer-review – peer review of the pesticide risk assessment of the active substance
myclobutanil; document available at http://www.efsa.europa.eu/en/scdocs/doc/298r.pdf 27 EFSA Conclusion on pesticide peer-review – peer review of the pesticide risk assessment of the active substance
penconazole; document available athttp://www.efsa.europa.eu/en/scdocs/doc/175r.pdf 28 The authorisations for plant protection products containing myclobutanil will have to be withdrawn by 31 December 2010
at EU level. Any period of grace granted by Member States will have to expire on 31 December 2011 at latest. 29 Part two of the EFSA scientific opinion will cover the multiple active substances exposure assessment, building up on the
methodology presented in the first part of the EFSA opinion.

2008 Annual Report on Pesticide Residues
153
EFSA Journal 2010; 8(6):1646
RECOMMENDATIONS In addition to the specific recommendations listed in Tables 5.2.1-2 and 5.2.2-2, EFSA derived recommendations to the Commission, the reporting countries, the EURLs and EFSA. On the basis of the analysis and evaluations of the 2008 monitoring data EFSA recommends to the European Commission the following:
• To keep included also in the future EU coordinated monitoring programmes the pesticides for which a theoretical consumer risk could not be excluded, could not be performed, or was not conclusive: azinphos-methyl, carbaryl, carbendazim/benomyl, chlormequat, chlorpropham, chlorpyriphos, cypermethrin, diazinon, dichlorvos, dimethoate/omethaote, dithiocarbamates, endosulfan, folpet/captan, imazalil, lambda-cyhalothrin, metamidophos, methidathion, methiocarb, methomyl/thiodicarb, oxamyl, parathion, procymidone and tebuconazole;
• To include in the future EU coordinated monitoring programmes the analysis of the triazole derivate metabolites: 1,2,4-triazole (free acid), triazole alanine, triazole lactic acid and triazole acetic acid;
• To report separately the individual compounds measured in the samples or to change the enforcement residue definition and establish separate MRLs for the pesticides and metabolites which are included in the same residue definition and which have different toxicological potencies (e.g. dimethoate/omethoate, folpet/captan and methomyl/thiodicarb);
• To amend the current enforcement residue definitions set for folpet/captan - “Sum of folpet and captan” - in the following crops into the definition used for the remaining crops (“folpet” and “captan”): pome fruits, strawberries, blackberries, raspberries, currants, gooseberries, tomatoes, beans (with pods), fresh beans (without pods).
• To revise the enforcement residue definitions set for pesticide residues in baby and infant food, so that they are in line with the residue definitions set for the raw commodities as in Regulation (EC) No 396/2005;
• To specify in future EU coordinated monitoring regulations that the analysis of baby-food samples shall be performed for all the pesticides listed in the baby-food legislation with specific MRLs and for all the pesticides listed in Annex I of the monitoring Regulations;
• To replace the sampling of the commodity beans without pods with beans with pods (i.e. green beans/French beans) in the EU coordinated monitoring programmes;
• To reconsider the minimum number of samples to be taken under the EU coordinated programme taking into account that the purpose of the EU coordinated programme is not only to identify the samples above the limit of quantification30 but also to assess the consumer exposure;
• To establish a database on the authorised GAPs and pesticide uses at national level.
In addition, EFSA recommends the following to the reporting countries:
• To implement the new format developed by EFSA for reporting the pesticide monitoring results;
• To put effort in recording and reporting the production method (e.g. conventional and organic) of the analysed samples;
• To implement more sensitive analytical methods that would allow enforcement of EC MRLs set at specified LOQ; this would also allow the performance of more accurate long-term
30 See recital (3) of Commission Recommendation 2008/103/EC (EC 2008a).

2008 Annual Report on Pesticide Residues
154
EFSA Journal 2010; 8(6):1646
consumer exposure assessment. If MRL LOQs cannot be achieved analytically, this should be notified;
• To ensure pesticide residues are analysed according to the residue definitions set in the European legislation;
• To report if difficulties are encountered in analysing the sample for the full enforcement residue definition. EFSA, the Commission, EFSA and the EURLs should follow-up on such problems identified and reconsider the residue definitions;
• To encourage the further investigation and the reporting of the possible reasons for the high number of multiple residue findings in single samples. In particular, to further investigate if the sample characteristics such as origin, producer and varieties are in line with Community methods of sampling for the official control;
• To report the possible reasons for the observed EC MRL exceedances; in particular for dithiocarbamate residues on spinach a high number of MRL exceeding samples was identified. The reason for this problem should be further investigated;
• To clearly indicate if, as a consequence of a sample exceeding the MRLs, the lot was not put on the market and therefore was not available for consumption;
• To ensure that the scope of the analytical methods used is compatible and includes as far as possible all residues included in the EU coordinated programme.
Furthermore, the European Reference Laboratories (EURLs) are recommended:
• To provide the reporting countries with more guidance in implementing analytical methods sufficiently sensitive for checking sample residue levels against the MRLs, in particular LOQ MRLs;
• To provide the reporting countries with more guidance on reporting the results of the baby and infant-food analysis and in the enforcement of the relevant residue definitions;
• To develop and support the reporting countries in implementing an analytical method for the analysis of the triazole derivate metabolites;
• To investigate possible solutions to identify the isomers of cypermethrin contributing to the total cypermethrin measured in food samples, as requested by the current legal enforcement residue definition.
Finally, EFSA is recommended:
• To derive tentative toxicological reference values for dichlorvos on the basis of open scientific literature and the available, limited scientific dossier and studies;
• To adapt the EFSA data model for the reporting of the results of the pesticide monitoring data. In particular, reporting countries should have the possibility to report if a lot which was found to exceed the MRL has been removed from the market before being consumed (e.g. lots rejected at the border before import to the EU, lots destroyed);
• To develop a methodology for the long-term risk assessment which will make use of the detailed results reported by the Member States according to the new reporting format developed by EFSA;
• To develop a methodology for assessing cumulative exposure; • To investigate possible improvements for the reporting of the results of the monitoring of the
veterinary medical product residues to allow the consideration of additional exposure sources; • To establish a database of the conversion factors for the enforcement residue definitions to the
risk assessment residue definitions.

2008 Annual Report on Pesticide Residues
155
EFSA Journal 2010; 8(6):1646
ACKNOWLEDGMENTS EFSA wishes to thank colleagues and contact points in the EU Member States and EEA countries for providing information, data, comments and clarifications on the pesticide monitoring programmes and results. EFSA also wishes to thank colleagues in the European Commission and the European Reference Laboratories for their collaboration. Finally, EFSA acknowledges the technical and scientific support provided by colleagues in the Food Institute of the Technical University of Denmark which assisted EFSA in the preparation of this report.

2008 Annual Report on Pesticide Residues
156
EFSA Journal 2010; 8(6):1646
REFERENCES BfR (Bundesinstitut für Risikobewertung), 2009. BfR-Modell zur Berechnung der Aufnahme von Pflanzenschutzmittel-Rückständen. Information Nr. 026/2009 des BfR vom 1. Juli 2009. http://www.bfr.bund.de/cd/10196.
Codex 1994. Codex Alimentarius, Pesticide Residues in Foodstuffs, Rome 1994, ISBN 92-5-20372271-1; Vol. 2, p. 72.
EC 1991a. Council Directive 91/414/EEC of 15 July 1991 concerning the placing of plant protection products on the market. Official Journal L 230, 19.08.1991, p. 1.
EC 1991b. Council Regulation (EEC) N° 2092/91 of 24 June 1991 on organic production of agricultural products and indications referring thereto on agricultural products and foodstuffs. OJ L 198, 22.07.1991, p. 1.
EC 1996a. Commission Directive 96/5/EC, of 16 February 1996 on processed cereal-based foods and baby foods for infants and young children. OJ L 049 , 28.02.1996, p. 17.
EC 1996b. Council Directive 96/23/EC of 29 April 1996 on measure to monitor certain substances and residues thereof in live animals and animal products and repealing Directives 85/358/EEC and 86/469/EEC and Decisions 89/187/EEC and 91/664/EEC. OJ L 125, 23.5.1996, p. 10.
EC 2000. Commission Regulation (EC) No 645/2000 of 28 March 2000 setting out detailed implementing rules necessary for the proper functioning of certain provisions of Article 7 of Council Directive 86/362 and of Article 4 of Council Directive 90/642/EEC concerning the arrangements for monitoring the maximum levels of pesticide residues in and on cereals and products of plant origin, including fruit and vegetables, respectively. OJ L 78, 29.3.2000, p. 7.
EC 2002. Commission Directive 2002/63/EC of 11 July 2002 establishing Community methods of sampling for the official control of pesticide residues in and on products of plant and animal origin and repealing Directive 79/7000/EEC. OJ L 187, 16.7.2002, p. 30.
EC 2003, Commission Directive 2003/13/EC of 10 February 2003 amending Directive 96/5/EC on processed cereal-based foods and baby foods for infants and young children. OJ L 41, 14.2.2003 , p. 33.
EC 2004. Regulation (EC) No 882/2004 of the European Parliament and of the Council of 29 April 2004 on the official controls performed to ensure the verification of compliance with feed and food law, animal health and animal welfare rules. OJ L 191, 28.5.2004, p. 1.
EC 2005a. Regulation (EC) No 396/2005 of the European Parliament and of the Council of 23 February 2005 on maximum residue levels of pesticides in or on food and feed of plant and animal origin and amending Council Directive 91/414/EECText with EEA relevance. Official Journal L 70, 16.3.2005, p 1-16
EC 2005b. Commission Regulation (EC) No 2076/2005 of 5 December 2005 laying down transitional arrangements for the implementation of Regulations (EC) No 853/2004, (EC) No 854/2004 and (EC) No 882/2004 of the European Parliament and of the Council and amending Regulations (EC) No 853/2004 and (EC) No 854/2004 (Text with EEA relevance). OJ L 338, 22.12.2005, p. 83.
EC 2006a, Commission Directive 2006/125/EC of 5 December 2006 on processed cereal-based foods and baby foods for infants and young children. OJ L 339, 6.12.2006, p. 16.

2008 Annual Report on Pesticide Residues
157
EFSA Journal 2010; 8(6):1646
EC 2006b, Commission Directive 2006/141/EC of 22 December 2006 on infant formulae and follow-on formulae and amending Directive 1999/21/EC. OJ L401, 30.12.2006, p. 1.
EC 2007a. Commission Recommendation No 2007/225/EC of 3 April 2007 concerning a coordinated Community monitoring programme for 2007 to ensure compliance with maximum residue levels of pesticide residues in and or cereals and certain other products of plant origin and national monitoring programmes for 2008. OJ L 96, 11.4.2007, p. 21.
EC 2007b. Method validation and quality control procedures for pesticide residues analysis in food and feed. Document No. SANCO/3131/2007.
EC 2008a. Commission recommendation of 4 February 2008 concerning a coordinated Community monitoring programme for 2008 to ensure compliance with maximum levels of pesticide residues in and on cereals and certain other products of plant origin and national monitoring programmes for 2009 (2008/103/EC). OJ L 36, 9.2.2008, p. 7.
EC 2008b. Commission Regulation (EC) No 1213/2008 of 5 December 2008 concerning a coordinated multiannual Community control programme for 2009, 2010 and 2011 to ensure compliance with maximum levels of and to assess the consumer exposure to pesticide residues in and on food of plant and animal origin. OJ L 328, 6.12.2008, p. 9.
EC 2008c. Commission Regulation (EC) No 149/2008 of 29 January 2008 amending Regulation (EC) No 396/2005 of the European Parliament and of the Council by establishing Annexes II, III and IV setting maximum residue levels for products covered by Annex I thereto. OJ L 58, 1.3.2008, p.1.
EC 2009. Commission Regulation (EC) No 1097/2009 of 16 November 2009 amending Annex II to Regulation (EC) No 396/2005 of the European Parliament and of the Council as regards maximum residue levels for dimethoate, ethephon, fenamiphos, fenarimol, methamidophos, methomyl, omethoate, oxydemeton-methyl, procymidone, thiodicarb and vinclozolin in or on certain products. OJ L 301 of 17.11.2009, p.6
EEC 1976. Council Directive 76/895/EEC of 23 November 1976 relating to the fixing of maximum levels for pesticide residues in and on fruit and vegetables. OJ L 340 of 09.12.1976, p.26.
EEC 1986a. Council Directive 86/362/EEC of 24 July 1986 on the fixing of maximum levels for pesticides residues in and on cereals. OJ L 221, 7.8.1986, p 37.
EEC 1986b. Council Directive 86/363/EEC of 24 July 1986 on the fixing of maximum levels for pesticides residues in and on foodstuffs of animal origin. OJ L 221, 7.8.1986, p 43.
EEC 1990. Council Directive 90/642/EEC of 27 November 1990 on the fixing of maximum levels for pesticides residues in and on certain products of plant origin, including fruit and vegetables. OJ L 350, 14.12.1990, p 71.
EEC 1991. Commission Directive 91/321/EEC of 14 May 1991 on infant formulae and follow-on formulae. OJ L 175, 04.07.1991, p. 35.
EFSA 2006. EFSA Conclusion regarding the peer review of the pesticide risk assessment of the active substance diazinon; http://www.efsa.europa.eu/en/scdocs/doc/85r.pdf
EFSA 2007. Reasoned opinion on the potential chronic and acute risk to consumers’ health arising from proposed temporary EU MRLs, 15 March 2007. http://www.efsa.europa.eu/en/scdocs/scdoc/32r.htm (accessed 11. Feb. 2009)

2008 Annual Report on Pesticide Residues
158
EFSA Journal 2010; 8(6):1646
EFSA 2009. Reasoned opinion of EFSA prepared by the Pesticides Unit (PRAPeR) on the 2007 Annual Report on Pesticide Residues. EFSA Scientific Report (2009) 305, 1-106. http://www.efsa.europa.eu/EFSA/efsa_locale-1178620753812_1211902667778.htm (accessed 11. Feb. 2009)
EFSA 2010. Technical Report of EFSA: Report for 2008 on the results from the monitoring of veterinary medical product residues and other substances in food of animal origin in the Member States. EFSA Journal (2010); 8(4): 1559. http://www.efsa.europa.eu/en/scdocs/scdoc/1559.htm FAO 2006. Pesticide residues in food - 2006. Report of the Joint Meeting of the FAO Panel of Experts on Pesticide Residues in Food and the Environment and WHO the Core Assessment Group. FAO Plant Production and Protection Paper, 187, 2006
FAO 2009. Pesticide residues in food - 2009. Report of the Joint Meeting of the FAO Panel of Experts on Pesticide Residues in Food and the Environment and WHO the Core Assessment Group. FAO Plant Production and Protection Paper, 196, 2009.
ISO 2005. General requirements for the competence of testing and calibration laboratories, ISO/IEC 17025:2005.
Maas 2006. Maas, F.. Carry-over effects of CCC-applications in pear orchards. Acta Hort. (ISHS) 727:125-132, 2006.
OECD 2009. OECD Environment, Health and Safety Publications. Series on Testing and Assessment No. 63. Guidance document on the definition of residue (as revised in 2009). ENV/JM/MONO(2009)30

2008 Annual Report on Pesticide Residues
159
EFSA Journal 2010; 8(6):1646
ABBREVIATIONS AND SPECIAL TERMS USED IN THE REPORT AT Austria
ADI Acceptable Daily Intake
ARfD Acute Reference Dose
BE Belgium
BG Bulgaria
COM European Commission
CY Cyprus
CZ Czech Republic
EURL European Reference Laboratory
DAR Draft Assessment Report
DE Germany
EE Estonia
EEA European Economic Area
EEC European Economic Community
EC European Commission
EFSA European Food Safety Authority
EFTA European Free Trade Association
ES Spain
EU European Union
FAO Food and Agricultural Organization
FI Finland
FR France
GAP Good Agricultural Practice
GP General Population
GR Greece
HU Hungary
HR Highest Residue measured in supervised filed trials

2008 Annual Report on Pesticide Residues
160
EFSA Journal 2010; 8(6):1646
HRM Highest Residue Measured in monitoring samples
IE Ireland
IESTI International Estimated Short Term Intake
IS Island
ISO/IEC The International Organization for Standardization/ International Electrotechnical Commission
IT Italy
JMPR Joint FAO/WHO Meeting on Pesticide Residues
LCI Lower Confidence Interval
LOQ Analytical Limit Of Quantification
LT Lithuania
LU Luxembourg
LV Latvia
MRL Maximum Residue Level
MT Malta
NL the Netherlands
NO Norway
PL Poland
PT Portugal
RO Romania
SE Sweden
SI Slovenia
SK Slovakia
UK the United Kingdom
PRIMo Pesticide Residue Intake Model
RASFF Rapid Alert System for Food and Feed
TDM Triazole derivate Metabolites
Third countries Any country that is neither a Member State nor a country from the EEA
TMDI Theoretical Maximum Daily Intake

2008 Annual Report on Pesticide Residues
161
EFSA Journal 2010; 8(6):1646
UCI Upper Confidence Interval
WHO World Health Organization

2008 Annual Report on Pesticide Residues
162
EFSA Journal 2010; 8(6):1646
APPENDICES