2008 – 2009 - broward county public web viewprior performance record ... a rti tracking sheet...
TRANSCRIPT
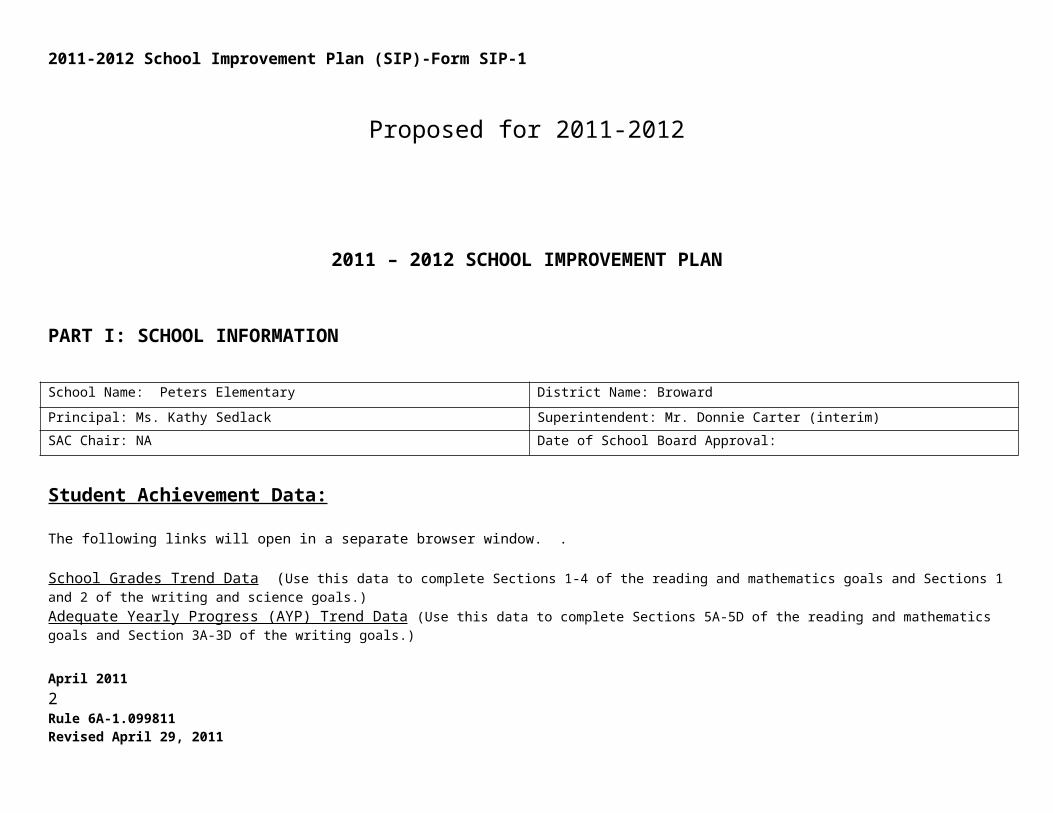
2011-2012 School Improvement Plan (SIP)-Form SIP-1
FLORIDA DEPARTMENT OF EDUCATION
School Improvement Plan (SIP)Form SIP-1
Proposed for 2011-2012
April 2011 1Rule 6A-1.099811Revised April 29, 2011
2011-2012 School Improvement Plan (SIP)-Form SIP-1
2011 – 2012 SCHOOL IMPROVEMENT PLAN
PART I: SCHOOL INFORMATION
School Name: Peters Elementary District Name: Broward
Principal: Ms. Kathy Sedlack Superintendent: Mr. Donnie Carter (interim)
SAC Chair: NA Date of School Board Approval:
Student Achievement Data:
The following links will open in a separate browser window. .
School Grades Trend Data (Use this data to complete Sections 1-4 of the reading and mathematics goals and Sections 1 and 2 of the writing and science goals.)Adequate Yearly Progress (AYP) Trend Data (Use this data to complete Sections 5A-5D of the reading and mathematics goals and Section 3A-3D of the writing goals.)Florida Comprehensive Assessment Test (FCAT) Trend Data (Use this data to inform the problem-solving process when writing goals.)
Highly Qualified Administrators
List your school’s highly qualified administrators and briefly describe their certification(s), number of years at the current school, number of years as an administrator, and their prior performance record with increasing student achievement at each school. Include history of school grades, FCAT performance (Percentage data for Proficiency, Learning Gains, Lowest 25%), and Adequate Yearly Progress (AYP).
Position Name Degree(s)/Certification(s)
Number of Years at Current School
Number of Years as an Administrator
Prior Performance Record (include prior School Grades, FCAT (Proficiency, Learning Gains, Lowest 25%), and AYP information along with the associated school year)
Principal Kathy Sedlack BS – Early Childhood Education for the Handicapped; Auburn University; M.Ed. – School Psychology;
3 6 Principal of Peters Elementary 2010-11.
Grade: A
April 2011 2Rule 6A-1.099811Revised April 29, 2011

2011-2012 School Improvement Plan (SIP)-Form SIP-1Florida Atlantic University
Ed.S. – Educational Leadership; Nova Southeastern University
Certified in:
PreK/Primary, Mentally Handicapped, School Psychologist, School Principal
Endorsements:
ESOL and Preschool Handicapped
Reading Mastery: 84%,
Math Mastery: 83%
Science Mastery:43%,
Writing Mastery: 97%
Learning gains:
71% reading
68% math
Learning gains of lowest 25%:
68% reading
65% math
AYP: White students did not meet criteria in reading. Black students did not meet AYP criteria in Math.
Principal of Peters Elementary 2009-10.
Grade: A
Reading Mastery: 79%, Math Mastery: 81%, Science Mastery:43%,
Writing Mastery: 87%
Learning gains:
65% reading
66% math
Learning gains of lowest 25%:
63% reading
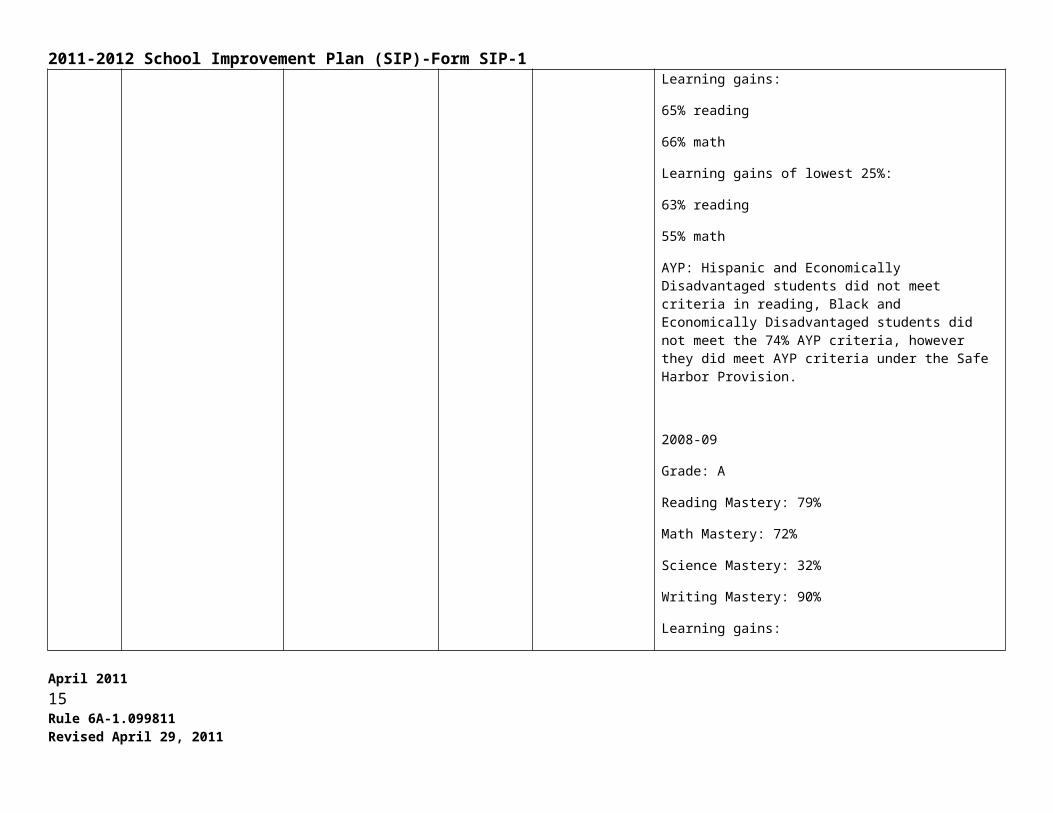
55% mathApril 2011 3Rule 6A-1.099811Revised April 29, 2011
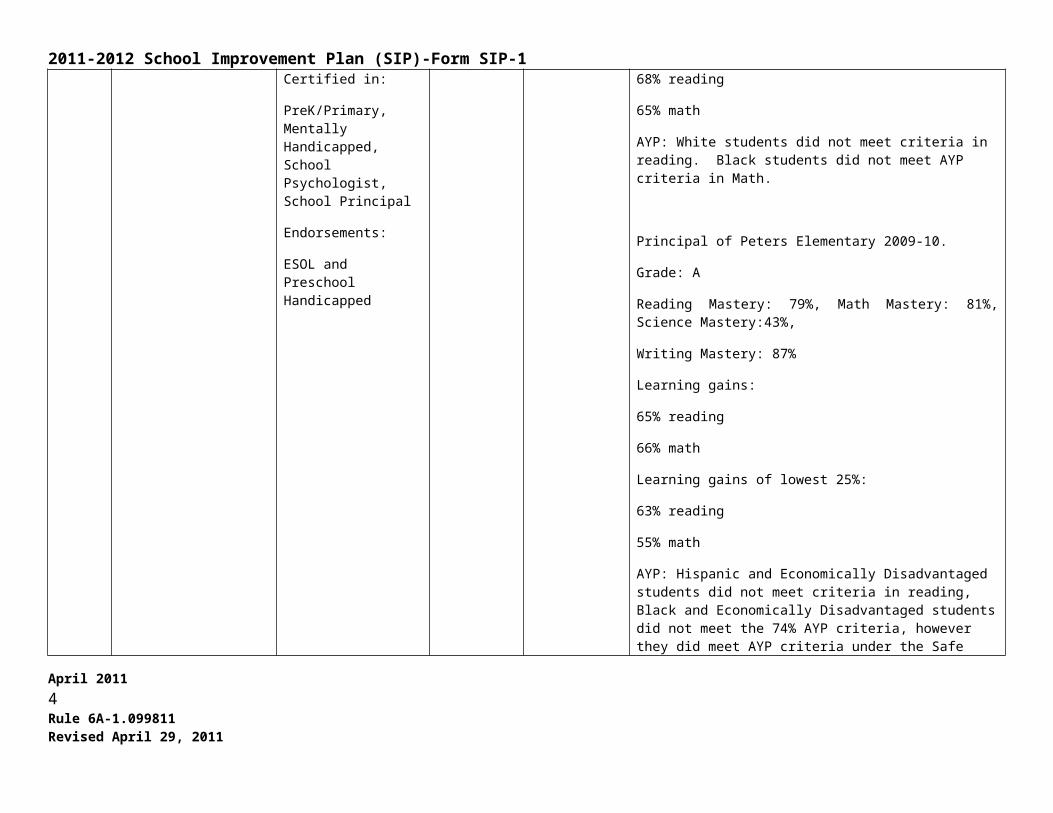
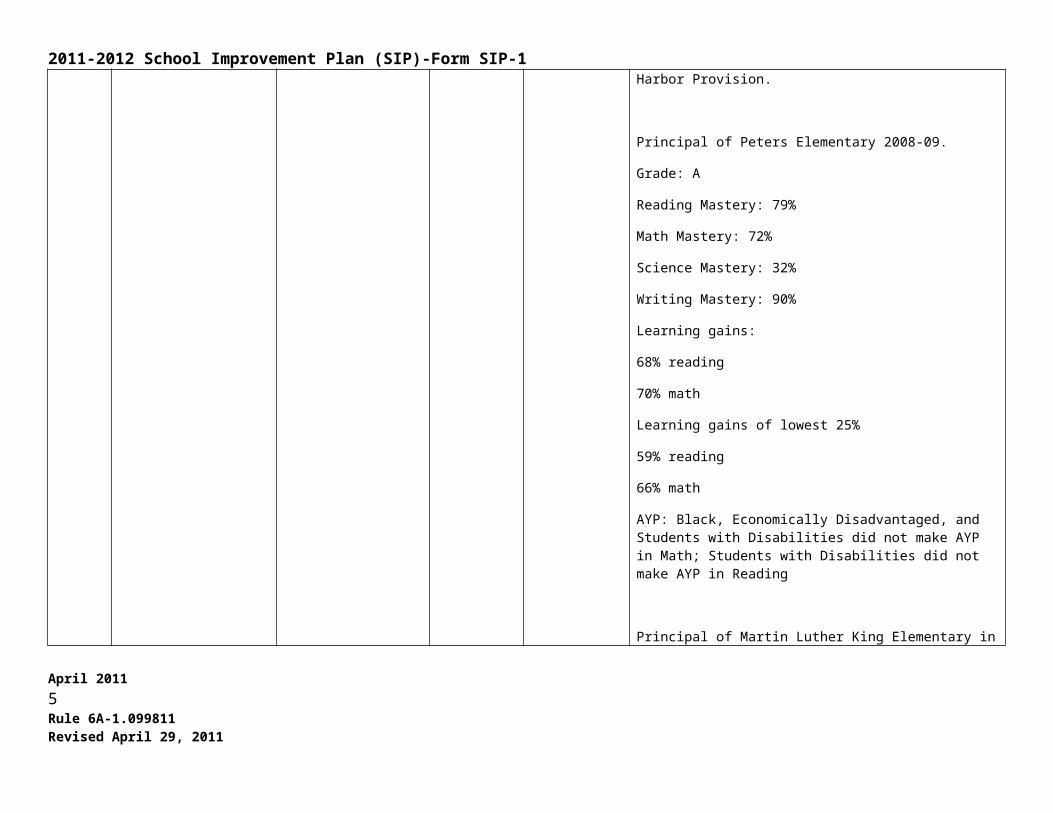
2011-2012 School Improvement Plan (SIP)-Form SIP-1AYP: Hispanic and Economically Disadvantaged students did not meet criteria in reading, Black and Economically Disadvantaged students did not meet the 74% AYP criteria, however they did meet AYP criteria under the Safe Harbor Provision.
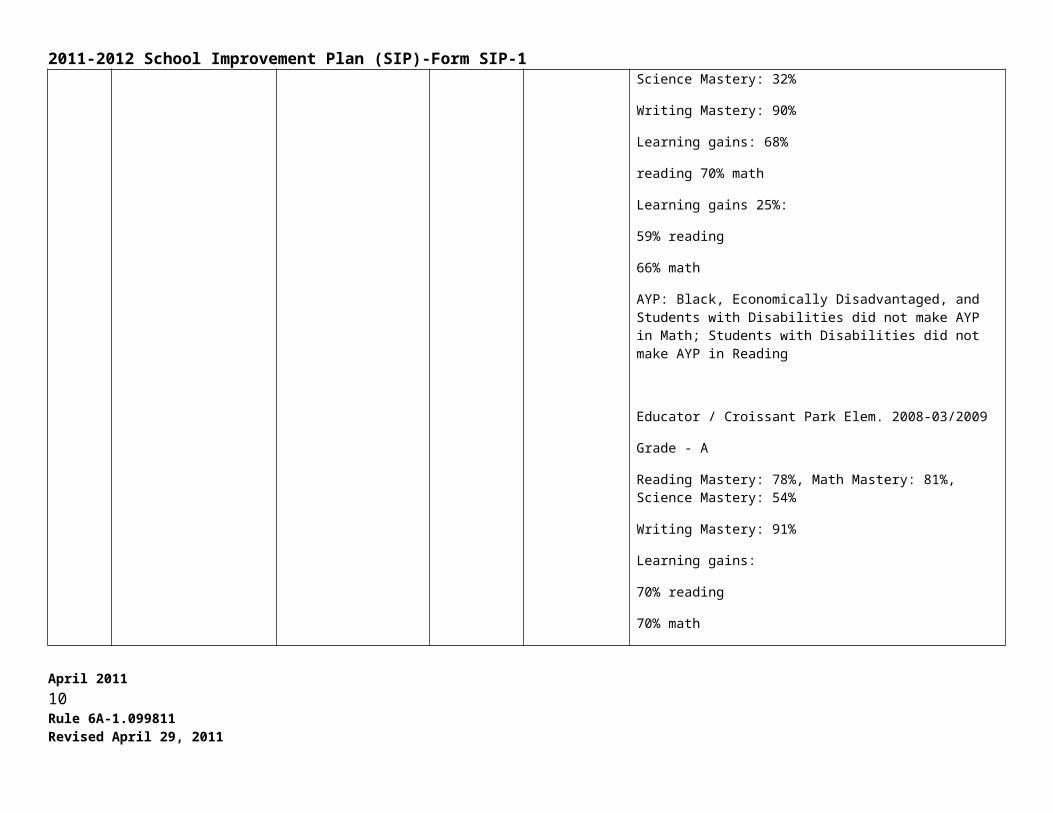
Principal of Peters Elementary 2008-09.
Grade: A
Reading Mastery: 79%
Math Mastery: 72%
Science Mastery: 32%
Writing Mastery: 90%
Learning gains:
68% reading
70% math
Learning gains of lowest 25%
59% reading
66% math
AYP: Black, Economically Disadvantaged, and Students with Disabilities did not make AYP in Math; Students with Disabilities did not make AYP in Reading
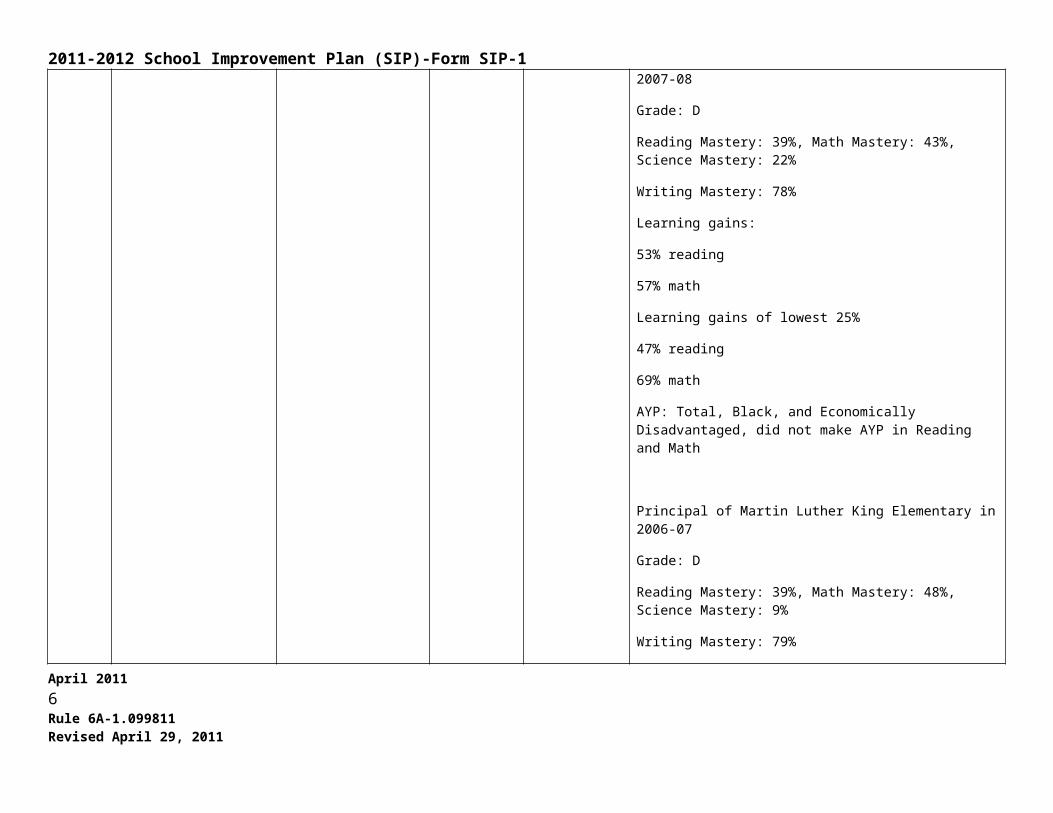
Principal of Martin Luther King Elementary in 2007-08
Grade: D
Reading Mastery: 39%, Math Mastery: 43%, Science Mastery: 22%
April 2011 4Rule 6A-1.099811Revised April 29, 2011
2011-2012 School Improvement Plan (SIP)-Form SIP-1Writing Mastery: 78%
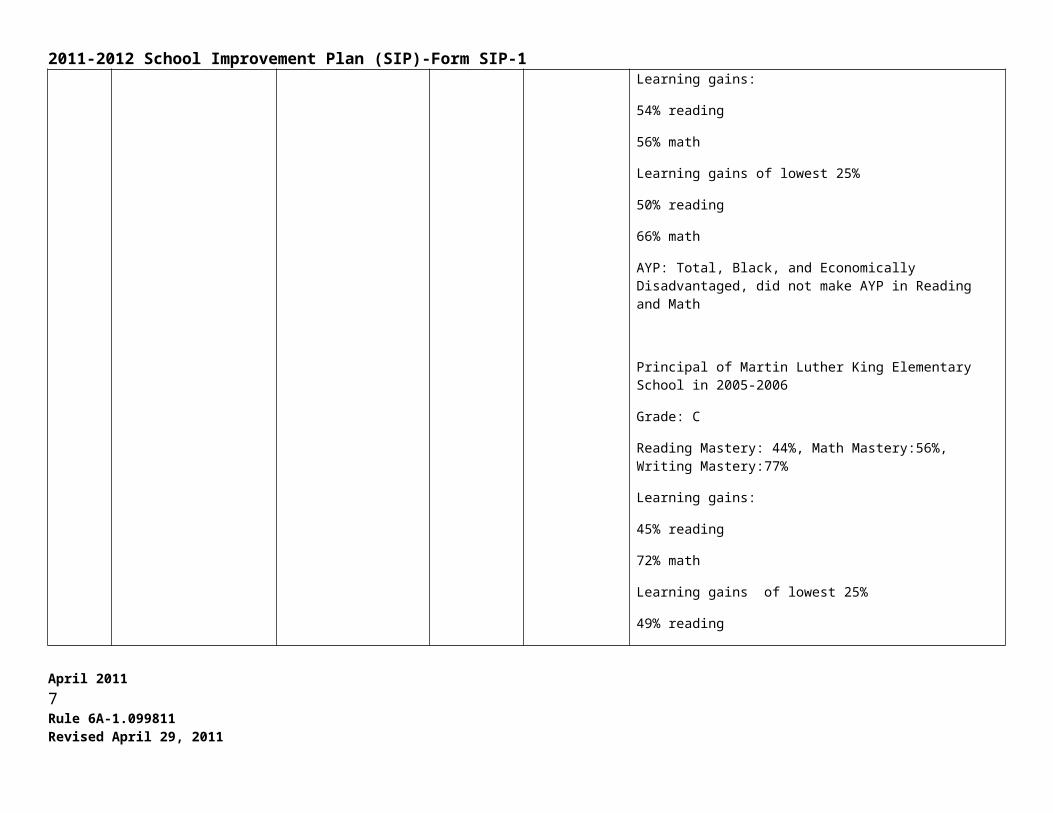
Learning gains:
53% reading
57% math
Learning gains of lowest 25%
47% reading
69% math
AYP: Total, Black, and Economically Disadvantaged, did not make AYP in Reading and Math
Principal of Martin Luther King Elementary in 2006-07
Grade: D
Reading Mastery: 39%, Math Mastery: 48%, Science Mastery: 9%
Writing Mastery: 79%
Learning gains:
54% reading
56% math
Learning gains of lowest 25%
50% reading
66% math
AYP: Total, Black, and Economically Disadvantaged, did not make AYP in Reading and Math
April 2011 5Rule 6A-1.099811Revised April 29, 2011
2011-2012 School Improvement Plan (SIP)-Form SIP-1Principal of Martin Luther King Elementary School in 2005-2006
Grade: C
Reading Mastery: 44%, Math Mastery:56%, Writing Mastery:77%
Learning gains:
45% reading
72% math
Learning gains of lowest 25%
49% reading
Math n/a
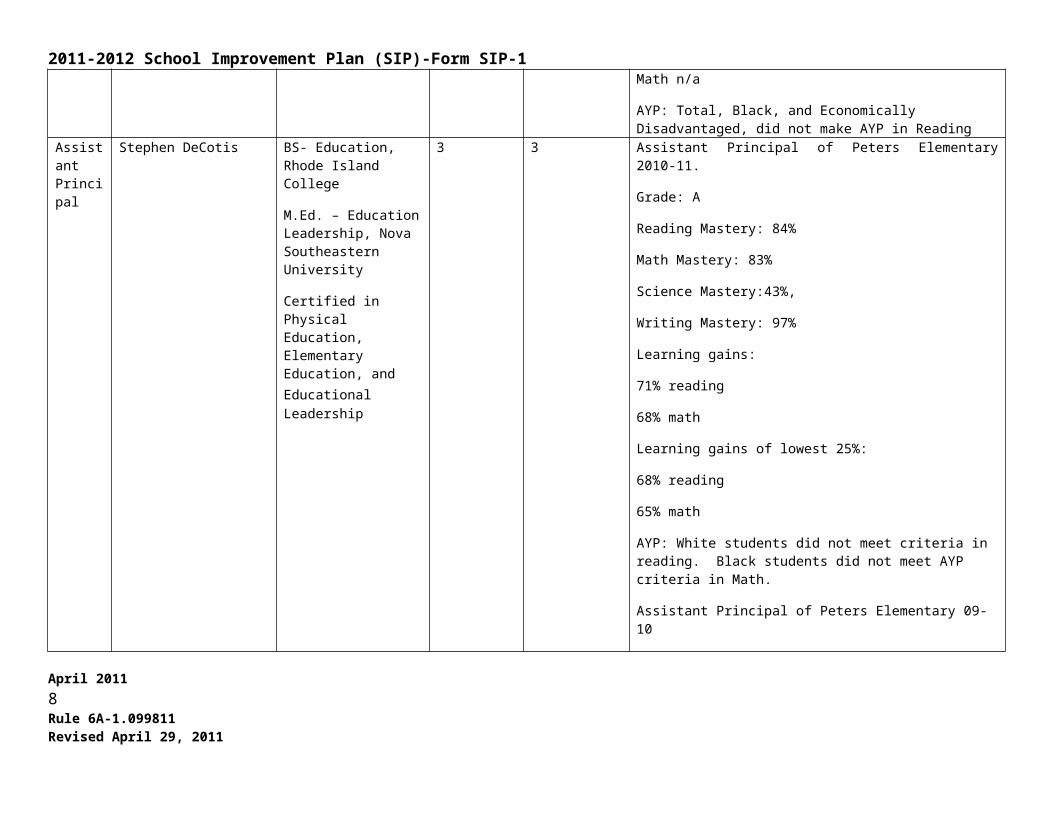
AYP: Total, Black, and Economically Disadvantaged, did not make AYP in Reading
Assistant Principal
Stephen DeCotis BS- Education, Rhode Island College
M.Ed. – Education Leadership, Nova Southeastern University
Certified in Physical Education, Elementary Education, and Educational Leadership
3 3 Assistant Principal of Peters Elementary 2010-11.
Grade: A
Reading Mastery: 84%
Math Mastery: 83%
Science Mastery:43%,
Writing Mastery: 97%
Learning gains:
71% reading
68% math
Learning gains of lowest 25%:
68% reading
April 2011 6Rule 6A-1.099811Revised April 29, 2011
2011-2012 School Improvement Plan (SIP)-Form SIP-165% math
AYP: White students did not meet criteria in reading. Black students did not meet AYP criteria in Math.
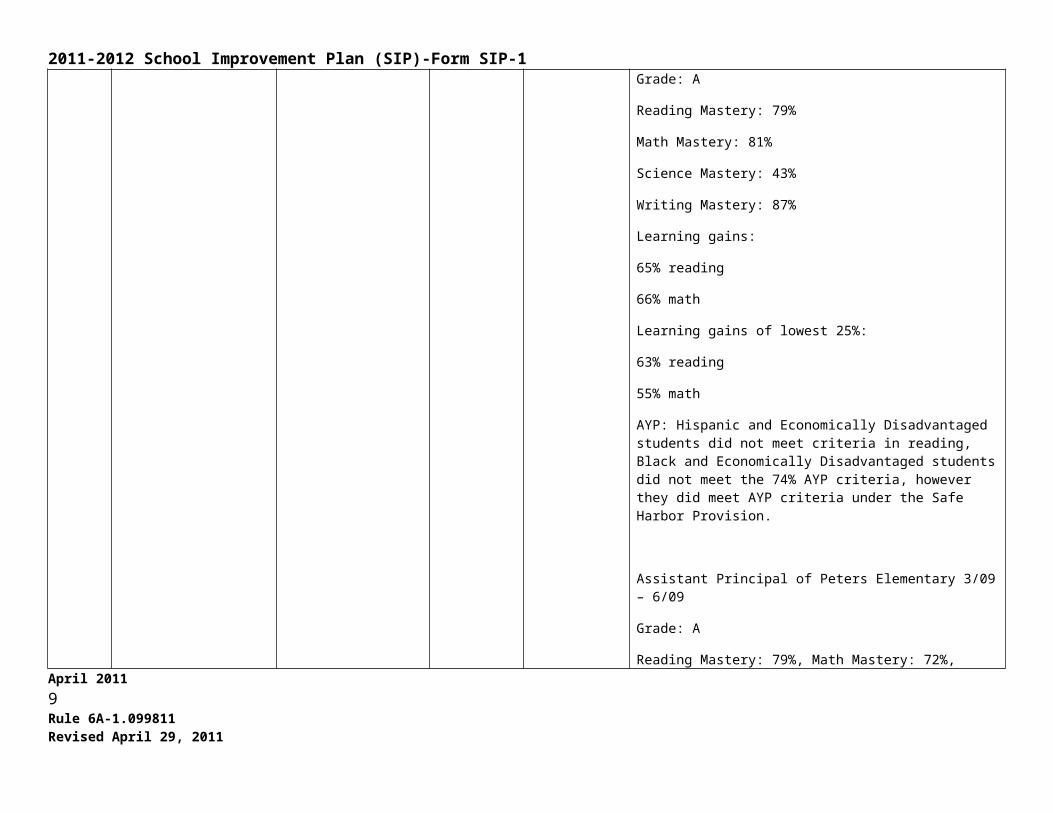
Assistant Principal of Peters Elementary 09-10
Grade: A
Reading Mastery: 79%
Math Mastery: 81%
Science Mastery: 43%
Writing Mastery: 87%
Learning gains:
65% reading
66% math
Learning gains of lowest 25%:
63% reading
55% math
AYP: Hispanic and Economically Disadvantaged students did not meet criteria in reading, Black and Economically Disadvantaged students did not meet the 74% AYP criteria, however they did meet AYP criteria under the Safe Harbor Provision.
Assistant Principal of Peters Elementary 3/09 – 6/09
Grade: A
Reading Mastery: 79%, Math Mastery: 72%, Science Mastery: 32%
April 2011 7Rule 6A-1.099811Revised April 29, 2011
2011-2012 School Improvement Plan (SIP)-Form SIP-1Writing Mastery: 90%
Learning gains: 68%
reading 70% math
Learning gains 25%:
59% reading
66% math
AYP: Black, Economically Disadvantaged, and Students with Disabilities did not make AYP in Math; Students with Disabilities did not make AYP in Reading
Educator / Croissant Park Elem. 2008-03/2009
Grade - A
Reading Mastery: 78%, Math Mastery: 81%, Science Mastery: 54%
Writing Mastery: 91%
Learning gains:
70% reading
70% math
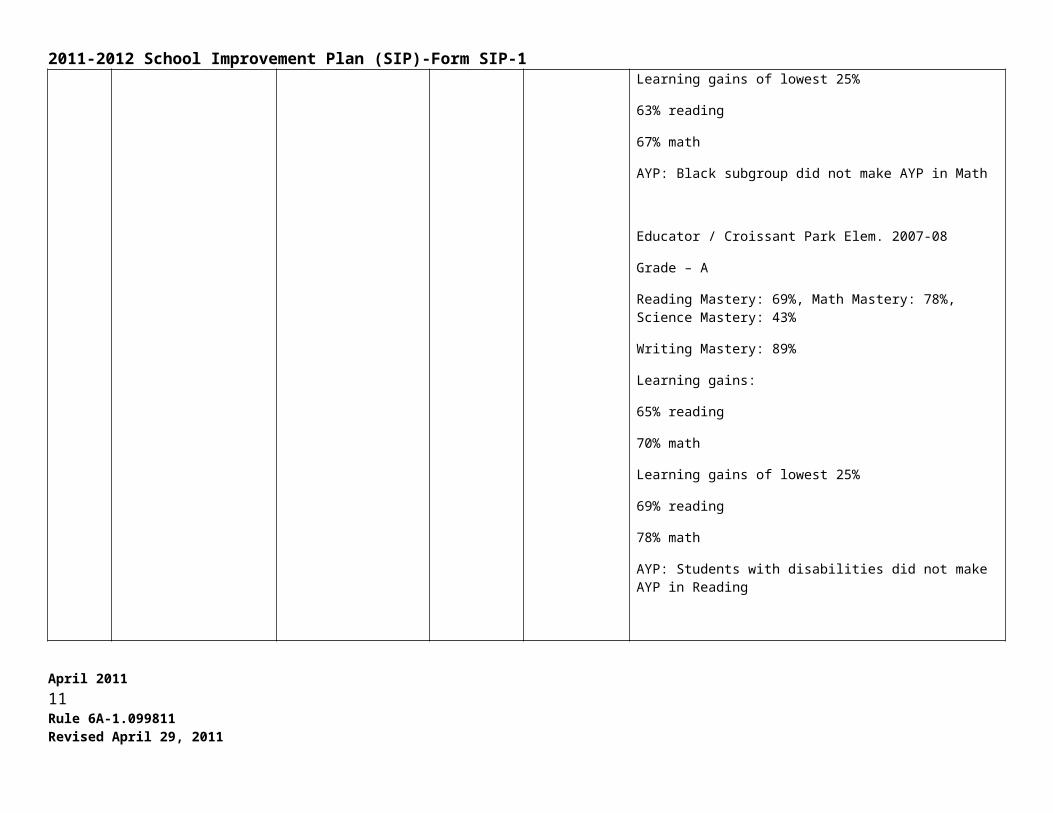
Learning gains of lowest 25%
63% reading
67% math
AYP: Black subgroup did not make AYP in Math
Educator / Croissant Park Elem. 2007-08
April 2011 8Rule 6A-1.099811Revised April 29, 2011
2011-2012 School Improvement Plan (SIP)-Form SIP-1Grade – A
Reading Mastery: 69%, Math Mastery: 78%, Science Mastery: 43%
Writing Mastery: 89%
Learning gains:
65% reading
70% math
Learning gains of lowest 25%
69% reading
78% math
AYP: Students with disabilities did not make AYP in Reading
Educator / Croissant Park Elem. 2006-07
Grade – A
Reading Mastery: 70%, Math Mastery: 75%, Science Mastery: 45%
Writing Mastery: 88%
Learning gains:
73% reading
85% math
Learning gains of lowest 25%
71% reading
82% math
AYP: Students with disabilities and English Language Learners did not make AYP in Reading
April 2011 9Rule 6A-1.099811Revised April 29, 2011
2011-2012 School Improvement Plan (SIP)-Form SIP-1
Educator / Croissant Park Elem. 2005-06
Grade – A
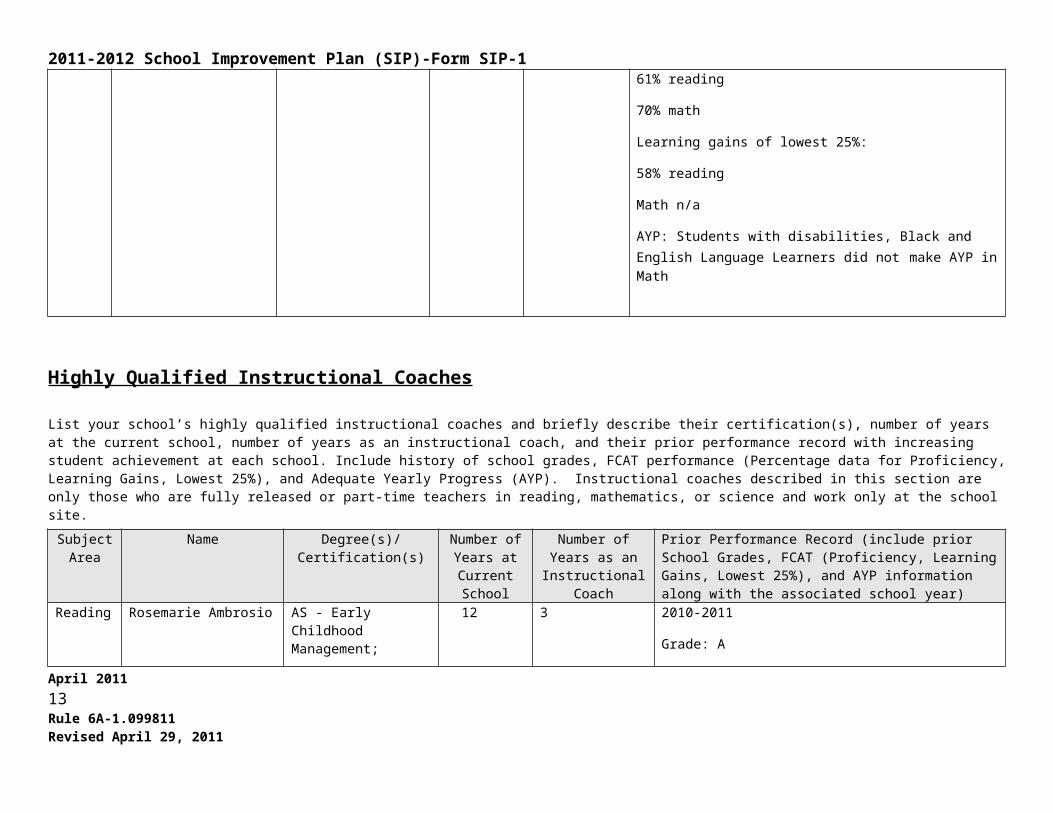
Reading Mastery: 66%, Math Mastery: 62%, Science Mastery: NA
Writing Mastery: 94%
Learning gains:
61% reading
70% math
Learning gains of lowest 25%:
58% reading
Math n/a
AYP: Students with disabilities, Black and English Language Learners did not make AYP in Math
Highly Qualified Instructional Coaches
List your school’s highly qualified instructional coaches and briefly describe their certification(s), number of years at the current school, number of years as an instructional coach, and their prior performance record with increasing student achievement at each school. Include history of school grades, FCAT performance (Percentage data for Proficiency, Learning Gains, Lowest 25%), and Adequate Yearly Progress (AYP). Instructional coaches described in this section are only those who are fully released or part-time teachers in reading, mathematics, or science and work only at the school site.
Subject Area
Name Degree(s)/Certification(s)
Number of Years at Current School
Number of Years as an
Instructional Coach
Prior Performance Record (include prior School Grades, FCAT (Proficiency, Learning Gains, Lowest 25%), and AYP information along with the associated school year)
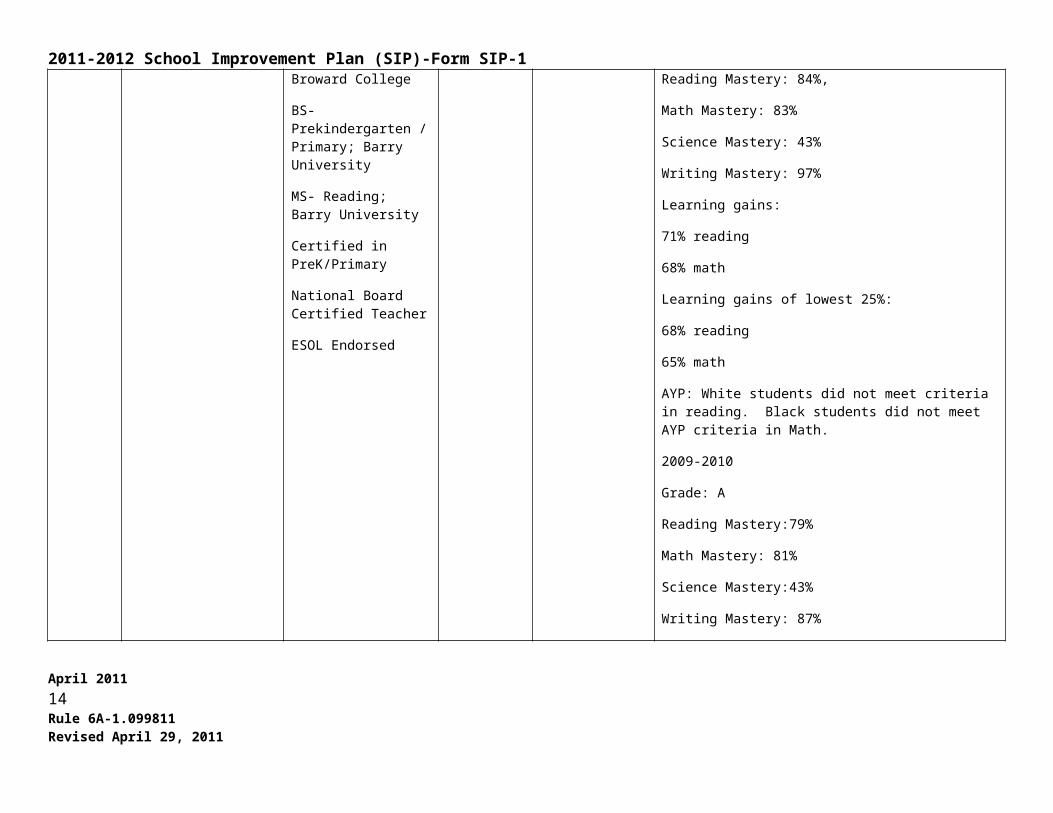
Reading Rosemarie Ambrosio AS - Early Childhood Management; Broward
12 3 2010-2011
April 2011 10Rule 6A-1.099811Revised April 29, 2011
2011-2012 School Improvement Plan (SIP)-Form SIP-1College
BS- Prekindergarten /Primary; Barry University
MS- Reading; Barry University
Certified in PreK/Primary
National Board Certified Teacher
ESOL Endorsed
Grade: A
Reading Mastery: 84%,
Math Mastery: 83%
Science Mastery: 43%
Writing Mastery: 97%
Learning gains:
71% reading
68% math
Learning gains of lowest 25%:
68% reading
65% math
AYP: White students did not meet criteria in reading. Black students did not meet AYP criteria in Math.
2009-2010
Grade: A
Reading Mastery:79%
Math Mastery: 81%
Science Mastery:43%
Writing Mastery: 87%
Learning gains:
65% reading
66% math
Learning gains of lowest 25%:April 2011 11Rule 6A-1.099811Revised April 29, 2011

2011-2012 School Improvement Plan (SIP)-Form SIP-163% reading
55% math
AYP: Hispanic and Economically Disadvantaged students did not meet criteria in reading, Black and Economically Disadvantaged students did not meet the 74% AYP criteria, however they did meet AYP criteria under the Safe Harbor Provision.
2008-09
Grade: A
Reading Mastery: 79%
Math Mastery: 72%
Science Mastery: 32%
Writing Mastery: 90%
Learning gains:
68% reading
70% math
Learning gains of lowest 25%
59% reading
66% math
AYP: Black, Economically Disadvantaged, and Students with Disabilities did not make AYP in Math; Students with Disabilities did not make AYP in Reading
April 2011 12Rule 6A-1.099811Revised April 29, 2011
2011-2012 School Improvement Plan (SIP)-Form SIP-1
Highly Qualified Teachers
Describe the school-based strategies that will be used to recruit and retain high quality, highly qualified teachers to the school.
Description of Strategy Person Responsible Projected Completion Date Not Applicable (If not, please explain why)
1.NESS Meetings for all teachers with less than 3 years experience NESS Coordinator Ongoing
2. Partnering teachers with less than 3 years experience with veteran teachers
NESS Liaison Ongoing
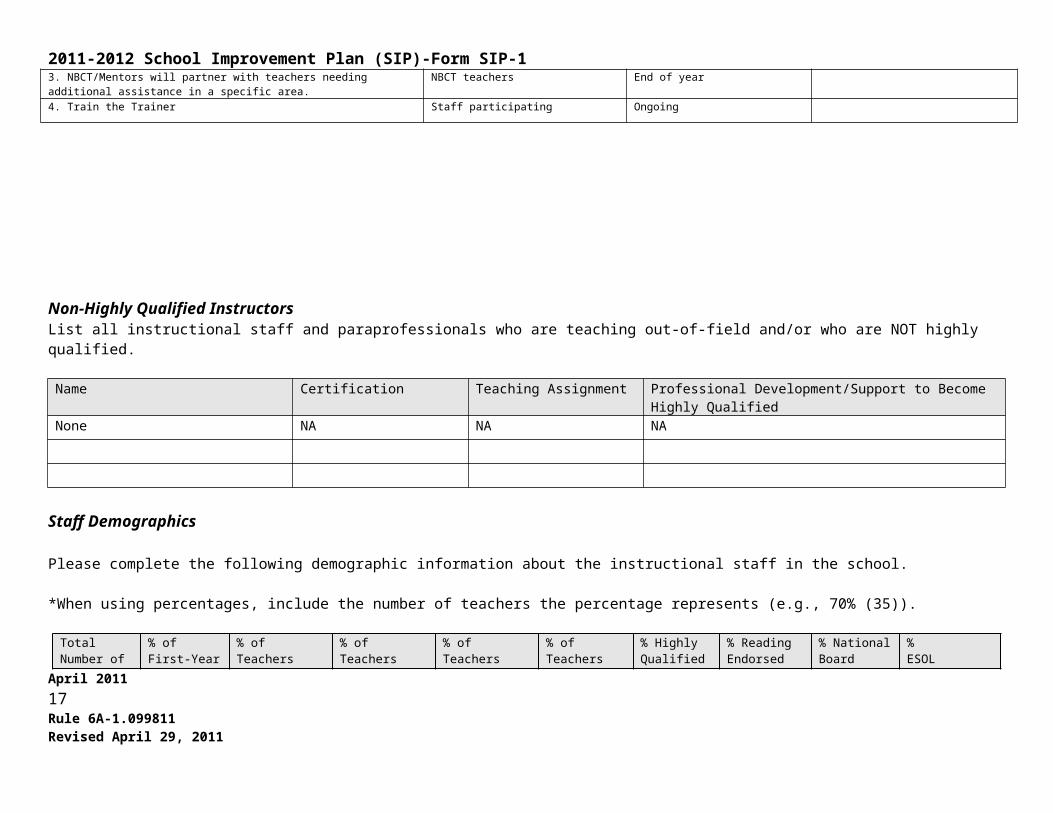
3. NBCT/Mentors will partner with teachers needing additional assistance in a specific area.
NBCT teachers End of year
4. Train the Trainer Staff participating Ongoing
Non-Highly Qualified InstructorsList all instructional staff and paraprofessionals who are teaching out-of-field and/or who are NOT highly qualified.
Name Certification Teaching Assignment Professional Development/Support to Become Highly QualifiedNone NA NA NA
Staff Demographics
April 2011 13Rule 6A-1.099811Revised April 29, 2011
2011-2012 School Improvement Plan (SIP)-Form SIP-1Please complete the following demographic information about the instructional staff in the school.
*When using percentages, include the number of teachers the percentage represents (e.g., 70% (35)).
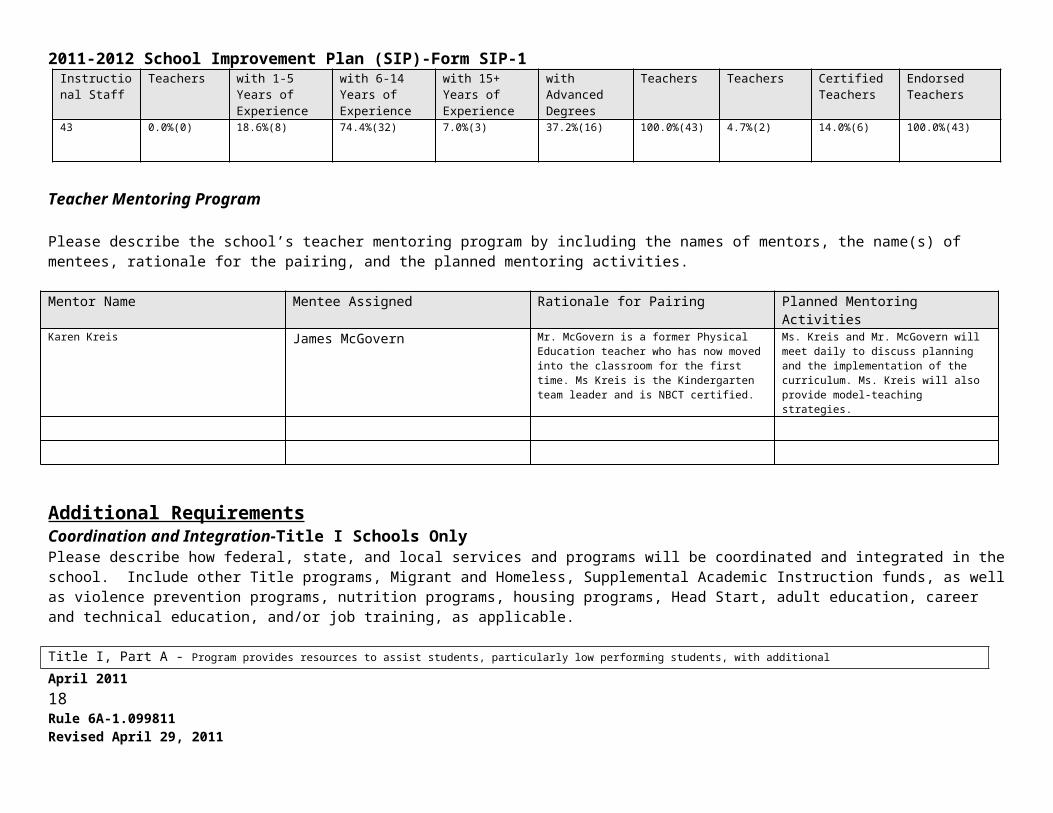
Total Number of Instructional Staff
% of First-Year Teachers
% of Teachers with 1-5 Years of Experience
% of Teachers with 6-14 Years of Experience
% of Teachers with 15+ Years of Experience
% of Teachers with Advanced Degrees
% Highly Qualified Teachers
% Reading Endorsed Teachers
% National Board Certified Teachers
% ESOL EndorsedTeachers
43 0.0%(0) 18.6%(8) 74.4%(32) 7.0%(3) 37.2%(16) 100.0%(43) 4.7%(2) 14.0%(6) 100.0%(43)
Teacher Mentoring Program
Please describe the school’s teacher mentoring program by including the names of mentors, the name(s) of mentees, rationale for the pairing, and the planned mentoring activities.
Mentor Name Mentee Assigned Rationale for Pairing Planned Mentoring Activities
Karen Kreis James McGovern Mr. McGovern is a former Physical Education teacher who has now moved into the classroom for the first time. Ms Kreis is the Kindergarten team leader and is NBCT certified.
Ms. Kreis and Mr. McGovern will meet daily to discuss planning and the implementation of the curriculum. Ms. Kreis will also provide model-teaching strategies.
Additional RequirementsCoordination and Integration-Title I Schools Only Please describe how federal, state, and local services and programs will be coordinated and integrated in the school. Include other Title programs, Migrant and Homeless, Supplemental Academic Instruction funds, as well as violence prevention programs, nutrition programs, housing programs, Head Start, adult education, career and technical education, and/or job training, as applicable.
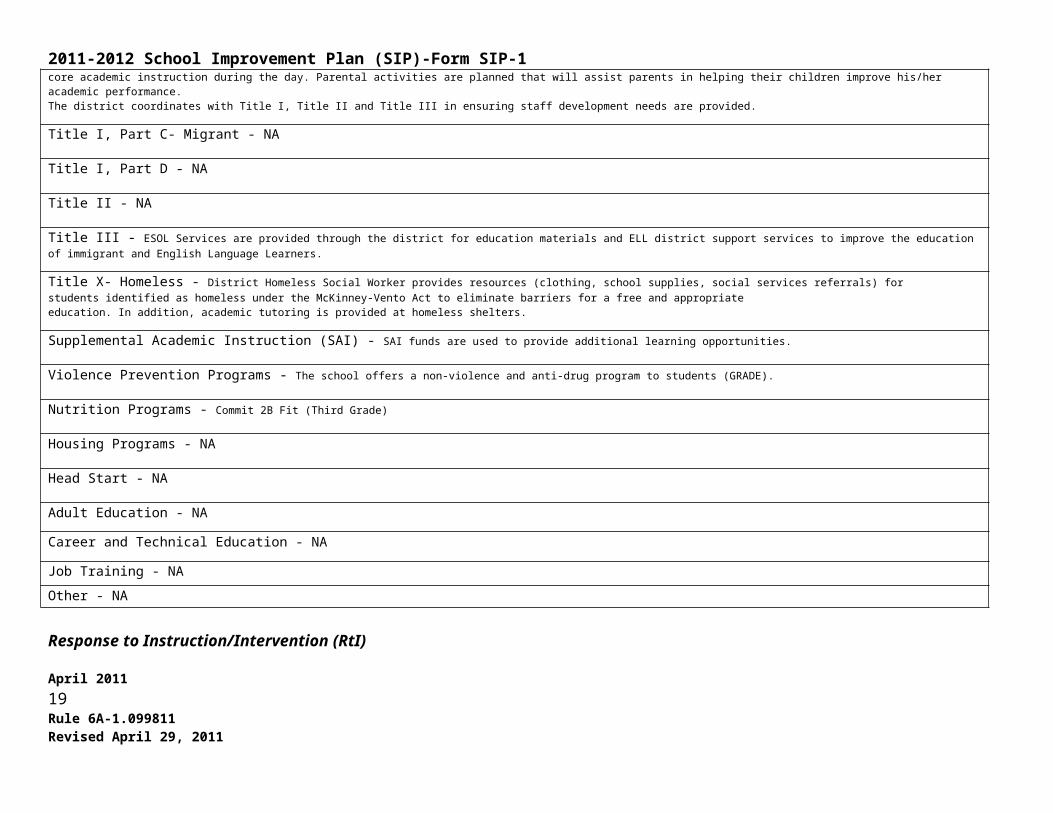
Title I, Part A - Program provides resources to assist students, particularly low performing students, with additionalcore academic instruction during the day. Parental activities are planned that will assist parents in helping their children improve his/her academic performance.The district coordinates with Title I, Title II and Title III in ensuring staff development needs are provided.
April 2011 14Rule 6A-1.099811Revised April 29, 2011
2011-2012 School Improvement Plan (SIP)-Form SIP-1Title I, Part C- Migrant - NA
Title I, Part D - NA
Title II - NA
Title III - ESOL Services are provided through the district for education materials and ELL district support services to improve the education of immigrant and English Language Learners.
Title X- Homeless - District Homeless Social Worker provides resources (clothing, school supplies, social services referrals) forstudents identified as homeless under the McKinney-Vento Act to eliminate barriers for a free and appropriateeducation. In addition, academic tutoring is provided at homeless shelters.
Supplemental Academic Instruction (SAI) - SAI funds are used to provide additional learning opportunities.
Violence Prevention Programs - The school offers a non-violence and anti-drug program to students (GRADE).
Nutrition Programs - Commit 2B Fit (Third Grade)
Housing Programs - NA
Head Start - NA
Adult Education - NA
Career and Technical Education - NA
Job Training - NA
Other - NA
Response to Instruction/Intervention (RtI)School-Based RtI Team
Identify the school-based RtI Leadership Team. Ms. Sedlack – Principal Mr. DeCotis – Assistant Principal Dr. Koch – ESE Specialist / CPST/RtI Coordinator Ms. Ambrosio – Reading Coach Ms. McGrath – Guidance Counselor
Mr.. Rosler - School PsychologistApril 2011 15Rule 6A-1.099811Revised April 29, 2011

2011-2012 School Improvement Plan (SIP)-Form SIP-1 Eva Merrill - School Social Worker Classroom Teacher • Ms. Herrington – Speech Pathologist
Describe how the school-based RtI Leadership Team functions (e.g., meeting processes and roles/functions). How does it work with other school teams to organize/coordinate RtI efforts? The RtI team meets bi-monthly to discuss identified students and to review data to determine the effectiveness of implemented strategies. RtI case managers are selected from the RtI Team to facilitate the RtI process with grade level team leaders and individual classroom teachers. The RtI Case Manager meets with grade level teachers to discuss current students involved in the RtI process, determine specific areas of concern, analyze data, and determine the success of the tiered intervention(s). Progress monitoring is reviewed in accordance with the time lines established in the RtI process and shared with parents along with steps needed for the student’s success. If needed, further testing may be initiated through the ESE Program and the School Psychologist to identify potential disabilities.
Describe the role of the school-based RtI Leadership Team in the development and implementation of the school improvement plan. Describe how the RtI Problem-solving process is used in developing and implementing the SIP?Members of the RtI Leadership team are assigned to each of the School Improvement Curriculum Teams to ensure that the RtI Problem-solving Process is addressed in the creation of the SIP and to ensure that the necessary steps are being carried out in the SIP implementation. The RtI Team and other teams within the school have identified tiered interventions and data collection tools for students struggling with academic and/or behavior concerns.
RtI Implementation
Describe the data source(s) and the data management system(s) used to summarize data at each tier for reading, mathematics, science, writing, and behavior. Academic Concerns -Tier I screenings are utilized to assess the effectiveness of and to make modifications to the core curriculum.Upon the initiation of Tier II or III, specific areas of weakness are identified for intervention and data collection. The RtI case manager, classroom teachers and the RtI Team utilize uniform documentation to identify and describe areas of concern(s). The school utilizes a number of data tools to collect data. Tiered interventions are identified, dates of implementation and their results are recorded for academic concerns. A school-wide electronic graphing tool has been introduced and made available for the management of all data collected.Behavior Concerns -A school-wide frequency chart has been adopted to document behavior concerns and data collection. The RtI team utilizes a chart to track the effectiveness of each intervention at each Tier. Additionally, discipline data created in the Discipline Matrix System, anecdotes and Data Warehouse reports are utilized for data collection and management. A school-wide electronic graphing tool has been introduced and made available for the management of all data collected. All data collected is managed and stored by the RtI Coordinator, Dr. Koch. A RtI tracking sheet is managed by the CPS/RtI Coordinator, this information is shared with the RtI team and case managers twice a month at the RtI Leadership Team meetings. Documentation of the students involved in the RtI process is also provided in the students CUM folder.
(Detailed intervention programs utilized in Tier I, II and III are listed below. Each strategy is documented for data collection and analysis.)TIER I – regular curriculum sourcesReading –Treasures K-5Math – GO Math Florida, Houghton Mifflin HarcourtWriting – Six Traits, BEEP lesson plansScience – Harcourt Science, Delta Science KitsBehavior – school-wide discipline plan, classroom behavior management plan
TIER II – Reading - Double–dose small group instruction Triumphs K-5, extended learning opportunities (Saturday Camp)Math – small group instruction (GO Math), specialized software (Destination Success Riverdeep), Mt. Math 2-5, Calendar Math K-1, extended learning opportunities (Saturday Camp)Writing- small group instruction (Writer’s in Control), Saturday Camp, Mountain Language (grade 4), extended learning opportunities (Saturday Camp)Science – small group instruction, peer tutoring (Science Fusion), Snapshots, extended learning opportunities (Saturday Camp)Behavior – specialized intervention strategies i.e., proximity, personalized schedules, daily progress report, mentoringApril 2011 16Rule 6A-1.099811Revised April 29, 2011
2011-2012 School Improvement Plan (SIP)-Form SIP-1
TIER III –Reading - triple-dose small group instructionMath – GO Math intervention materials, tutoring, small group of 3 or less with classroom teacherWriting – double dose writing with small group of 3 or less, tutoring, individual classroom supportScience - small group of 3 or less, Snapshots, science small group pull-out / Behavior - Positive Behavior Intervention Plan, (PBIP), Functional Behavior Plan, (FBA)Describe the plan to train staff on RtI.Staff has been trained in the RtI process via faculty meetings, team meetings and individual meetings with members of the RtI Leadership Team. Team leaders and RtI members will continue these trainings as part of grade level meetings and on an as need basis. District produced RtI podcasts are available for deeper understanding of the process.
Literacy Leadership Team (LLT)
School-Based Literacy Leadership Team
Identify the school-based Literacy Leadership Team (LLT).Ms. Sedlack - PrincipalMr. DeCotis - Assistant PrincipalMs. Ambrosio - Reading CoachTeam LeadersDr. Koch - ESE Specialist
Describe how the school-based LLT functions (e.g., meeting processes and roles/functions).The function of the team is to ensure that all programs are in place for the core, supplemental and intensive needs of students. The Literacy Leadership Team,(LLT) ensures that teachers are receiving support with implementation of strategies, interventions and core programs. If methods are not working, the team assists with alternative methods, and provides suggestions for change. Meetings are fluid, keeping up with needs of teachers and students. A monthly meeting is held to discuss the progress of students, programs being utilized and the success of implementation or the need for change. The PDCA model is emphasized in all meetings.What will be the major initiatives of the LLT this year?The major initiative of the LLT will be to provide support for teachers regarding the differentiation of instruction to meet the needs of students.In addition, the LLT will provide Professional Learning Communities to create a community of shared learning that better meets the needs of all students in all areas of literacy.
NCLB Public School ChoiceApril 2011 17Rule 6A-1.099811Revised April 29, 2011
2011-2012 School Improvement Plan (SIP)-Form SIP-1
Notification of School in Need of Improvement (SINI) Status Upload a copy of the Notification of SINI Status to Parents in the designated upload link on the “Upload” page.
Public School Choice with Transportation (CWT) NotificationUpload a copy of the CWT Notification to Parents in the designated upload link on the “Upload” page.
Supplemental Educational Services (SES) NotificationUpload a copy of the SES Notification to Parents in the designated upload link on the “Upload” page.
*Elementary Title I Schools Only: Pre-School TransitionDescribe plans for assisting preschool children in transition from early childhood programs to local elementary school programs as applicable.The preschool program currently in operation at Peters is an ESE pre-k class. The classroom teacher evaluates students from this program and staffings are conducted by the ESE Specialist. During these meetings placement decisions are collaboratively discussed and determined. Assessments include vision, hearing, academic assessment, developmental profiles, and parent input. Staffings will include district personnel as indicated by the student's Individual Education Plan. Staffing participants, including parents, discuss every aspect of the student's current level of performance and set appropriate goals and objectives for the coming year based on that student's individual needs.
Transition meetings are scheduled between the preschool program and the elementary school for parents, students and educators. A Kindergarten Orientation is scheduled annually to provide an opportunity for parents and students to tour the school campus and become familiar with the school prior to the first day of school.
Students are assessed prior to or upon entering in the areas of Basic Skills/School Readiness, OralLanguage/Syntax, Print/Letter Knowledge, and Phonological Awareness/Processing.Screening data will be collected and aggregated prior to October 2010. Data will be used to plan daily academic and social/emotional instruction for all students and for groups of students or individual students who may need intervention beyond core instruction. Core Kindergarten academic and behavioral instruction will include daily explicit instruction, modeling, guided practice and independent practice of all academic and/or social emotional skills identified by screening data.Screening tools will be re-administered mid-year and at the end of the year in order to determine student learning gains and the need for changes to the instructional/intervention programs.
*Grades 6-12 Only Sec. 1003.413(b) F.SFor schools with Grades 6-12, describe the plan to ensure that teaching reading strategies is the responsibility of every teacher.
April 2011 18Rule 6A-1.099811Revised April 29, 2011
2011-2012 School Improvement Plan (SIP)-Form SIP-1
*High Schools Only
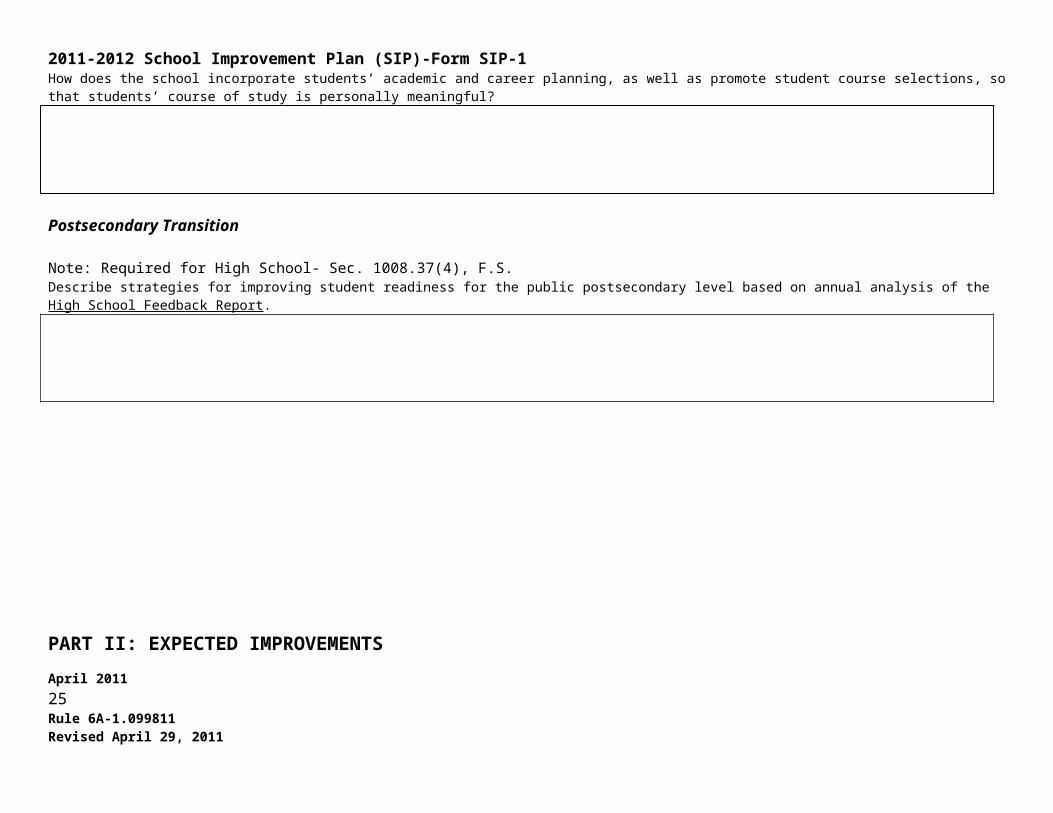
Note: Required for High School- Sec. 1008.37(4), F.S., Sec. 1003.413(g)(j) F.S.How does the school incorporate applied and integrated courses to help students see the relationships between subjects and relevance to their future?
How does the school incorporate students’ academic and career planning, as well as promote student course selections, so that students’ course of study is personally meaningful?
Postsecondary Transition
Note: Required for High School- Sec. 1008.37(4), F.S. Describe strategies for improving student readiness for the public postsecondary level based on annual analysis of the High School Feedback Report.
April 2011 19Rule 6A-1.099811Revised April 29, 2011
2011-2012 School Improvement Plan (SIP)-Form SIP-1
PART II: EXPECTED IMPROVEMENTSReading Goals
* When using percentages, include the number of students the percentage represents (e.g., 70% (35)).
READING GOALS Problem-Solving Process to Increase Student AchievementBased on the analysis of student achievement data, and reference to
“Guiding Questions”, identify and define areas in need of improvement for the following group:
Anticipated Barrier Strategy Person or Position Responsible for
Monitoring
Process Used to Determine Effectiveness of
Strategy
Evaluation Tool
1. Students achieving proficiency (FCAT Level 3) in reading
Reading Goal #1:
1.1.Level 1, 2 & 3 Student must maintain or exceed grade level standards in oral reading fluency.
1.1.• Treasures Gr. K-5• Cold Reads• Six Minute Solution Gr. 3-5• Oral Reading Fluency -• Teachers implement ESOL strategies Students in need of interventions receive double dose small group reading.• ESE pull out / modified core curriculum for appropriate grade level.
1.1.Reading Coach-Rosemarie Ambrosio
1.1.Students will be administered oral reading fluency assessments three times throughout the year to establish a baseline, monitor progress and a post to measure growth. At each assessment period teachers will utilize the assessment tool to modify instruction and provide intervention strategies if needed.CELLA testing will also be administered. This information will be utilized to determine appropriate ESOL strategies and determine if any additional intervention is needed.
1.1.Oral Reading Fluency assessment from basal (grades 1-5)FAIR - KindergartenCELLA
Peters Elementary has increased the percentage of students scoring a Level 3 in reading from 39% in 2010 to 47% in 2011 resulting in an 8% increase. Strands identified as needing improvement includes Vocabulary Development and Reading Applications. Improvement in these areas will yield increases in students scoring Level 3.
2011 Current Level of Performance:*
2012 Expected Level of Performance:*
47% (132) 50% (140)
April 2011 20Rule 6A-1.099811Revised April 29, 2011
2011-2012 School Improvement Plan (SIP)-Form SIP-1
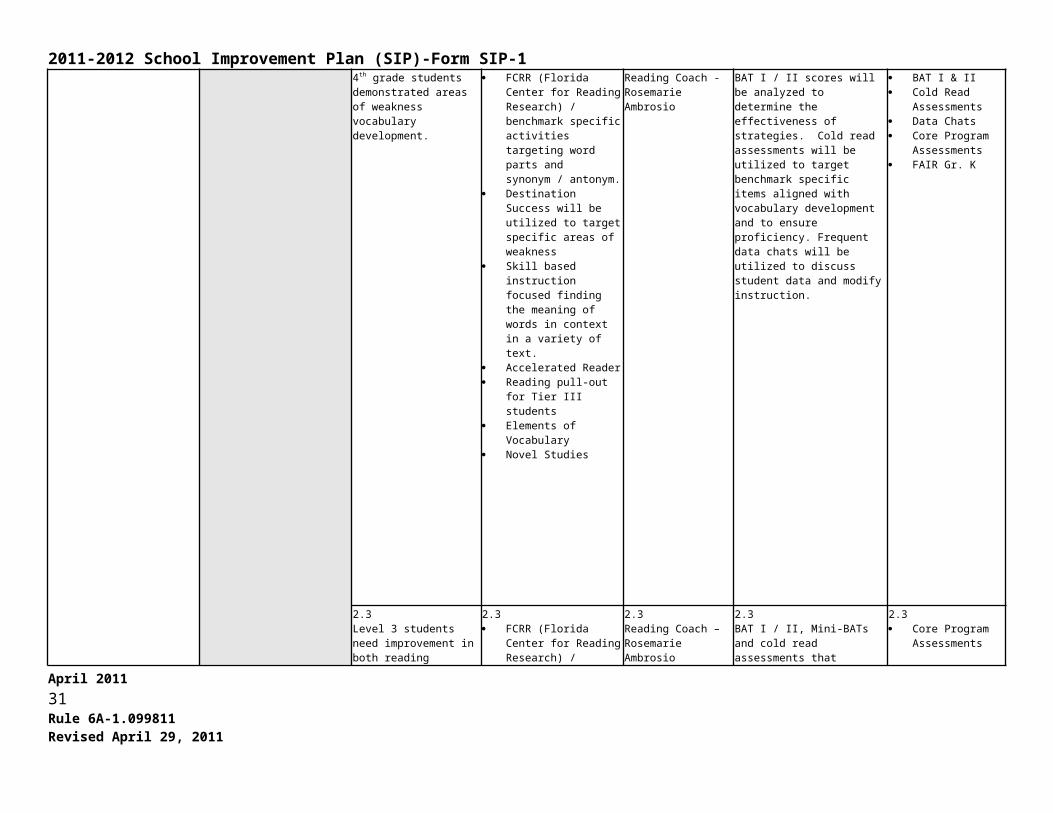
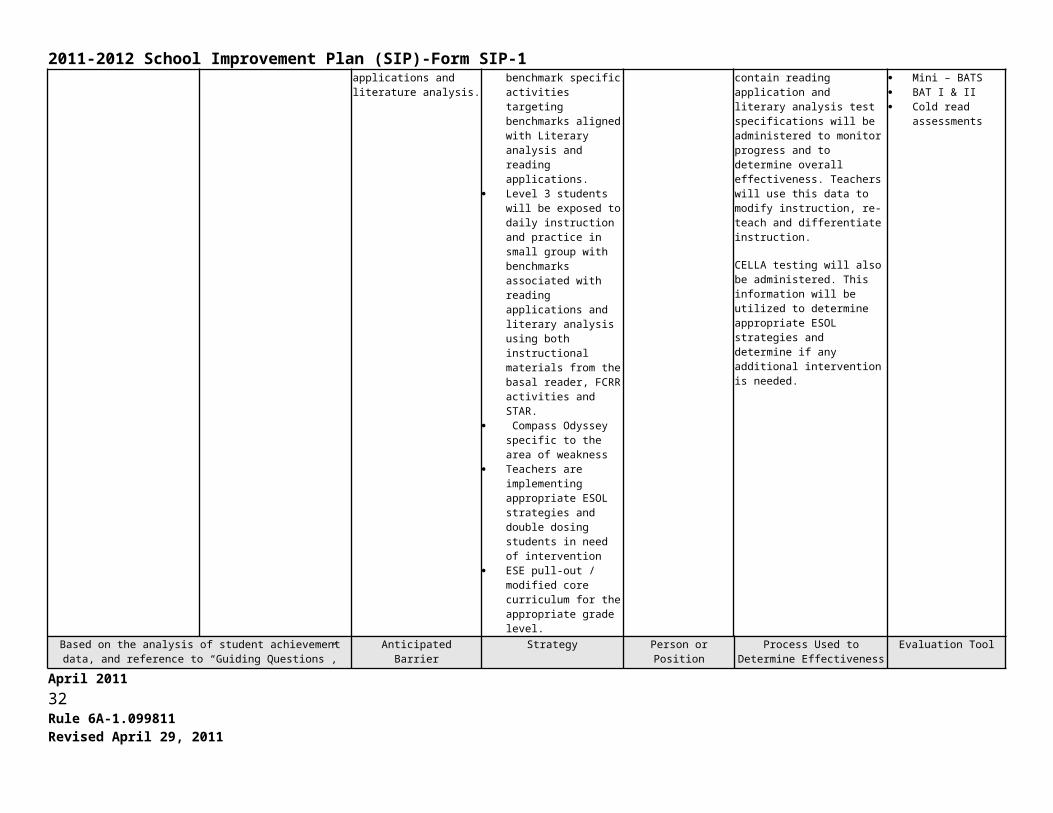
1.2.4th grade – The reading strand identified, as a significant area of weakness is Vocabulary Development.
1.2. FCRR (Florida Center for
Reading Research) / benchmark specific activities targeting word parts and synonym / antonym.
Destination Success will be utilized to target specific to the area of weakness
Skill based instruction focused finding the meaning of words in context in a variety of text.
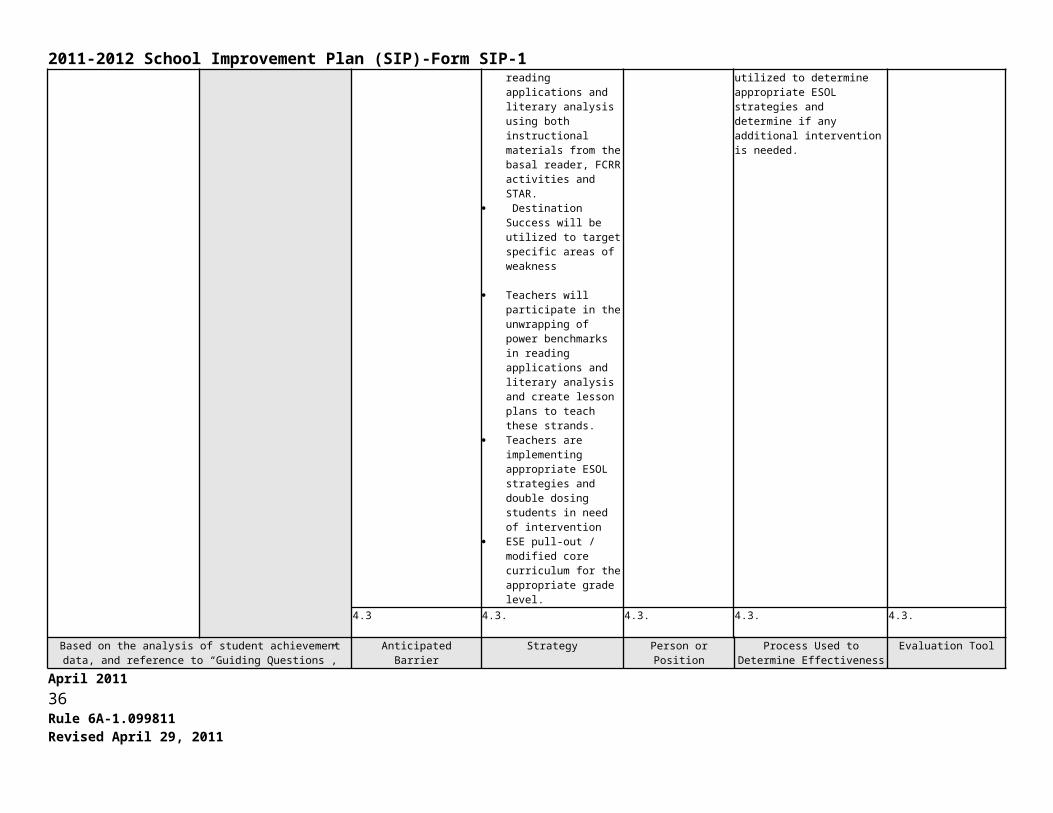
Accelerated Reader Reading pull-out for Tier
III students Elements of Vocabulary Novel Studies Targeted students in the
lowest 25% will be assigned a teacher mentor
ESE pull-out / modified core curriculum for appropriate grade level
Teachers are implementing appropriate ESOL strategies and double dosing students in need of intervention
1.2Reading Coach-Rosemarie Ambrosio.
1.2.BAT I / II scores will be analyzed to determine the effectiveness of strategies. Cold read assessments will be utilized to target benchmark specific items aligned with vocabulary development and to ensure proficiency. Frequent data chats will be utilized to discuss student data and modify instruction.
1.2. Core Program
Assessments BAT I & II Cold Read
Assessments Data Chats Triumphs K-5 FAIR Gr. K
1.3.3rd & 5th Grades - The reading strand identified as a significant area of weakness is Reading Applications.
1.3. Students will be exposed to
daily instruction and practice in small group with benchmarks associated with Main Idea, Plot and Purpose, Cause and Effect and Compare and Contrast using both instructional materials from Treasures, FCRR activities and skill specific materials.
1.3.Reading Coach-Rosemarie Ambrosio
1.3.BAT I / II and cold read assessments that contain reading application test items will be administered to monitor progress and to determine overall effectiveness. Teachers will use this data to modify instruction, re-teach and differentiate instruction.CELLA testing will also be administered. This information will be utilized to determine appropriate ESOL strategies and determine if
1.3. Core Program
Assessments Mini – BATS BAT I & II Cold read
assessments CELLA
April 2011 21Rule 6A-1.099811Revised April 29, 2011
2011-2012 School Improvement Plan (SIP)-Form SIP-1 Level 1 & 2 students will
work on Destination Success addressing specific areas of weakness in Main Idea, Plot and Purpose, Cause and Effect and Compare and Contrast.
Reading pull-out for Tier III students
Targeted students in the lowest 25% will be assigned a teacher mentor
ESE pull-out / modified core curriculum for appropriate grade level
Teachers are implementing appropriate ESOL strategies and double dosing students in need of intervention
any additional intervention is needed.
Based on the analysis of student achievement data, and reference to “Guiding Questions”, identify and define areas in need of
improvement for the following group:
Anticipated Barrier Strategy Person or Position Responsible for
Monitoring
Process Used to Determine Effectiveness of
Strategy
Evaluation Tool
2. Students achieving above proficiency (FCAT Levels 4 and 5) in reading
Reading Goal #2
2.1.3rd and 5th grade students demonstrated areas of weakness in Informational Text.
2.1. Daily exposure to cross
content literature, especially in science and social text in grades K-5.
Students in grades K-5 will utilize chart, graphs, timelines and other reference information to make inferences about text and synthesize information
Lesson study will be utilized in grade level meetings to examine item specifications and to share best practices related to teaching informational text skills.
AR Book Challenge will be implemented
Student incentives will be developed in collaboration with school business
2.1.Reading Coach –Ms. Ambrosio
2.1.BAT I / II, Mini-BATs and cold read assessments that contain informational text test specifications will be administered to monitor progress and to determine overall effectiveness.
2.1. Core Program
Assessments Mini – BATS BAT I & II Cold read
assessments
April 2011 22Rule 6A-1.099811Revised April 29, 2011

2011-2012 School Improvement Plan (SIP)-Form SIP-1partners for academic growth and excellence
Students who excel academically will be acknowledged on the morning TV show “Panda Vision” and at Panda Pride assemblies.
Peters Elementary has demonstrated a slight decrease in the percentage of students scoring a Level 4 or 5 in reading. In 2010 41% scored a Level 4 & 5 in reading. In school year 2011 37% of students scored a Level 4 or 5. A data analysis of test scores indicate common areas of weakness in 3rd and 5th grades in informational text. In 4th grade Level 4 & 5 students demonstrated an area of weakness in vocabulary. These areas of weakness are outlined below and will be targeted in the 2011-2012 school year for improvement.
2011 Current Level of Performance:*
2012 Expected Level of Performance:*
37% (104) 40% (112)
2.2.4th grade students demonstrated areas of weakness vocabulary development.
2.2. FCRR (Florida Center for
Reading Research) / benchmark specific activities targeting word parts and synonym / antonym.
Destination Success will be utilized to target specific areas of weakness
Skill based instruction focused finding the meaning of words in context in a variety of text.
Accelerated Reader Reading pull-out for Tier
III students Elements of Vocabulary Novel Studies
2.2.Reading Coach - Rosemarie Ambrosio
2.2.BAT I / II scores will be analyzed to determine the effectiveness of strategies. Cold read assessments will be utilized to target benchmark specific items aligned with vocabulary development and to ensure proficiency. Frequent data chats will be utilized to discuss student data and modify instruction.
2.2. BAT I & II Cold Read
Assessments Data Chats Core Program
Assessments FAIR Gr. K
2.3Level 3 students need improvement in both reading applications and literature analysis.
2.3 FCRR (Florida Center for
Reading Research) / benchmark specific activities targeting benchmarks aligned with
2.3Reading Coach –Rosemarie Ambrosio
2.3BAT I / II, Mini-BATs and cold read assessments that contain reading application and literary analysis test specifications will be administered to monitor progress
2.3 Core Program
Assessments Mini – BATS BAT I & II Cold read
April 2011 23Rule 6A-1.099811Revised April 29, 2011
2011-2012 School Improvement Plan (SIP)-Form SIP-1Literary analysis and reading applications.
Level 3 students will be exposed to daily instruction and practice in small group with benchmarks associated with reading applications and literary analysis using both instructional materials from the basal reader, FCRR activities and STAR.
Compass Odyssey specific to the area of weakness
Teachers are implementing appropriate ESOL strategies and double dosing students in need of intervention
ESE pull-out / modified core curriculum for the appropriate grade level.
and to determine overall effectiveness. Teachers will use this data to modify instruction, re-teach and differentiate instruction.
CELLA testing will also be administered. This information will be utilized to determine appropriate ESOL strategies and determine if any additional intervention is needed.
assessments
Based on the analysis of student achievement data, and reference to “Guiding Questions”, identify and define areas in need of
improvement for the following group:
Anticipated Barrier Strategy Person or Position Responsible for
Monitoring
Process Used to Determine Effectiveness of
Strategy
Evaluation Tool
3. Percentage of students making Learning Gains in reading
Reading Goal #3:
3.1Students making learning gains must attain proficiency in benchmarks associated with both reading applications and literary analysis.
3.1 FCRR (Florida Center for
Reading Research) / benchmark specific activities targeting benchmarks aligned with Literary analysis and reading applications.
Students will be exposed to daily instruction and practice in small group with benchmarks associated with reading applications and literary analysis using both instructional materials from the basal reader, FCRR activities and STAR.
Destination Success will be utilized to target specific areas of weakness
Teachers will participate in the unwrapping of power
3.1Reading Coach –Rosemarie Ambrosio
3.1BAT I / II, Mini-BATs and cold read assessments that contain reading application and literary analysis test specifications will be administered to monitor progress and to determine overall effectiveness. Teachers will use this data to modify instruction, re-teach and differentiate instruction.
CELLA testing will also be administered. This information will be utilized to determine appropriate ESOL strategies and determine if any additional intervention is needed.
3.1.Oral Reading Fluency assessment from basal (grades 1-5)FAIR - KindergartenCELLA
April 2011 24Rule 6A-1.099811Revised April 29, 2011
2011-2012 School Improvement Plan (SIP)-Form SIP-1benchmarks in reading applications and literary analysis and create lesson plans to teach these strands.
Teachers are implementing appropriate ESOL strategies and double dosing students in need of intervention
ESE pull-out / modified core curriculum for the appropriate grade level.
Peters Elementary has demonstrated an increase in students demonstrating learning
gains in reading. In 2010 65% of students showed learning gains as compared to 71% in 2011. Areas
of weakness are outlined and will be targeted in the 2011-2012
school year for improvement.
2011 Current Level of Performance:*
2012 Expected Level of Performance:*
71% (159) 74% (165)
3.2. 3.2. 3.2. 3.2. 3.2.
3.3. 3.3. 3.3. 3..3. 3.3.
Based on the analysis of student achievement data, and reference to “Guiding Questions”, identify and define areas in need of
improvement for the following group:
Anticipated Barrier Strategy Person or Position Responsible for
Monitoring
Process Used to Determine Effectiveness of
Strategy
Evaluation Tool
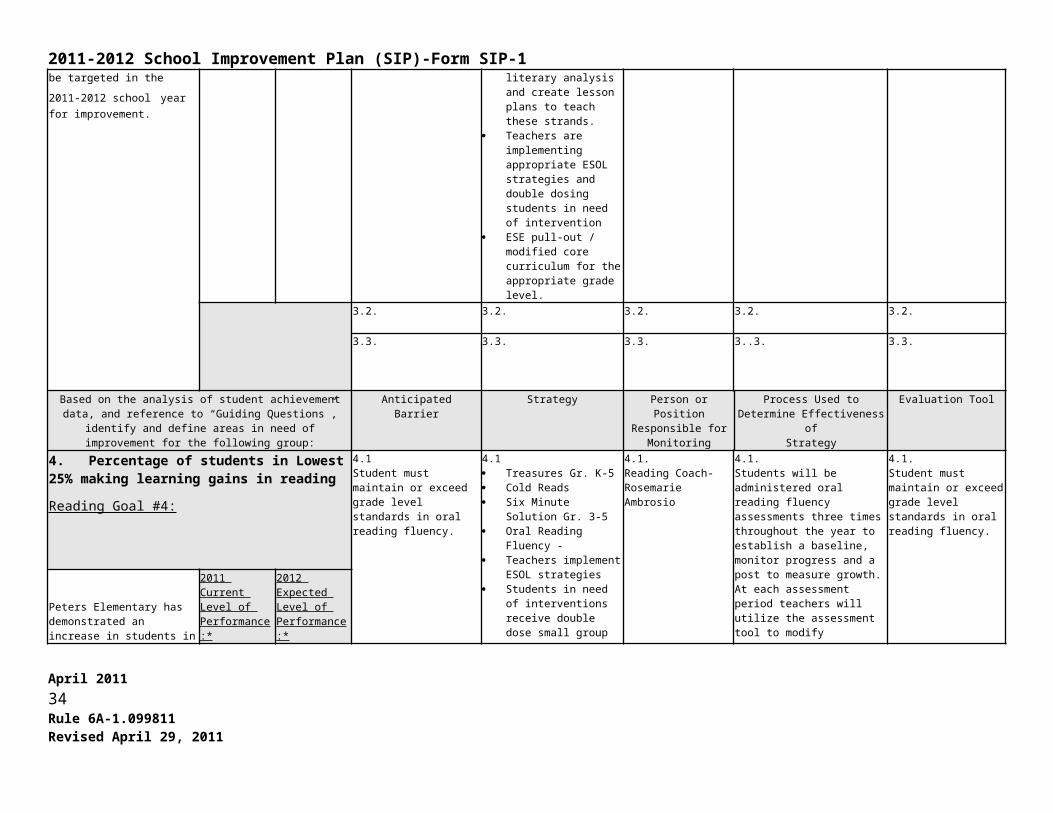
4. Percentage of students in Lowest 25% making learning gains in reading
Reading Goal #4:
4.1Student must maintain or exceed grade level standards in oral reading fluency.
4.1 Treasures Gr. K-5 Cold Reads Six Minute Solution Gr. 3-
5 Oral Reading Fluency - Teachers implement ESOL
strategies Students in need of
interventions receive double dose small group reading.
ESE pull out / modified core curriculum for appropriate grade level.
4.1.Reading Coach-Rosemarie Ambrosio
4.1.Students will be administered oral reading fluency assessments three times throughout the year to establish a baseline, monitor progress and a post to measure growth. At each assessment period teachers will utilize the assessment tool to modify instruction and provide intervention strategies if needed.CELLA testing will also be administered. This information will be utilized to determine appropriate ESOL strategies and determine if any additional intervention is needed.
4.1.Student must maintain or exceed grade level standards in oral reading fluency.
Peters Elementary has demonstrated an increase in students in the lowest 25% demonstrating learning gains in reading. In 2010 63% of students demonstrated learning gains. In 2011 68% students in the lowest 25% demonstrated learning gains in reading. Areas of weakness are outlined below and will be targeted in the 2011-2012 school year for improvement.
2011 Current Level of Performance:*
2012 Expected Level of Performance:*
68% (39) 71% (40)
April 2011 25Rule 6A-1.099811Revised April 29, 2011

2011-2012 School Improvement Plan (SIP)-Form SIP-1
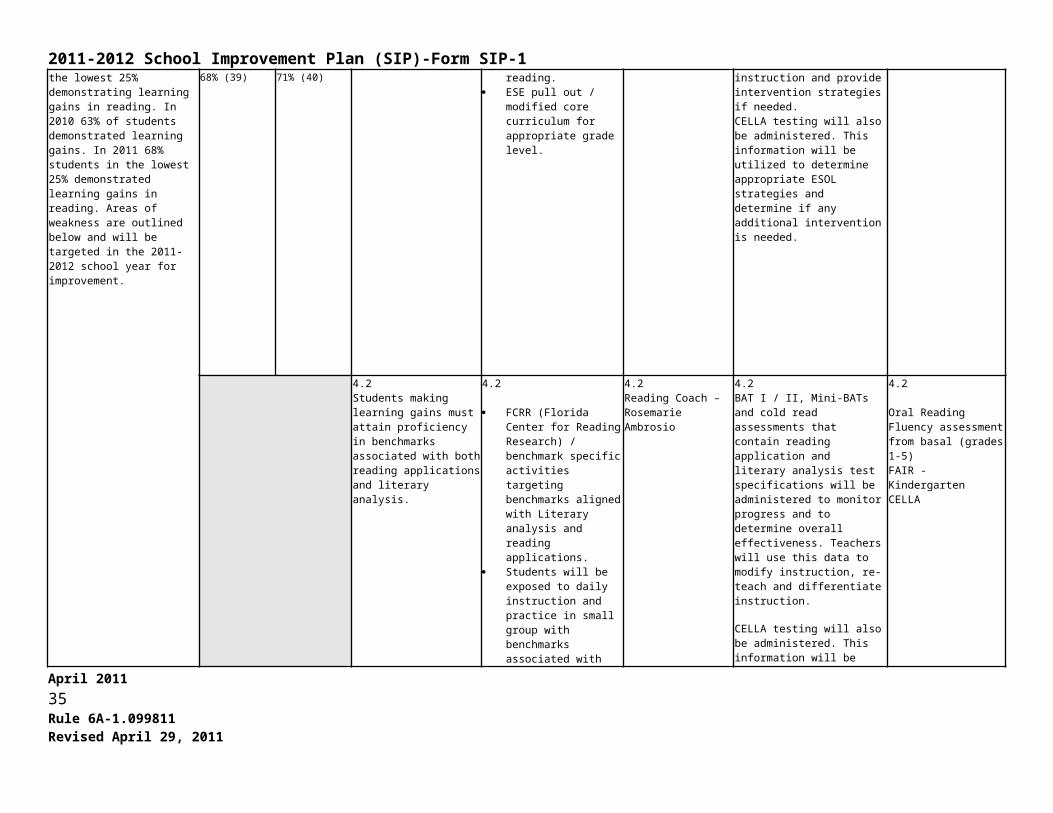
4.2Students making learning gains must attain proficiency in benchmarks associated with both reading applications and literary analysis.
4.2
FCRR (Florida Center for Reading Research) / benchmark specific activities targeting benchmarks aligned with Literary analysis and reading applications.
Students will be exposed to daily instruction and practice in small group with benchmarks associated with reading applications and literary analysis using both instructional materials from the basal reader, FCRR activities and STAR.
Destination Success will be utilized to target specific areas of weakness
Teachers will participate in the unwrapping of power benchmarks in reading applications and literary analysis and create lesson plans to teach these strands.
Teachers are implementing appropriate ESOL strategies and double dosing students in need of intervention
ESE pull-out / modified core curriculum for the appropriate grade level.
4.2Reading Coach –Rosemarie Ambrosio
4.2BAT I / II, Mini-BATs and cold read assessments that contain reading application and literary analysis test specifications will be administered to monitor progress and to determine overall effectiveness. Teachers will use this data to modify instruction, re-teach and differentiate instruction.
CELLA testing will also be administered. This information will be utilized to determine appropriate ESOL strategies and determine if any additional intervention is needed.
4.2
Oral Reading Fluency assessment from basal (grades 1-5)FAIR - KindergartenCELLA
4.3 4.3. 4.3. 4.3. 4.3.
Based on the analysis of student achievement data, and reference to “Guiding Questions”, identify and define areas in need of
improvement for the applicable subgroup(s):
Anticipated Barrier Strategy Person or Position Responsible for
Monitoring
Process Used to Determine Effectiveness of
Strategy
Evaluation Tool
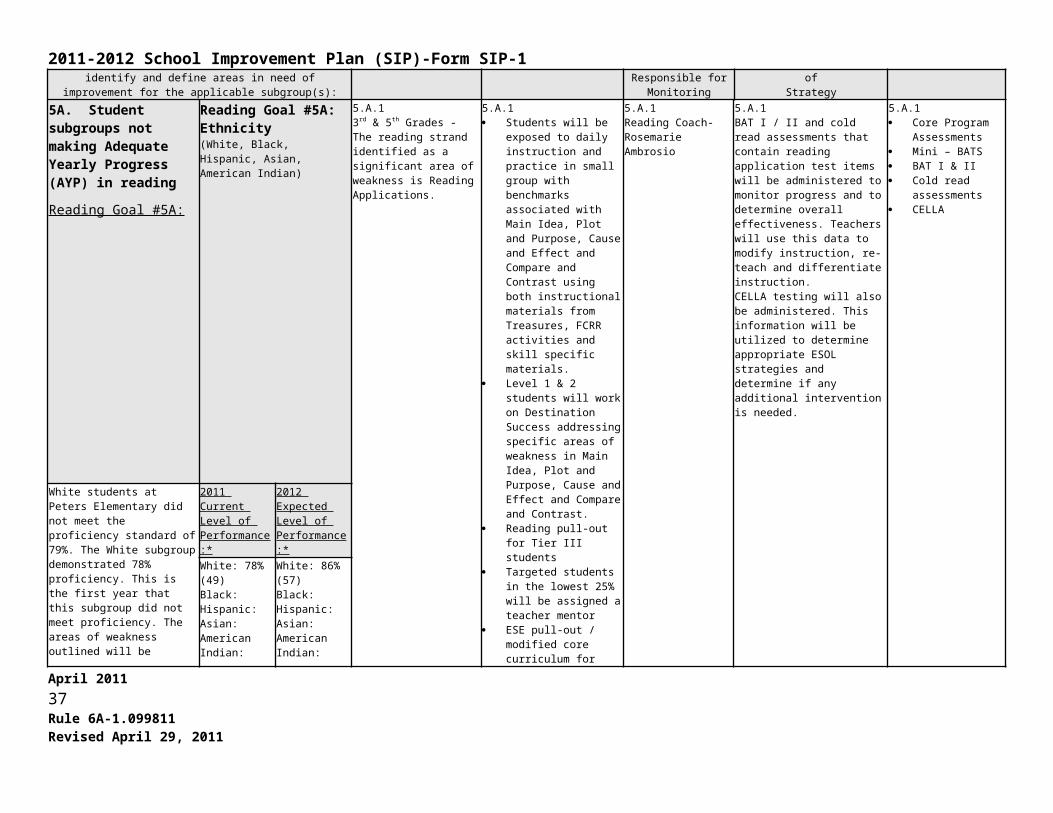
5A. Student subgroups not making Adequate
Reading Goal #5A:Ethnicity
5.A.13rd & 5th Grades - The reading
5.A.1 Students will be exposed to
5.A.1Reading Coach-
5.A.1BAT I / II and cold read
5.A.1 Core Program
April 2011 26Rule 6A-1.099811Revised April 29, 2011
2011-2012 School Improvement Plan (SIP)-Form SIP-1Yearly Progress (AYP) in reading
Reading Goal #5A:
(White, Black, Hispanic, Asian,American Indian)
strand identified as a significant area of weakness is Reading Applications.
daily instruction and practice in small group with benchmarks associated with Main Idea, Plot and Purpose, Cause and Effect and Compare and Contrast using both instructional materials from Treasures, FCRR activities and skill specific materials.
Level 1 & 2 students will work on Destination Success addressing specific areas of weakness in Main Idea, Plot and Purpose, Cause and Effect and Compare and Contrast.
Reading pull-out for Tier III students
Targeted students in the lowest 25% will be assigned a teacher mentor
ESE pull-out / modified core curriculum for appropriate grade level
Teachers are implementing appropriate ESOL strategies and double dosing students in need of intervention
Rosemarie Ambrosio assessments that contain reading application test items will be administered to monitor progress and to determine overall effectiveness. Teachers will use this data to modify instruction, re-teach and differentiate instruction.CELLA testing will also be administered. This information will be utilized to determine appropriate ESOL strategies and determine if any additional intervention is needed.
Assessments Mini – BATS BAT I & II Cold read
assessments CELLA
White students at Peters Elementary did not meet the proficiency standard of 79%. The White subgroup demonstrated 78% proficiency. This is the first year that this subgroup did not meet proficiency. The areas of weakness outlined will be targeted for improvement.
2011 Current Level of Performance:*
2012 Expected Level of Performance:*
White: 78% (49)Black:Hispanic:Asian:American Indian:
White: 86% (57)Black:Hispanic:Asian:American Indian:
5A.2. 5A.2. 5A.2. 5A.2. 5A.2.
5A.3. 5A.3. 5A.3. 5A.3. 5A.3.
Based on the analysis of student achievement data, and reference to “Guiding Questions”, identify and define areas in need of
improvement for the following subgroup:
Anticipated Barrier Strategy Person or Position Responsible for
Monitoring
Process Used to Determine Effectiveness of
Strategy
Evaluation Tool
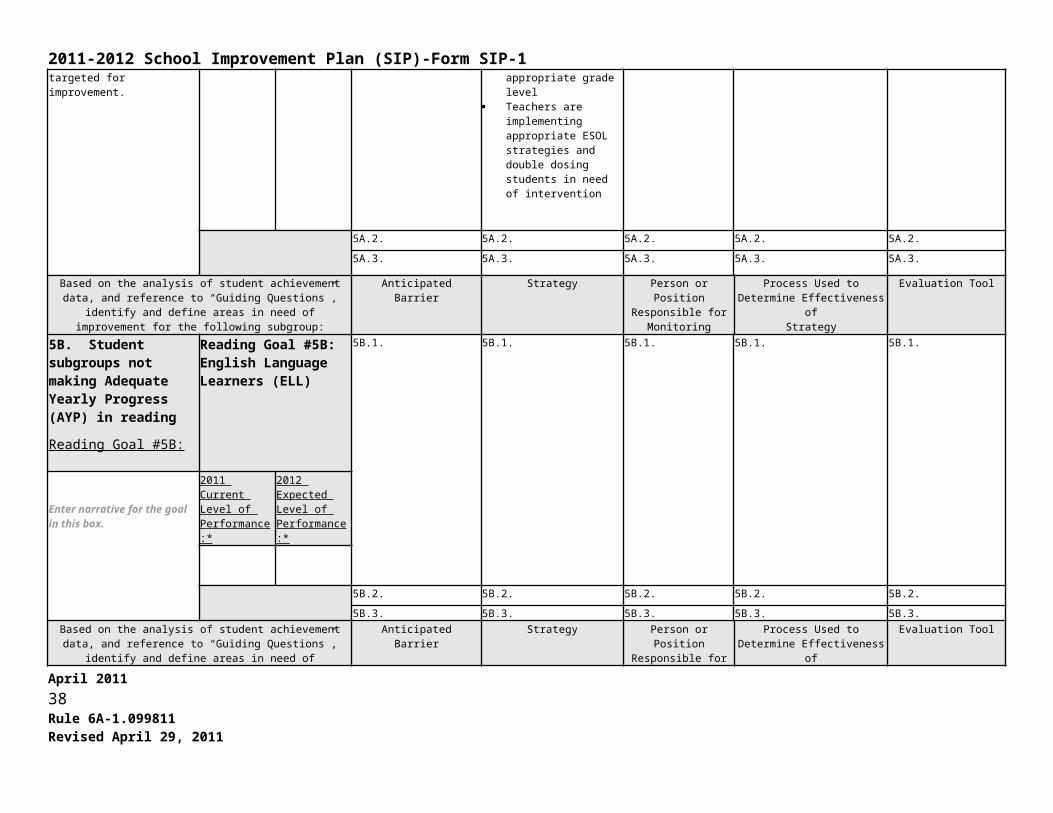
5B. Student subgroups not making Adequate Yearly Progress (AYP) in reading
Reading Goal #5B:
Reading Goal #5B:English Language Learners (ELL)
5B.1. 5B.1. 5B.1. 5B.1. 5B.1.
Enter narrative for the goal in
2011 Current Level of Performance:*
2012 Expected Level of Performance:*
April 2011 27Rule 6A-1.099811Revised April 29, 2011

2011-2012 School Improvement Plan (SIP)-Form SIP-1this box.
5B.2. 5B.2. 5B.2. 5B.2. 5B.2.
5B.3. 5B.3. 5B.3. 5B.3. 5B.3.Based on the analysis of student achievement data, and reference to
“Guiding Questions”, identify and define areas in need of improvement for the following subgroup:
Anticipated Barrier Strategy Person or Position Responsible for
Monitoring
Process Used to Determine Effectiveness of
Strategy
Evaluation Tool
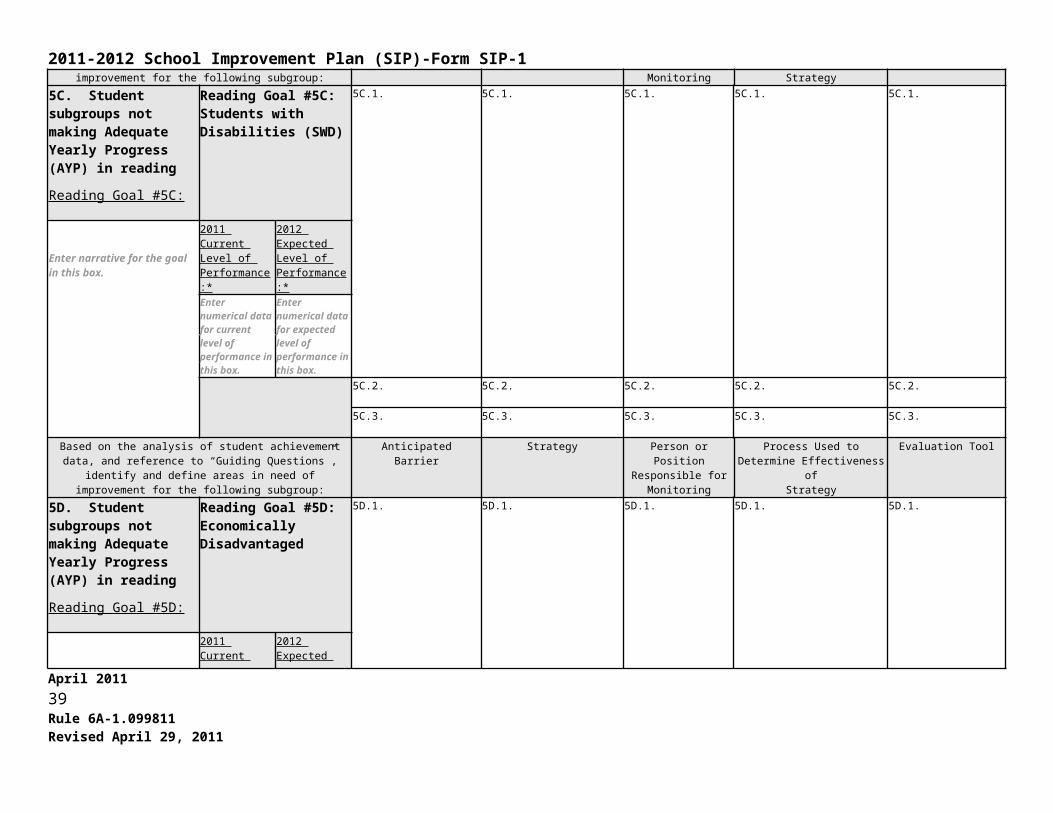
5C. Student subgroups not making Adequate Yearly Progress (AYP) in reading
Reading Goal #5C:
Reading Goal #5C:Students with Disabilities (SWD)
5C.1. 5C.1. 5C.1. 5C.1. 5C.1.
Enter narrative for the goal in this box.
2011 Current Level of Performance:*
2012 Expected Level of Performance:*
Enter numerical data for current level of performance in this box.
Enter numerical data for expected level of performance in this box.
5C.2. 5C.2. 5C.2. 5C.2. 5C.2.
5C.3. 5C.3. 5C.3. 5C.3. 5C.3.
Based on the analysis of student achievement data, and reference to “Guiding Questions”, identify and define areas in need of
improvement for the following subgroup:
Anticipated Barrier Strategy Person or Position Responsible for
Monitoring
Process Used to Determine Effectiveness of
Strategy
Evaluation Tool
5D. Student subgroups not making Adequate Yearly Progress (AYP) in reading
Reading Goal #5D:
Reading Goal #5D:Economically Disadvantaged
5D.1. 5D.1. 5D.1. 5D.1. 5D.1.
Enter narrative for the goal in this box.
2011 Current Level of Performance:*
2012 Expected Level of Performance:*
Enter numerical data for current level of performance in this box.
Enter numerical data for expected level of performance in this box.
5D.2. 5D.2. 5D.2. 5D.2. 5D.2.
April 2011 28Rule 6A-1.099811Revised April 29, 2011
2011-2012 School Improvement Plan (SIP)-Form SIP-1
5D.3. 5D.3. 5D.3. 5D.3. 5D.3.
Professional Development (PD) aligned with Strategies through Professional Learning Community (PLC) or PD ActivityPlease note that each Strategy does not require a professional development or PLC activity.
PD Content /Topicand/or PLC Focus Grade
Level/Subject
PD Facilitatorand/or
PLC Leader
PD Participants (e.g. , PLC, subject, grade level, or
school-wide)
Target Dates and Schedules(e.g. , Early Release) and
Schedules (e.g., frequency of meetings)
Strategy for Follow-up/Monitoring Person or Position Responsible for Monitoring
Unrwrapping Power Benchmarks in Reading K-5 Team Leaders K-5 September Lesson Study / reflection Team Leaders / Administration
Diagnostic Reading Assessment Training Grades 1 & 2
Reading Coach – Rosemarie Ambrosio
Grade 1-2 TBA Student Data Collection Reading Coach – Ms. Ambrosio
Strategies for Struggling Learners K-5
Reading Coach – Rosemarie Ambrosio
K-5 TBA Classroom Walk-Through Administration
Developing and Implementing RtI K-5 ESE Specialist K-5 TBA RtI packets Administration
PLC K-5
Assistant Principal – Mr. DeCotis
School-wide ongoing Follow-up assignments / lesson plans Administration
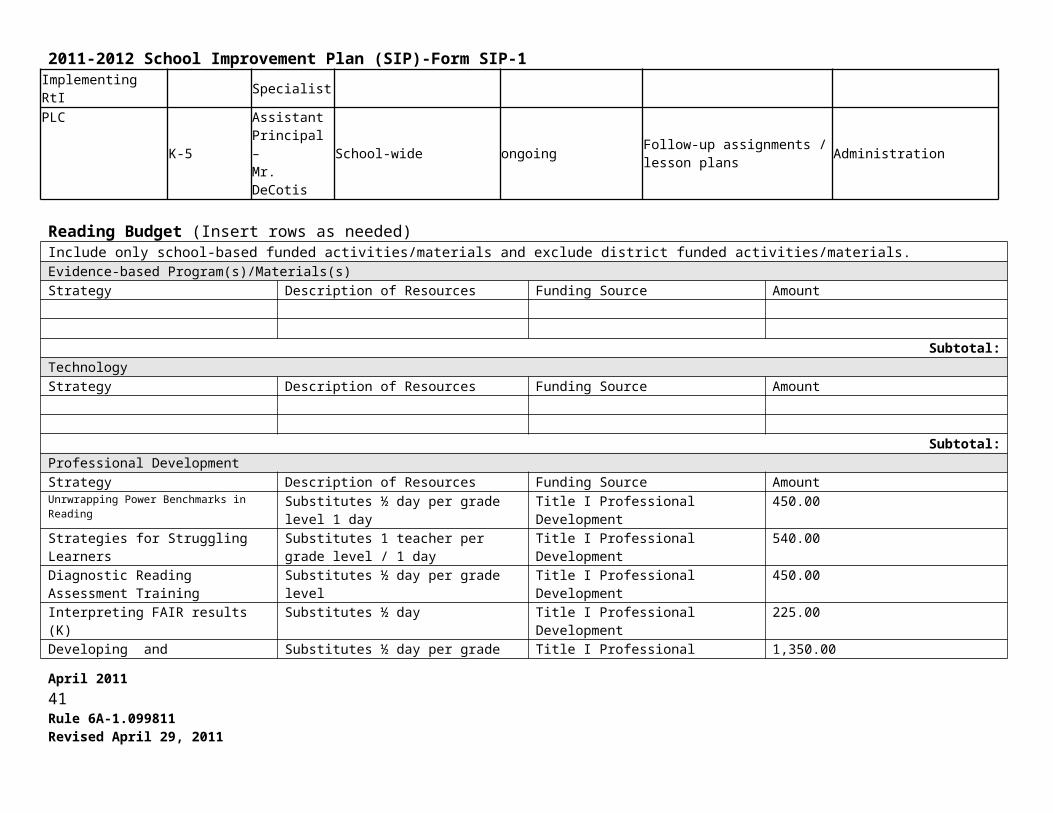
Reading Budget (Insert rows as needed)Include only school-based funded activities/materials and exclude district funded activities/materials.Evidence-based Program(s)/Materials(s)Strategy Description of Resources Funding Source Amount
Subtotal:TechnologyStrategy Description of Resources Funding Source Amount
April 2011 29Rule 6A-1.099811Revised April 29, 2011
2011-2012 School Improvement Plan (SIP)-Form SIP-1Subtotal:
Professional DevelopmentStrategy Description of Resources Funding Source AmountUnrwrapping Power Benchmarks in Reading Substitutes ½ day per grade level 1 day Title I Professional Development 450.00Strategies for Struggling Learners Substitutes 1 teacher per grade level / 1 day Title I Professional Development 540.00Diagnostic Reading Assessment Training Substitutes ½ day per grade level Title I Professional Development 450.00Interpreting FAIR results (K) Substitutes ½ day Title I Professional Development 225.00Developing and Implementing RtI Substitutes ½ day per grade level/ 3 days Title I Professional Development 1,350.00
Subtotal: 3015.00OtherStrategy Description of Resources Funding Source AmountPLC (reading) Literature for each participant Title Professional Development 1,192.00
Subtotal: 1,192.00 Total: 4207.00
End of Reading GoalsMathematics Goals
* When using percentages, include the number of students the percentage represents (e.g. 70% (35)).
MATHEMATICS GOALS Problem-Solving Process to Increase Student AchievementBased on the analysis of student achievement data, and reference to
“Guiding Questions”, identify and define areas in need of improvement for the following group:
Anticipated Barrier Strategy Person or Position Responsible for
Monitoring
Process Used to Determine Effectiveness of
Strategy
Evaluation Tool
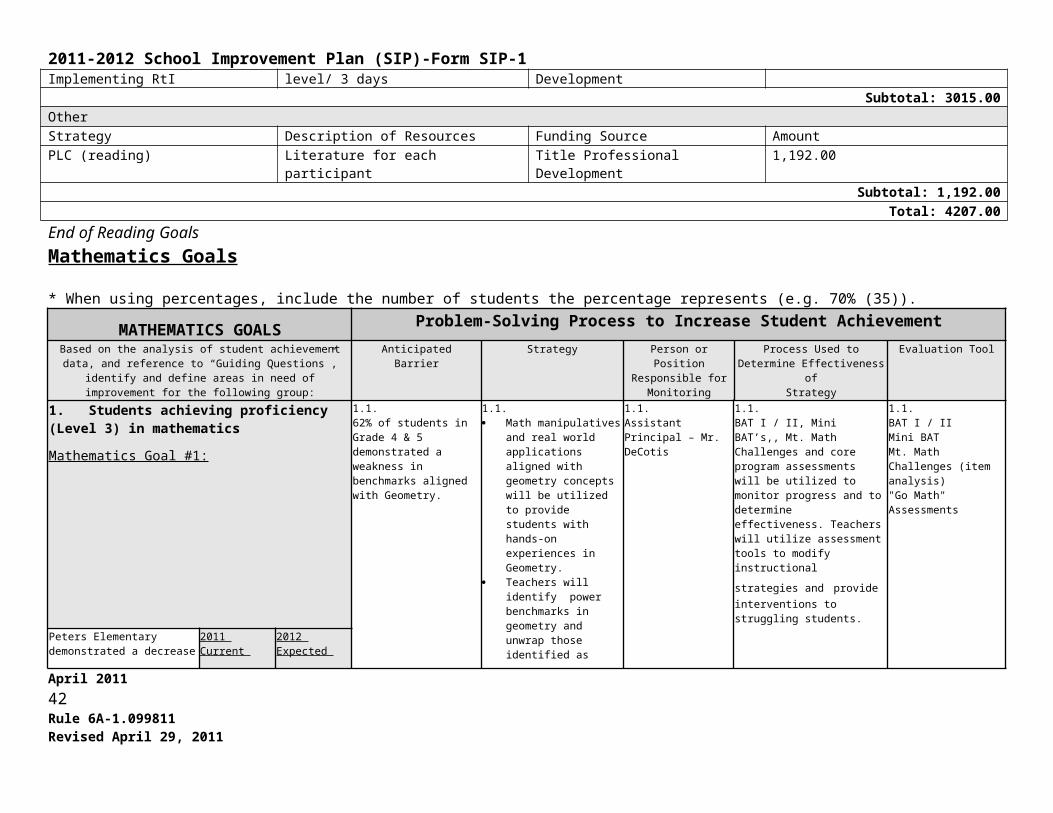
1. Students achieving proficiency (Level 3) in mathematics
Mathematics Goal #1:
1.1.62% of students in Grade 4 & 5 demonstrated a weakness in benchmarks aligned with Geometry.
1.1. Math manipulatives and
real world applications aligned with geometry concepts will be utilized to provide students with hands-on experiences in Geometry.
Teachers will identify power benchmarks in geometry and unwrap those identified as weaknesses.
Destination Success (Riverdeep) will be
1.1.Assistant Principal – Mr. DeCotis
1.1.BAT I / II, Mini BAT’s,, Mt. Math Challenges and core program assessments will be utilized to monitor progress and to determine effectiveness. Teachers will utilize assessment tools to modify
instructional strategies and provide interventions to struggling students.
1.1.BAT I / IIMini BATMt. Math Challenges (item analysis)"Go Math" Assessments
April 2011 30Rule 6A-1.099811Revised April 29, 2011
2011-2012 School Improvement Plan (SIP)-Form SIP-1utilized to provide targeted instruction to students struggling with geometry.
Small group instruction will be utilized for struggling students.
Students will participate in Mt. Math (2-5) and Calendar Math (K-1) on a daily basis
ESE pull-out / modified core curriculum for appropriate grade level.
Peters Elementary demonstrated a decrease the percentage of students scoring a Level 3 in math. In 2010 41% of in grades 3-5 scored a Level 3 in math. In school year 2011 Level 3 33% of students scored at a Level 3 in math. Data analysis of the 2010 scores indicated different areas of weakness in 3rd, 4th and 5th grades. These areas of weakness are outlined below and will be targeted in the 2011-2012 school year for improvement.
2011 Current Level of Performance:*
2012 Expected Level of Performance:*
33% (93) 36% (101)
1.2.55% of students in Grade 3 demonstrated a weakness in benchmarks aligned with Fractions.
1.2. Teachers will identify
power benchmarks aligned with fractions and unwrap those identified as weaknesses.
Destination Success will be utilized to provide targeted instruction to students struggling with fractions.
Small group instruction will be utilized for struggling students.
Students will participate in Mt. Math (2-5) and Calendar Math (K-1) on a daily basis
ESE pull-out / modified core curriculum for appropriate grade level.
1.2.Assistant Principal – Mr. DeCotis
1.2.BAT I / II, Mini BAT’s,, Mt. Math Challenges and core program assessments will be utilized to monitor progress and to determine effectiveness. Teachers will utilize assessment tools to modify
instructional strategies and provide interventions to struggling students
1.2.BAT I / IIMini BATMt. Math Challenges (item analysis)"Go Math" Assessments
1.3.Level 1 & 2 students must become proficient in Big and Supporting Ideas that are aligned to number sense, operations and problem solving.
1.3.
Teachers will identify power benchmarks aligned with number sense, operations and problem solving and unwrap those identified as weaknesses.
Students will work on basic multiplication facts for mastery.
First in Math will be utilized with students to target computation and mental math strategies.
Destination Success will be utilized to provide
1.3.Assistant Principal – Mr. DeCotis
1.3.BAT I / II, Mini BAT’s,, Mt. Math Challenges and core program assessments will be utilized to monitor progress and to determine effectiveness. Teachers will utilize assessment tools to modify
instructional strategies and provide interventions to struggling students
1.3.BAT I / IIMini BATMt. Math Challenges (item analysis)"Go Math" Assessments
April 2011 31Rule 6A-1.099811Revised April 29, 2011
2011-2012 School Improvement Plan (SIP)-Form SIP-1targeted instruction to students struggling with number sense.
Students will participate in Mt. Math (3-5) and Calendar Math (K-2) on a daily basis
Targeted students in the lowest 25% will be assigned a teacher mentor
ESE pull-out / modified core curriculum for appropriate grade level.
Based on the analysis of student achievement data, and reference to “Guiding Questions”, identify and define areas in need of
improvement for the following group:
Anticipated Barrier Strategy Person or Position Responsible for
Monitoring
Process Used to Determine Effectiveness of
Strategy
Evaluation Tool
2. Students achieving above proficiency (Levels 4 and 5) in mathematics
Mathematics Goal #2:
2.1.Level 3,4 & 5 demonstrated a weakness in benchmarks aligned with Geometry.
2.1. Math manipulatives and
real world applications aligned with geometry concepts will be utilized to provide students with hands-on experiences in Geometry.
Teachers will identify power benchmarks in geometry and unwrap those identified as weaknesses.
Destination Success will be utilized to provide targeted instruction to students struggling with geometry.
Small group instruction will be utilized for struggling students.
Students will participate in Mt. Math (2-5) and Calendar Math (K-1) on a daily basis
ESE pull-out / modified core curriculum for appropriate grade level.
2.1.Assistant Principal – Mr. DeCotis
2.1.BAT I / II, Mini BAT’s, , Mt. Math Challenges and core program assessments will be utilized to monitor progress and to determine effectiveness. Teachers will utilize assessment tools to modify
instructional strategies and provide interventions to struggling students.
2.1.BAT I / IIMini BATMt. Math Challenges (item analysis)"Go Math" Assessments
Peters Elementary has increased the percentage of students scoring a Level 4 & 5 in math. In school year 2010 43% of students scored a Level 4 & 5. In school –year 2011 49% of students scored at Level 4 or 5 in math. Data analysis of the 2011 scores indicated common areas of weakness in 4th and 5th grades. In 3rd grade Level 4 & 5 students demonstrated an area of weakness in fractions. These areas of weakness are
2011 Current Level of Performance:*
2012 Expected Level of Performance:*
49% (138) 52% (146)
2.2. 2.2. 2.2. 2.2. 2.2.
2.3 2.3 2.3 2.3 2.3
April 2011 32Rule 6A-1.099811Revised April 29, 2011

2011-2012 School Improvement Plan (SIP)-Form SIP-1outlined below and will be targeted in the 2011-2012 school year for improvement. Finally, geometry will be also targeted as an area of improvement for Level 3 students.
Based on the analysis of student achievement data, and reference to “Guiding Questions”, identify and define areas in need of
improvement for the following group:
Anticipated Barrier Strategy Person or Position Responsible for
Monitoring
Process Used to Determine Effectiveness of
Strategy
Evaluation Tool
3. Percentage of students making Learning Gains in mathematics
Mathematics Goal #3:
3.1.62% of students in Grade 4 & 5 demonstrated a weakness in benchmarks aligned with Geometry.
3.1. Math manipulatives and
real world applications aligned with geometry concepts will be utilized to provide students with hands-on experiences in Geometry.
Teachers will identify power benchmarks in geometry and unwrap those identified as weaknesses.
Destination Success (Riverdeeep) will be utilized to provide targeted instruction to students struggling with geometry.
Small group instruction will be utilized for struggling students.
3.1.Assistant Principal – Mr. DeCotis
3.1.BAT I / II, Mini BAT’s, , Mt. Math Challenges and core program assessments will be utilized to monitor progress and to determine effectiveness. Teachers will utilize assessment tools to modify
instructional strategies and provide interventions to struggling students.
3.1.BAT I / IIMini BATMt. Math Challenges (item analysis)"Go Math" Assessments
April 2011 33Rule 6A-1.099811Revised April 29, 2011
2011-2012 School Improvement Plan (SIP)-Form SIP-1 Students will participate in
Mt. Math (2-5) and Calendar Math (K-1) on a daily basis
ESE pull-out / modified core curriculum for appropriate grade level.
Peters Elementary has demonstrated an increase in the percentage of students achieving learning gains in math. In 2010 66% of students showed learning gains. In 2011 68% of students in the lowest 25% made learning gains. In 2010 the greatest area of weakness was in data analysis. Areas of weakness are outlined and will be targeted in the 2010-2011 school year for improvement.
2011 Current Level of Performance:*
2012Expected Level of Performance:*
68% (152) 71% (158)
1.2.55% of students in Grade 3 demonstrated a weakness in benchmarks aligned with Fractions.
1.2. Teachers will identify
power benchmarks aligned with fractions and unwrap those benchmarks identified as weaknesses.
Destination Success (Riverdeeep) will be utilized to provide targeted instruction to students struggling with fractions.
Small group instruction will be utilized for struggling students.
Students will participate in Mt. Math (2-5) and Calendar Math (K-1) on a daily basis
ESE pull-out / modified core curriculum for appropriate grade level.
1.2.Assistant Principal – Mr. DeCotis
1.2.BAT I / II, Mini BAT’s, Compass Odyssey quizzes, Mt. Math Challenges and core program assessments will be utilized to monitor progress and to determine effectiveness. Teachers will utilize assessment tools to modify
instructional strategies and provide interventions to struggling students
1.2.BAT I / IIMini BATMt. Math Challenges (item analysis)"Go Math" Assessments
3.3. 3.3. 3.3. 3..3. 3.3.
Based on the analysis of student achievement data, and reference to “Guiding Questions”, identify and define areas in need of
improvement for the following group:
Anticipated Barrier Strategy Person or Position Responsible for
Monitoring
Process Used to Determine Effectiveness of
Strategy
Evaluation Tool
4. Percentage of students in Lowest 25% making learning gains in mathematics
Mathematics Goal #4:
4.1Level 1 & 2 students must become proficient in Big and Supporting Ideas that are aligned to number sense, operations and problem solving.
4.1
Teachers will identify power benchmarks aligned with to number sense, operations and problem solving and unwrap those benchmarks identified as weaknesses.
Students will work on basic multiplication facts for mastery.
First in Math will be utilized with students to target computation and mental math strategies.
4.1Assistant Principal – Mr. DeCotis
4.1BAT I / II, Mini BAT’s, Mt. Math Challenges and core program assessments will be utilized to monitor progress and to determine effectiveness. Teachers will utilize assessment tools to modify
instructional strategies and provide interventions to struggling students
4.1BAT I / IIMini BATMt. Math Challenges (item analysis)"Go Math" Assessments
April 2011 34Rule 6A-1.099811Revised April 29, 2011
2011-2012 School Improvement Plan (SIP)-Form SIP-1 Destination Success
(Riverdeep) will be utilized to provide targeted instruction to students struggling with number sense.
Students will participate in Mt. Math (3-5) and Calendar Math (K-2) on a daily basis
Targeted students in the lowest 25% will be assigned a teacher mentor
ESE pull-out / modified core curriculum for appropriate grade level.
Peters Elementary has demonstrated an increase in students in the lowest 25% demonstrating learning gains in math. In 2010 55% of students demonstrated learning gains. In 2010 this percentage decreased by 10%. In 2011 65% of students in the lowest 25% scored made a learning gain. Big and supporting ideas aligned with number sense a, operations and problem solving were areas of weakness among Level 1 & 2 students. This area of weakness is outlined below and will be targeted for improvement.
2011 Current Level of Performance:*
2012 Expected Level of Performance:*
65% (37) 68% (39)
4.2. 4.2. 4.2. 4.2. 4.2.
4.3. 4.3. 4.3. 4.3. 4.3.
Based on the analysis of student achievement data, and reference to “Guiding Questions”, identify and define areas in need of
improvement for the applicable subgroup(s):
Anticipated Barrier Strategy Person or Position Responsible for
Monitoring
Process Used to Determine Effectiveness of
Strategy
Evaluation Tool
5A. Student subgroups not making Adequate Yearly Progress (AYP) in mathematics
Mathematics Goal #5A:
Mathematics Goal #5A:Ethnicity (White, Black, Hispanic, Asian,American Indian)
3.1.62% of students in Grade 4 & 5 demonstrated a weakness in benchmarks aligned with Geometry.
3.1. Math manipulatives and
real world applications aligned with geometry concepts will be utilized to provide students with hands-on experiences in Geometry.
Teachers will identify power benchmarks in geometry and unwrap those benchmarks identified as weaknesses.
Compass Odyssey will be utilized to provide targeted instruction to students struggling with geometry.
3.1.Assistant Principal – Mr. DeCotis
3.1.BAT I / II, Mini BAT’s, Mt. Math Challenges and core program assessments will be utilized to monitor progress and to determine effectiveness. Teachers will utilize assessment tools to modify
instructional strategies and provide interventions to struggling students.
3.1.BAT I / IIMini BATMt. Math Challenges (item analysis)"Go Math" Assessments
April 2011 35Rule 6A-1.099811Revised April 29, 2011
2011-2012 School Improvement Plan (SIP)-Form SIP-1 Small group instruction
will be utilized for struggling students.
Students will participate in Mt. Math (2-5) and Calendar Math (K-1) on a daily basis
ESE pull-out / modified core curriculum for appropriate grade level.
Black students at Peters Elementary did not meet the 2011 AYP proficiency standard. In 2011 70% of black students scored a level 3 or higher in FCAT Math. Areas of weakness are outlined for improvement.
2011 Current Level of Performance:*
2012 Expected Level of Performance:*
White:Black :70% (97)Hispanic:Asian:American Indian:
White:Black: 86% (119)Hispanic:Asian:American Indian:
1.2.55% of students in Grade 3 demonstrated a weakness in benchmarks aligned with Fractions.
1.2. Teachers will identify
power benchmarks aligned with fractions and unwrap those benchmarks identified as weaknesses.
Compass Odyssey will be utilized to provide targeted instruction to students struggling with geometry.
Small group instruction will be utilized for struggling students.
Students will participate in Mt. Math (2-5) and Calendar Math (K-1) on a daily basis
ESE pull-out / modified core curriculum for appropriate grade level.
1.2.Assistant Principal – Mr. DeCotis
1.2.BAT I / II, Mini BAT’s, Compass Odyssey quizzes, Mt. Math Challenges and core program assessments will be utilized to monitor progress and to determine effectiveness. Teachers will utilize assessment tools to modify
instructional strategies and provide interventions to struggling students
1.2.BAT I / IIMini BATCompass OdysseyMt. Math Challenges (item analysis)"Go Math" Assessments
5A.3. 5A.3. 5A.3. 5A.3. 5A.3.Based on the analysis of student achievement data, and reference to
“Guiding Questions”, identify and define areas in need of improvement for the following subgroup:
Anticipated Barrier Strategy Person or Position Responsible for
Monitoring
Process Used to Determine Effectiveness of
Strategy
Evaluation Tool
5B. Student subgroups not making Adequate Yearly Progress (AYP) in mathematics
Mathematics Goal #5B:
Mathematics Goal #5B:English Language Learners (ELL)
5B.1. 5B.1. 5B.1. 5B.1. 5B.1.
Enter narrative for the goal in this box.
2011 Current Level of Performance:*
2012 Expected Level of Performance:*
Enter numerical data for current level of performance in this box.
Enter numerical data for expected level of performance in this box.
April 2011 36Rule 6A-1.099811Revised April 29, 2011
2011-2012 School Improvement Plan (SIP)-Form SIP-15B.2. 5B.2. 5B.2. 5B.2. 5B.2.
5B.3 5B.3. 5B.3. 5B.3. 5B.3.
Based on the analysis of student achievement data, and reference to “Guiding Questions”, identify and define areas in need of
improvement for the following subgroup:
Anticipated Barrier Strategy Person or Position Responsible for
Monitoring
Process Used to Determine Effectiveness of
Strategy
Evaluation Tool
5C. Student subgroups not making Adequate Yearly Progress (AYP) in mathematics
Mathematics Goal #5C:
Mathematics Goal #5C:Students with Disabilities (SWD)
5C.1. 5C.1. 5C.1. 5C.1. 5C.1.
Enter narrative for the goal in this box.
2011 Current Level of Performance:*
2012 Expected Level of Performance:*
Enter numerical data for current level of performance in this box.
Enter numerical data for expected level of performance in this box.
5C.2. 5C.2. 5C.2. 5C.2. 5C.2.
5C.3. 5C.3. 5C.3. 5C.3. 5C.3.
Based on the analysis of student achievement data, and reference to “Guiding Questions”, identify and define areas in need of
improvement for the following subgroup:
Anticipated Barrier Strategy Person or Position Responsible for
Monitoring
Process Used to Determine Effectiveness of
Strategy
Evaluation Tool
5D. Student subgroups not making Adequate Yearly Progress (AYP) in mathematics
Mathematics Goal #5D:
Mathematics Goal #5D:Economically Disadvantaged
5D.1. 5D.1. 5D.1. 5D.1. 5D.1.
Enter narrative for the goal in this box.
2011 Current Level of Performance:*
2012 Expected Level of Performance:*
Enter numerical data for current level of performance in this box.
Enter numerical data for expected level of performance in this box.
April 2011 37Rule 6A-1.099811Revised April 29, 2011
2011-2012 School Improvement Plan (SIP)-Form SIP-15D.2. 5D.2. 5D.2. 5D.2. 5D.2.
5D.3. 5D.3. 5D.3. 5D.3. 5D.3.
Professional Development (PD) aligned with Strategies through Professional Learning Community (PLC) or PD ActivityPlease note that each Strategy does not require a professional development or PLC activity.
PD Content /Topicand/or PLC Focus Grade
Level/Subject
PD Facilitatorand/or
PLC Leader
PD Participants (e.g. , PLC, subject, grade level, or
school-wide)
Target Dates and Schedules(e.g. , Early Release) and
Schedules (e.g., frequency of meetings)
Strategy for Follow-up/Monitoring Person or Position Responsible for Monitoring
Unrwrapping Power Benchmarks in MATH K-5 Team Leaders School-wide September Lesson Study / reflection Team Leaders / Adminstration
Strategies for Struggling Students / Math K-5
Reading Coach – Rosemarie Ambrosio
K-5 TBA Classroom Walk-Through Administration
Mathematics Budget (Insert rows as needed)Include only school-based funded activities/materials and exclude district funded activities /materials.Evidence-based Program(s)/Materials(s)Strategy Description of Resources Funding Source Amount
Subtotal:TechnologyStrategy Description of Resources Funding Source Amount
Subtotal:Professional DevelopmentStrategy Description of Resources Funding Source AmountUnrwrapping Power Benchmarks in MATH Substitutes ½ day per grade level 1 day Title I Professional Development 450.00Strategies for Struggling Learners Substitutes 1 teacher per grade level / 1 day Title I Professional Development 540.00
Subtotal: 990.00Other
April 2011 38Rule 6A-1.099811Revised April 29, 2011
2011-2012 School Improvement Plan (SIP)-Form SIP-1Strategy Description of Resources Funding Source Amount
Subtotal: Total: 990.00
End of Mathematics Goals
Science Goals
* When using percentages, include the number of students the percentage represents next to the percentage (e.g. 70% (35)).
SCIENCE GOALS Problem-Solving Process to Increase Student AchievementBased on the analysis of student achievement data, and reference to
“Guiding Questions”, identify and define areas in need of improvement for the following group:
Anticipated Barrier Strategy Person or Position Responsible for
Monitoring
Process Used to Determine Effectiveness of
Strategy
Evaluation Tool
1. Students achieving proficiency (FCAT Level 3) in science
Science Goal #1:
1.1.Students and teachers alike need increased knowledge of the test specifications and time engaging in the scientific process from beginning to end.
1.1. Fifth grade teachers will
unwrap benchmarks aligned with targeted areas of weakness.
A fifth grade science lab will be created for the use of hands on science activities and experiments that involve taking students through the scientific process.
Additional Science labs will be created for grades K-4.
Students in K-5 will engage in weekly science activities and experiments that involve taking students through the scientific process.
Students in grades 3-5 will participate in science special class focused on further exposing them to more scientific thinking and hands on work in science.
1.1.Assistant Principal – Mr. DeCotis
1.1.Mini BAT assessments, BAT I / II data along with core program test and quizzes will be utilized to monitor progress and to measure effectiveness. Teachers will utilize this data to modify instruction and provide students with remediation when needed.
1.1.•BAT I and II data• Mini BATS• Core program tests & quizzes
Peters Elementary demonstrated a decrease in students scoring at Level 3 in on the 2011 Science
2011 Current Level of Performance:*
2012 Expected Level of Performance:*
April 2011 39Rule 6A-1.099811Revised April 29, 2011

2011-2012 School Improvement Plan (SIP)-Form SIP-1FCAT. In 2010 38% of students scored Level 3 as compared to 31% in 2011. Identified areas of weakness are targeted for improvement in 2011.
31% (33) 38% (41)
1.2.Students need to further develop science vocabulary and their ability to read and synthesize science content.
1.2.Develop an interdisciplinary lesson plan format that all teachers will use.
• Develop interdisciplinary Units (Science/Reading)
• Display visual word walls per unit
• Science Saurus will be utilized as a supplementary reference tool.•Utilize Science Studies Weekly publication.
1.2.
Assistant Principal – Mr. DeCotis
1.2.Mini BAT assessments, BAT I / II data along with core program test and quizzes will be utilized to monitor progress. The 2011 FCAT will be used to measure effectiveness. Teachers will utilize this data to modify instruction and provide students with remediation when needed.
1.2.• BAT I and II data• Mini BATS• Core program tests & quizzes
1.3. 1.3. 1.3. 1.3. 1.3.
Based on the analysis of student achievement data, and reference to “Guiding Questions”, identify and define areas in need of
improvement for the following group:
Anticipated Barrier Strategy Person or Position Responsible for
Monitoring
Process Used to Determine Effectiveness of
Strategy
Evaluation Tool
2. Students achieving above proficiency (FCAT Levels 4 and 5) in science
Science Goal #2:
2.1.
Increased motivation to excel in science.
2.1. Business partners and
community members will be recruited to judge our science fair and provide awards for students.
A science fair will be held with student prizes to build motivation among students.
Student science projects will be recognized and celebrated on school closed circuit television “Panda Vision”
Science Alive Videos will be utilized to build students visual and real world sense of science concepts.
Virtual Science
2.1.Assistant Principal – Mr. DeCotis
2.1Mini BAT assessments, BAT I / II data along with core program test and quizzes will be utilized to monitor progress. The 2011 FCAT will be used to measure effectiveness. Teachers will utilize this data to modify instruction and provide students with remediation when needed.
2.1• BAT I and II data• Mini BATS• Core program tests & quizzes
April 2011 40Rule 6A-1.099811Revised April 29, 2011
2011-2012 School Improvement Plan (SIP)-Form SIP-1experiments will be utilized to expand the overall science experience for students.
2 Promethean Boards will be utilized in 5th grade classrooms to promote active learning.
The percentage of Level 4 & 5 students doubles on the 2011 Science FCAT. In 2010 5% of students scored a Level 4 & 5 as compared to 13% in 2011. Identified areas of weakness outlined below will be targeted for improvement.
2011 Current Level of Performance:*
2012 Expected Level of Performance:*
13% (12) 15% (16)
2.2. 2.2. 2.2. 2.2. 2.2.
2.3 2.3 2.3 2.3 2.3
Professional Development (PD) aligned with Strategies through Professional Learning Community (PLC) or PD ActivityPlease note that each Strategy does not require a professional development or PLC activity.
PD Content /Topicand/or PLC Focus Grade
Level/Subject
PD Facilitatorand/or
PLC Leader
PD Participants (e.g. , PLC, subject, grade level, or
school-wide)
Target Dates and Schedules(e.g. , Early Release) and
Schedules (e.g., frequency of meetings)
Strategy for Follow-up/Monitoring Person or Position Responsible for Monitoring
Unrwrapping Power Benchmarks in Science K-5 Team Leaders School-wide September Lesson Study / reflection Team Leaders / Administration
Science Budget (Insert rows as needed)Include only school-based funded activities/materials and exclude district funded activities/materials.Evidence-based Program(s)/Materials(s)Strategy Description of Resources Funding Source Amount
Subtotal:TechnologyStrategy Description of Resources Funding Source Amount
Subtotal:
April 2011 41Rule 6A-1.099811Revised April 29, 2011
2011-2012 School Improvement Plan (SIP)-Form SIP-1Professional DevelopmentStrategy Description of Resources Funding Source AmountUnrwrapping Power Benchmarks in Science Substitutes ½ day per grade level 1 day Title I Professional Development 450.00
Subtotal: 450.00OtherStrategy Description of Resources Funding Source Amount
Subtotal: Total: 450.00
End of Science Goals
Writing Goals
* When using percentages, include the number of students the percentage represents next to the percentage (e.g. 70% (35)). WRITING GOALS Problem-Solving Process to Increase Student Achievement
Based on the analysis of student achievement data, and reference to “Guiding Questions”, identify and define areas in need of
improvement for the following group:
Anticipated Barrier Strategy Person or Position Responsible for
Monitoring
Process Used to Determine Effectiveness of
Strategy
Evaluation Tool
1. Students achieving Adequate Yearly Progress (FCAT Level 4.0 and higher) in writing
Writing Goal #1:
1.1.Based on new standards for FCAT writing students and teacher will need to increase performance and instruction in the area of conventions.
1.1. Daily Language program
will be infused into the writing block in 4th grade.
Teacher will be trained in the new expectations for conventions in student papers.
Scoring of student work will include increased expectations for conventions.
FCAT writing simulations will be use on an ongoing basis throughout the year to both prepare students and to provide teachers with authentic progress monitoring for remediation or enrichment.
1.1.Assistant Principal – Mr. DeCotis
1.1.Students in 3rd and 4th grades will participate in timed FCAT writing simulations. Student writing will then be scored and managed to monitor progress and to determine effectiveness. Teacher will use this
data to modify instruction and provide remediation.
1.1.Timed FCAT writing simulations
97% of students scored a 4.0 or higher on the 2011 FCAT Writing. This score demonstrated a 10% increase from 2010. All subgroups made AYP requirements in writing. Identified areas below will
2011 Current Level of Performance:*
2012 Expected Level of Performance:*
97% (88) 98% (89)
1.2. 1.2. 1.2. 1.2 1.2
April 2011 42Rule 6A-1.099811Revised April 29, 2011

2011-2012 School Improvement Plan (SIP)-Form SIP-1
be targeted for improvement.
The quality of support used in student papers must increase to reach 98% proficiency.
4th Grade students will be ability grouped in order to differentiate instruction and to target homogenous weaknesses / strengths in writing.
Identified students not meeting proficiency standards in writing will be provided a double dose of writing. A teacher with proven writing expertise will provide the double-dose.
Elements of Vocabulary will be utilized in grades 2- 4 to build mature word use in student papers.
Students in each writing class who demonstrate growth in developing support will be celebrated by attending Author’s Tea with administration on a weekly basis.
Student in grades 2-3 will also participate in timed writing simulations to further build their capacity to provide detailed support in the writing process.
Assistant Principal – Mr. DeCotis
Students in 3rd and 4th grades will participate in timed FCAT writing simulations. Student writing will then be scored and managed to monitor progress and to determine effectiveness. Teacher will use this
data to modify instruction and provide remediation.
Timed FCAT writing simulations
1.3. 1.3. 1.3. 1.3. 1.3.Based on the analysis of student achievement data, and reference to
“Guiding Questions”, identify and define areas in need of improvement for the following group:
Anticipated Barrier Strategy Person or Position Responsible for
Monitoring
Process Used to Determine Effectiveness of
Strategy
Evaluation Tool
2A. Student subgroups not making Adequate Yearly Progress (AYP) in writing
Writing Goal #2A:
Writing Goal #2A:Ethnicity (White, Black, Hispanic, Asian,American Indian)
2A.1.White:Black:Hispanic:Asian:American Indian:
2A.1. 2A.1. 2A.1. 2A.1.
Enter narrative for the goal in this box.
2011 Current Level of Performance:*
2012 Expected Level of Performance:*
Enter numerical data for current level of performance in this
Enter numerical data for expected level of performance in this
April 2011 43Rule 6A-1.099811Revised April 29, 2011
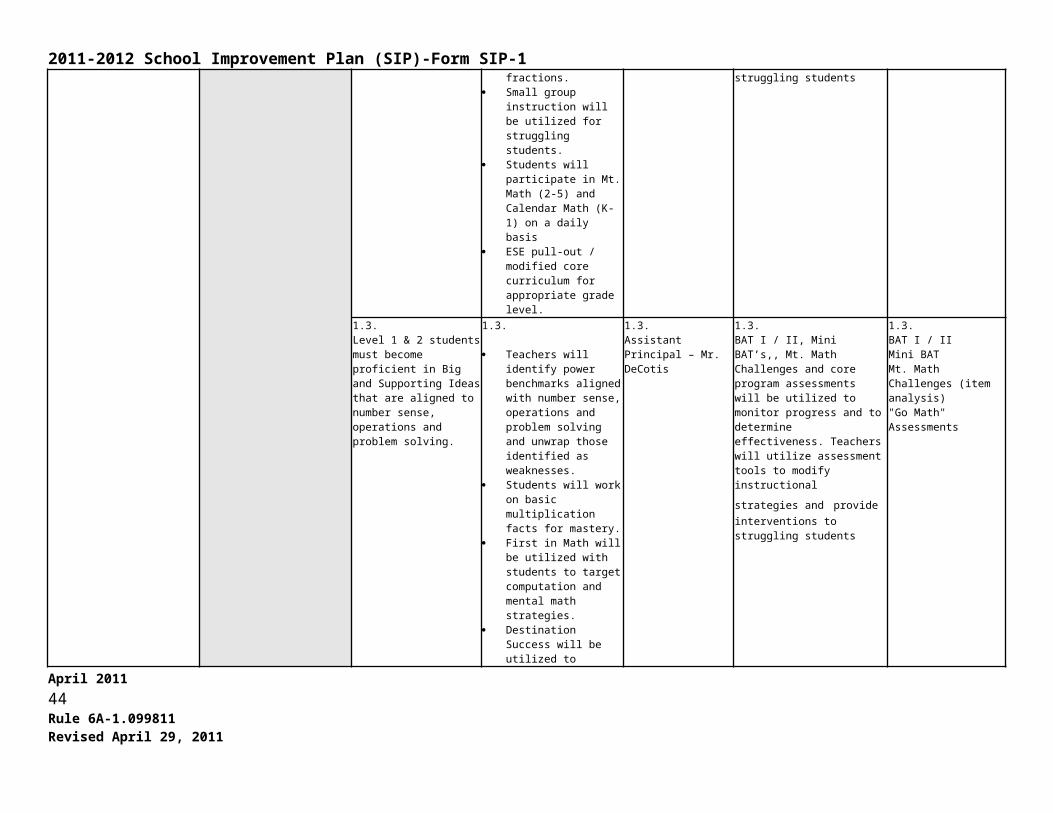
2011-2012 School Improvement Plan (SIP)-Form SIP-1box.White:Black:Hispanic:Asian:American Indian:
box.White:Black:Hispanic:Asian:American Indian:
2A.2. 2A.2. 2A.2. 2A.2. 2A.2.
2A.3. 2A.3. 2A.3. 2A.3. 2A.3.Based on the analysis of student achievement data, and reference to
“Guiding Questions”, identify and define areas in need of improvement for the following subgroup:
Anticipated Barrier Strategy Person or Position Responsible for
Monitoring
Process Used to Determine Effectiveness of
Strategy
Evaluation Tool
2B. Student subgroups not making Adequate Yearly Progress (AYP) in writing
Writing Goal #2B:
Writing Goal #2B:English Language Learners (ELL)
2B.1. 3B.1. 2B.1. 2B.1. 2B.1.
Enter narrative for the goal in this box.
2011 Current Level of Performance:*
2012 Expected Level of Performance:*
Enter numerical data for current level of performance in this box.
Enter numerical data for expected level of performance in this box.
2B.2. 2B.2. 2B.2. 2B.2. 2B.2.
2B.3. 2B.3. 2B.3. 2B.3. 2B.3.
Based on the analysis of student achievement data, and reference to “Guiding Questions”, identify and define areas in need of
improvement for the following subgroup:
Anticipated Barrier Strategy Person or Position Responsible for
Monitoring
Process Used to Determine Effectiveness of
Strategy
Evaluation Tool
2C. Student subgroups not making Adequate Yearly Progress (AYP) in writing
Writing Goal #2C:
Writing Goal #2C:Students with Disabilities (SWD)
2C.1. 2C.1. 2C.1. 2C.1. 2C.1.
Enter narrative for the goal in this box.
2011 Current Level of Performance:*
2012 Expected Level of Performance:*
Enter numerical data for current level of performance in this box.
Enter numerical data for expected level of performance in this box.
April 2011 44Rule 6A-1.099811Revised April 29, 2011
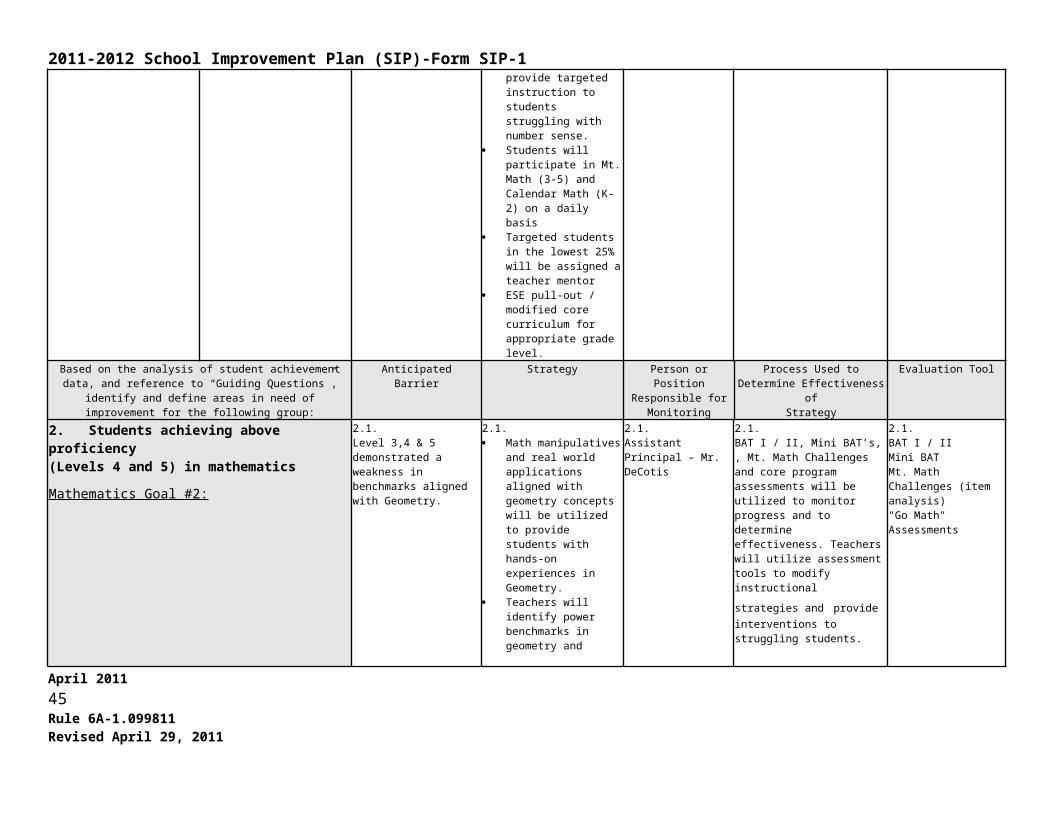
2011-2012 School Improvement Plan (SIP)-Form SIP-1
2C.2. 2C.2. 2C.2. 2C.2. 2C.2.
2C.3. 2C.3. 2C.3. 2C.3. 2C.3.
Based on the analysis of student achievement data, and reference to “Guiding Questions”, identify and define areas in need of
improvement for the following subgroup:
Anticipated Barrier Strategy Person or Position Responsible for
Monitoring
Process Used to Determine Effectiveness of
Strategy
Evaluation Tool
2D. Student subgroups not making Adequate Yearly Progress (AYP) in writing
Writing Goal #2D:
Writing Goal #2D:Economically Disadvantaged
2D.1. 2D.1. 2D.1. 2D.1. 2D.1.
Enter narrative for the goal in this box.
2011 Current Level of Performance:*
2012 Expected Level of Performance:*
Enter numerical data for current level of performance in this box.
Enter numerical data for expected level of performance in this box.
2D.2. 2D.2. 2D.2. 2D.2. 2D.2.
2D.3. 2D.3. 2D.3. 2D.3. 2D.3.
Professional Development (PD) aligned with Strategies through Professional Learning Community (PLC) or PD ActivityPlease note that each Strategy does not require a professional development or PLC activity.
PD Content /Topicand/or PLC Focus Grade
Level/Subject
PD Facilitatorand/or
PLC Leader
PD Participants (e.g. , PLC, subject, grade level, or
school-wide)
Target Dates and Schedules(e.g. , Early Release) and
Schedules (e.g., frequency of meetings)
Strategy for Follow-up/Monitoring Person or Position Responsible for Monitoring
Understanding new expectations for 2012 FCAT Writes / Building Support in the Writing Process
Grade - 4Mr. DeCotis – Assistant Principal
Teachers in grades 4Intial Training -SeptemberFollow-up - January
Anaylsis of student data at follow-up
Mr. DeCotis – Assistant Principal
Understanding new expectations for 2012 FCAT Writes / Building Support in the Writing
Grade K-3 Teachers grades K-3 October – 3rd gradeNovember – 2nd gradeJanuary = 1st
Anaylsis of student data at follow-up
Mr. DeCotis – Assistant Principal
April 2011 45Rule 6A-1.099811Revised April 29, 2011
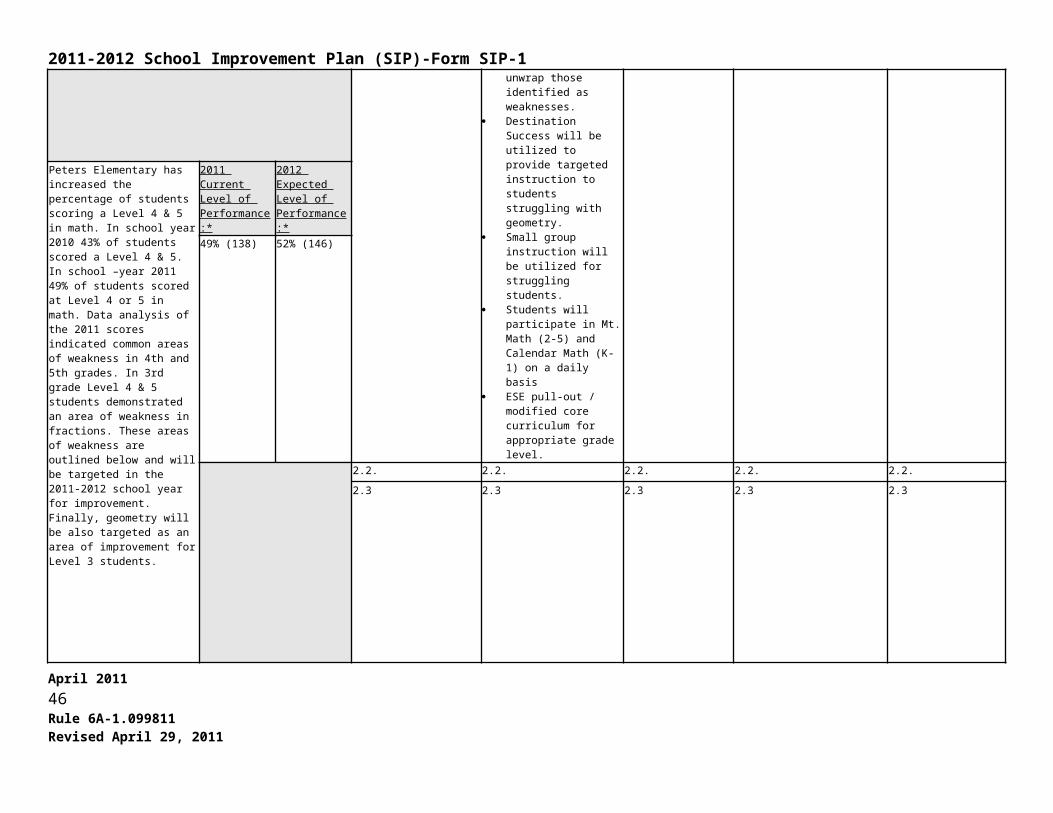
2011-2012 School Improvement Plan (SIP)-Form SIP-1Process February - Kindergarten
Writing Budget (Insert rows as needed)Include only school-based funded activities/materials and exclude district funded activities/materials.Evidence-based Program(s)/Materials(s)Strategy Description of Resources Funding Source Amount
Subtotal:TechnologyStrategy Description of Resources Funding Source Amount
Subtotal:Professional DevelopmentStrategy Description of Resources Funding Source AmountUnderstanding new expectations for 2012 FCAT Writes / Building Support in the Writing Process
Substitute 2 days (5 teachers) Title I professional Development 900.00
Understanding new expectations for 2012 FCAT Writes / Building Support in the Writing Process
Substitutes ½ day per grade level / 2days total
Title I professional Development 900.00
Subtotal: 1800.00
April 2011 46Rule 6A-1.099811Revised April 29, 2011
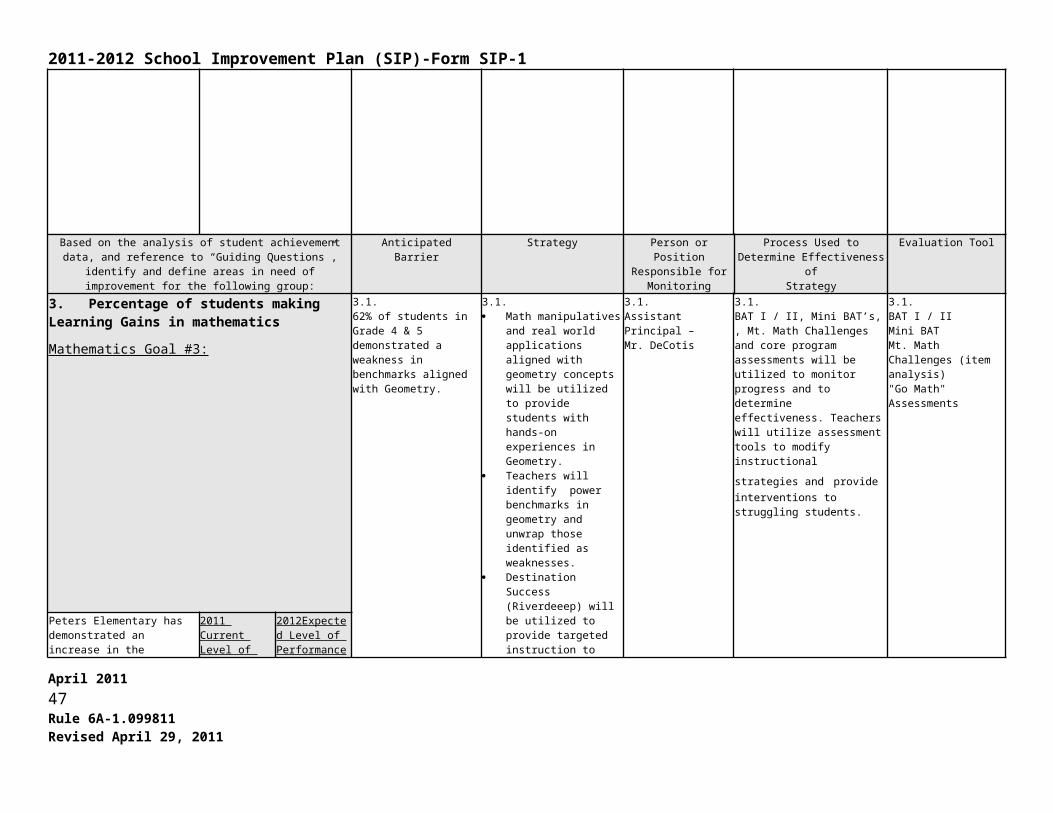
2011-2012 School Improvement Plan (SIP)-Form SIP-1OtherStrategy Description of Resources Funding Source Amount
Subtotal: Total: 1800.00
End of Writing Goals
Attendance Goal(s)
* When using percentages, include the number of students the percentage represents next to the percentage (e.g. 70% (35)).
ATTENDANCE GOAL(S) Problem-solving Process to Increase AttendanceBased on the analysis of attendance data, and reference to “Guiding
Questions”, identify and define areas in need of improvement:Anticipated Barrier Strategy Person or Position
Responsible for Monitoring
Process Used to Determine Effectiveness of
Strategy
Evaluation Tool
1. AttendanceAttendance Goal #1:
1.1.School factors may include issues related to the overall school climate, such as safety, school size, attitudes of staff and other students.
1.1. Continue to implement the
mantra “Reflect Respect” focusing on the expectation that everyone is treated with a tone of decency.
Provide reward systems and ensure that all students are recognized on some
level throughout the year. Set and advertise a school
wide goal for attendance and tardies.
1.1.Guidance Counselor - Ms. McGrath
1.1.Attendance records will be recorded by teachers, managed by office staff and analyzed for effectiveness.
1.1.Data warehouse
• attendance
• tardiesAttendance rates will increase in the 2010-2011 school year. The following data demonstrates the trends over the past three years:94.80% in 200895% in 200995.8 % in 2010
Excessive absences and tardies will decrease in the 2010-2011 school year.
2011 Current Attendance Rate:*
2012 Expected Attendance Rate:*
95.8 (618) 98 (632)2011 Current Number of Students with Excessive Absences (10 or more)
2012 Expected Number of Students with Excessive Absences (10 or more)
185 175
2011 Current Number of Students with
2012 Expected Number of Students with
April 2011 47Rule 6A-1.099811Revised April 29, 2011
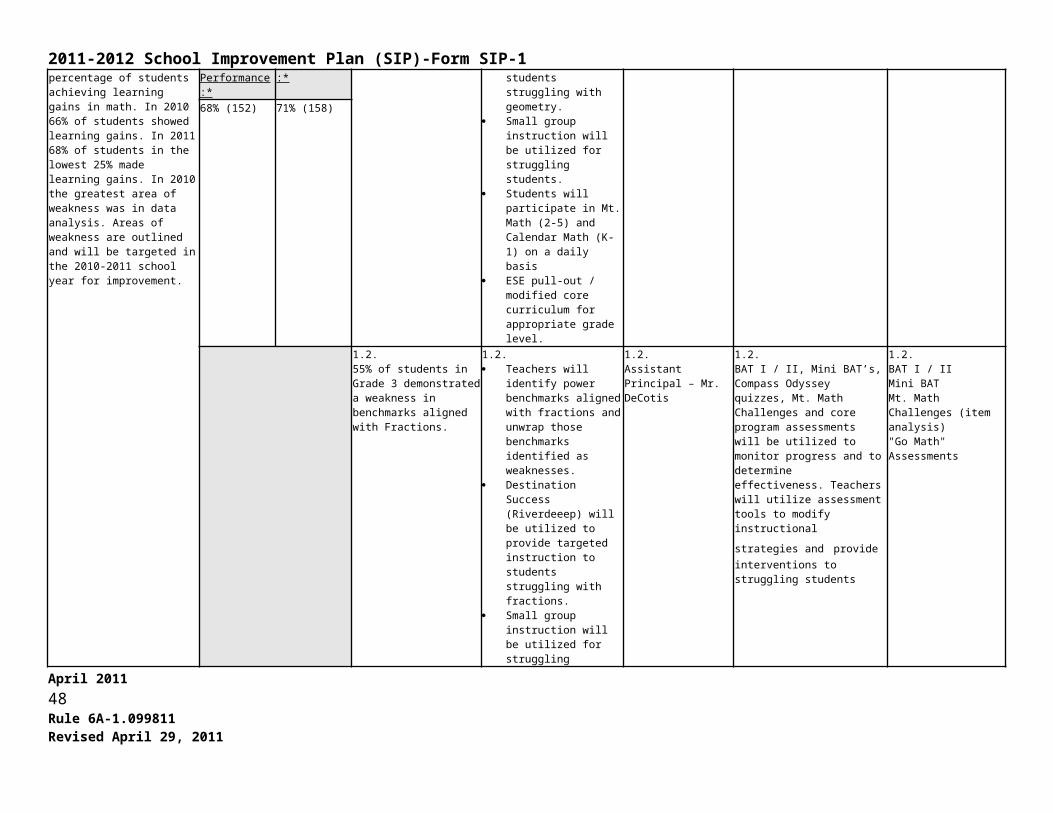
2011-2012 School Improvement Plan (SIP)-Form SIP-1Excessive Tardies (10 or more)
Excessive Tardies (10 or more)
155 145
1.2.Student factors may include limited social and emotional competence, mental health problems, poor physical health, lack of familiarity with school attendance policy and friends who are engaging in truant or other problem behavior.
1.2.• Start school day off with and engaging activity that students deem as fun to promote attendance.
• Implement awards program for zero tardies in a quarter
1.2.Guidance Counselor - Ms. McGrath
1.2.Attendance records will be recorded by teachers, managed by office staff and analyzed for effectiveness.
1.2.Data warehouse
• attendance
• tardies
1.3.Family factor may include lack of parent supervision and / or guidance, poverty, substance abuse in the home, domestic violence lack of familiarity with school attendance laws, and varied education priorities.
1.3.Teachers will initiate communication with parents about attendance and tardies to ensure school and parent agreement.
• Automated phone call system will be used to ensure parents are aware of absences and or tardies.
• Guidance Counselor / Social Worker involvement of chronic issues and to provide necessary referrals
1.3Guidance Counselor - Ms. McGrath
1.3.Attendance records will be recorded by teachers, managed by office staff and analyzed for effectiveness.
1.3.Data warehouse
• attendance
• tardies
Professional Development (PD) aligned with Strategies through Professional Learning Community (PLC) or PD ActivityPlease note that each Strategy does not require a professional development or PLC activity.
PD Content /Topicand/or PLC Focus Grade
Level/Subject
PD Facilitatorand/or
PLC Leader
PD Participants (e.g. , PLC, subject, grade level, or
school-wide)
Target Dates and Schedules(e.g. , Early Release) and
Schedules (e.g., frequency of meetings)
Strategy for Follow-up/Monitoring Person or Position Responsible for Monitoring
April 2011 48Rule 6A-1.099811Revised April 29, 2011
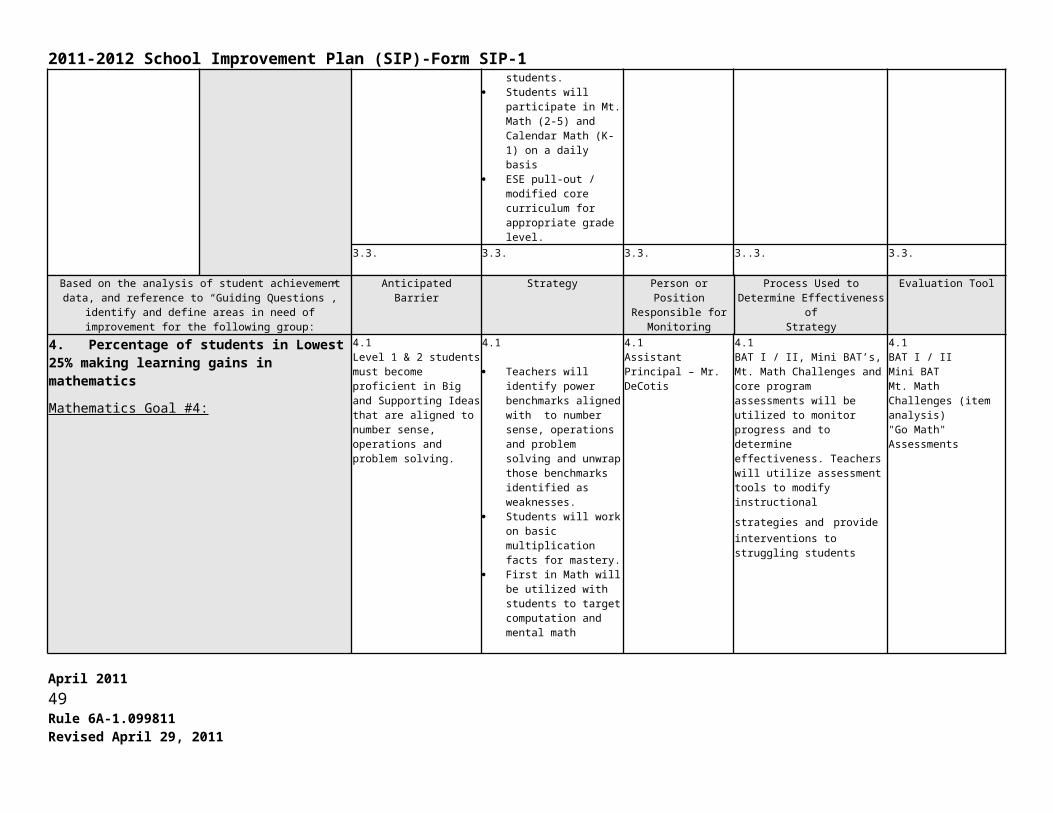
2011-2012 School Improvement Plan (SIP)-Form SIP-1Attendance Budget (Insert rows as needed)Include only school-based funded activities/materials and exclude district funded activities /materials.Evidence-based Program(s)/Materials(s)Strategy Description of Resources Funding Source Amount
Subtotal:TechnologyStrategy Description of Resources Funding Source Amount
Subtotal:Professional DevelopmentStrategy Description of Resources Funding Source Amount
Subtotal:OtherStrategy Description of Resources Funding Source Amount
Subtotal: Total:
End of Attendance Goals
Suspension Goal(s)
* When using percentages, include the number of students the percentage represents next to the percentage (e.g. 70% (35)).
SUSPENSION GOAL(S) Problem-solving Process to Decrease SuspensionBased on the analysis of suspension data, and reference to “Guiding
Questions”, identify and define areas in need of improvement:Anticipated Barrier Strategy Person or Position
Responsible for Monitoring
Process Used to Determine Effectiveness of
Strategy
Evaluation Tool
April 2011 49Rule 6A-1.099811Revised April 29, 2011
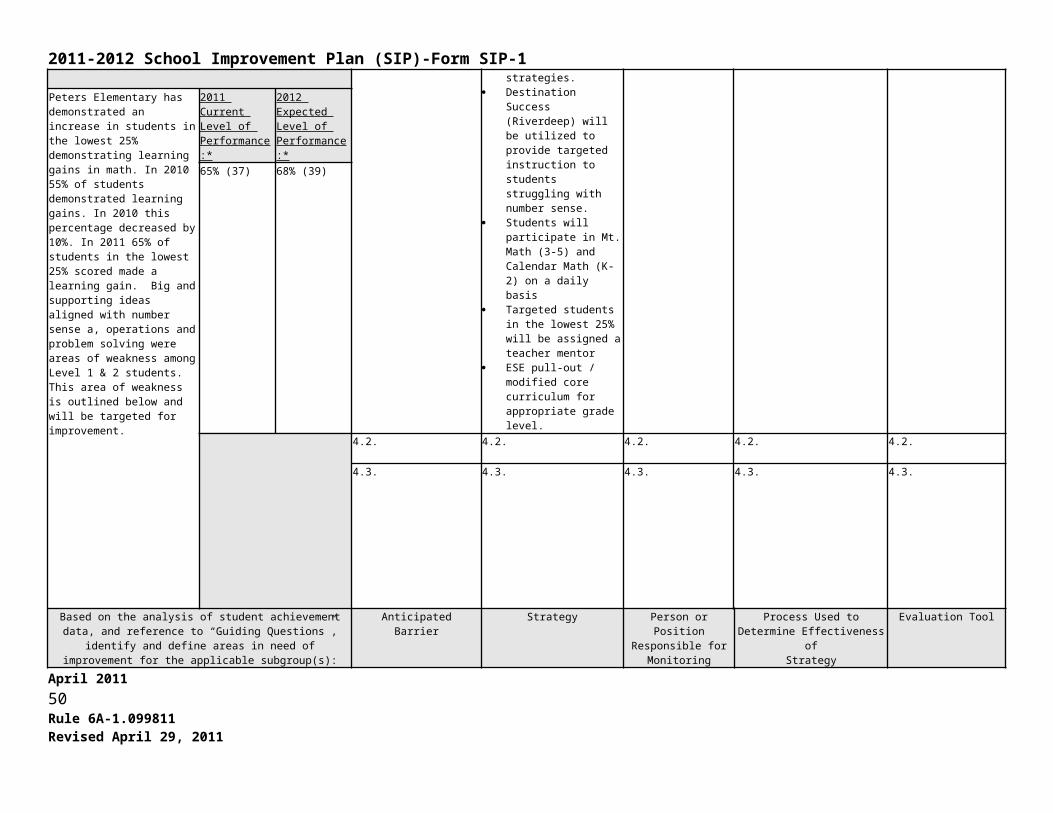
2011-2012 School Improvement Plan (SIP)-Form SIP-11. SuspensionSuspension Goal #1:
1.1.Student factors may include limited social and emotional competence and or mental health problems
1.1.Guidance groups
• Guidance lessons
• Increase Social Worker communication between teachers and parents to promote open communication of potential behavior issues.
1.1.Guidance Counselor – Ms. McGrath
1.1.Discipline Matrix System data will be tracked in regards to suspensions. Data Warehouse suspension data will be used to determine effectiveness.
1.1.• Discipline Matrix System
• Data Warehouse suspension data
The number of both internal and external suspension will decrease in school year 2011-2012.
2011 Total Number of In –School Suspensions
2012 Expected Number of In- School Suspensions
20 152011 Total Number of Students Suspended In-School
2012 Expected Number of Students Suspended In -School
11 82011 Number of Out-of-School Suspensions
2012 Expected Number of Out-of-School Suspensions
10 72011 Total Number of Students Suspended Out- of- School
2012 Expected Number of Students Suspended Out- of-School
6 31.2. 1.2. 1.2. 1.2. 1.2.1.3. 1.3. 1.3. 1.3. 1.3.
Professional Development (PD) aligned with Strategies through Professional Learning Community (PLC) or PD ActivityPlease note that each Strategy does not require a professional development or PLC activity.
PD Content /Topicand/or PLC Focus Grade
Level/Subject
PD Facilitatorand/or
PLC Leader
PD Participants (e.g. , PLC, subject, grade level, or
school-wide)
Target Dates and Schedules(e.g. , Early Release) and
Schedules (e.g., frequency of meetings)
Strategy for Follow-up/Monitoring Person or Position Responsible for Monitoring
Improving the Learning Environment / TRIBES
School-wide Trained Facilitator School-wide August Classroom Walk-through Principal – Kathy Sedlack
April 2011 50Rule 6A-1.099811Revised April 29, 2011
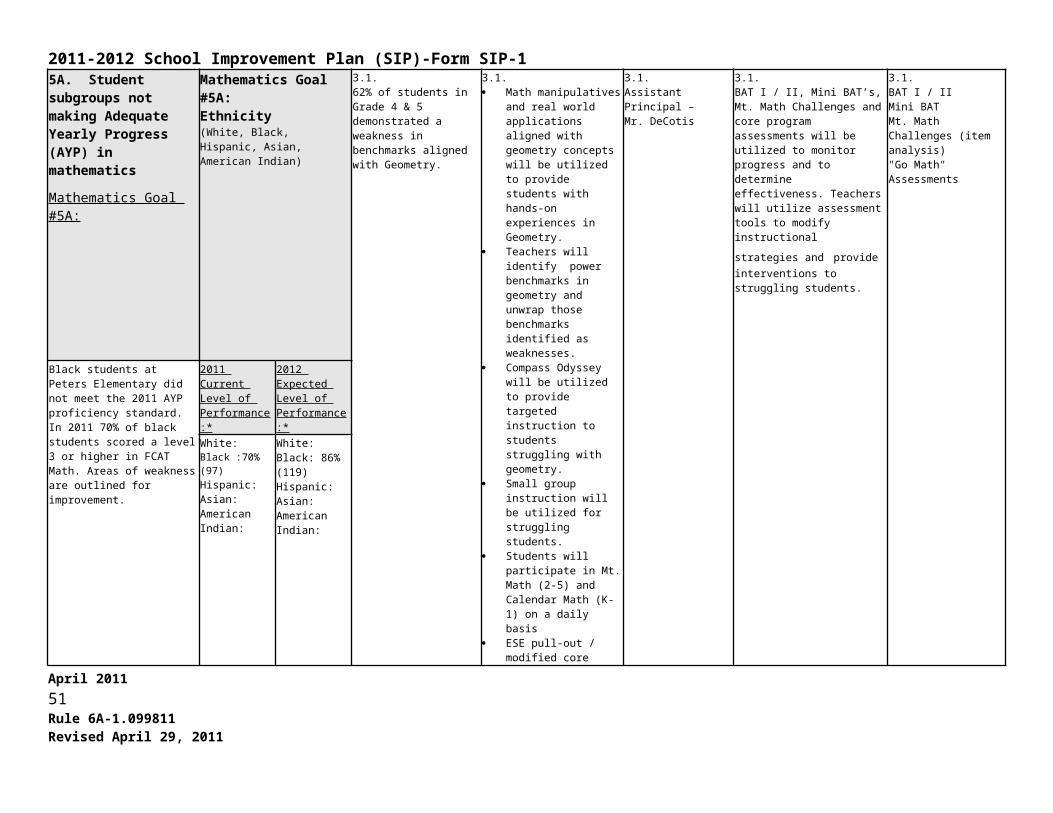
2011-2012 School Improvement Plan (SIP)-Form SIP-1
Suspension Budget (Insert rows as needed)Include only school-based funded activities/materials and exclude district funded activities /materials.Evidence-based Program(s)/Materials(s)Strategy Description of Resources Funding Source Amount
Subtotal:TechnologyStrategy Description of Resources Funding Source Amount
Subtotal:Professional DevelopmentStrategy Description of Resources Funding Source AmountImproving the Learning Environment / TRIBES
Hourly salary + planning Title I Professional Development 1,320.00
Improving the Learning Environment / TRIBES
Materials Title I Professional Development 1000.00
Subtotal: 2320.00 OtherStrategy Description of Resources Funding Source Amount
Subtotal: Total: 2320.00
End of Suspension Goals
Dropout Prevention Goal(s) Note: Required for High School- F.S., Sec. 1003.53
* When using percentages, include the number of students the percentage represents next to the percentage (e.g. 70% (35)). Problem-solving Process to Dropout Prevention
April 2011 51Rule 6A-1.099811Revised April 29, 2011
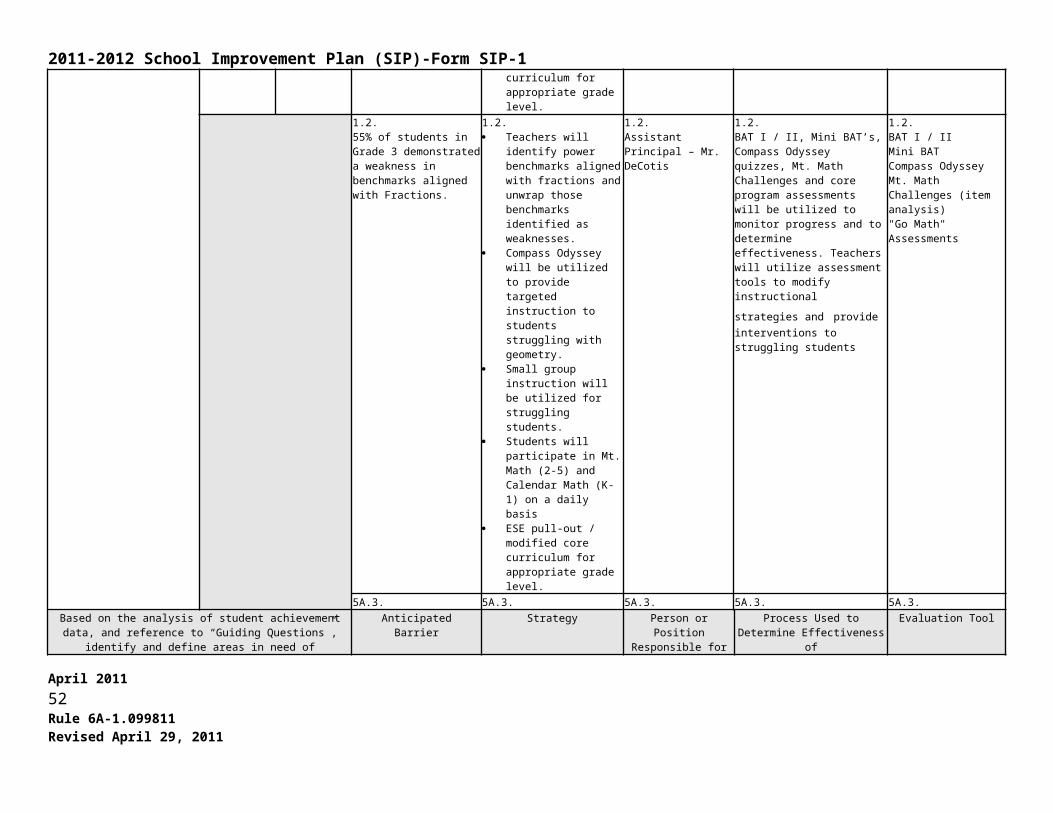
2011-2012 School Improvement Plan (SIP)-Form SIP-1DROPOUT PREVENTION GOAL(S)
Based on the analysis of parent involvement data, and reference to “Guiding Questions”, identify and define areas in need of
improvement:
Anticipated Barrier Strategy Person or Position Responsible for
Monitoring
Process Used to Determine Effectiveness of
Strategy
Evaluation Tool
1. Dropout Prevention
Dropout Prevention Goal #1:*Please refer to the percentage of students who dropped out during the 2010-2011 school year.
1.1. 1.1. 1.1. 1.1. 1.1.
Enter narrative for the goal in this box.
2011 Current Dropout Rate:*
2012 Expected Dropout Rate:*
Enter numerical data for dropout rate in this box.
Enter numerical data for expected dropout rate in this box.
2011 Current Graduation Rate:*
2012 Expected Graduation Rate:*
Enter numerical data for graduation rate in this box.
Enter numerical data for expected graduation rate in this box.
1.2. 1.2. 1.2. 1.2. 1.2.
1.3. 1.3. 1.3. 1.3. 1.3.
Professional Development (PD) aligned with Strategies through Professional Learning Community (PLC) or PD ActivityPlease note that each Strategy does not require a professional development or PLC activity.
PD Content /Topicand/or PLC Focus Grade
Level/Subject
PD Facilitatorand/or
PLC Leader
PD Participants (e.g. , PLC, subject, grade level, or
school-wide)
Target Dates and Schedules(e.g. , Early Release) and
Schedules (e.g., frequency of meetings)
Strategy for Follow-up/Monitoring Person or Position Responsible for Monitoring
Dropout Prevention Budget (Insert rows as needed)Include only school-based funded activities/materials and exclude district funded activities /materials.Evidence-based Program(s)/Materials(s)Strategy Description of Resources Funding Source Amount
April 2011 52Rule 6A-1.099811Revised April 29, 2011
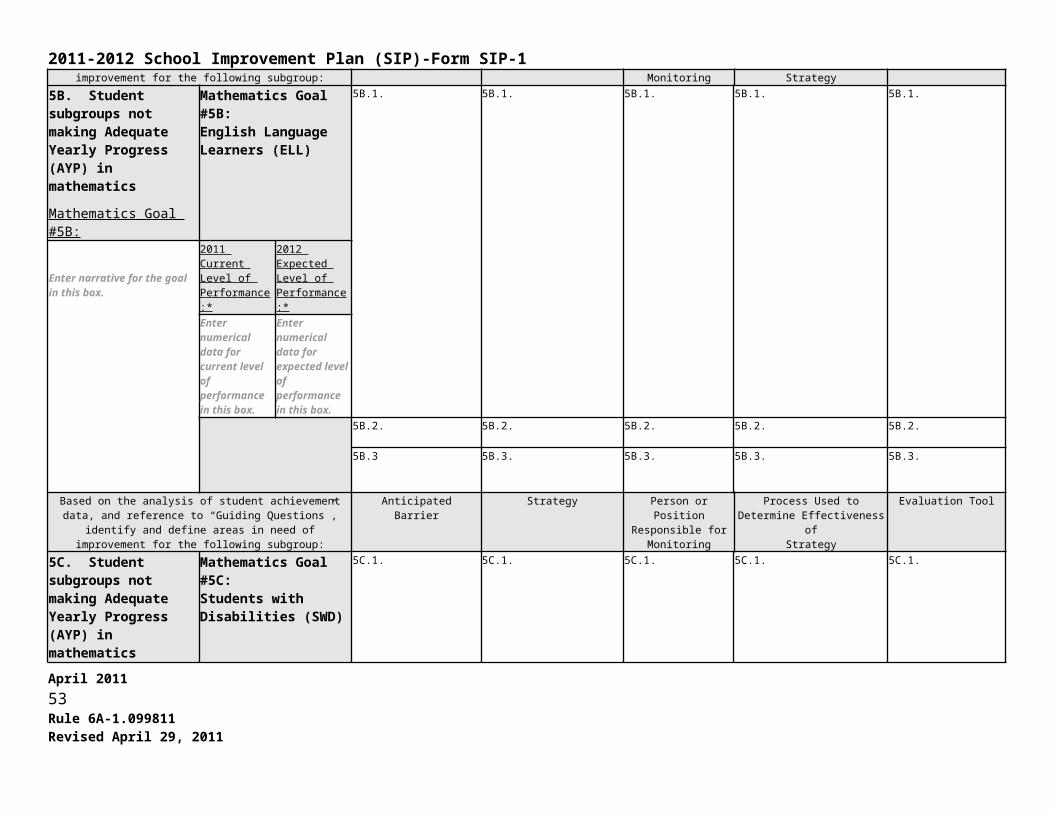
2011-2012 School Improvement Plan (SIP)-Form SIP-1
Subtotal:TechnologyStrategy Description of Resources Funding Source Amount
Subtotal:Professional DevelopmentStrategy Description of Resources Funding Source Amount
Subtotal:OtherStrategy Description of Resources Funding Source Amount
Subtotal:Total:
End of Dropout Prevention Goal(s)
Parent Involvement Goal(s)
* When using percentages, include the number of students the percentage represents next to the percentage (e.g. 70% (35)).
PARENT INVOLVEMENT GOAL(S) Problem-solving Process to Parent Involvement
April 2011 53Rule 6A-1.099811Revised April 29, 2011

2011-2012 School Improvement Plan (SIP)-Form SIP-1Based on the analysis of parent involvement data, and reference to
“Guiding Questions”, identify and define areas in need of improvement:
Anticipated Barrier Strategy Person or Position Responsible for
Monitoring
Process Used to Determine Effectiveness of
Strategy
Evaluation Tool
1. Parent Involvement
Parent Involvement Goal #1:*Please refer to the percentage of parents who participated in school activities, duplicated or unduplicated.
1.1.SEE PIP
1.1.SEE PIP
1.1.SEE PIP
1.1SEE PIP
1.1SEE PIP
The number of parents participating in school activities, parent/ teacher conferences and other community events held by the school will increase by 10% in 2010-2011.
2011 Current level of Parent Involvement:*
2012 Expected level of Parent Involvement:*
93% 96%
1.2. 1.2. 1.2. 1.2. 1.2.
1.3. 1.3. 1.3. 1.3. 1.3.
Professional Development (PD) aligned with Strategies through Professional Learning Community (PLC) or PD ActivityPlease note that each Strategy does not require a professional development or PLC activity.
PD Content /Topicand/or PLC Focus Grade
Level/Subject
PD Facilitatorand/or
PLC Leader
PD Participants (e.g. , PLC, subject, grade level, or
school-wide)
Target Dates and Schedules(e.g. , Early Release) and
Schedules (e.g., frequency of meetings)
Strategy for Follow-up/Monitoring Person or Position Responsible for Monitoring
Parent Involvement Budget
* Please ensure that items included in the Parental Involvement Policy/Plan (PIP) are outlined in the following budget section.Include only school-based funded activities/materials and exclude district funded activities /materials.Evidence-based Program(s)/Materials(s)Strategy Description of Resources Funding Source Amount
April 2011 54Rule 6A-1.099811Revised April 29, 2011

2011-2012 School Improvement Plan (SIP)-Form SIP-1
Subtotal:TechnologyStrategy Description of Resources Funding Source Amount
Subtotal:Professional DevelopmentStrategy Description of Resources Funding Source Amount
Subtotal:OtherStrategy Description of Resources Funding Source AmountLiteracy / Math FCAT Family Saturday Teacher salary X3 Title I Parent Involvement 600.00Parent materials to use with family workshops
Reading materials Title I Parent Involvement 500.00
Mega Skills Parent Workshop Salary - Reading Coach (trained facilitator) Title I Parent Involvement 250.00Refreshments for parents Food, soft drinks Title I Parent Involvement 100.00Annual Parent Seminar Registration cost / 4 parents Title I Parent Involvement 160.00Mega Skills childcare Paraprofessional for childcare @15.00 hr. Title I Parent Involvement 195.00Primary Family Literacy Night Teacher salary X3 Title I Parent Involvement 500.00
Subtotal: 2,305.00Total: 2,305.00
End of Parent Involvement Goal(s)
April 2011 55Rule 6A-1.099811Revised April 29, 2011
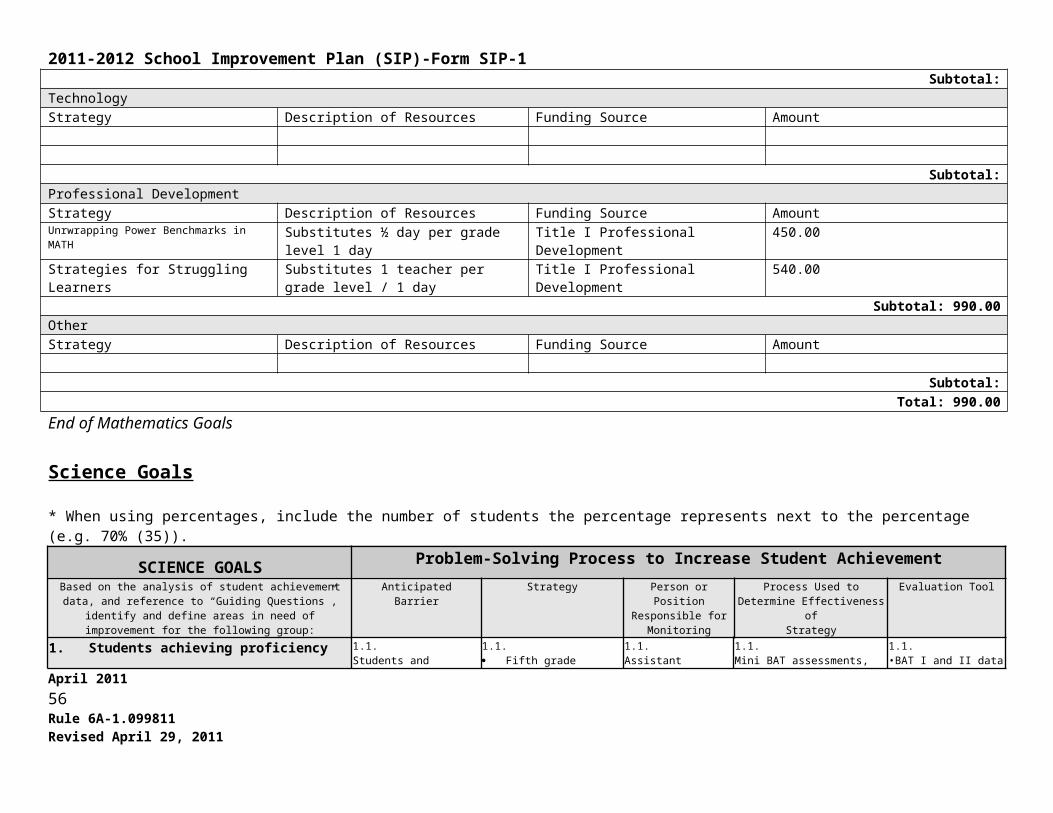
2011-2012 School Improvement Plan (SIP)-Form SIP-1Additional Goal(s)
* When using percentages, include the number of students the percentage represents next to the percentage (e.g. 70% (35)).
ADDITIONAL GOAL(S) Problem-Solving Process to Increase Student AchievementBased on the analysis of school data, identify and define
areas in need of improvement:Anticipated Barrier Strategy Person or Position
Responsible for Monitoring
Process Used to Determine Effectiveness of
Strategy
Evaluation Tool
1. Additional GoalAdditional Goal #1:
1.1. 1.1. 1.1. 1.1. 1.1.
Enter narrative for the goal in this box.
2011 Current Level :*
2012 Expected Level :*
Enter numerical data for current goal in this box.
Enter numerical data for expected goal in this box.
1.2. 1.2. 1.2. 1.2. 1.2.
1.3. 1.3. 1.3. 1.3. 1.3.
Professional Development (PD) aligned with Strategies through Professional Learning Community (PLC) or PD ActivityPlease note that each Strategy does not require a professional development or PLC activity.
PD Content /Topicand/or PLC Focus Grade
Level/Subject
PD Facilitatorand/or
PLC Leader
PD Participants (e.g. , PLC, subject, grade level, or
school-wide)
Target Dates and Schedules(e.g. , Early Release) and
Schedules (e.g., frequency of meetings)
Strategy for Follow-up/Monitoring Person or Position Responsible for Monitoring
April 2011 56Rule 6A-1.099811Revised April 29, 2011
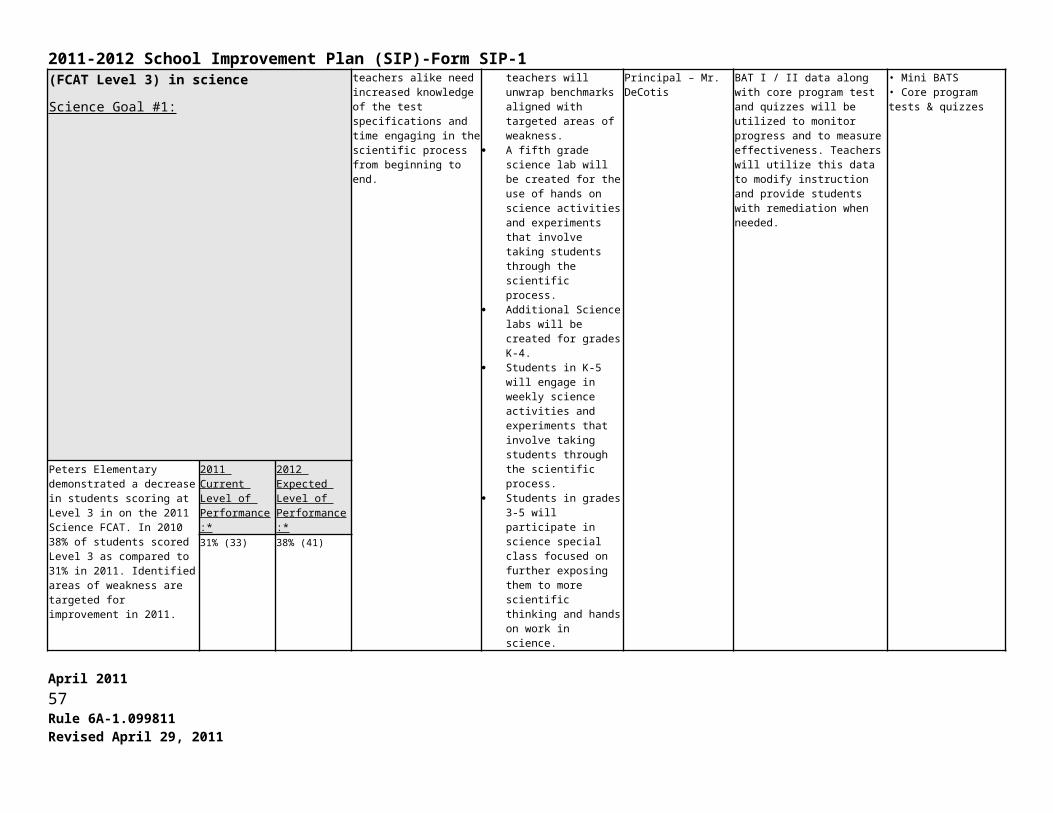
2011-2012 School Improvement Plan (SIP)-Form SIP-1Additional Goal(s) Budget (Insert rows as needed)Include only school-based funded activities/materials and exclude district funded activities /materials.Evidence-based Program(s)/Materials(s)Strategy Description of Resources Funding Source Amount
Subtotal:TechnologyStrategy Description of Resources Funding Source Amount
Subtotal:Professional DevelopmentStrategy Description of Resources Funding Source Amount
Subtotal:OtherStrategy Description of Resources Funding Source Amount
Subtotal: Total:
End of Additional Goal(s)
FINAL BUDGET (Insert rows as needed)
April 2011 57Rule 6A-1.099811Revised April 29, 2011

2011-2012 School Improvement Plan (SIP)-Form SIP-1Please provide the total budget from each section. Reading Budget
Total: 4207.00Mathematics Budget
Total: 990.00Science Budget
Total: 450.00Writing Budget
Total: 1800.00Attendance Budget
Total:Suspension Budget
Total: 2320.00Dropout Prevention Budget
Total:Parent Involvement Budget
Total: 2305.00Additional Goals
Total: 2305.00
Grand Total: 12072.00
Differentiated Accountability
April 2011 58Rule 6A-1.099811Revised April 29, 2011
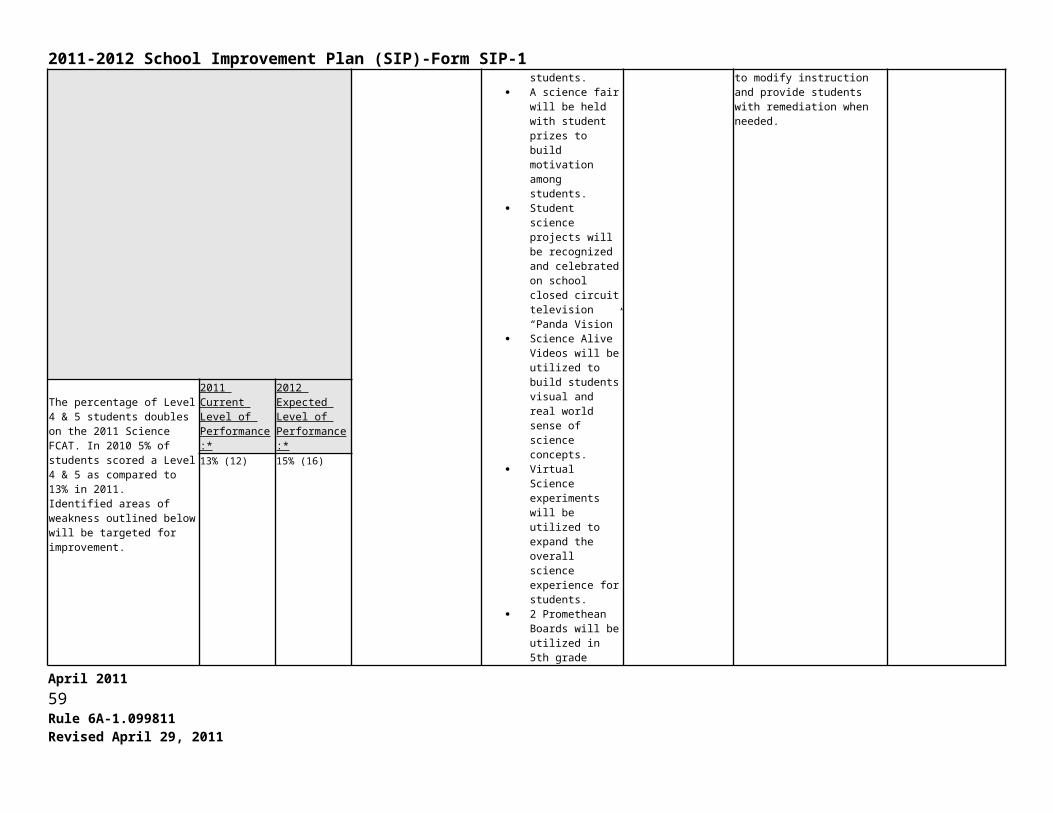
2011-2012 School Improvement Plan (SIP)-Form SIP-1School-level Differentiated Accountability (DA) CompliancePlease choose the school’s DA Status. (To activate the checkbox: 1. double click the desired box; 2.when the menu pops up, select “checked” under “Default Value” header; 3. Select “OK”, this will place an “x” in the box.)School Differentiated Accountability Status
Intervene Correct II Prevent II Correct I X Prevent I N/A
Upload a copy of the Differentiated Accountability Checklist in the designated upload link on the “Upload” page
School Advisory CouncilSchool Advisory Council (SAC) Membership ComplianceThe majority of the SAC members are not employed by the school district. The SAC is composed of the principal and an appropriately balanced number of teachers, education support employees, students (for middle and high school only), parents, and other business and community citizens who are representative of the ethnic, racial, and economic community served by the school. Please verify the statement above by selecting “Yes” or “No” below.
X Yes No
If No, describe measures being taken to comply with SAC requirement.
Describe the activities of the School Advisory Council for the upcoming year.The SAC Committee will meet monthly to discuss SAC business and receive various updates concerning the school and expected achievement outcomes.
Describe projected use of SAC funds. AmountTBA TBA
April 2011 59Rule 6A-1.099811Revised April 29, 2011