2007pigcost ofproduction inselected countries · 2007pigcost ofproduction inselected countries...
TRANSCRIPT

2007 PIG COST
OF PRODUCTION
IN SELECTED
COUNTRIES
Tony FowlerAHDB Meat Services
November 2008 edition
£160
20131_cover:cover 1/12/08 11:05 Page 1

20131_book.qxd:Layout 1 1/12/08 10:59 Page 1

1
CONTENTS
INTRODUCTION 3
METHODOLOGY 4
KEY POINTS 5
COST OF PRODUCTION
Aggregate results for 2007 6
Comparisons with previous years (sterling) 6
The impact of exchange rate movements 8
CASH COSTS OF PRODUCTION 10
FINANCIAL PERFORMANCE SUMMARY
Feed costs 11
Labour costs 15
Building, Finance and Miscellaneous 16
PHYSICAL PERFORMANCE SUMMARY
Pigs weaned per sow per year 20
Post-weaning mortality 20
Pigs finished per sow per year 21
Daily liveweight gains 22
Feed conversion ratios 22
Carcase weight production per sow 23
STANDARDISING THE PHYSICAL RESULTS
Methodology 27
Daily liveweight gains 27
Feed conversion ratios 27
PERFORMANCE AND PRODUCTION COSTS
Comparisons of GB results with the EU average 29
Impact on costs of improving performance 30
ADJUSTMENTS TO PRICES
The impact on relative costs 31
Deductions 32
Bonuses 32
Total adjustments to reference prices 33
MONITORING CHANGES IN COSTS OF PRODUCTION
Feed cost movements 35
Total production costs 36
Net margins in Great Britain 37
20131_book.qxd:Layout 1 1/12/08 10:59 Page 1

No part of this publication may be reproduced in any material form (including by photocopying or storage inany medium by electronic means) or any copy or adaptation stored, published or distributed (by physical,electronic or other means) without the prior permission in writing of AHDB Meat Services, other than byreproduction in an unmodified form for the sole purpose of use as an information resource when AHDBMeat Services is clearly acknowledged as the source, or in accordance with the provisions of theCopyright, Designs and Patents Act 1988.
Whilst all reasonable care has been taken to ensure that the information contained herein is correct at thetime of publication, no representation or warranty is given nor is to be implied as to its accuracy, nor its fit-ness for any particular purpose. Use of the information contained in this publication is strictly at the read-er’s own risk. To the fullest extent permitted by law, AHDB Meat Services excludes liability for any loss ordamage, whether direct or indirect, caused by reliance upon any statement or omission in this publication,including, without limitation, incidental or consequential damages, loss of profits or business interruption.
© (2008) AHDB Meat Services. All rights reserved
2 2007 Pig Cost of Production in Selected Countries BPEX November 2008
20131_book.qxd:Layout 1 1/12/08 10:59 Page 2

INTRODUCTION
This is the seventh in a series of annual reports that examines the relative costs of pig meat production upto farmgate level in selected EU countries.
The latest results in this report relate to 2007. British pig meat production made some further performancegains in 2007, but performance is still lagging behind the European average in many key areas. However,a comparison of average and top-third results (see Appendix 4) shows that producers can achieve resultscomparable with the current European high-achievers. In doing this, producers can improve margins orminimise any cost increases, which will help them cope with the continuing cost: price pressures in the pigsector.
It should be noted that inferior physical performance means that any increase in input prices will push upproduction costs more than in a country with the same price rises but with better performance.
The dominant factor in the pig industry worldwide in 2007 was the increase in feed prices to record levels.This led to increases in costs of production in every country in InterPIG. Prices trended higher during theyear, so that by the end of 2007 production costs were considerably higher than the 2007 average costspresented in this report. Feed prices remained high in the first half of 2008 but have now started to weak-en. The implications of changing feed prices on costs of production in 2008 are also examined in thisreport.
A factor which is influencing relative production costs in 2008, but which is outside of pig producers’ influ-ence, is a decline in the sterling:Euro exchange rate. In September 2008, the Euro was worth 80p com-pared with 69p a year earlier, equivalent to a 14 per cent devaluation in sterling. Other things being equal,this would lead to an improvement in relative competitiveness of Great Britain pig production of the sameamount. However, foreign exchange markets are notoriously unpredictable, and the future value of sterlingcould just as easily strengthen against the Euro.
In the second half of 2008 the “credit crunch” crisis, which began with the failure of the sub-prime market inthe United States, has taken centre stage on the world economies. This is increasing market uncertaintiesin a number of ways, for example:
• The United Kingdom and some other countries are moving into a recession, which means weakerconsumer demand and may lead to downward pressure on producer prices.
• However worldwide recession could lead to lower input prices. Oil prices are currently (October2008) around half the level seen earlier in the year. Feed prices have also fallen but still remainabove average 2007 levels.
• In the United Kingdom, the policy response to the banking liquidity crisis and recession is likely toinvolve lower interest rates. However, Governments around the world have instituted different policies, which means that exchange rates and relative interest rates could behave in unpredictableways.
Against this background of increasing market uncertainty it is clear that a knowledge of the costs of pro-duction, which is a first step to reducing them, will help producers cope with potential fluctuations in marketprices and input costs.
One positive factor in 2008 has been the distribution of the PCV2 vaccine, assisted by BPEX, to Englishpig producers. This vaccine is used to control PMWS and should therefore lead to reduced post-weaningmortality and an increase in pigs finished/sow. The programme, which began in April 2008, has been verysuccessful. In the first two months of the scheme, applications representing 250,000 sows – 70 per cent ofthe English breeding herd – had been received. The impact of this is likely to be seen in results for 2009.
32007 Pig Cost of Production in Selected Countries BPEX November 2008
20131_book.qxd:Layout 1 1/12/08 10:59 Page 3
METHODOLOGY
This report is the seventh in a series that examines the relative costs of production in selected countries.This is a joint project involving the following organisations in 14 countries, which are known collectively asInterPIG.
• Great Britain – BPEX Ltd• Austria - VLV Upper Austria• Belgium – Boerenbond Belgie• Brazil – Empresa Brasileira de Pesquisa Agropecuária (Embrapa)• Canada - Manitoba Agriculture, Food and Rural Initiatives• Denmark – Danske Slagterier• France – Institute Technique du Porc• Germany - Institut für Betriebswirtschaft (FAL), and Interessengemeinschaft der Schweinehalter (ISN)• Ireland – Teagasc Rural Economy Research, Dublin• Italy – Centro Ricerche Produzioni Animali• Netherlands – Agricultural Economics Research Institute (LEI), and Productschappen Vee, Vlees en
Eieren (PVE)• Spain - SIP Consultors• Sweden – LRF Konsult• United States – AgStar Financial Services
Although Brazilian financial figures were supplied this year, there were no new physical performance fig-ures. Therefore the sections of this report dealing with physical performance exclude Brazil. The UnitedStates figures were supplemented with data from Iowa State University.
The cost and performance data relates to average performance data from the national recording systemsoperating in the participating countries. Definitions have been standardised across countries. For example,the definition of a sow is from first insemination to slaughter, and the results are based on average presentsows (average daily number of sows in the year).
There will inevitably still be some national differences in definition, but where this has occurred the datahas been adjusted in the most appropriate way. The results are believed to provide a clear indication ofthe relative average costs of production within each country and an accurate comparison within 1-2pkgdeadweight.
4 2007 Pig Cost of Production in Selected Countries BPEX November 2008
20131_book.qxd:Layout 1 1/12/08 10:59 Page 4

KEY POINTS
• The cost of pig meat production in Great Britain production increased by 12 per cent in 2007, to121.7/kg. Most of the increase was due to higher feed costs, although there were also someincreases in other variable costs. Some of the impact of the increase in input prices was, however,offset by higher average carcase weights and a further improvement in pigs finished/sow.
• Feed prices in 2007 rose by an average of 22 per cent, similar to the EU average increase of 21 percent. GB feed costs were 61p/kg pig meat, about 8p higher than in Denmark and the Netherlands;this was mainly due to higher average feed prices in Great Britain, although lower feed conversionratios in Denmark and the Netherlands were also a contributory factor.
• Costs of production increased in all the Interpig countries. Within the EU, cost increases ranged fromsix per cent in Austria to 19 per cent in Belgium. The average EU cost of production increased by 12per cent to 109.7p.
• Great Britain remains one of the highest-cost countries in the EU, second only to Italy, which pro-duced much heavier pigs. The lowest cost of production was 96p in Denmark.
• Total costs include a significant amount for depreciation. If this item is excluded, the cash costs ofproduction in 2007 were 104.7p, about 15p higher than in 2006. The GB cash costs of productionwere 14p higher than the EU average.
• Compared with 2006 there was a slight improvement in pigs born alive/litter although litters/sow fellslightly. However, a sharp fall in pre-weaning mortality meant that pigs weaned rose slightly to 21.61.This was seven per cent below the EU average of 23.26, the same differential as in 2006.
• Post-weaning mortality in Great Britain continued to decline in 2007, down from 8.0 per cent to 7.0per cent, and it is now much closer to the EU average. Mortality fell in both the rearing and finishingherds. Although the decline in 2007 was particularly high in finishing herds, over a longer time periodthere has been a more marked decline in the rearing herd mortality.
• The decline in post-weaning mortality gave a further boost to the numbers of pigs finished/sow inGreat Britain. This was up from 19.7 to 20.1, the third consecutive year there had been an improve-ment. The GB average was 1.7 (8.0%) below the EU average but as much as 4 pigs lower than themain suppliers to the British market – Denmark and the Netherlands. There was no improvement inrelative GB performance in 2007.
• Average daily liveweight gain for finishing herds increased by 28g to 683g in 2007. This was thefourth consecutive annual increase. Although GB again saw the most marked increase in the EU, itstill has a lower DLG than many other countries.
• Average Feed Conversion Ratio showed little change between 2006 and 2007.
• The amount of carcase meat produced per sow in Great Britain was 1.54 tonnes in 2007, five percent higher than in 2006, due to increased average carcase weights and higher pigs finished/sow.This remains significantly below the EU average (excluding Italy) of 1.88 tonnes, but the differentialhas narrowed slightly.
• During the course of 2007 the price of feed trended higher, so that by the end of the year, productioncosts in all countries were higher than the annual average. In Great Britain the estimated costs ofproduction in December 2007 was 139.6 p, 18p higher than the 2007 average of 121.7p. Feed pricesremained high in the first half of 2008, and June 2008 production costs are estimated at 148p.However, by September, costs of production fell back to 139p.
• The decline in the value of sterling in 2008 has had a major impact on relative production costs. It isestimated that in 2008, GB costs have fallen below those of Germany.
52007 Pig Cost of Production in Selected Countries BPEX November 2008
20131_book.qxd:Layout 1 1/12/08 10:59 Page 5

COST OF PRODUCTION
Aggregate results for 2007
The production costs of pig meat in 2007 for all the countries covered in this report are shown below inFigure 1. This data includes all variable costs (other than transport of pigs to abattoirs) and fixed costs.Fixed costs include depreciation and interest costs for capital items such as buildings and equipment.Costs for regular and casual labour are included but no allowances are made for directors’ salaries or part-ners’ drawings.
Figure 1 Cost of production in selected countries, 2007
Within the EU, Italy had the highest production costs in 2007, at 125.7p. This is because Italian pigs aregenerally finished to heavier weights than in other EU countries. The second highest production cost wasin Great Britain, at 121.7p, 12p above the EU average. Lowest production costs in the EU were inDenmark (96.1p) and the Netherlands (100.6p). Because feed costs were moving higher during the courseof 2007, end-year costs of production in most countries are likely to have been considerably higher thanthe annual averages.
The average UK reference price was above the EU average in 2007, as it had been in most recent years.But, at 104.6p, it failed to keep pace with the rising cost of production. This implies a loss of 17p on everykg of pig meat produced (compared with 3p in 2007) if a sustainable level of reinvestment is undertaken byproducers in their businesses. This was equivalent to a loss of £13/pig or £123 million across the entire UKindustry.
Comparisons with previous years (in sterling terms)
Costs of production in 2007 compared with results for the four previous years are shown in Table 1.
The average cost of production in the EU countries increased by 11 per cent in 2007 to 109.7p/kg, due tothe impact of record feed costs. The range of cost increases was wider than in 2006, ranging from six percent in Austria and nine per cent in Ireland to 16 per cent in the Netherlands and 19 per cent in Belgium.However despite the above average cost increase, the Netherlands still has one of the lowest costs in theEU. Cost increases in Denmark and Germany (+10%), Great Britain (+12) and France (+12%) were nearthe EU average
Outside the EU, there were marked increases in 2007 in Canada (+18%) and Brazil (+21%), althoughCanadian and Brazilian costs were still lower than in all the EU countries. United States’ costs were only
6
0
20
40
60
80
100
120
140
AUS BEL BRZ CAN DEN FRA GER GB IRE ITA NL SWESPA USA
Feed Other var costs Labour Building, finance and misc
p/kg
UK average reference price EU average reference price
57.7 58.9 56.0 50.8 53.1 54.8 53.061.1 63.9
77.6
53.1
69.3
54.842.3
11.6 7.42.9
5.77.8 8.0 11.7
8.7 8.8
10.2
10.5
9.4
8.2
5.7
14.79.0
5.0 8.010.7
13.0 11.413.6 9.8
11.7
7.5
8.3
13.3
6.1
29.6
28.7
11.116.1
24.327.5
33.2
38.326.6
26.2
28.8
20.5 39.6
17.2
2007 Pig Cost of Production in Selected Countries BPEX November 2008
20131_book.qxd:Layout 1 1/12/08 10:59 Page 6

up three per cent in sterling terms in 2007, although by significantly more in dollar terms, due to the weakdollar. Total production costs in the United States were the lowest of the participating countries.
Table 1 Average costs of production, 2003-2007 (p/kg dw)
Table 2 examines EU national cost structures in rank order and looks at how these rankings have variedover time. The last few years have seen only minor changes in relative costs. There are three broadbands of costs structure within the EU. Countries may change position within the band, but there is onlylimited movement between bands.
High costs in Italy, Great Britain, Sweden and Austria. Countries are in the high-cost band due to a com-bination of factors including relatively high feed prices, lower sow productivity than in some other countriesand carcase weights. Low carcase weights in Great Britain contribute to high costs because the cost perpig is divided by fewer kg but paradoxically, in Italy, higher carcase weights also contribute to higher costsbecause the feed conversion rate deteriorates as pigs get heavier.
Medium costs in Germany, Ireland and Spain. Again, costs in these countries are lower than in GreatBritain due to different combinations of technical and economic factors. For example, Ireland and Spainhave some of the highest feed costs in the EU while German feed costs are the second lowest.
Low costs in France, Belgium, the Netherlands and Denmark. Countries in the low-cost band are charac-terised by a combination of superior technical performance and low feed prices. Within this cost band,Denmark moved from third place to first place in 2007 while the Netherlands fell from first place to secondplace.
7
Year 2003 2004 2005 2006 2007 2007/08% change
Austria 111.0 111.6 103.5 107.6 113.5 +6
Belgium 92.9 92.0 86.8 87.2 104.1 +19
Brazil na na na 62.0 75.1 +21
Canada 67.0 65.3 62.7 68.1 80.7 +18
Denmark 93.3 92.4 88.3 87.3 96.1 +10
France 97.3 94.5 90.6 92.1 103.4 +12
Germany 99.1 105.6 99.1 99.4 109.3 +10
Great Britain 103.4 110.2 104.4 108.6 121.7 +12
Ireland 94.5 96.9 94.6 99.9 109.1 +9
Italy 118.8 121.8 117.0 114.2 125.7 +10
Netherlands 93.3 90.9 84.9 86.7 100.6 +16
Spain na na na 96.5 107.5 +11
Sweden 103.0 100.3 96.3 102.3 115.9 +13
United States na 61.3 62.2 69.2 71.4 +3
EU 100.7 101.6 96.6 98.3 109.7 +12
Overall average 97.6 95.2 90.9 91.5 102.4 +12
2007 Pig Cost of Production in Selected Countries BPEX November 2008
20131_book.qxd:Layout 1 1/12/08 10:59 Page 7

Table 2 Ranking of EU production costs, 2003-2007
The impact of exchange rate movements
Movements in exchange rates can have a significant effect on a country’s relative competitiveness fromyear to year. A stronger sterling will reduce the relative competitiveness of British pig production while adecline in sterling will improve competitiveness. Figure 2 and Table 3 indicate changes in exchange ratessince 2003.
Euro
Between 2003 and late 2007, the sterling Euro exchange rate was relatively steady, with the Euro tradingbetween 66p and 70p. The annual exchange rate, which has been used to convert Eurozone results intosterling, changed very little between 2006 and 2007 (from 68.2p to 68.4p), so this will not have affected therelative competitiveness of British pigs in 2007.
The exchange rate position changed during the first quarter of 2008 when economic problems led to adecline in the sterling exchange rate. By April the value of the Euro had increased to 80p in sterling terms.This will lead to an improvement in British competitiveness in 2008. The chapter on changing feed costsgives an indication of this impact. However, these benefits to the British pig industry are nothing to do withany technical improvements, and they can therefore disappear if sterling strengthens again in the future.
US dollar
Between the beginning of 2003 and late 2007, the US dollar lost over 30 per cent of its value against ster-ling, due to economic concerns and low interest rates. This led to a significant improvement in the relativecompetitiveness of US pigs, a factor that has been reflected in booming export sales. Sterling reached a26-year high against the dollar in November 2007 ($2.09). It has fallen back significantly since then, and iscurrently (November 2008) worth $1.60.
8
Year 2003 2004 2005 2006 2007 %of EU ave
Denmark 2 3 3 3 1 88
Netherlands 3 1 1 1 2 92
France 5 4 4 4 3 94
Belgium 1 2 2 2 4 95
Spain na na na 5 5 98
Ireland 4 5 5 7 6 99
Germany 6 7 7 6 7 100
Austria 9 9 8 9 8 103
Sweden 7 6 6 8 9 106
Great Britain 8 8 9 10 10 111
Italy 10 10 10 11 11 115
Note: Rankings: 1 = lowest, 10 = highest
2007 Pig Cost of Production in Selected Countries BPEX November 2008
20131_book.qxd:Layout 1 1/12/08 10:59 Page 8

Figure 2 Exchange Rate Movements, 2003-2008
Canadian dollar and Brazilian real
The Canadian dollar has fluctuated more against sterling over the past five years. In 2007 as a whole theCanadian dollar weakened by three per cent against sterling. The Brazilian Real has strengthened againststerling, by 22 per cent between 2003 and 2007, which will have increased Brazilian production costs insterling terms. The Real continued to strengthen in the first half of 2008, but the trend has recently goneinto reverse.
The banking liquidity crisis in the autumn of 2008 has had significant impacts on the exchange rates ofsome currencies. In particular the value of the Brazilian real has fallen, although the Canadian dollar isalso lower. It is too early to say at the time of writing whether these movements will just be temporary ornot. If the lower values are maintained, this will lead to a reduction in relative Brazilian and Canadian pro-duction costs.
Table 3 Annual exchange rates
9
Year 1€ = €:£ $US:£ $C:£ Real:£
2003 69.1p 1.45 1.63 2.29 5.02
2004 67.8p 1.47 1.83 2.38 5.36
2005 68.4p 1.46 1.82 2.21 4.44
2006 68.2p 1.47 1.84 2.09 4.01
2007 68.4p 1.46 2.00 2.16 3.92
2008 (forecast) 78.5p 1.27 1.87 1.97 3.34
EuroUKpence US dollar
UKpence
Canadian dollar
Jan-03Jul-03 Jan-04Jul-04 Jan-05Jul-05 Jan-06Jul-06 Jan-07Jul-07 Jan-08Jul-08 Jan-03Jul-03 Jan-04Jul-04 Jan-05Jul-05 Jan-06Jul-06 Jan-07Jul-07 Jan-08Jul-08
Jan-03Jul-03 Jan-04Jul-04 Jan-05Jul-05 Jan-06Jul-06 Jan-07Jul-07 Jan-08Jul-08 Jan-03Jul-03 Jan-04Jul-04 Jan-05Jul-05 Jan-06Jul-06 Jan-07Jul-07 Jan-08Jul-08
UKpence Brazilian real
UKpence
60
65
70
75
80
85
48
52
56
60
64
68
72
38
40
42
44
46
48
50
52
54
16
18
20
22
24
26
28
30
32
34
2007 Pig Cost of Production in Selected Countries BPEX November 2008
20131_book.qxd:Layout 1 1/12/08 10:59 Page 9

CCAASSHH CCOOSSTTSS OOFF PPRROODDUUCCTTIIOONN
Table 4 gives a breakdown of the costs of production in Great Britain compared with the overall EU resultsand the non-EU countries.
The production costs estimated for Great Britain and other countries include “Finance Costs”, ie the depre-ciation of buildings and machinery. While this is the true cost of production, it is recognised that for manypurposes (cash flow analyses, business plans, etc) producers will be more interested in the cash tied up inthe production process.
The overall cost of producing a kg of pig meat in Great Britain in 2007 was 121.7p. However, if the financecosts element (17.0p) is excluded, the cash costs of production fall to 104.7p/kg. This was about 15p high-er than in 2006. The UK cash costs of production were 14p higher than the EU average and 30-40p high-er than the three non-EU countries.
Table 4 Cash costs of production in 2007
In estimating the depreciation charges we have assumed that buildings are amortized over a period of 20years and equipment over a period of 10 years. These are the default amortization periods for EU coun-tries, although the periods may be changed if there is evidence that they are different.
Since the late 1990s the British pig industry has been characterised by a lack of investment in buildingsand equipment as a result of a long run of economic and health crises. Consequently, many producers willbe in the position of using buildings/machinery that have been completely amortized. Therefore, assumingthey do not intend to replace their existing assets, their total costs will be much closer to the cash costs ofproduction. However this is not a sustainable position for those businesses in the medium term.
Producing pigs in ageing buildings is, however, also likely to mean higher maintenance costs, and thistrend has been apparent in Great Britain in recent years.
10
GB EU Brazil Canada United States
Variable costs 89.2 78.2 63.62 61.3 54.7Feed 61.1 59.8 55.97 50.8 42.3
Breeding cost 2.1 2.4 0.81 1.9 1.2
Vet and med 2.7 3.4 1.10 2.1 2.5
Energy 3.9 3.5 1.00 1.7 2.0
Maintenance 7.6 3.0 1.33 0.6 1.3
Levies, insurance, inspection 3.0 1.1 0.6 0.0 0.6
Miscellaneous 8.8 5.0 2.79 4.1 4.8
Fixed costs 32.5 31.4 11.44 19.4 16.7Labour 13.6 11.2 5.04 8.0 6.1
Interest on working capital 1.9 1.5 1.01 1.0 0.8
Building and finance costs 17.0 18.8 5.39 10.4 9.7
Total costs (a) 121.7 109.7 75.1 80.7 71.4
Cash
costs =
70.3p
Cash
costs =
61.6p
Cash
costs =
69.67p
Cash
costs =
90.9p
Cash
costs =
104.7p
2007 Pig Cost of Production in Selected Countries BPEX November 2008
20131_book.qxd:Layout 1 1/12/08 10:59 Page 10

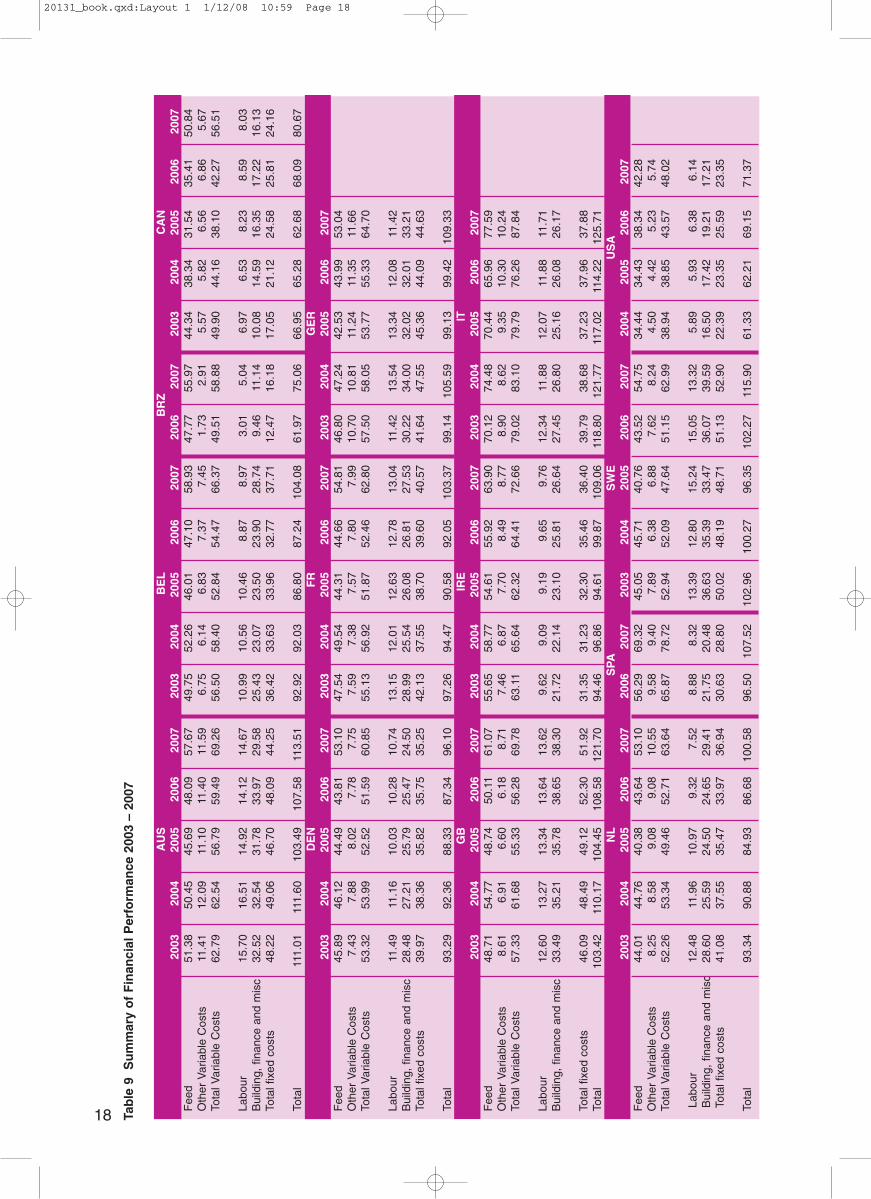
FINANCIAL PERFORMANCE SUMMARY
Table 5 contains financial performance data for 2007, while Table 9 presents, where available, compar-isons with 2003-2006. Among the EU countries there is a range of 30p between the highest-cost producerand the lowest-cost producer, while the range within all the InterPIG member countries is even greater.The recorded differences are due to a combination of differences in physical performance and differencesin the prices of inputs (eg feed prices or wage rates). This chapter examines the cost centres of pig pro-duction to try to identify the causes of the wide range of total production costs.
Table 5 Summary of financial performance, 2007
Feed costs
Market developments in 2007
The feed grains market started to move up in price from August 2006 following a relatively poor harvest inEurope. The very hot weather that affected most parts of Europe in the summer of 2006 resulted in EU-25production falling by four per cent compared with a year earlier.
Following a few months of stability, prices started to accelerate in 2007, with the weather having anadverse impact in major producing countries such as Argentina and Australia. In addition, demand contin-ued to rise with countries such as India and China importing significant quantities of wheat. Additional driv-ers of world grain prices in 2007/08 were high maize prices in the United States caused by the increasingswitch to industrial use, which had a knock on effect on cereal prices worldwide.
Against a background of tightening global supplies, world grain prices moved sharply higher in August2007. Markets were also underpinned by strong demand from importers seeking to safeguard their needs,as supply forecasts from some major producing countries were revised downwards. At the end of 2007 thedelivered price of feed wheat stood at £178/tonne, 85 per cent higher than a year earlier.
11
AUS BEL BRZ CAN DEN FR GER GB
Feed 57.67 58.93 55.97 50.84 53.10 54.81 53.04 61.07
Other Variable Costs 11.59 7.45 2.91 5.67 7.75 7.99 11.66 8.71
Total Variable Costs 69.26 66.37 58.88 56.51 60.85 62.80 64.70 69.78
Labour 14.67 8.97 5.04 8.03 10.74 13.04 11.42 13.62
Building, finance and misc 29.58 28.74 11.14 16.13 24.26 27.53 33.21 38.30
Total fixed costs 44.25 37.71 16.18 24.16 35.00 40.57 44.63 51.92
Total 113.51 104.08 75.06 80.67 95.85 103.37 109.33 121.70
IRE IT NL SPA SWE USA AVE AVEEU ALL
Feed 63.90 77.59 53.10 69.32 54.75 42.28 60.25 57.60
Other Variable Costs 8.77 10.24 10.55 9.40 8.24 5.74 9.41 8.33
Total Variable Costs 72.66 87.84 63.64 78.72 62.99 48.02 69.66 65.93
Labour 9.76 11.71 7.52 8.32 13.32 6.14 10.98 10.16
Building, finance and misc 26.64 26.17 28.80 20.48 39.59 17.21 28.37 26.27
Total fixed costs 36.40 37.88 36.32 28.80 52.90 23.35 39.35 36.43
Total 109.06 125.71 99.97 107.52 115.90 71.37 109.01 102.36
2007 Pig Cost of Production in Selected Countries BPEX November 2008
20131_book.qxd:Layout 1 1/12/08 10:59 Page 11

As well as higher cereal prices, the prices of most other feed ingredient prices also rose in 2007. Soyaprices were relatively low earlier in the year but expectations of reduced US plantings and production in the2007/08 season, and later by concerns over the Brazilian crop, pushed the price up. The UK priceaveraged about 80 per cent more than a year earlier in late December.
The impact on pig producers’ feed costs in 2007
Although feed prices began to rise in autumn 2006, the main impact of this was only felt in 2007. Acrossthe EU average costs increased by 21 per cent, with increases ranging from 14 per cent in Ireland to 26per cent in Sweden. Feed costs in Great Britain increased by 22 per cent, about the same as the EU aver-age increase.
Figure 3 Changes in feed costs, 2007
Feed costs averaged 60.8p/kg in Great Britain compared with the 50.1p recorded in 2006. The range infeed costs is less than for other cost centres, but it is clear from the chart that the lower feed costs in theNetherlands, Denmark, Germany and France – all at around the 53-55p level – are an important factor inthe relatively high cost of producing British pigs.
Italy has by far the highest feed costs in the EU countries because of its heavier pigs. However, Irelandalso has relatively high feed costs (64p); this is not because of production inefficiencies but because feedis more expensive in Ireland than other countries. Spanish feed costs are also high; this is associated withthe fact that it is a net importer of grains.
Feed costs in Canada rose more in 2007 than in the other InterPIG countries but, in terms of p/kg of pigmeat produced, costs are considerably lower than in any of the EU countries. United States feed costswere significantly higher in national currency terms but, due to the lower value of the dollar, they onlyincreased by 10 per cent in sterling terms; at 42p/kg, US feed costs were the lowest of the InterPIG coun-tries. Brazilian costs, on the other hand, were at EU levels.
12
0
5
10
15
20
25
30
35
40
45
50
55
USA GERAUSIRE BRZ IT DEN GB NL FR SPA BEL CANSWE
+10
+14
+17 +18+20 +21 +21 +22 +22 +23 +23
+25 +26
+44
% change 2007/2006
2007 Pig Cost of Production in Selected Countries BPEX November 2008
20131_book.qxd:Layout 1 1/12/08 10:59 Page 12

Figure 4 Feed costs in 2007
Market developments in 2008
Uncertainties in the cereals markets have caused some considerable fluctuations in prices in 2008.Indeed, some daily movements in prices have been as much as annual fluctuations in some previousyears.
Cereal prices peaked in March but subsequently fell back in advance of this year’s harvest. They continuedto move lower over the summer and autumn due to increasing crop production estimates. Another factorwhich has helped drive prices lower has been the banking crisis, with investment funds cashing in theirpositions to generate much-needed short term finance.
The EU-27 wheat crop estimate for 2008 was raised in October to 139.5 million tonnes, 1.9 million tonnesabove the September estimate and 25 per cent more than in 2007. The USDA forecast world wheat pro-duction of 650 million tonnes in 2008/09, up 50 million tonnes from the current 2007/08 estimates. UKdelivered feed wheat prices averaged £90.50/tonne in mid-October, 45 per cent lower than a year earlier.
The EU commission announced on 16 October that they were planning to reintroduce import duties in theEU-27. Tariffs were suspended on most grain imports in December 2007, amid rising prices and dwindlingsupplies with the import duty suspension extended in June 2008 for the 2008/09 season.
Soya prices this year followed a similar pattern, increasing in the first half of 2008 and then trending down-wards in the second half of the year. Prices reached £300/tonne in May/June, almost double what theywere a year earlier. The main cause of this was a strike by Argentinean producers in response to an exportlevy imposed by the government. Argentina is the world’s third largest soya exporter. Uncertainty overthe size of the US soyabean plantings this year and concern over adequate supplies in 2008/09 alsoresulted in volatility in soyabean futures market prices. Influenced by falling crude oil prices and improvedcrop estimates in the United States, soya prices have since fallen. In South America, dry conditions haveprevented growers planting the intended wheat and sunflower seed crops and they have instead turned tosoyabean plantings.
Soya is traded internationally in US dollars and therefore UK soya prices have not fallen as much as theChicago price because of a weakening of sterling against the dollar. The average soyameal price in weekended 17 October (Hipro, ex-mill, Liverpool) was £237/tonne, 6 per cent higher than a year earlier.
Futures market prices indicate lower cereal prices in the 2008/09 and 2009/10 seasons than in the twopreceding seasons. However, prices will still be higher than earlier years. World supply and demand
13
0
10
20
30
40
50
60
70
80
90
USA CAN GER NL DEN SWE FR BRZ AUS BEL GB IRE ITSPA
p/kg
38.335.4
44.0 43.6 43.8 43.5 44.747.8 48.1 47.1
50.1
55.9 56.3
66.0
42.3
50.853.0 53.1 53.1
54.8 54.8 56.057.7 58.9
61.163.9
69.3
77.62006 2007
2007 Pig Cost of Production in Selected Countries BPEX November 2008
20131_book.qxd:Layout 1 1/12/08 10:59 Page 13

14
remains finely balanced and world cereal stocks remain historically low. Consequently cereals marketprices are going to continue to be subject to considerable instability.
Feed prices/tonne and energy content
Table 6 indicates, that within the EU, feed prices/tonne show a considerable range. At the lower end of therange, Italian feed prices are 88 per cent of the EU average while prices in Germany, Denmark and Franceare between 91 and 95 per cent of the average. At the top end of the range, Irish prices are 116 per centof the average.
Table 6 Feed prices and energy content
There is also a considerable variation in the relative costs of sow, rearer and finisher feed. Sow feed inGreat Britain is the lowest in the EU, at 87 per cent of the average, although rearer and finisher feed isabove the average. Overall, GB feed costs/tonne are 107 per cent of the EU average. Feed prices in theUnited States were the lowest in the InterPIG sample in 2007, with the average price being just 75 per centof the EU average.
Some of the variations in feed costs will be due to national differences in the composition of pig rations.Table 6 also compares the Metabolizable Energy (ME) of pig feed with the cost of the feed. Within the EUthe average cost of feed per kg MJ ME, varied from 1.04p in Germany to 1.31p in Ireland, with GreatBritain at 1.23p.
AUS BEL BRZ CAN DEN FR GER GB
£/tonneSow 171.12 152.64 147.90 109.38 136.34 141.68 137.14 125.38
Rearer 225.87 234.63 211.52 253.66 195.18 196.44 212.92 226.33
Finisher 133.47 152.09 139.51 137.77 132.71 132.10 126.13 155.57
Average 150.77 159.10 146.71 142.43 141.42 141.81 137.11 160.94
Energy content (MJ ME/kg)Sow 12.20 12.30 12.22 12.95 12.86 12.80 12.90 13.02
Rearer 13.00 13.10 14.13 13.65 14.09 13.30 13.40 13.73
Finisher 12.80 12.90 14.02 12.05 13.38 12.80 13.20 12.96
Average 12.74 12.82 13.68 12.32 13.37 12.86 13.17 13.11
Cost of feed (p/kg MJ ME)Sow 1.40 1.24 1.21 0.84 1.06 1.11 1.06 0.96
Rearer 1.74 1.79 1.50 1.86 1.39 1.48 1.59 1.65
Finisher 1.04 1.18 0.99 1.14 0.99 1.03 0.96 1.20
Average 1.18 1.24 1.07 1.16 1.06 1.10 1.04 1.23
IRE IT NL SPA SWE USA AVE AVEEU All
£/tonneSow 157.91 121.34 146.06 150.58 141.21 112.51 143.76 138.27
Rearer 250.54 242.94 211.60 286.79 203.02 202.51 226.02 232.90
Finisher 157.43 121.34 140.11 162.22 125.63 102.51 139.89 134.87
Average 174.62 131.84 147.52 168.96 138.23 112.03 150.21 145.53
Energy content (MJ ME/kg)Sow 13.30 11.90 12.90 na 12.40 13.80 12.66 12.86
Rearer 14.00 13.78 13.60 na 12.68 14.30 13.47 13.67
Finisher 13.20 12.72 13.80 na 12.50 14.05 13.03 13.25
Average 13.37 12.71 13.65 na 12.50 14.04 13.03 13.25
Cost of feed (p/kg MJ ME)Sow 1.19 1.02 1.13 na 1.14 0.82 1.13 1.06
Rearer 1.79 1.76 1.56 na 1.60 1.42 1.63 1.63
Finisher 1.19 0.95 1.02 na 1.01 0.73 1.06 0.98
Average 1.31 1.04 1.08 na 1.11 0.80 1.14 1.07
2007 Pig Cost of Production in Selected Countries BPEX November 2008
20131_book.qxd:Layout 1 1/12/08 10:59 Page 14

15
Labour
There is a substantial range in each of the three elements in labour cost: the amount of labour per pig,labour cost per hour and the average carcase weight.
Labour input: EU
Labour input expressed as hours/year per finished pig can vary for a number of reasons including differ-ences in husbandry methods, types of building and the availability of labour. Labour input will also be influ-enced by sow productivity, with an increase in pigs finished/sow/year leading to a decline in hours/year.This trend has, in fact, improved labour productivity in a number of countries over the past five years.
The EU average figure was 0.99 hours/pig in 2007, the same as the previous year. National resultsranged from 0.50 hours in the Netherlands and 0.64 hours in Denmark to 1.52 hours in Austria. Labourinput in Great Britain (1.12 hours) was 13 per cent higher than the EU average, with poorer physical per-formance being a contributory factor; nevertheless it has improved from 1.23 hours in 2004 due to gains insow productivity.
Labour cost per hour: EU
The average labour cost per hour in the EU was £10.49 in 2007, one per cent higher than in 2006. Therewas a substantial range in costs, from £7.87 in Ireland to £13.29 in the Netherlands. These variations notonly reflect average wage rates but also national differences in social security payments made by employ-ers as well as differences in the relative usage of unskilled labour. Cost per hour in Great Britain was£9.25, five per cent more than in 2006.
Labour cost per kg: EU
The average labour cost per pig in the EU was £10.04 in 2007, one per cent less than in 2006 due to atwo per cent improvement in the number of pigs finished per sow. Costs ranged from £6.58 in Spain and£6.70 in the Netherlands, which benefited from a superior labour productivity, and £7.40 in Ireland to£13.53 in Austria. Italian costs were the highest in the EU, at £15.14/pig, but this was due to the veryheavy Italian pigs. Costs in Great Britain per pig were £10.41/pig, up from £10.14 in 2006.
The cost of labour per pig in Great Britain is just four per cent above the EU average. However, the aver-age weight of British pigs is lower than in most other countries. When this factor is taken into account, thelabour cost per kg (13.62p) rose to 121 per cent of the overall EU average. British costs per kg wereexceeded only by Austria. The lowest labour costs in the EU were in the Netherlands (7.52p/kg), whichdeclined from 9.22p in 2006.
Labour costs in non-EU countries
Canadian labour costs/kg declined from 8.28p in 2006 to 8.03p in 2007. Although labour productivity fell,with labour per finished pig increasing from 1.11 hours to 1.16 hours, relative costs/kg benefited from aweaker Canadian dollar and from higher average carcase weights.
Brazilian labour costs per hour increased from 75p in 2006 to £1.25 in 2007. Labour costs in Brazil are byfar the lowest of the countries covered in the survey, so even though the number of hours per finished pigis over three times the EU average, Brazilian labour costs/kg are the lowest in the sample.
2007 Pig Cost of Production in Selected Countries BPEX November 2008
20131_book.qxd:Layout 1 1/12/08 10:59 Page 15

Table 7 Labour costs in 2007 (p/kg dw)
Building, Finance and Miscellaneous (BFM)
Building, finance and miscellaneous costs include depreciation charges on buildings and machinery, main-tenance charges, interest on working capital, levies, manure disposal charges and costs of disposal ofdead animals. The depreciation estimates are based on replacement costs, with buildings being amortizedover a default period of 20 years and equipment over a period of 10 years. Countries can choose a differ-ent amortization period, although the only ones currently doing so are Denmark and the Netherlands.
BFM costs averaged 29.5p/kg dw across the EU countries in 2007, two per cent higher than in 2006. Thelowest costs were in Spain, at 20.5p/kg. Clearly the relatively low BFM costs in Spain have been a majorcontribution to the rapid expansion in production. In previous years, BFM costs have been highest inGreat Britain but in 2007 Swedish costs were slightly higher as a result of the strength of the Euro againststerling. Swedish and GB costs are significantly higher than in the other EU InterPIG countries.
Figure 5 Building, finance and miscellaneous costs, 2007
16
AUS BEL BRZ CAN DEN FR GER GB
Labour per finished pig (hours/year) 1.52 0.84 3.19 1.16 0.64 1.00 1.02 1.12
Labour cost/hour (£) 8.90 9.66 1.25 6.52 13.66 11.55 10.40 9.25
Labour cost/pig (£) 13.53 8.16 4.00 7.54 8.80 11.55 10.61 10.41
Average carcase weight (cold) 92.20 91.06 79.38 93.90 81.89 88.59 92.90 76.40
Labour cost/kg (p) 14.67 8.97 5.04 8.03 10.74 13.04 11.42 13.62
IRE IT NL SPA SWE USA AVE AVEEU All
Labour per finished pig (hours/year) 0.94 1.68 0.50 0.74 0.90 na 0.99 1.17
Labour cost/hour (£) 7.87 9.03 13.29 8.90 12.87 na 10.49 9.47
Labour cost/pig (£) 7.40 15.14 6.70 6.58 11.56 6.14 10.04 9.15
Average carcase weight (cold) 75.90 127.50 89.08 79.04 86.80 92.81 89.21 89.10
Labour cost/kg (p) 9.76 11.88 7.52 8.32 13.32 6.62 11.21 10.21
0
5
10
15
20
25
30
35
40
BRZ CAN USA SPA DEN IT IRE BEL FR AUS NL GER GB SWE
p/kg
9.5
17.219.2
21.8
25.5 26.1 25.823.9
26.8
34.0
24.6
32.0
38.736.1
11.1
16.1 17.2
20.5
24.5
26.2 26.628.7
27.529.6 29.4
33.2
38.339.6
2006 2007
2007 Pig Cost of Production in Selected Countries BPEX November 2008
20131_book.qxd:Layout 1 1/12/08 10:59 Page 16

The three non-EU countries all recorded lower costs than in the EU. Brazilian costs in 2007 were lessthan 40 per cent of the EU average.
Interestingly, the relatively high BFM costs in Great Britain are not due to high building costs, as these arebelow the EU average, but are due to a combination of other factors. Maintenance costs are more thantwice the EU average while ‘Levies, Insurance and Inspection’ charges are nearly three times the average.Miscellaneous costs, which include items such as disposal of dead animals and disposal of dead animals,are also high.
The lower total costs in Brazil, Canada and the United States are due largely to lower building costs inthese countries
Table 8 Analysis of building, finance and miscellaneous costs in 2007
17
AUS BEL BRZ CAN DEN FR GER GB
Building/equipment
costs per pig place £506 £321 £53 £109 £502 £504 £523 £330
Ave mortgage interest rate 3.3% 5.5% 6.2% 3.5% 4.6% 4.6% 5.1% 6.0%
Finance costs 18.6 20.3 5.4 10.4 15.8 18.8 21.5 17.0
Maintenance 8.0 0.8 1.3 0.6 2.1 0.8 2.9 7.6
Levies, insurance, inspection 1.1 1.3 0.6 0.0 0.3 0.6 0.8 3.0
Miscellaneous 1.0 4.7 2.8 4.1 4.9 6.2 6.5 8.8
Interest on working capital 1.0 1.6 1.0 1.0 1.1 1.1 1.4 1.9
Total BFM 29.6 28.7 11.1 16.1 24.3 27.5 33.2 38.3
IRE IT NL SPA SWE USA AVE AVEEU All
Building/equipment
costs per pig place £427 £382 £324 £273 £514 £167 £419 £352
Ave mortgage interest rate 6.0% 3.8% 6.0% 5.0% 5.0% 6.5% 5.0% 5.1%
Finance costs 18.9 18.4 16.1 13.0 28.3 9.7 18.8 16.6
Maintenance 1.5 2.2 2.2 1.9 2.8 1.3 3.0 2.6
Levies, insurance, inspection 1.7 0.5 0.1 2.2 0.8 0.6 1.1 1.0
Miscellaneous 2.7 3.0 8.9 2.3 6.5 4.8 5.0 4.8
Interest on working capital 1.8 2.1 1.5 1.2 1.3 0.8 1.5 1.4
Total BFM 26.6 26.2 28.8 20.5 39.6 17.2 29.4 26.3
2007 Pig Cost of Production in Selected Countries BPEX November 2008
20131_book.qxd:Layout 1 1/12/08 10:59 Page 17
18 Tab
le 9
S
um
mar
y o
f F
inan
cial
Per
form
ance
200
3 –
2007
AU
SB
EL
BR
ZC
AN
2003
2004
2005
2006
2007
2003
2004
2005
2006
2007
2006
2007
2003
2004
2005
2006
2007
Feed
51.38
50.45
45.69
48.09
57.67
49.75
52.26
46.01
47.10
58.93
47.77
55.97
44.34
38.34
31.54
35.41
50.84
Other Variable Costs
11.41
12.09
11.10
11.40
11.59
6.75
6.14
6.83
7.37
7.45
1.73
2.91
5.57
5.82
6.56
6.86
5.67
Total Variable Costs
62.79
62.54
56.79
59.49
69.26
56.50
58.40
52.84
54.47
66.37
49.51
58.88
49.90
44.16
38.10
42.27
56.51
Labour
15.70
16.51
14.92
14.12
14.67
10.99
10.56
10.46
8.87
8.97
3.01
5.04
6.97
6.53
8.23
8.59
8.03
Building, finance and misc
32.52
32.54
31.78
33.97
29.58
25.43
23.07
23.50
23.90
28.74
9.46
11.14
10.08
14.59
16.35
17.22
16.13
Total fixed costs
48.22
49.06
46.70
48.09
44.25
36.42
33.63
33.96
32.77
37.71
12.47
16.18
17.05
21.12
24.58
25.81
24.16
Total
111.01
111.60
103.49
107.58
113.51
92.92
92.03
86.80
87.24
104.08
61.97
75.06
66.95
65.28
62.68
68.09
80.67
DE
NF
RG
ER
2003
2004
2005
2006
2007
2003
2004
2005
2006
2007
2003
2004
2005
2006
2007
Feed
45.89
46.12
44.49
43.81
53.10
47.54
49.54
44.31
44.66
54.81
46.80
47.24
42.53
43.99
53.04
Other Variable Costs
7.43
7.88
8.02
7.78
7.75
7.59
7.38
7.57
7.80
7.99
10.70
10.81
11.24
11.35
11.66
Total Variable Costs
53.32
53.99
52.52
51.59
60.85
55.13
56.92
51.87
52.46
62.80
57.50
58.05
53.77
55.33
64.70
Labour
11.49
11.16
10.03
10.28
10.74
13.15
12.01
12.63
12.78
13.04
11.42
13.54
13.34
12.08
11.42
Building, finance and misc
28.48
27.21
25.79
25.47
24.50
28.99
25.54
26.08
26.81
27.53
30.22
34.00
32.02
32.01
33.21
Total fixed costs
39.97
38.36
35.82
35.75
35.25
42.13
37.55
38.70
39.60
40.57
41.64
47.55
45.36
44.09
44.63
Total
93.29
92.36
88.33
87.34
96.10
97.26
94.47
90.58
92.05
103.37
99.14
105.59
99.13
99.42
109.33
GB
IRE
IT20
0320
0420
0520
0620
0720
0320
0420
0520
0620
0720
0320
0420
0520
0620
07Feed
48.71
54.77
48.74
50.11
61.07
55.65
58.77
54.61
55.92
63.90
70.12
74.48
70.44
65.96
77.59
Other Variable Costs
8.61
6.91
6.60
6.18
8.71
7.46
6.87
7.70
8.49
8.77
8.90
8.62
9.35
10.30
10.24
Total Variable Costs
57.33
61.68
55.33
56.28
69.78
63.11
65.64
62.32
64.41
72.66
79.02
83.10
79.79
76.26
87.84
Labour
12.60
13.27
13.34
13.64
13.62
9.62
9.09
9.19
9.65
9.76
12.34
11.88
12.07
11.88
11.71
Building, finance and misc
33.49
35.21
35.78
38.65
38.30
21.72
22.14
23.10
25.81
26.64
27.45
26.80
25.16
26.08
26.17
Total fixed costs
46.09
48.49
49.12
52.30
51.92
31.35
31.23
32.30
35.46
36.40
39.79
38.68
37.23
37.96
37.88
Total
103.42
110.17
104.45
108.58
121.70
94.46
96.86
94.61
99.87
109.06
118.80
121.77
117.02
114.22
125.71
NL
SPA
SW
EU
SA
2003
2004
2005
2006
2007
2006
2007
2003
2004
2005
2006
2007
2004
2005
2006
2007
Feed
44.01
44.76
40.38
43.64
53.10
56.29
69.32
45.05
45.71
40.76
43.52
54.75
34.44
34.43
38.34
42.28
Other Variable Costs
8.25
8.58
9.08
9.08
10.55
9.58
9.40
7.89
6.38
6.88
7.62
8.24
4.50
4.42
5.23
5.74
Total Variable Costs
52.26
53.34
49.46
52.71
63.64
65.87
78.72
52.94
52.09
47.64
51.15
62.99
38.94
38.85
43.57
48.02
Labour
12.48
11.96
10.97
9.32
7.52
8.88
8.32
13.39
12.80
15.24
15.05
13.32
5.89
5.93
6.38
6.14
Building, finance and misc
28.60
25.59
24.50
24.65
29.41
21.75
20.48
36.63
35.39
33.47
36.07
39.59
16.50
17.42
19.21
17.21
Total fixed costs
41.08
37.55
35.47
33.97
36.94
30.63
28.80
50.02
48.19
48.71
51.13
52.90
22.39
23.35
25.59
23.35
Total
93.34
90.88
84.93
86.68
100.58
96.50
107.52
102.96
100.27
96.35
102.27
115.90
61.33
62.21
69.15
71.37
20131_book.qxd:Layout 1 1/12/08 10:59 Page 18

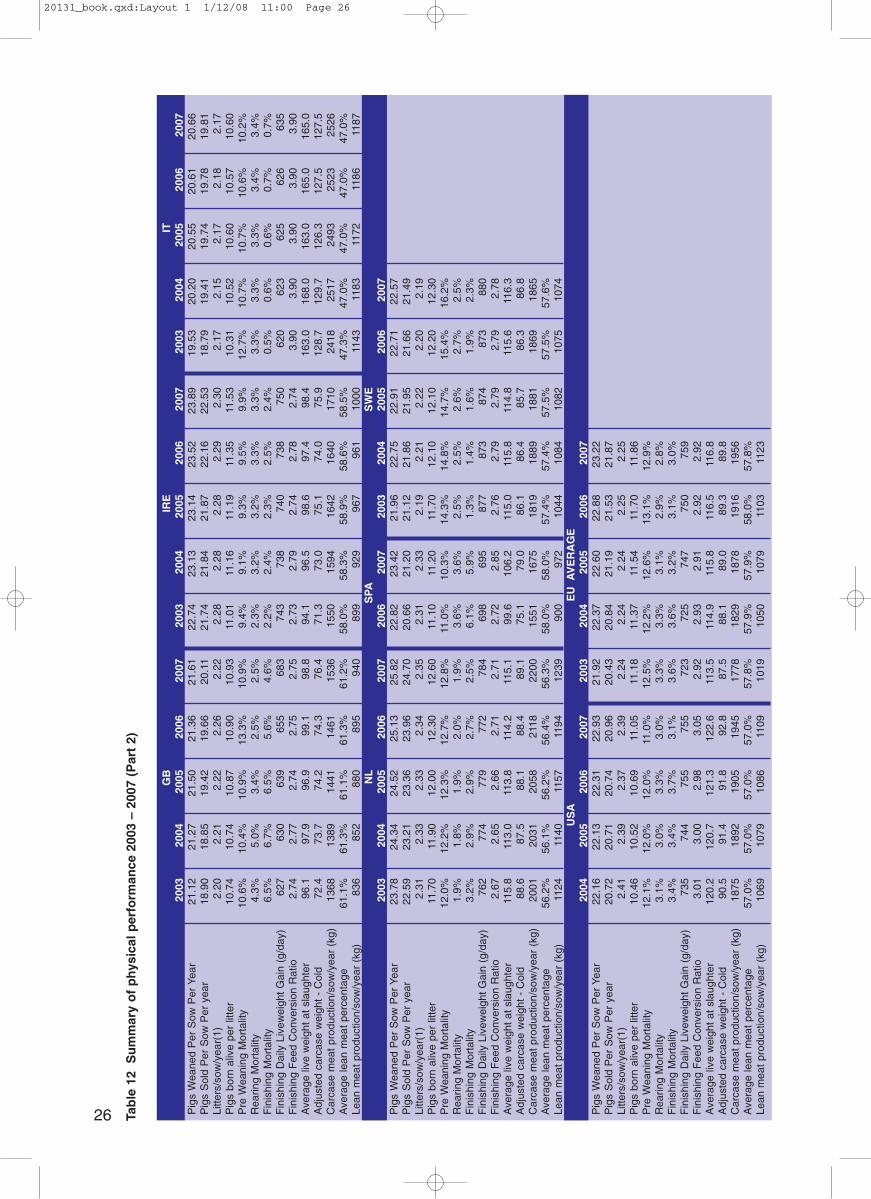
PHYSICAL PERFORMANCE SUMMARY
Table 10 contains physical performance data for selected EU countries in 2007, while Table 12 presentscomparisons with 2003 to 2006.
Table 10 Summary of physical performance, 2007
19
AUS BEL CAN DEN FRA GER GB IRE Pigs Weaned Per Sow Per Year 22.08 22.64 22.26 26.37 24.49 22.39 21.61 23.89Pigs Sold Per Sow Per year 20.53 21.11 20.61 24.46 22.99 20.89 20.11 22.53Litters/sow/year(1) 2.26 2.31 2.30 2.23 2.22 2.28 2.22 2.30Pigs born alive per litter 11.10 11.19 11.00 13.80 12.80 11.50 10.93 11.53Sow mortality 1.5% 4.1% 3.0% 15.0% 5.5% 6.0% 4.0% 6.4%Pre Weaning Mortality 12.0% 12.4% 12.0% 14.3% 14.0% 14.6% 10.9% 9.9%Rearing Mortality 3.5% 3.1% 3.0% 3.1% 2.2% 3.0% 2.5% 3.3%Finishing Mortality 3.5% 3.8% 4.4% 4.3% 4.0% 3.8% 4.6% 2.4%Sow replacement rate 40.9% 41.3% 40.0% 49.7% 42.9% 41.5% 42.7% 48.0%Transfer weight from breeding to rearing unit (kg) 7.50 7.20 6.00 7.30 7.50 7.50 7.80 6.90Age of weaning 28 26 21 32 25 27 28 29Transfer weight from rearing to finishing unit (kg) 31.50 23.50 23.00 30.00 32.30 30.10 36.90 35.40Rearing Daily Liveweight Gain (g/day) 430 346 450 434 474 440 466 445Rearing Feed Conversion Ratio 2.00 1.74 1.57 1.74 1.74 1.63 1.76 1.79Finishing Daily Liveweight Gain (g/day) 756 617 819 869 778 725 683 750Finishing Feed Conversion Ratio 2.95 2.98 2.68 2.67 2.90 2.92 2.75 2.74Ave number of days in rearing unit 56 50 38 52 52 51 62 64Ave number of days in finishing unit 114 147 116 90 107 124 91 84Pigs per pig place per year (finishing) 2.96 2.48 3.07 3.75 3.19 2.79 3.74 4.01Average live weight at slaughter 118.00 =114.23 118.00 108.47 115.80 120.00 98.80 98.40Carcase weighed hot or cold? H H cold H C H H CAverage carcase weight - Hot 94.1 92.9 99.2 82.8 91.6 94.8 78.0 77.4Adjustment from hot to cold -2.0% 2.0% -5.3% -1.1% -3.3% -2.0% -2.0% -2.0%Adjusted carcase weight - Cold 92.2 91.1 93.9 81.9 88.6 92.9 76.4 75.9Killing out percentage 78.1% 80.3% 79.6% 75.5% 76.5% 77.4% 77.3% 77.1%Carcase meat production per sow per year (kg) 1,893 1,922 1,935 2,003 2,037 1,941 1,536 1,710Average lean meat percentage 59.3% 61.7% 60.0% 60.3% 60.1% 56.5% 61.2% 58.5%Lean meat production per sow per year (kg) 1,122 1,186 1,161 1,208 1,224 1,096 940 1,000Sow feed (kg) per sow per year 1,060 1,154 1,111 1,424 1,313 1,230 1,377 1,220Sow ration Ave Energy Content (MJ ME/kg) 12.2 12.3 13.0 12.9 12.8 12.9 13.0 13.3Weaner/Rearer feed (kg) per pig 45.0 28.3 26.7 39.5 43.2 38.0 51.2 51.0Weaner/Rearer ration Ave Energy Content (MJ ME/kg) 13.0 13.1 13.7 14.1 13.3 13.4 13.7 14.0Finishing pigs feed consumption (kg) per pig 256.0 254.3 254.6 209.7 242.2 262.5 170.2 172.6Finisher ration Ave Energy Content (MJ ME/kg) 12.8 12.9 12.1 13.4 12.8 13.2 13.0 13.2
ITA NL SPA SWE USA AVE AVEEU All
Pigs Weaned Per Sow Per Year 20.61 25.82 23.42 22.57 22.93 23.26 23.16Pigs Sold Per Sow Per year 19.78 24.70 21.20 21.49 20.96 21.80 21.64Litters/sow/year(1) 2.18 2.35 2.33 2.19 2.39 2.26 2.27Pigs born alive per litter 10.57 12.60 11.20 12.30 11.05 11.77 11.66Sow mortality 0.5% 5.0% 8.0% 7.5% 9.2% 5.8% 5.8%Pre Weaning Mortality 10.6% 12.8% 10.3% 16.2% 11.0% 12.5% 12.4%Rearing Mortality 3.4% 1.9% 3.6% 2.5% 3.0% 2.9% 2.9%Finishing Mortality 0.7% 2.5% 5.9% 2.3% 3.1% 3.4% 3.5%Sow replacement rate 36.0% 43.0% 54.0% 56.7% 54.0% 45.2% 45.4%Transfer weight from breeding to rearing unit (kg) 7.60 8.41 6.30 10.00 5.10 7.64 7.32Age of weaning 27 26 24 34 19 28 26Transfer weight from rearing to finishing unit (kg) 35.00 25.50 19.20 30.90 24.40 30.03 29.05Rearing Daily Liveweight Gain (g/day) 438 328 318 426 385 413 414Rearing Feed Conversion Ratio 2.01 1.71 1.75 2.07 1.62 1.81 1.78Finishing Daily Liveweight Gain (g/day) 626 784 695 880 755 742 749Finishing Feed Conversion Ratio 3.90 2.71 2.85 2.78 3.05 2.92 2.91Ave number of days in rearing unit 63 52 41 49 50 54 52Ave number of days in finishing unit 208 114 125 97 130 118 119Pigs per pig place per year (finishing) 1.70 2.94 2.66 3.51 2.74 3.07 3.04Average live weight at slaughter 165.00 115.10 106.20 116.31 122.60 116.03 116.69Carcase weighed hot or cold? C H H C coldAverage carcase weight - Hot 130.4 90.9 80.0 88.6 92.8 91.0 91.8Adjustment from hot to cold -2.2% -2.0% -1.2% -2.0% 0.0% -1.6% -1.8%Adjusted carcase weight - Cold 127.5 89.1 79.0 86.8 92.8 89.2 89.9Killing out percentage 77.3% 77.4% 74.4% 74.6% 75.7% 76.9% 77.0%Carcase meat production per sow per year (kg) 2,523 2,200 1,675 1,865 1,945 1,937 1,937Average lean meat percentage 47.0% 56.3% 58.0% 57.6% 57.0% 57.9% 58.0%Lean meat production per sow per year (kg) 1,186 1,239 972 1,074 1,109 1,113 1,117Sow feed (kg) per sow per year 1,500 1,201 1,138 1,365 1,030 1,271 1,240Sow ration Ave Energy Content (MJ ME/kg) 11.9 12.9 na 12.4 13.8 12.7 12.8Weaner/Rearer feed (kg) per pig 55.1 29.2 22.6 43.2 31.3 40.6 38.8Weaner/Rearer ration Ave Energy Content (MJ ME/kg) 13.8 13.6 na 12.7 14.3 13.5 13.6Finishing pigs feed consumption (kg) per pig 507.0 242.8 248.0 237.1 299.5 254.8 258.2Finisher ration Ave Energy Content (MJ ME/kg) 12.7 13.8 na 12.5 14.1 13.1 13.1
2007 Pig Cost of Production in Selected Countries BPEX November 2008
20131_book.qxd:Layout 1 1/12/08 10:59 Page 19

Pigs weaned per sow per year
The overall average number of pigs weaned/sow/year in the European InterPIG countries showed a two percent increase in 2007, up from 22.89 in 2006 to 23.26. Eight of the 11 countries showed an improvement,with no change in Italy and France and a slight decline in Sweden. Denmark and the Netherlands continued tohave the best results for pigs weaned,
Performance results for Great Britain remain disappointing. Although there was a one per cent increase in2007, we continued to have the second lowest pigs weaned/sow/year figure. Only Italy had a lower figure,and this is because Italian pig production is different from the other countries - with pigs typically being fin-ished to much heavier weights. Despite performance increases in GB for four out of the past five years, aver-age results in 2007 were only 0.5 pigs higher than in 2003 compared with an increase of 1.4 pigs for the EU.
Pigs weaned are made up of three different elements: pigs born alive/litter, litters/sow/year (together thesegive pigs born/sow/year) and pre-weaning mortality. The GB result for litters/sow was 2.22, just one per centbelow the EU average, while pre-weaning mortality, at 10.9 per cent, was 15 per cent better than the EU aver-age. The main reason that Great Britain has a below average number of pigs weaned/sow lies in the numberof pigs born alive/litter; the 2007 average, at 10.93, was eight per cent less than the EU as a whole.
Outside the EU, the number of pigs weaned/sow also continued to improve in Canada and the United Statesin 2007, by two per cent and three per cent respectively. Results from the United States are similar to the EUaverage. The Canadian figure is slightly lower, at 22.3 in 2007, but it is increasing at a faster rate, up from20.8 in 2003.
Figure 6 Pigs weaned per sow per year, 2006 – 2007
Post-weaning mortality
The number of pigs finished per sow per year is determined by pigs weaned and by post-weaning mortality.Table 11 below shows national comparisons of post-weaning mortality (rearing and finishing herd combined),and how these have changed between 2003 and 2007.
By far the most marked improvement in post-weaning mortality in recent years has occurred in Great Britain,due in particular to the declining incidence of PMWS. Between 2003 and 2007 mortality declined by 34 percent in Great Britain compared with eight per cent in the EU as a whole. The decline in Great Britain waseven greater between 2004, when the mortality rate peaked, and 2007. Post-weaning mortality in Great Britainis, however, still higher than in 2000, before the spread of PMWS, when it was at 5.3 per cent.
The continued decline in 2007 meant that post-weaning mortality in Great Britain was no longer the highest ofthe InterPIG countries. More recent quarterly data from Agrosoft (see Appendix 4) indicate that post-weaning
20
17
18
19
20
21
22
23
24
25
26
27
IT GB AUS CAN GER SWE BEL USA SPA IRE FR NL DEN
20.6
21.4
21.8 21.8 21.922.3
22.8
23.5
24.5
25.1
25.9
20.7
21.6
22.3 22.422.6 22.6
23.4
23.9
24.5
25.8
26.4
21.6
22.7
22.1
22.9
2006 2007
2007 Pig Cost of Production in Selected Countries BPEX November 2008
20131_book.qxd:Layout 1 1/12/08 10:59 Page 20

mortality continued to improve through to the first quarter of 2008, although there was some increase in thesecond quarter. In 2008, BPEX began distributing PCV2 vaccine to the English pig industry. The full benefitsof this programme in terms of further reducing post-weaning mortality are unlikely to be seen before 2009.
There was a considerable range in national mortality levels. The lowest mortality in national herds in 2007was in Italy (4.1%) and the Netherlands (4.4%). There was a slight improvement in the Netherlands in 2007.Surprisingly, in view of its otherwise superior performance measures, Denmark had the joint-highest mortalityfigure, at 7.3 percent
Table 11 Post-weaning mortality, 2003 – 2007
Pigs finished per sow per year
The average number of pigs finished/sow increased for the fourth consecutive year in 2007. At 21.7sows/pigs, average performance was two per cent higher than in 2006 and seven per cent higher than in2003. Results for Great Britain have been boosted by increases in pigs weaned/sow and the declining trendin post-weaning mortality, but we are still near the bottom of the European league. In 2007, there were 20.1pigs finished/sow in Great Britain, two per cent higher than in 2006 and six per cent more than in 2003.Denmark and the Netherlands continue to have the highest number, and they both recorded an increase in2007.
Figure 7 Pigs finished per sow per year, 2006 – 2007
21
2003 2004 2005 2006 2007 2007/03 2007/06
Austria 7.9% 5.9% 6.9% 5.9% 6.9% -12% +16%Belgium 8.4% 7.4% 8.0% 7.6% 6.8% -20% -11%Canada 5.9% 4.9% 4.9% 4.9% 7.3% +23% +48%Denmark 7.3% 8.6% 7.9% 7.1% 7.3% +0% +3%France 7.5% 7.4% 7.1% 6.6% 6.1% -18% -7%Germany 6.4% 6.8% 7.0% 6.8% 6.7% +5% -1%Great Britain 10.5% 11.4% 9.7% 8.0% 7.0% -34% -12%Ireland 4.4% 5.5% 5.4% 5.7% 5.6% +29% -2%Italy 3.8% 3.9% 3.9% 4.0% 4.1% +8% +2%Netherlands 5.0% 4.6% 4.7% 4.6% 4.4% -14% -6%Sweden 3.8% 3.9% 4.2% 4.5% 4.7% +26% +4%United States na 6.4% 6.3% 6.9% 6.0% na -13%
EU average 6.5% 6.5% 6.5% 6.2% 6.0% -8% -3%InterPIG 6.4% 6.4% 6.3% 6.1% 6.1% -6% +0%
2007 Pig Cost of Production in Selected Countries BPEX November 2008
19.819.7
20.3
20.7
20.3 20.220.7
21.7
22.2
22.9
24.0 24.0
19.8
20.5 20.620.9 21.0 21.1 21.2
21.5
22.5
23.0
24.524.7
20.7
20.1
16
17
18
19
20
21
22
23
24
25
26
IT GB AUS CAN GER USA BEL SPA SWE IRE FR DEN NL
2006 2007
20131_book.qxd:Layout 1 1/12/08 10:59 Page 21

Daily Liveweight Gains (DLG)
The average DLG for finishing herds across the EU countries in 2007 was 737g, just one per cent higherthan in 2006. Sweden (880g) and Denmark (869g) again had the best growth rates. The most markedimprovement occurred in Great Britain, up four per cent to 683g. Great Britain results have increasedevery year since 2003, when they averaged 627g/day. This improvement in DLG has made an importantcontribution to holding costs of production down. It is estimated that if the DLG in 2007 had still been at the2003 level, pigs would have needed to have spent eight days more in the finishing unit to reach the sameweight, with consequent implications for production costs.
Previous reports have made the point that results for Great Britain are being hit by a lack of investment innew buildings and equipment arising from continued poor profitability and this continued to be the case.Despite the improvements, the GB results are still third lowest in the EU, with just Belgium and Italy show-ing poorer results.
The impressive performance results recorded for finishing DLG have not, unfortunately been matched byrearing DLG figures. Daily liveweight gain peaked in 2004 at 509g, but fell back in the following two years.Average results for 2007 were 466g, only slightly better than in 2003 and 2004.
Figure 8 Daily liveweight gains (finishing herds) 2006 – 2007
Feed Conversion Ratios (FCR)
Great Britain has one of the lowest finishing herd feed conversion ratios in the InterPIG countries. The rela-tively good performance will have been due to the fact that pigs are finished to lower weights than in mostother countries. Feed conversion ratios have been little changed since 2002. Among the EuropeanInterPIG countries, there was an average one per cent decline in 2007, although Spain recorded a five percent increase.
22
610626
655
698
720
738
755 752
773 772
826
861873
617
635
683695
725
750 755 756
778 784
819
869880
500
550
600
650
700
750
800
850
900
g/day
BEL IT GB SPA GER IRE USA AUS FR NL CAN DEN SWE
2006 2007
2007 Pig Cost of Production in Selected Countries BPEX November 2008
20131_book.qxd:Layout 1 1/12/08 10:59 Page 22

23
Figure 9 Feed conversion ratios (finishing herds), 2006 – 2007
The rearing herd feed conversion ratio in Great Britain was 1.76 in 2007, slightly better than the EU aver-age of 1.81. Great Britain results deteriorated slightly compared with 2006 and 2007, although they werestill better than the results for the previous three years. There was a nine per cent decline in the Germanrearing herd FCR in 2007 to 1.63, and they consequently now have the lowest FCR in the EU. HoweverFCR in the three non-EU countries are all lower (ie better) than Germany.
Carcase weight production per sow/year
The amount of carcase meat produced per sow is the product of the number of pigs finished per sow andthe average carcase weight of pigs. Great Britain produces lighter pigs than elsewhere in Europe and this,together with the below-average number of pigs finished per sow, means that the amount of carcase meatproduced per sow is the lowest of all the EU countries.
The amount of carcase meat produced per sow in the EU (excluding Italy) was 1.88 tonnes in 2007, threeper cent more than the year before. Improvements in the number of pigs finished/sow and higher averagecarcase weights mean that production/sow has increased every year since 2003. The highest amount ofpig meat produced per sow is in Italy, but this is by virtue of its much heavier pig production. ExcludingItaly, the Netherlands and France were again the most productive countries.
Great Britain produced 1.54 tonnes in 2007, five per cent higher than in 2007 due to a combination of high-er carcase weights and increased pigs finished/sow. The Great Britain figures have been on a longer-termupward trend, increasing from 1.35 tonnes in 2002. The increase in carcase weights in 2007 was in partdue to the FMD outbreak in August, which led to a backlog of pigs awaiting slaughter. However, 2008 car-case weights are likely to be at least as high as in the previous year.
Spain also has a relatively low production/sow, at 1.68 tonnes in 2007. However, Great Britain and Spainrecorded the most marked improvements in InterPIG in 2007.
2.65
2.96
2.71
2.782.75
2.72
2.952.98 2.98
2.672.68
2.712.74 2.75
2.78
2.852.90 2.92
2.952.98
3.05
3.90 3.90
2.00
2.20
2.40
2.60
2.80
3.00
3.20
DEN CAN NL IRE GB SWE SPA FR GER AUS BEL USA IT
2006 2007
2007 Pig Cost of Production in Selected Countries BPEX November 2008
20131_book.qxd:Layout 1 1/12/08 10:59 Page 23

Figure 10 Carcase meat production per sow/year
24
kg/sow
1461
1551
1640
1869 1861 18621905
2024
2118
2523
1536
16751710
18651893
1922 1935 1941 1945
20032037
2200
2526
1882 1871
1935
1,200
1,400
1,600
1,800
2,000
2,200
2,400
2,600
GB SPA IRE SWE AUS BEL CAN GER USA DEN FR NL IT
2006 2007
2007 Pig Cost of Production in Selected Countries BPEX November 2008
20131_book.qxd:Layout 1 1/12/08 10:59 Page 24

Tab
le 1
2 S
um
mar
y o
f p
hys
ical
per
form
ance
200
3 –
2007
(P
art
1)
AU
SB
EL
BR
Z20
0320
0420
0520
0620
0720
0320
0420
0520
0620
0720
06Pigs Weaned Per Sow
Per Year
20.34
20.69
21.56
21.56
22.08
20.59
20.86
21.41
21.88
22.64
19.97
Pigs Sold Per Sow
Per year
18.71
19.45
20.05
20.27
20.53
18.86
19.32
19.69
20.22
21.11
18.52
Litters/sow
/year
2.20
2.19
2.24
2.23
2.26
2.25
2.25
2.28
2.30
2.31
2.01
Pigs born alive per litter
10.60
10.79
10.90
11.00
11.10
10.42
10.57
10.72
10.92
11.19
10.67
Pre W
eaning Mortality
12.8%
12.4%
11.7%
12.1%
12.0%
12.2%
12.3%
12.4%
12.7%
12.4%
6.9%
Rearing Mortality
5.0%
3.0%
4.0%
3.0%
3.5%
4.3%
3.6%
4.0%
3.9%
3.1%
3.4%
Finishing Mortality
3.0%
3.0%
3.0%
3.0%
3.5%
4.3%
3.9%
4.2%
3.9%
3.8%
4.0%
Finishing Daily Livew
eight Gain (g/day)
730
740
747
752
756
590
604
608
610
617
788
Finishing Feed Conversion Ratio
3.00
2.95
2.93
2.95
2.95
3.03
2.99
2.99
2.98
2.98
2.54
Average live weight at slaughter
118.0
117.3
118.0
118.0
118.0
113.2
114.1
114.6
115.1
114.2
109.3
Adjusted carcase weight - Cold
92.1
91.6
92.0
91.8
92.2
90.9
91.7
92.1
93.1
91.1
79.4
Carcase meat production/sow/year (kg)
1723
1782
1845
1861
1893
1715
1771
1813
1882
1922
1470
Average lean meat percentage
60.5%
60.5%
59.2%
59.2%
59.3%
60.5%
60.5%
61.5%
62.0%
61.7%
57.4%
Lean meat production/sow/year (kg)
1043
1078
1092
1101
1122
1038
1072
1115
1167
1186
844
CA
ND
EN
2003
2004
2005
2006
2007
2003
2004
2005
2006
2007
Pigs Weaned Per Sow
Per Year
20.79
21.38
21.38
21.78
22.26
23.97
24.66
25.43
25.86
26.37
Pigs Sold Per Sow
Per year
19.54
20.31
20.31
20.69
20.61
22.23
22.54
23.41
24.03
24.46
Litters/sow
/year
2.20
2.20
2.20
2.20
2.30
2.25
2.25
2.24
2.23
2.23
Pigs born alive per litter
10.50
10.80
10.80
11.00
11.00
12.30
12.70
13.20
13.50
13.80
Pre W
eaning Mortality
10.0%
10.0%
10.0%
10.0%
12.0%
13.4%
13.7%
14.0%
14.1%
14.3%
Rearing Mortality
3.0%
2.0%
2.0%
2.0%
3.0%
3.6%
4.6%
3.8%
3.2%
3.1%
Finishing Mortality
3.0%
3.0%
3.0%
3.0%
4.4%
3.8%
4.2%
4.3%
4.0%
4.3%
Finishing Daily Livew
eight Gain (g/day)
826
826
826
826
819
831
835
842
861
869
Finishing Feed Conversion Ratio
2.96
2.96
2.96
2.96
2.68
2.70
2.69
2.66
2.65
2.67
Average live weight at slaughter
113.0
113.0
113.0
113.0
118.0
102.0
102.0
105.0
106.8
108.5
Adjusted carcase weight - Cold
90.0
90.0
90.0
90.0
93.9
77.1
77.1
79.2
80.5
81.9
Carcase meat production/sow/year (kg)
1759
1828
1828
1862
1935
1714
1738
1854
1935
2003
Average lean meat percentage
60.0%
60.0%
60.0%
60.0%
60.0%
60.0%
60.1%
60.2%
60.3%
60.3%
Lean meat production/sow/year (kg)
1055
1097
1097
1117
1161
1028
1044
1116
1167
1208
FR
GE
R20
0320
0420
0520
0620
0720
0320
0420
0520
0620
07Pigs Weaned Per Sow
Per Year
23.75
23.86
24.16
24.53
24.49
20.50
20.88
21.50
21.79
22.39
Pigs Sold Per Sow
Per year
21.98
22.10
22.45
22.91
22.99
19.18
19.46
20.00
20.31
20.89
Litters/sow
/year
2.24
2.23
2.24
2.26
2.22
2.23
2.24
2.26
2.27
2.28
Pigs born alive per litter
12.30
12.50
12.60
12.70
12.80
10.80
10.90
11.10
11.20
11.50
Pre W
eaning Mortality
13.8%
14.2%
14.4%
14.4%
14.0%
14.9%
14.5%
14.3%
14.3%
14.6%
Rearing Mortality
2.6%
2.5%
2.4%
2.3%
2.2%
2.8%
3.0%
3.0%
3.0%
3.0%
Finishing Mortality
5.0%
5.0%
4.8%
4.4%
4.0%
3.7%
3.9%
4.1%
3.9%
3.8%
Finishing Daily Livew
eight Gain (g/day)
766
760
768
773
778
705
708
715
720
725
Finishing Feed Conversion Ratio
2.91
2.94
2.92
2.90
2.90
2.97
2.96
2.95
2.95
2.92
Average live weight at slaughter
113.8
114.9
114.6
115.5
115.8
118.0
118.2
119.0
119.0
120.0
Adjusted carcase weight - Cold
87.1
87.9
87.7
88.4
88.6
93.2
91.8
92.3
92.1
92.9
Carcase meat production/sow/year (kg)
1914
1943
1968
2024
2037
1788
1787
1845
1871
1941
Average lean meat percentage
60.4%
61.1%
61.3%
61.5%
60.1%
56.0%
56.4%
56.5%
56.5%
56.5%
Lean meat production/sow/year (kg)
1156
1187
1206
1245
1224
1001
1008
1042
1056
1096
20131_book.qxd:Layout 1 1/12/08 11:00 Page 25
26 Tab
le 1
2 S
um
mar
y o
f p
hys
ical
per
form
ance
200
3 –
2007
(P
art
2)
GB
IRE
IT20
0320
0420
0520
0620
0720
0320
0420
0520
0620
0720
0320
0420
0520
0620
07Pigs Weaned Per Sow
Per Year
21.12
21.27
21.50
21.36
21.61
22.74
23.13
23.14
23.52
23.89
19.53
20.20
20.55
20.61
20.66
Pigs Sold Per Sow
Per year
18.90
18.85
19.42
19.66
20.11
21.74
21.84
21.87
22.16
22.53
18.79
19.41
19.74
19.78
19.81
Litters/sow
/year(1)
2.20
2.21
2.22
2.26
2.22
2.28
2.28
2.28
2.29
2.30
2.17
2.15
2.17
2.18
2.17
Pigs born alive per litter
10.74
10.74
10.87
10.90
10.93
11.01
11.16
11.19
11.35
11.53
10.31
10.52
10.60
10.57
10.60
Pre W
eaning Mortality
10.6%
10.4%
10.9%
13.3%
10.9%
9.4%
9.1%
9.3%
9.5%
9.9%
12.7%
10.7%
10.7%
10.6%
10.2%
Rearing Mortality
4.3%
5.0%
3.4%
2.5%
2.5%
2.3%
3.2%
3.2%
3.3%
3.3%
3.3%
3.3%
3.3%
3.4%
3.4%
Finishing Mortality
6.5%
6.7%
6.5%
5.6%
4.6%
2.2%
2.4%
2.3%
2.5%
2.4%
0.5%
0.6%
0.6%
0.7%
0.7%
Finishing Daily Livew
eight Gain (g/day)
627
630
639
655
683
743
738
740
738
750
620
623
625
626
635
Finishing Feed Conversion Ratio
2.74
2.77
2.74
2.75
2.75
2.73
2.79
2.74
2.78
2.74
3.90
3.90
3.90
3.90
3.90
Average live weight at slaughter
96.1
97.9
96.9
99.1
98.8
94.1
96.5
98.6
97.4
98.4
163.0
168.0
163.0
165.0
165.0
Adjusted carcase weight - Cold
72.4
73.7
74.2
74.3
76.4
71.3
73.0
75.1
74.0
75.9
128.7
129.7
126.3
127.5
127.5
Carcase meat production/sow/year (kg)
1368
1389
1441
1461
1536
1550
1594
1642
1640
1710
2418
2517
2493
2523
2526
Average lean meat percentage
61.1%
61.3%
61.1%
61.3%
61.2%
58.0%
58.3%
58.9%
58.6%
58.5%
47.3%
47.0%
47.0%
47.0%
47.0%
Lean meat production/sow/year (kg)
836
852
880
895
940
899
929
967
961
1000
1143
1183
1172
1186
1187
NL
SPA
SW
E20
0320
0420
0520
0620
0720
0620
0720
0320
0420
0520
0620
07Pigs Weaned Per Sow
Per Year
23.78
24.34
24.52
25.13
25.82
22.82
23.42
21.96
22.75
22.91
22.71
22.57
Pigs Sold Per Sow
Per year
22.59
23.21
23.36
23.96
24.70
20.66
21.20
21.12
21.86
21.95
21.66
21.49
Litters/sow
/year(1)
2.31
2.33
2.33
2.34
2.35
2.31
2.33
2.19
2.21
2.22
2.20
2.19
Pigs born alive per litter
11.70
11.90
12.00
12.30
12.60
11.10
11.20
11.70
12.10
12.10
12.20
12.30
Pre W
eaning Mortality
12.0%
12.2%
12.3%
12.7%
12.8%
11.0%
10.3%
14.3%
14.8%
14.7%
15.4%
16.2%
Rearing Mortality
1.9%
1.8%
1.9%
2.0%
1.9%
3.6%
3.6%
2.5%
2.5%
2.6%
2.7%
2.5%
Finishing Mortality
3.2%
2.9%
2.9%
2.7%
2.5%
6.1%
5.9%
1.3%
1.4%
1.6%
1.9%
2.3%
Finishing Daily Livew
eight Gain (g/day)
762
774
779
772
784
698
695
877
873
874
873
880
Finishing Feed Conversion Ratio
2.67
2.65
2.66
2.71
2.71
2.72
2.85
2.76
2.79
2.79
2.79
2.78
Average live weight at slaughter
115.8
113.0
113.8
114.2
115.1
99.6
106.2
115.0
115.8
114.8
115.6
116.3
Adjusted carcase weight - Cold
88.6
87.5
88.1
88.4
89.1
75.1
79.0
86.1
86.4
85.7
86.3
86.8
Carcase meat production/sow/year (kg)
2001
2031
2058
2118
2200
1551
1675
1819
1889
1881
1869
1865
Average lean meat percentage
56.2%
56.1%
56.2%
56.4%
56.3%
58.0%
58.0%
57.4%
57.4%
57.5%
57.5%
57.6%
Lean meat production/sow/year (kg)
1124
1140
1157
1194
1239
900
972
1044
1084
1082
1075
1074
US
AE
U A
VE
RA
GE
20
0420
0520
0620
0720
0320
0420
0520
0620
07Pigs Weaned Per Sow
Per Year
22.16
22.13
22.31
22.93
21.92
22.37
22.60
22.88
23.22
Pigs Sold Per Sow
Per year
20.72
20.71
20.74
20.96
20.43
20.84
21.19
21.53
21.87
Litters/sow
/year(1)
2.41
2.39
2.37
2.39
2.24
2.24
2.24
2.25
2.25
Pigs born alive per litter
10.46
10.52
10.69
11.05
11.18
11.37
11.54
11.70
11.86
Pre W
eaning Mortality
12.1%
12.0%
12.0%
11.0%
12.5%
12.2%
12.6%
13.1%
12.9%
Rearing Mortality
3.1%
3.0%
3.3%
3.0%
3.3%
3.3%
3.1%
2.9%
2.8%
Finishing Mortality
3.4%
3.4%
3.7%
3.1%
3.6%
3.6%
3.2%
3.1%
3.0%
Finishing Daily Livew
eight Gain (g/day)
735
744
755
755
723
725
747
750
759
Finishing Feed Conversion Ratio
3.01
3.00
2.98
3.05
2.92
2.93
2.91
2.92
2.92
Average live weight at slaughter
120.2
120.7
121.3
122.6
113.5
114.9
115.8
116.5
116.8
Adjusted carcase weight - Cold
90.5
91.4
91.8
92.8
87.5
88.1
89.0
89.3
89.8
Carcase meat production/sow/year (kg)
1875
1892
1905
1945
1778
1829
1878
1916
1956
Average lean meat percentage
57.0%
57.0%
57.0%
57.0%
57.8%
57.9%
57.9%
58.0%
57.8%
Lean meat production/sow/year (kg)
1069
1079
1086
1109
1019
1050
1079
1103
1123
20131_book.qxd:Layout 1 1/12/08 11:00 Page 26

STANDARDISING THE PHYSICAL RESULTS
Methodology
There is a wide variation in physical performance measures reported by InterPIG countries. Howeversome of these variations could in fact be due to differences between countries in the weight of animals pro-duced. Other things being equal, an increase in slaughter weights, and the length of time an animal is inthe system, will lead to a decline in both the marginal daily liveweight gain and the marginal feed conver-sion ratio.
Using methodology created by our French InterPIG partner, ITP, the figures have been standardised on thebasis of three weights:
• Transfer from breeding unit to rearing unit: 8kg (GB = 7.8kg in 2007)• Transfer from rearing unit to finishing unit: 30kg (GB = 36.9kg)• Liveweight at slaughter: 120kg (GB = 98.8kg)
This section examines the adjustments that have been made to the finishing FCR and DLG figures in theEuropean InterPIG countries to exclude the differences caused by variations in national transfer andslaughter weights.
Daily liveweight gain (DLG)
Average liveweight at slaughter in Great Britain in 2007 was 99kg, well below the EU average of 117kg.Increasing the average weight to the standardised figure of 120kg and reducing the transfer weight fromthe rearing herd to 30kg would imply a reduction in daily liveweight gain from 683g to 671g. In actualterms, GB DLG is ranked ninth of the 11 EU countries but in standardised terms it is tenth. As a proportionof the EU average, Great Britain falls from 92 per cent (actual) to 90 per cent (standardised). The mostmarked upwards adjustment as a result of standardisation is in Italy, up from 635g to 675g.
Figure 11 Standardised daily liveweight gains (finishing herds), 2007
Feed conversion ratios (FCR)
An increase in average liveweight at slaughter in Great Britain from 99kg to 120kg implies deterioration inthe average feed conversion ratio from 2.75 to 2.87. However, after standardisation, Great Britain stillranks fourth in the EU countries. Again, the Italian figures change most, down from 3.90 to 3.40.
27
Source: InterPIG
756
617
869
778
683
750
784
880
752
633
869
772
671
725740
675
797
733
877
725
635
695
500
550
600
650
700
750
800
850
900
g/day
AUS BEL DEN FRA GB GER IRE IT NL SPA SWE
Actual Standardised
2007 Pig Cost of Production in Selected Countries BPEX November 2008
20131_book.qxd:Layout 1 1/12/08 11:00 Page 27

Figure 12 Standardised feed conversion ratios, 2007
28
2.95 2.98
2.67
2.90
2.75 2.74 2.712.78
2.95
3.10
2.77
2.912.87
2.922.88
3.40
2.79
3.10
2.80
2.92
3.90
2.85
2.0
2.2
2.4
2.6
2.8
3.0
3.2
3.4
3.6
3.8
4.0
AUS BEL DEN FRA GB GER IRE IT NL SPA SWE
Actual Standardised
2007 Pig Cost of Production in Selected Countries BPEX November 2008
20131_book.qxd:Layout 1 1/12/08 11:00 Page 28

29
PERFORMANCE AND PRODUCTION COSTS
Comparison of GB results with EU average
Table 13 shows 2007 Great Britain and overall EU comparisons of physical results. These indicate theareas where British performance falls short of the EU average, thus contributing to relatively high costs ofproduction. They are therefore the potential areas that we should pay particular attention to in order toimprove our relative performance. The table also shows improvement/deterioration in these performancemeasures compared with 2006.
Table 13 GB and EU physical results
GB EU ave GB deviation (per cent) (a)2007 2006
Pigs Weaned Per Sow Per Year 21.6 23.3 -7 -2
Pigs Sold Per Sow Per year 20.1 21.8 -8 -0
Litters/sow/year 2.2 2.3 -2 -5
Pigs born alive per litter 10.9 11.8 -7 +4
Sow mortality 4.0% 5.8%
Pre Weaning Mortality 10.9% 12.5% +13 -33
Rearing Mortality 2.5% 2.9% +15 0
Finishing Mortality 4.6% 3.4% -34 -23
Transfer weight from breeding to rearing unit (kg) 7.8 7.6
Age of weaning (days) 28.0 27.7
Transfer weight from rearing to finishing unit (kg) 36.9 30.0
Rearing Daily Liveweight Gain (g/day) 466 413 +13 +14
Rearing Feed Conversion Ratio 1.76 1.81 +3 -1
Finishing Daily Liveweight Gain (g/day) 683 742 -8 -4
Finishing Feed Conversion Ratio 2.75 2.92 +6 +4
Ave number of days in rearing unit 62.4 53.9
Ave number of days in finishing unit 90.6 118.4
Pigs per pig place per year (finishing) 3.74 3.07 +22 +2
Average live weight at slaughter 98.8 116.0 -15 -2
Adjusted carcase weight - Cold 76.4 89.2 -14 +0
Killing out percentage 77.3% 76.9% +1 +2
Carcase meat production per sow per year (kg) 1536 1937 -21 -0
Average lean meat percentage 61.2% 57.9% +6 -1
Lean meat production per sow per year (kg) 940 1113 -16 -1
Sow feed (kg) per sow per year 1377 1271 -8 -19
Weaner/Rearer feed (kg) per pig 51 41 -26 -22
Finishing pigs feed consumption (kg) per pig 170 255 +33 +12
Labour per finished pig per year in hours 1.12 0.99 -13 -13
(a) Where the production factor makes a definite contribution to costs, a -ve implies higher costs and a +ve implies
lower costs
2007 Pig Cost of Production in Selected Countries BPEX November 2008
20131_book.qxd:Layout 1 1/12/08 11:00 Page 29

30
Impact on costs of improving performance
There are, therefore, a number of key areas where the performance of the British pig industry falls short ofthe EU average. Improvements in these areas will lead to reductions in costs of production.
The following table shows the impact on production costs of improvements in key variables where GB per-formance is currently below the EU average. It shows the effect on average production costs if perform-ance improves to the EU average. Each of the variables is examined in turn, with the other variables heldconstant.
Table 14 Impact of changes in performance on production costs (a)
Improvements in GB performance up to the European average in each of these variables will trim up to
2.7p/kg off the average cost of producing a pig. If there were a simultaneous improvement in each of thevariables, the costs of production would be reduced by 6p/kg. This would reduce the cash costs of produc-tion from 105p/kg to 99p
In practical terms there could be constraints on increasing the average weight at slaughter by 17kg lw, dueto the implications for housing and contract specifications. However, offsetting this, the fact that Britishpigs are significantly lighter than the EU average means that producers should be aiming for a dailyliveweight gain of more than the average of 742 grams.
GB EU Cost changep/kg
Born alive per litter 10.9 11.8 -2.7
Litters/sow/year 2.22 2.26 -0.6
DLWG (Finishing Herds)(g) 683 742 -0.6
Post-weaning mortality (%) 7.0 6.0 -0.4
Increase weight at slaughter (kg lw) 98.8 116.0 -2.0
Total of above -6.3
(a) Based on improving GB performance figures to the EU average
2007 Pig Cost of Production in Selected Countries BPEX November 2008
20131_book.qxd:Layout 1 1/12/08 11:00 Page 30

31
ADJUSTMENTS TO PRICES
The impact on relative costs
Variations in national prices are not always reflected in the returns received by producers. Consequently,the national reference prices which are published weekly by the EU Commission are not necessarily anideal basis on which to base market analysis.
Inconsistencies between countries can arise because :• Some reference prices exclude bonuses paid to producers• Some reference prices exclude deductions from prices paid to producers• There are differences in the E grade definitions used by member states. The definition in some mem-
ber states is 55 per cent lean meat and above and in others it is 55 to 59 per cent lean meat.
In addition there are differences in carcase dressing specifications (see Appendix lll)
As a first step to ironing out potential inconsistencies and improving market transparency the individualmember states were asked to complete a questionnaire that detailed what lean meat percentages wereused and whether there were bonuses/deductions not reported in the weekly reference price.
The results, which were also published in the previous report, indicated some marked differences in report-ing methodology between member states. Reference prices in France, Italy, the Netherlands and theUnited Kingdom exclude bonus payments. Deductions (for example for transport or classification) are notmade from reference prices in Denmark, Spain, France, the Netherlands, Austria, Sweden and the UnitedKingdom.
Some more information has since become available:
• Belgian sources have reported that the reference price is a gross price before deductions. There are no bonuses payable to Belgian producers except in special circumstances.
• German reference prices include additions and deductions for characteristics such as quality and weight. However, they are not net of charges made for collection and transport to the abattoir
Table 15 Selected results from the reference prices questionnaire
Austria 55-59 No No
Czech Republic 55+ No No
Denmark 55-59 No No
France 55+ Yes No
Hungary 55-59 No No
Ireland 55-60 No Yes
Italy 55+ Yes Yes
Netherlands 56 Yes No
Poland 55+ No No
Spain 55+ No No
Sweden 55-59 No No
United Kingdom 55-59 Yes Yes
Belgium No Yes
Germany No Yes
Grade definition used forprice reporting (Lean Meat %)
Do farmers receive extrapayments when sellingtheir pigs that are not
reported in your weekly
reference price?
Do farmers have deductions made from the
price reported in yourcountry when selling their
pigs?
2007 Pig Cost of Production in Selected Countries BPEX November 2008
20131_book.qxd:Layout 1 1/12/08 11:00 Page 31

32
The intention was that after further discussion at future pig management committee meetings the inconsis-tencies caused by differences in grade definitions and in the treatment of bonuses/deductions would even-tually be removed. But so far there appears to have been limited progress made in these areas. However,information is available from InterPIG countries on bonuses/deductions which can be applied to nationalreference prices, where relevant, in order to iron out some of the inconsistencies.
Deductions
Table 16 itemises the deductions in the participating InterPIG countries. In some cases no information wasprovided, and the InterPIG sample has been supplemented with information from other sources.Deductions will apply to national quoted price series but, as indicated in the previous table, referenceprices in some of these countries will already be net of deductions. Both deductions and bonuses havebeen converted into a sterling equivalent based on average exchange rates in September 2008.
Table 16 Deductions from quoted pig prices
The highest deductions are in Germany (6.8p/kg dw) and Great Britain (6.9p) while the lowest deductionsare made in Belgium (0.2p), Italy (0.4p) and Sweden (0.7p).
Bonuses
The bonuses payable to producers are analysed in Table 17. Bonuses are not paid in all countries.Producers in Austria, Ireland and Italy do not receive any bonuses. The highest bonuses are paid inFrance (£11.40/pig or 12.8p/kg) and Denmark (£5.80/pig or 7.1p/kg). Some bonuses are mainly based on
AUS BEL DEN FRA GER UK£/pig
Promotion 0.6 0.1 0.4 0.8
Research 0.6 0.1 0.2
Animal health 0.1
Carcase classification 0.3 1.4 0.4 0.1 0.4
Veterinary inspections and testing 0.0 1.4 0.5
Transport 0.8 2.0 2.5
Offal disposal 06 0.2
Health deductions 0.7
Carcase disposal (a) 0.0 0.4 0.2
Marketing fee 0.0 0.4
Credit insurance 0.2 0.1 0.2 0.1
Other 0.7 1.2 0.1
Total deductions (£/pig) 2.4 0.2 2.8 0.6 6.3 5.3Total deductions (p/kg) 2.6 0.2 3.4 0.7 6.8 6.9
IRE ITA NL SPA SWE
Promotion 0..2
Research 0.0
Animal health 0.5
Carcase classification 0.2
Veterinary inspections and testing 1.0
Transport 2.5 0.6
Offal disposal
Health deductions 0.3
Carcase disposal (a)
Marketing fee
Credit insurance
Other 0.9
Total deductions (£/pig) 1.3 0.5 1.5 2.0 0.6Total deductions (p/kg) 1.7 0.4 1.7 2.5 0.7
(a) Carcase disposal charge based on a typical condemnation rate of 1.5%, except in Sweden where there is a flat rate
charge across all pigs
2007 Pig Cost of Production in Selected Countries BPEX November 2008
20131_book.qxd:Layout 1 1/12/08 11:00 Page 32

33
quality standards, eg France, while some are mainly profit-sharing, eg Denmark and Sweden.
Table 17 Additions to quoted pig prices
Total adjustments to reference prices
Table 18 and Figure 11 summarise the effect of bonuses and deductions on national reference prices incases where these bonuses/deductions are applicable. In three of the European InterPIG countries -Austria, Spain and Sweden – the reported reference prices already take account of any relevant bonus-es/deductions. In two of the remaining eight countries – Belgium and Italy – the size of the adjustment isvery small.
Table 18 Adjustments to reference prices
Negative adjustments are made to reference prices in Germany, the United Kingdom and Ireland, although
the most marked adjustment (-6.4p/kg) occurs in the UK. Consequently the adjusted GB price was actual-
ly lower than the Dutch price in September 2008. However, the price relationship in that month was not
typical, as usually the United Kingdom reference price is well above the Dutch price.
Positive adjustments are made to reference prices in the Netherlands and France. Although the Dutchadjustment is relatively small (a bonus equivalent to 1.3p/kg) the French adjustment is much larger(+12.8p/kg). So, whereas the unadjusted French price was 6.5p below the UK price, the adjusted Frenchprice was 12.7p above the UK price.
AUS BEL DEN FRA GER UK
Total bonuses (£/pig) 0.0 0.0 5.8 11.4 2.1 0.4
Total bonuses (p/kg) 0.0 0.0 7.1 12.8 2.3 0.6
IRE ITA NL SPA SWE
Total bonuses (£/pig) 0.0 0.0 1.1 0.0 3.2
Total bonuses (p/kg) 0.0 0.0 1.3 0.0 3.7
AUS BEL DEN FRA GER UKp/kg
Reference price (p/kg) (a) 135.5 128.8 117.8 126.5 143.4 133.0
Deductions 0.0 -0.2 0.0 0.0 -6.8 -6.9
Bonuses 0.0 0.0 0.0 +12.8 +2.3 +0.6
Adjusted price 138.5 128.5 117.8 139.3 138.9 126.6
IRE ITA NL SPA SWE
Reference price (p/kg) (a) 127.1 156.0 129.1 133.6 134.3
Deductions -1.7 -0.4 0.0 0.0 0.0
Bonuses 0.0 0.0 1.3 0.0 0.0
Adjusted price 125.4 155.6 130.4 133.6 134.3
(a) Monthly average for September 2008
2007 Pig Cost of Production in Selected Countries BPEX November 2008
20131_book.qxd:Layout 1 1/12/08 11:00 Page 33

Figure 13 Adjusted reference prices
The estimated national price adjustments are mainly based on 2007 figures, which have been adjusted tothe sterling equivalent on the basis of average September 2008 exchange rates. Clearly bonus-es/deductions can change from year to year, and exchange rates can be very volatile – especially duringperiods of economic turbulence as in 2008. Therefore these adjustments should be considered as a snap-shot picture at a point in time.
Further work needs to be done to improve comparability between national reference prices. In particularthere needs to be a common definition of grade E pigs or, alternatively, a commonly accepted methodologyfor ironing out the differences in definitions.
There are also differences in the ways that reference prices are collected. In the United Kingdom, the ref-erence price is derived from the same sample as the DAPP price series. But in some countries the refer-ence price comes from a different, often smaller, sample than the main national price series. Therefore reference price trends may be different from national price series.
34
128.8
117.8
126.5
139.3 138.9
126.6125.4
155.6
143.4
127.1
138.5
117.8
130.4
134.3
138.5
133.0
156.0
129.1
133.6 134.3133.6
100
110
120
130
140
150
160
AUS BEL DEN FRA GER UK IRE ITA NL SPA SWE
Unadjusted Adjusted
2007 Pig Cost of Production in Selected Countries BPEX November 2008
20131_book.qxd:Layout 1 1/12/08 11:00 Page 34

MONITORING CHANGES IN COSTS OF PRODUCTION
The relative costs analysed in this report relate to the 2007 calendar year. However, feed prices trendedhigher during the course of 2007, so that by the end of the year production costs in most countries weresignificantly higher than the annual average. Feed prices remained at or near record levels in the first halfof 2008 but since the middle of the year they have moved lower.
This chapter examines how the changes in monthly average feed prices have affected relative costs ofproduction. In these calculations, feed prices are the only factors that have been changed; all other vari-ables have been left unchanged. For this reason, and also because the current feed costs will not haveapplied throughout 2008, these figures should not be considered as provisional 2008 results.
Feed cost movements
During the first few months of 2008 cereal ingredient prices continued to increase, reaching record levels inthe spring. Since then prices have fallen on the back of improved crop estimates. They are currently(October 2008) about half of the peak levels. Soya prices have shown similar patterns, although the extentof the downward adjustment in UK terms has been lessened by a slide in the value of sterling against theUS dollar.
Table 19 Changes in feed costs in 2008
352007 Pig Cost of Production in Selected Countries BPEX November 2008
2007 Jan-08 Feb-08 Mar-08 Apr-08 May-08 Jun-08 Jul-08 Aug-08 Sep-08 Sep-08compared with 2007
Weighted average feed prices (€/tonne)Austria 220.3 na 268.2 270.3 276.1 281.9 288.4 288.4 253.7 219.0 -1
Belgium 232.4 274.4 281.0 281.0 286.0 286.0 281.3 276.8 276.8 269.8 +16
Brazil 214.3 261.0 261.0 253.1 243.8 264.0 278.9 292.4 294.7 273.7 +28
Canada 208.1 226.1 248.8 233.2 230.2 na 225.1 240.9 na 231.1 +11
Denmark 206.6 274.9 294.6 294.6 294.6 294.6 283.8 283.8 283.8 263.3 +27
France 207.2 279.6 280.6 283.8 279.6 277.4 273.0 266.6 260.2 249.5 +20
Germany 200.3 277.8 283.5 286.4 286.7 283.3 280.3 276.5 258.8 249.5 +25
GB 235.1 282.6 267.7 271.9 283.5 289.2 290.8 289.1 278.1 256.7 +9
Ireland 255.1 298.2 298.2 299.9 302.8 302.1 306.2 305.8 302.4 292.9 +15
Italy 227.4 na 268.8 na na 260.3 269.6 na na na na
Netherlands 215.5 260.5 265.7 269.0 272.9 274.1 274.3 274.2 271.4 263.8 +22
Spain 246.9 287.3 283.0 283.3 289.5 286.1 288.1 295.1 280.7 278.0 +13
Sweden 201.9 260.5 265.2 270.2 na na na na na na na
Average 220.9 271.2 274.3 274.7 276.9 281.7 278.3 280.9 276.0 258.8 +17
Weighted average feed prices (£/tonne)Austria 150.8 na 201.4 209.5 219.5 223.1 228.2 228.5 201.1 174.7 +16
Belgium 159.1 205.1 211.1 217.8 227.4 226.4 222.6 219.3 219.4 215.2 +35
Brazil 146.7 195.0 196.0 196.2 193.8 209.0 220.7 231.7 233.6 218.3 +49
Canada 142.4 169.0 186.9 180.8 183.0 na 178.1 190.8 na 184.3 +29
Denmark 141.4 205.5 221.3 228.3 234.2 233.2 224.6 224.9 225.0 210.0 +49
France 141.8 208.9 210.8 220.0 222.2 219.6 216.1 211.3 206.3 199.0 +40
Germany 137.1 207.6 213.0 222.0 227.9 224.2 221.8 219.1 205.2 199.0 +45
GB 160.9 211.2 201.1 210.7 225.4 228.9 230.1 229.1 220.5 204.8 +27
Ireland 174.6 222.8 224.0 232.5 240.8 239.1 242.3 242.3 239.7 233.6 +34
Italy 155.7 na 201.9 na na 206.0 213.3 na na na na
Netherlands 147.5 194.7 199.6 208.5 217.0 216.9 217.1 217.3 215.1 210.5 +43
Spain 169.0 214.7 212.6 219.6 230.1 226.4 228.0 233.9 222.5 221.8 +31
Sweden 138.2 194.7 199.2 209.5 na na na na na na na
Average 151.2 202.7 206.1 213.0 220.1 223.0 220.2 222.6 218.8 206.5 +37
20131_book.qxd:Layout 1 1/12/08 11:00 Page 35

36
Compound feed prices, on which Table 19 is based, will not necessarily change as quickly as spot rawingredient prices. This is because manufacturers would have bought cover forwards a few months and ina weakening market this is likely to have been at higher prices. Average feed prices in most InterPIGcountries began to decline in the April-July period, although in September 2008 they were still higher thanthe 2007 average. In sterling terms, feed prices in September were on average 37 per cent more than inthe 2007 year, but due to the depreciation of sterling, they were just 17 per cent higher in Euro terms. Theexchange rate factor means that the increase in GB feed prices (in sterling terms) of 27 per cent is wellbelow the overall increase.
Total production costs
The estimates of total production costs in Table 20 are based on the changes in feed costs only, with allother factors being held constant. In reality, of course, there will be other changes affecting productioncosts. In the first half of 2008, for example, there were rising fuel and energy prices, although these havebeen falling in the second half of the year. However, the dominance of feed in the cost of producing pigmeat means that these other factors are likely to be dwarfed by the effects of feed price changes.
Consequently, the pattern of changes in total production costs mirrors the changes in feed prices. Averagetotal production costs peaked in May 2008, at 31 per cent above the 2007 average, but have since fallenback. In September 2008, average production costs were 23 per cent higher than in 2007 in sterling termsalthough only six per cent higher in Euro terms. The lower value of sterling against the Euro has improvedthe relative competitiveness of British pigs; in September 2008, production costs were below German costsand only slightly higher than in Ireland.
Table 20 Changes in total production costs in 2008
2007 Pig Cost of Production in Selected Countries BPEX November 2008
2007 Jan-08 Feb-08 Mar-08 Apr-08 May-08 Jun-08 Jul-08 Aug-08 Sep-08 Sep-08compared with 2007
Pigmeat production costs (Euro cents/kg)Austria 165.8 na 189.7 190.5 192.7 194.9 191.9 191.9 178.6 165.3 0Belgium 152.1 156.1 158.5 158.5 160.4 160.3 168.1 166.4 168.5 165.9 +9Brazil 109.7 121.0 121.0 117.9 114.3 122.0 127.8 132.3 140.3 132.3 +21Canada 117.9 126.4 135.2 129.1 128.0 na 123.9 129.6 na 126.1 +7Denmark 140.0 173.2 180.7 180.7 180.7 180.6 169.0 169.0 169.0 161.3 +15France 151.0 178.2 178.6 179.9 178.2 177.2 176.5 174.0 na 167.4 +11Germany 159.7 191.5 193.8 195.0 195.1 193.5 190.7 189.2 182.3 178.7 +12GB 177.8 189.4 183.1 182.4 185.2 187.8 187.5 186.8 182.5 174.4 -2Ireland 159.3 176.7 176.7 177.4 178.5 178.1 178.0 177.9 176.6 173.1 +9Italy 183.7 na 227.6 na na 222.4 204.7 na na na naNetherlands 146.0 158.5 160.5 161.7 163.1 163.4 167.2 167.2 166.2 163.4 +12Spain 157.1 173.6 171.8 172.0 174.5 173.1 174.0 176.9 171.0 169.9 +8Sweden 169.3 189.9 191.7 193.8 194.2 na na na na na naAverage 153.0 166.8 174.5 169.9 170.4 177.6 171.6 169.2 170.6 161.6 +6
Pigmeat production costs (p/kg)Austria 113.5 na 142.5 147.7 153.2 154.3 151.9 152.1 141.6 131.9 +16Belgium 104.1 116.7 119.1 122.9 127.5 126.8 133.0 131.8 133.6 132.3 +27Brazil 75.1 90.4 90.9 91.4 90.9 96.6 101.1 104.9 111.2 105.5 +41Canada 80.7 94.4 101.6 100.1 101.7 na 98.1 102.7 na 100.6 +25Denmark 95.9 129.5 135.7 140.1 143.7 142.9 133.7 133.9 134.0 128.7 +34France 103.4 133.2 134.2 139.5 141.7 140.3 139.6 137.9 na 133.5 +29Germany 109.3 143.1 145.6 151.1 155.1 153.1 150.9 149.9 144.6 142.6 +30GB 121.7 141.6 137.5 141.4 147.2 148.6 148.4 148.0 144.7 139.1 +14Ireland 109.1 132.1 132.8 137.5 141.9 141.0 140.9 141.0 140.0 138.1 +27Italy 125.7 na 170.9 na na 176.1 162.0 na na na naNetherlands 100.0 118.5 120.5 125.3 129.7 129.3 132.3 132.5 131.7 130.4 +30Spain 107.5 129.7 129.1 133.3 138.7 137.0 137.7 140.2 135.5 135.5 +26Sweden 115.9 141.9 144.0 150.2 154.3 na na na na na naAverage 104.7 124.6 131.1 131.7 135.5 140.5 135.8 134.1 135.2 128.9 +23
20131_book.qxd:Layout 1 1/12/08 11:00 Page 36

37
Net margins in Great Britain
During the first five months of 2008, British pig producers were losing on average between £20 and £25per pig. But since then there has been a significant improvement. At the same time that costs of productionhave been increasing, producer prices have risen to their highest in 11 years – due to a number of factorsincluding lower domestic production, cutbacks in Continental supplies and higher import prices.Consequently, by September 2008, the estimated loss per pig had fallen to £3.
The final quarter of 2008 should see a move into profitability, as compound feed prices follow raw ingredi-ent prices lower.
These estimates should only be regarded as indicative of general trends. They are based on spot com-pound prices, but there are many different ways in which pig producers can source their feed supplies.They may buy spot, they may buy on contract, they may buy straights and do home milling and mixing, orthey may buy manufactured compound feeds. And if they buy on contract, the timing of the contract andits length will also affect their production costs.
So producers who took out forward contracts at higher prices earlier in 2008, are likely to have higher pro-duction costs than indicated in this chapter, until their contracts come up for renewal.
Figure 14 Estimated net margins in Great Britain
+5
+0
-5
-10
-15
-20
-25
-30
2003 2004 2005 2006 Jan-08 Feb-08 Mar-08 Apr-08 May-08 Jun-08 Jul-08 Aug-08 Sep-082007
£/head Net margins
-£5
-£11
-£25
-£20-£21
-£23
-£20
-£15
-£10
-£7
-£3
-£0
-£3
2007 Pig Cost of Production in Selected Countries BPEX November 2008
20131_book.qxd:Layout 1 1/12/08 11:00 Page 37

38
APPENDIX l
European pig industry trends in 2007
AUS BEL DEN FR UK GER IRE IT NL POL SP SWE
Breeding sow 230 526 1,090 1,106 453 2,130 143 691 915 1,528 2,497 146
numbers
(000 head)
Annual pig 5,599 11,370 21,385 25,730 9,484 53,311 2,615 13,596 14,187 24,744 42,151 3,004
slaughterings
(000 head)
Pig meat 531 1,073 1,802 2,281 739 4,985 205 1,603 1,290 2,091 3,513 265
production
(000 tonnes)
Pig meat 157 96 86 570 911 1,111 109 975 480 238 122 101
imports (000
tonnes cwe)*
Pig meat 167 649 1,630 620 133 1,568 120 138 798 260 700 30
exports (000
tonnes cwe)*
Pig meat 521 521 258 2,231 1,517 4,528 194 2,440 972 2,069 2,936 335
consumption
(000 tonnes
cwe)*
Pig meat 62.3 47.5 47.3 36.2 25.0 54.8 45.2 41.4 59.1 54.3 66.0 36.8
consumption
(kg/head)*
* Estimated figures for 2007
All figures are subject to revision
Source: AHDB Meat Services, Eurostat
2007 Pig Cost of Production in Selected Countries BPEX November 2008
20131_book.qxd:Layout 1 1/12/08 11:00 Page 38

39
APPENDIX II
European feed price trends
Delivered prices: France
60
80
100
120
140
160
180
200
Jan-04 Jul-04 Jan-05 Jul-05 Jan-06 Jul-06 Jan-07 Jul-07 Jan-08 Jul-08
Feed barley
Delivered prices: Germany
60
80
100
120
140
160
180
200
Jan-04 Jul-04 Jan-05 Jul-05 Jan-06 Jul-06 Jan-07 Jul-07 Jan-08 Jul-08
Feed barley Feed wheat
Delivered prices: Netherlands
60
80
100
120
140
160
180
200
Jan-04 Jul-04 Jan-05 Jul-05 Jan-06 Jul-06 Jan-07 Jul-07 Jan-08 Jul-08
Feed barley Feed wheat
Delivered prices: Spain
60
80
100
120
140
160
180
200
Jan-04 Jul-04 Jan-05 Jul-05 Jan-06 Jul-06 Jan-07 Jul-07 Jan-08 Jul-08
Feed barley
Delivered prices: United Kingdom
60
80
100
120
140
160
180
200
Jan-04 Jul-04 Jan-05 Jul-05 Jan-06 Jul-06 Jan-07 Jul-07 Jan-08 Jul-08
Feed barley Feed wheat
Feed ingredient prices: United Kingdom
6080
100120140160180200220240260280300320340360
Jan-04 Jul-04 Dec-04 Jul-05 Jun-06 Jun-07 Jun-08
Soya Rapemeal Citrus pulp Sunflowermeal
2007 Pig Cost of Production in Selected Countries BPEX November 2008
20131_book.qxd:Layout 1 1/12/08 11:00 Page 39

40
APPENDIX III
National carcase dressing specifications
country Presentation of the carcass payment
Denmark with head and feet, without flare fat, kidneys hotand trimmings
Belgium without head and feet, without flare fat, kidneys hot -2%and trimmings
France with head (including eyes, ear and tongue), coldwith hooves and tail, without kidneys,
diaphragm and flare fat
Netherlands with the head and the feet (without nails), hotwithout flarefat, kidneys and trimmings
UK with head, feet and tail but without flare fat, cold
Czech Republic kidneys and diaphragm hotwith the head, flare fat, skin,without brain, kidneys and organs ind breast, abdomen
and pelvic cavity
Germany without reproductive organs, tongue, spinal cord, hotlard, kidneys, diaphragm, brain, and the organs of
thoracic cavity and abdominal cavity
Sweden with the head, feet and tail. No intestines of any kind. cold No flare fat.
Ireland REMOVED : Oesophagus, stomach, intestines, spleen, coldbladder,heart,liver, lungs,testicles,hair,neck
glands,fatty tissue, blood,flare fat,kidneys and diaphragm
Austria without reproductive organs, tongue, spinal cord, hot lard, kidneys, diaphragm, brain, and the organs of thoracic cavity and abdominal cavity,with the head
and the feet (without nails)
2007 Pig Cost of Production in Selected Countries BPEX November 2008
20131_book.qxd:Layout 1 1/12/08 11:00 Page 40

41
APPENDIX IV
Quarterly key performance indicators
Key Performance Indicators: pigs born/ sow
22
23
24
25
26
27
28Average Top-third
Average 23.86 24.19 23.92 23.83 24.15 23.94 24.02 24.19 24.22 24.30 24.35 24.39 23.54 23.73
Top-third 25.68 26.03 25.79 25.40 26.30 26.26 26.66 27.05 27.04 27.34 27.86 27.02 26.70 26.47
Q1 Q2 Q3 Q4 Q1 Q2 Q3 Q4 Q1 Q2 Q3 Q4 Q1 Q2
2005 2005 2005 2005 2006 2006 2006 2006 2007 2007 2007 2007 2008 2008
Key Performance Indicators: pigs weaned/ sow
19
20
21
22
23
24
25Average Top-third
Average 21.35 21.66 21.36 21.25 21.41 21.27 21.33 21.44 21.47 21.54 21.70 21.69 21.01 21.22
Top-third 23.19 23.64 23.33 22.98 23.44 23.38 23.54 23.86 23.91 24.17 24.67 24.15 24.07 23.92
Q1 Q2 Q3 Q4 Q1 Q2 Q3 Q4 Q1 Q2 Q3 Q4 Q1 Q2
2005 2005 2005 2005 2006 2006 2006 2006 2007 2007 2007 2007 2008 2008
Key Performance Indicators: pigs finished/ sow
17
18
19
20
21
22
23
24Average Top-third
Average 19.49 19.86 19.48 19.50 19.71 19.66 19.70 19.79 19.89 19.97 20.31 20.24 19.66 19.74
Top-third 21.41 21.88 21.59 21.24 21.76 21.72 21.85 22.40 22.52 22.60 23.43 22.91 22.65 22.69
Q1 Q2 Q3 Q4 Q1 Q2 Q3 Q4 Q1 Q2 Q3 Q4 Q1 Q2
2005 2005 2005 2005 2006 2006 2006 2006 2007 2007 2007 2007 2008 2008
Key Performance Indicators: litters/ sow
2.00
2.05
2.10
2.15
2.20
2.25
2.30
2.35
2.40Average Top-third
Average 2.20 2.22 2.20 2.19 2.21 2.18 2.18 2.19 2.17 2.18 2.19 2.19 2.12 2.13
Top-third 2.28 2.30 2.27 2.24 2.32 2.28 2.28 2.31 2.29 2.32 2.36 2.31 2.27 2.27
Q1 Q2 Q3 Q4 Q1 Q2 Q3 Q4 Q1 Q2 Q3 Q4 Q1 Q2
2005 2005 2005 2005 2006 2006 2006 2006 2007 2007 2007 2007 2008 2008
Key Performance Indicators: daily liveweight gain
500
540
580
620
660
700
740
780Average Top-third
Average 644 654 620 646 657 655 652 653 655 653 674 659 671 657
Top-third 684 687 699 710 712 706 707 711 731 703 752 746 722 727
Q1 Q2 Q3 Q4 Q1 Q2 Q3 Q4 Q1 Q2 Q3 Q4 Q1 Q2
2005 2005 2005 2005 2006 2006 2006 2006 2007 2007 2007 2007 2008 2008
Key Performance Indicators: pre-weaning mortality
6
7
8
9
10
11
12
13Average Top-third*
Average 10.5 10.5 10.7 10.8 11.6 11.1 11.1 11.3 11.3 11.4 10.9 11.0 10.7 10.5
Top-third* 9.7 9.2 9.6 9.5 11.4 10.9 11.7 11.8 11.5 11.5 11.4 10.4 9.9 9.6
Q1 Q2 Q3 Q4 Q1 Q2 Q3 Q4 Q1 Q2 Q3 Q4 Q1 Q2
2005 2005 2005 2005 2006 2006 2006 2006 2007 2007 2007 2007 2008 2008
Key Performance Indicators: post-weaning mortality
4
5
6
7
8
9
10Average Top-third*
Average 8.7 8.3 8.8 8.2 7.9 7.6 7.7 7.7 7.4 7.3 6.4 6.7 6.4 7.0
Top-third* 7.7 7.5 7.5 7.6 7.2 7.1 7.2 6.1 5.8 6.5 5.0 5.1 5.9 5.1
Q1 Q2 Q3 Q4 Q1 Q2 Q3 Q4 Q1 Q2 Q3 Q4 Q1 Q2
2005 2005 2005 2005 2006 2006 2006 2006 2007 2007 2007 2007 2008 2008
2007 Pig Cost of Production in Selected Countries BPEX November 2008
20131_book.qxd:Layout 1 1/12/08 11:00 Page 41

42
APPENDIX V
List of tables and charts
PageTable 1 Average Costs of Production, 2003-2007 (p/kg dw) 7Table 2 Ranking of EU production costs, 2003-2007 8Table 3 Annual Exchange Rates 9Table 4 Cash costs of production in 2007 10Table 5 Summary of Financial Performance, 2007 11Table 6 Feed Prices and Energy Content 14Table 7 Labour Costs in 2007 (p/kg dw) 16Table 8 Analysis of building, finance and miscellaneous costs in 2007 17Table 9 Summary of Financial Performance 2003 – 2007 18Table 10 Summary of Physical Performance, 2007 19Table 11 Post-weaning Mortality, 2003 – 2007 21Table 12 Summary of Physical Performance 2003 – 2007 25/26Table 13 GB and EU physical results 29Table 14 Impact of changes in performance on production costs 30Table 15 Selected results from the Reference Prices questionnaire 31Table 16 Deductions from quoted pig prices 32Table 17 Additions to quoted pig prices 33Table 18 Adjustments to reference prices 33Table 19 Changes in feed costs in 2008 35Table 20 Changes in total production costs in 2008 36
Figure 1 Cost of production in selected countries, 2007 6Figure 2 Exchange Rate Movements, 2003-2008 9Figure 3 Changes in Feed Costs, 2007 (costs per kg of pig meat) 12Figure 4 Feed Costs in 2007 13Figure 5 Building, Finance and Miscellaneous Costs, 2007 16Figure 6 Pigs Weaned per Sow per Year, 2006 – 2007 20Figure 7 Pigs Finished per Sow per Year, 2006 – 2007 21Figure 8 Daily Liveweight Gains (Finishing Herds) 2006 – 2007 22Figure 9 Feed Conversion Ratios (finishing herds), 2006 – 2007 23Figure 10 Carcase meat production per sow/year 24Figure 11 Standardised daily liveweight gains (finishing herds), 2007 27Figure 12 Standardised feed conversion ratios, 2007 28Figure 13 Adjusted reference prices 34Figure 14 Estimated net margins in Great Britain 37
2007 Pig Cost of Production in Selected Countries BPEX November 2008
20131_book.qxd:Layout 1 1/12/08 11:00 Page 42

20131_book.qxd:Layout 1 1/12/08 11:00 Page 43

20131_book.qxd:Layout 1 1/12/08 11:00 Page 44

20131_book.qxd:Layout 1 1/12/08 11:00 Page 45

BPEX Ltd • AHDB Meat ServicesPO Box 44,Winterhill House, Snowdon Drive, Milton Keynes MK6 1AX
Telephone: 01908 844368 •Website: www.bpex.org.ukDecember 2008
LOOK FORTHE MARK OFDISTINCTION
All pork, bacon, ham and sausages that carrythe Quality Standard Mark come from farmersand processors committed to high standards ofanimal welfare, quality control and traceability.The productionchain is independently auditedto ensure compliance with these standards.
LOOK FORTHE MARK OFDISTINCTION
All pork, bacon, ham and sausages that carrythe Quality Standard Mark come from farmersand processors committed to high standards ofanimal welfare, quality control and traceability.The productionchain is independently auditedto ensure compliance with these standards.
20131_cover:cover 1/12/08 11:05 Page 2