200709 - 2crsi - presentation - resultats estimes 2019-20
TRANSCRIPT

INVESTOR
PRESENTATION
H1 2020/2021
1st December 2020

Highlights H1 20/21
Investor presentation H1 2020/2021 - 1 December 2020
H1 revenue of €78.5m1
EBITDA of €1.1m reflecting COVID-related increase in
procurement costs and investments in staff
Steady progress in all strategic priorities
Integration of Boston Limited on track
Solid H2 sales momentum, full-year guidance confirmed
2
1 Due to the integration of the company Boston Ltd, for which first-half data was not hitherto available, and the alignment of the dates of 2CRSi and Boston's fiscal years, i.e. from 1 March to 28 February (FY19/20 thus lasted for 14 months, from 1 January 2019 to 29 February 2020), comparable data for the first half of 2020/21 is not available.. On a reported basis, revenue for H1 2019 (1 Jan 2019 – 30 Jun 2019), prior to the acquisition of Boston Ltd, was €21.5m.

I. ProfileAn established technology value proposition and a favorable
niche market positioning
II. Focus on Tranquil & BostonA successful integration as key contributors to the Group’s
growth
III. Advances on our 3 strategic prioritiesStrong drivers of long-term growth
IV. Financial highlightsH1 2020/2021 financial results
V. Outlook

Our core business
ISP –Web Hosting
DatacentersScientific Research
Education
Industry
Defence Governments
Local authorities
Design, manufacture and sell customised,
environment-friendly high performance IT servers
…for a diverse range of sectors and ‘’critical” needs
Software
developers
Processing Storage
Deep LearningHPC - AI – Special effects (VFX) Cloud
SAN/NAS/Object
….
5
Network
Investor presentation H1 2020/2021 - 1 December 2020

Innovation is in our DNA
2014
HEXAPHIThe best density/
computing speed
2015
OpenBLADEHyperconverged
2019/2020
ENERGY RECYCLING
(heat re-used))
Server power
consumption reduced
by 23%
OCtoPusReduced consumption
2017
ATLANTISImmersion cooling for 19‘’
servers
OPEX -60%
2018
DIRECT LIQUID COOLINGLiquid contact cooling
2019/2020
SERVICESEfficient datacenters, processing
power rental
Fatal heat re-use
system
6
Investor presentation H1 2020/2021 - 1 December 2020

A wide range covering 80% of market needs
Hyperscalers
Large Corporates
Mid-sizedco.
SMEs
Industries
Ulys 460
Ulys SAN
Ulys S24HA
Ulys S24
Ulys 1.10
NUC+HDD
Storage
OCtoPus 1.4OCtoPus 3
Godί
Mini Rugged
Computer
Ultra Slim
Cloe 4SP
Process / Compute Hyperconvergence
OpenBlade OpenBlade 20
OCtoPus 4/5/8
Micro Cluster
OCtoPus 3BD
7Investor presentation H1 2020/2021 - 1 December 2020

High-value solutions to capture sizable market
opportunities
8Investor presentation H1 2020/2021 - 1 December 2020
GREEN ITReducing the carbon footprint of investments and
operating costs
CUSTOMISEDOptimised products, tailored solutions
Use-based invoicing (buy or lease)
HIGH PERFORMANCEPower, speed, energy savings
OPERATIONAL AGILITYSpecific resources allocated to each project
SMART DESIGNSSimple, flexible and scalable designs
$87.1bn(2019)
Growth drivers:
• Big data, blockchain, IoT,
cloud services, cloud
gaming, AI
• Shifting infrastructure needs
caused by global pandemic
Source: IDC, Worldwide Quarterly Server Tracker, 2Q20

Value-added integration and
distribution
Complementary coverage of the entire value chain
Design and manufacturing of
innovative and green IT
solutions
Design and manufacturing of rugged and
green edge computing systems
Housing and hosting energy efficient
high perfomance computeIT consulting services and
complete solution
DESIGN AND MANUFACTURING VALUE-ADDED DISTRIBUTIONCONSULTING
TURN KEY IT SOLUTIONSHOUSING AND HOSTING
SERVICES
IT solutions for computer graphics
and visual effects
9
Investor presentation H1 2020/2021 - 1 December 2020

Worldwide presence achieved
10
Investor presentation H1 2020/2021 - 1 December 2020
350 employees
21 offices
6 production sites

I. ProfileAn established technology value proposition and a favorable
niche market positioning
II. Focus on Tranquil & BostonA successful integration as key contributors to the Group’s
growth
III. Advances on our 3 strategic prioritiesStrong drivers of long-term growth
IV. Financial highlightsH1 2020/2021 financial results
V. Outlook

Rebranding of Tranquil
12
Investor presentation H1 2020/2021 - 1 December 2020
• Repositioning of Tranquil as a premium brand
• Rugged, fanless, low-energy IT systems for the world’s harshest environments: All Terrain IT

Tranquil: a success story
Tranquil revenue (in £m)
13
Investor presentation H1 2020/2021 - 1 December 2020
Continued growth
• Driven by OEM clients, maritime, and digital signage
• Expected acceleration in H2
• Production capacity significantly increased
1.2
1.0
1.3
1.1
FY17/18 FY18/19 FY19/20 H1 20/21
Increased commercial effort
• Product & sales training
• Reviewed pricing policy
• Integration in distribution network

Boston Ltd: integration progress in line with plan
14
Investor presentation H1 2020/2021 - 1 December 2020
Sales training
• Completed in Aug 2020
Consolidation of key suppliers
Alignment of corporate
support functions
• Almost achieved
Synergies through
• Increased purchase
volumes
• Shared marketing &
central costs
• Complementary
product range
Joint sales opportunities

15
Investor presentation H1 2020/2021 - 1 December 2020
Key Segments
Partnership
AI Solutions Major Lines of
Businesses
Achievements
AI & Data
Science training
CoE
establishments Custom
design
Centre of Excellence AI Corporate Training Program Academic TrainingProgram
AI and Data Science Advisory Services
• Set-up of AI labs• AI training and project
enablement• Govt. initiatives• Standardized AI best
practices
• 21 set courses• Customized courses• Leadership workshops• One stop solutions for AI
projects• AI Sales Courses
• Certificate courses• Industry collaboration• Customized workshops and
online courses• Capstone projects
• AI strategy development• AI solutions• AI as a service• Algo co-development
Sales skill
development
18 MoU’s signed
10 more in pipe
Over 2000
delegates trained
Brand recognised by
educational institutes
High margin
revenue over $110,000
Key industry
partners for AI
Boston Training Academy

I. ProfileAn established technology value proposition and a favorable
niche market positioning
II. Focus on Tranquil & BostonA successful integration as key contributors to the Group’s
growth
III. Advances on our 3 strategic prioritiesStrong drivers of long-term growth
IV. Financial highlightsH1 2020/2021 financial results
V. Outlook

Progress across our 3 strategic priorities
1
Broaden international
reachBoost sales momentum
Diversify customerportfolio
3
17
2
Investor presentation H1 2020/2021 - 1 December 2020

COVID-19 boosts investments in cloud and gaming
1
Boost sales momentum
18
Confirmation of the Blade order – c. €25m
• April 2020
• Cloud PC
• c. 40% recognised in H1, remainder expected in H2
Linkoffice – c. €6.5m
• May 2020
• Virtual Desktop Infrastructure
• c. €0.8m recognised in H1, c. €1.6m expected in FY20/21
Solid pipeline development in other segments
Investor presentation H1 2020/2021 - 1 December 2020

Client diversification continues in H1
2
19
Decreased client revenue concentration
Diversifycustomerportfolio
Top 144%
Top 1072%
H1 2019
Top 113%
Top 1049%
H1 2020/21
Industry 20%
Cloud 11%
Oil & Gas 9%
Defense 9%HPC 6%
Healthcare5%
Distribution
Telecom 4%
Automotive 4%
AI 3%Finance 2%
Research 1%
Others 21%
FY 2019/20
Sector
breakdown
Investor presentation H1 2020/2021 - 1 December 2020
Historical scopeTotal: €21.5m Total: €141.1m

International coverage keeps expanding further
3
20
2 new subsidiaries opened
• Singapore
• The Netherlands
Appointment of Wally Liaw to oversee US & Eastern Asia
Broaden international
reach
France 41%
Other Europe 18%Middle-East 2%
Asia 6%
USA 33%
H1 2019
France 14%
UK 44%Germany13%
NL 3%
Other Europe 5%
Russia 6%
Asia 3%
USA 11%Others 1%
H1 2020/21
Investor presentation H1 2020/2021 - 1 December 2020
Historical scopeTotal: €24.5m Total: €78.5m

I. ProfileAn established technology value proposition and a favorable
niche market positioning
II. Focus on Tranquil & BostonA successful integration as key contributors to the Group’s
growth
III. Advances on our 3 strategic prioritiesStrong drivers of long-term growth
IV. Financial highlightsH1 2020/2021 financial results
V. Outlook

H1 Revenue: a satisfactory first half
Entity2CRSi
(historical scope)Boston Limited
2CRSi(consolidated)
2CRSi(consolidated)
PeriodMar 1, 2020 –
Aug 31, 2020
Mar 1, 2020 –
Aug 31, 2020
Mar 1, 2020 –
Aug 31, 2020
Mar 1, 2019 –
Feb 29, 2020
Duration 6 months 6 months 6 months 12 months
Consolidated
revenue(in million euros)
24.5 53.9 78.5 141.1
Published data pro forma data
Only 40% of the Blade order (for a total amount of c. €25m) have
been recognised as revenue in H1
22
Investor presentation H1 2020/2021 - 1 December 2020
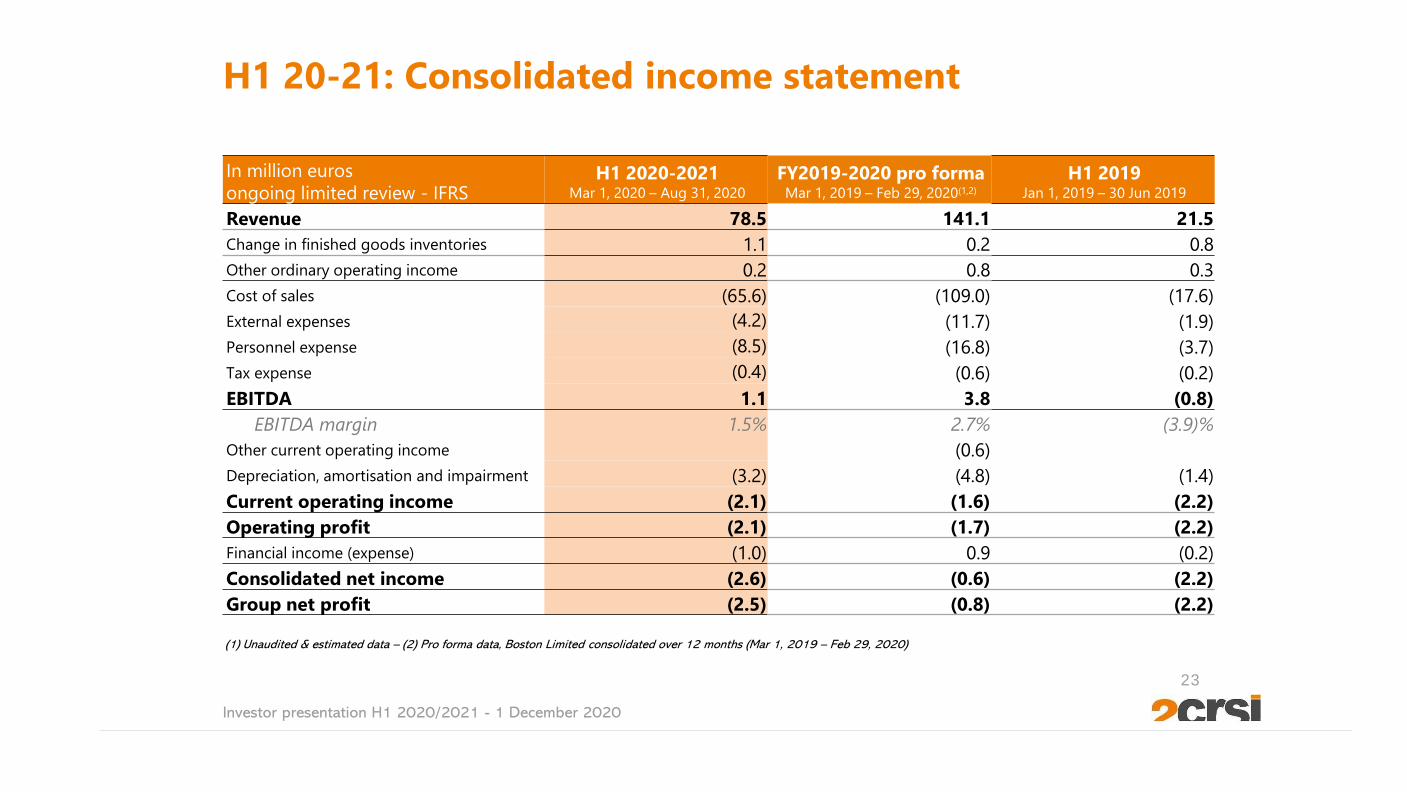
H1 20-21: Consolidated income statement
(1) Unaudited & estimated data – (2) Pro forma data, Boston Limited consolidated over 12 months (Mar 1, 2019 – Feb 29, 2020)
In million euros
ongoing limited review - IFRSH1 2020-2021
Mar 1, 2020 – Aug 31, 2020
FY2019-2020 pro formaMar 1, 2019 – Feb 29, 2020(1,2)
H1 2019Jan 1, 2019 – 30 Jun 2019
Revenue 78.5 141.1 21.5
Change in finished goods inventories 1.1 0.2 0.8
Other ordinary operating income 0.2 0.8 0.3
Cost of sales (65.6) (109.0) (17.6)
External expenses (4.2) (11.7) (1.9)
Personnel expense (8.5) (16.8) (3.7)
Tax expense (0.4) (0.6) (0.2)
EBITDA 1.1 3.8 (0.8)
EBITDA margin 1.5% 2.7% (3.9)%
Other current operating income (0.6)
Depreciation, amortisation and impairment (3.2) (4.8) (1.4)
Current operating income (2.1) (1.6) (2.2)
Operating profit (2.1) (1.7) (2.2)
Financial income (expense) (1.0) 0.9 (0.2)
Consolidated net income (2.6) (0.6) (2.2)
Group net profit (2.5) (0.8) (2.2)
23
Investor presentation H1 2020/2021 - 1 December 2020

H1 20-21: Balance sheet - Assets
In million euros
ongoing limited review – IFRSAug 31, 2020 Feb 29, 2020
Goodwill 6.7 7.1
Intangible assets 15.5 15.8
Tangible assets* 22.1 23.6
Non-current financial receivables 15.1 10.9
Other non-current assets 4.7 4.0
Total non-current assets 64.1 61.4
Inventory 38.9 34.5
Receivables 22.7 21.8
Other current assets 11.4 17.8
Current financial receivables 11.6 11.8
Cash & cash equivalents 5.3 10.2
Total current assets 89.9 96.1
TOTAL ASSETS 153.9 157.5
* Including items related to rights of use (IFRS 16)
24
Investor presentation H1 2020/2021 - 1 December 2020

H1 20-21: Balance sheet - Liabilities
In million euros
ongoing limited review - IFRSAug 31, 2020 Feb 29, 2020
Group equity 43.5 47.2
Minority interests (0.2) (0.1)
Conslidated equity 43.3 47.1
Non-current financial debt (including lease liabilities) 52.6 53.0
Other non-current liabilities 3.2 3.5
Total non-current liabilities 55.7 56.5
Payables 22.3 20.3
Current financial debt (including lease liabilities) 16.9 16.6
Other current liabilities 15.7 17.0
Total current liabilities 54.9 53.9
TOTAL LIABILITIES 153.9 157.5
25
Investor presentation H1 2020/2021 - 1 December 2020

I. ProfileAn established technology value proposition and a favorable
niche market positioning
II. Focus on Tranquil & BostonA successful integration as key contributors to the Group’s
growth
III. Advances on our 3 strategic prioritiesStrong drivers of long-term growth
IV. Financial highlightsH1 2020/2021 financial results
V. Outlook

2 factors driving sales momentum in H2 and beyond
INTENSIFICATION OF SALES EFFORTS IN 5 KEY VERTICALS
EntertainmentFinance
Internet Service
Provider, Cloud, 5G IndustriesDefence &
security
27
+Impact
COVID +Impact
COVID
Investor presentation H1 2020/2021 - 1 December 2020
FIRST IMPACT OF COMMERCIAL INTEGRATION OF BOSTON

Already resulting in 2 recent major wins
28
Investor presentation H1 2020/2021 - 1 December 2020
New contract with OVH in Asia
• Servers for OVH’s Public Cloud offer in
Singapore & Australia
• Deployment to start in December 2020
New Top10 client: go2cloud
• Additional capacity for go2cloud HPCaaS in
Europe & in the Middle-East
• Completion expected by the end of 2020

FY20-21 objectives confirmed
FY20-21 objectives
29
▪ Strong revenue growth
▪ Improvement in profitability
Investor presentation H1 2020/2021 - 1 December 2020
€77.8m
€170-200m

Q&A

THANK YOU!