2007 seymour isoneworld-erp
TRANSCRIPT

7/31/2019 2007 Seymour Isoneworld-erp
http://slidepdf.com/reader/full/2007-seymour-isoneworld-erp 1/22
In Proceedings of the 6 th Annual ISOnEworld Conference, April 11-13, 2007, Las Vegas, NV
www.isoneworld.org
End-Users’ Acceptance of Enterprise Resource Planning Systems: An Investigation of Antecedents
Lisa Seymour, Wadzanai Makanya, Simon Berrangé
University of Cape Town, South Africa
Abstract
Businesses that are implementing Enterprise Resource Planning (ERP) systems are becoming more concerned with, and realising the importance of, end-user acceptance, akey success factor of ERP implementations (Tchokogué, Bareil & Duguay, 2005, Calisir & Calisir, 2004). Previous research concerning ERP acceptance has been based on the
popular Technology Acceptance Model first proposed by Davis (1989). Criticism againstapplying the Technology Acceptance Model (TAM) to examine ERP acceptance is thatthe use of an ERP is mandatory while an implicit assumption of TAM is that users of theinformation systems have some level of choice with regard to the extent that they use thetechnology.
This research paper aims to investigate the factors that affect end-user acceptance of ERPsystems and is primarily based on the Unified Theory of Acceptance and Use of Technology (UTAUT) first proposed by Venkatesh, Morris, Davis and Davis (2003).UTAUT is considered as an improvement on the TAM models when evaluating end-user acceptance of ERP systems because it purports to consider the mandatory nature of ERPsystems. This paper evaluates the factors that make up UTAUT and leads to the proposalof a research model that is an adjustment of UTAUT. The model contains the dependant
variable symbolic adoption that has been shown to better indicate end-user acceptance of mandatory technologies by Nah, Tan and Teh (2004). The research model is validatedthrough a 2006 survey of users of the PeopleSoft Student Administration System at theUniversity of Cape Town and subsequent quantitative analysis. The PeopleSoft system ismainly used for the maintenance of access to student related data and for student
processes such as registration and graduation.
The factors, performance expectancy ; effort expectancy; project communication; training and shared belief were all found to be antecedents to symbolic adoption and age wasfound to have a moderating influence on the relationships between:
• Effort expectancy and symbolic adoption .• Training and symbolic adoption .• Shared belief and symbolic adoption. • Project communication and symbolic adoption.
These findings should be of relevance to future researchers and to organisations thatintend installing ERP systems. It is hoped that practitioners pay attention to these factorsthat can influence end-user acceptance of a new ERP system.

7/31/2019 2007 Seymour Isoneworld-erp
http://slidepdf.com/reader/full/2007-seymour-isoneworld-erp 2/22
Pg 26-2
In Proceedings of the 6 th Annual ISOnEworld Conference, April 11-13, 2007, Las Vegas, NV
www.isoneworld.org
Keywords: enterprise system; ERP; performance expectancy ; effort expectancy; project communication; training; shared belief; social influence; symbolic adoption; user acceptance.
Introduction
Enterprise Resource Planning (ERP) systems are made up of a suite of integratedsoftware applications that are designed to support a business’ core functions (Aldwani,2001; Amaoko-Gyampah, 1999). ERP systems help organisations to reduce operatingcosts and improve business process management through integration of businessfunctions and information (Aldwani, 2001). Despite the advantages associated with ERPsystems, their adoption is often problematic (Amaoko-Gyampah, 1999). Approximately50% of all ERP implementations fail to meet the adopting organisations’ expectations(Jasperson, Carter & Zmud, 2005; Adam & O’Doherty, 2000). In an article entitled “ Howto Overcome the Most Dangerous Issues Facing Corporations Today”, the DAConsulting Group states that one of the major reasons why SAP implementations fail to
achieve the business goals intended is because many companies fail to address the user side of the equation (DA Consulting Group, 2006). Aldwani, (2001) identifies end-user resistance as one of the main contributing factors towards the failure of ERP adoption.The implementation of the ERP system may have been successful but end-users oftenonly make use of a subset of the available features (Boudreau, 2003; Ross & Weill, 2002;Jasperson et al., 2005; Yi, Wu & Tung, 2006). Wang and Liu (2005) identify end-users’attitude towards an information system, their acceptance of the system and the level of intended usage of the system as factors that directly impact its successful adoption.Examining these factors is therefore important in order for organisations to functioneffectively (Yi et al., 2006).
This research aimed to identify the factors that affect and are related to end-user acceptance of ERP Systems. The findings and conclusions of the research are relevant toorganisations that intend to or are installing ERP systems and to future researchers. Thisresearch paper reviews the most recent models used to measure end-users’ acceptance of mandatory information systems such as ERP systems. A research model is proposedusing factors identified in the literature review. A discussion of the researchmethodology, quantitative data analysis and results obtained then follows. The paper concludes with a validated model and proposes recommendations for future research
pertaining to end-user acceptance of ERP systems.
End-User’s acceptance of ERP systems
Many models to measure end-users’ acceptance of a new technology have been suggestedand from these, the Technology Acceptance Model (TAM) is the most predominantlycited and used model (Wang & Liu, 2005). TAM, represented in Figure 1, was introduced
by Davis (1989) and identifies the level of usage of an information system, (ActualSystem Use), as a superior indicator of the level of acceptance of the technology by end-users (Amaoko-Gyampah & Salam, 2004). Research has been performed using TAM to

7/31/2019 2007 Seymour Isoneworld-erp
http://slidepdf.com/reader/full/2007-seymour-isoneworld-erp 3/22
Pg 26-3
In Proceedings of the 6 th Annual ISOnEworld Conference, April 11-13, 2007, Las Vegas, NV
www.isoneworld.org
examine end-user acceptance of ERP systems such as that done by Brown, Massey,Montoya-Weiss and Burkman (2002) and by Venkatesh and Davis (2000).
Figure 1: Technology Acceptance Model (TAM) (Davis, 1993)
One of the assumptions of research performed using TAM is that usage of the technologyis voluntary. This assumption makes TAM unsuitable for evaluating ERP acceptance
because the usage of ERP systems is mandatory (Amaoko-Gyampah & Salam, 2004;Davis, 2004; Nah et al., 2004). Brown et al. (2002) found that using TAM to evaluateERP acceptance provides limited explanations of end-users’ behaviour, attitudes and
perceptions towards the system and that the results that were collected providedmisleading recommendations for organisations.
Venkatesh et al. (2003) proposed the Unified Theory of Acceptance and Use of Technology (UTAUT) represented in Figure 2 as an alternative to TAM. UTAUT is acombination of eight user acceptance models (including TAM) and is seen as animprovement to TAM. In contrast to TAM, UTAUT takes into account the fact that somesystems are mandatory and others voluntary and results obtained using this modelexplained end-users’ acceptance of a mandatory account management and accountingsystem more clearly than the results obtained using TAM (Venkatesh et al., 2003). For this reason the UTAUT model was used as the basis of our study.

7/31/2019 2007 Seymour Isoneworld-erp
http://slidepdf.com/reader/full/2007-seymour-isoneworld-erp 4/22
Pg 26-4
In Proceedings of the 6 th Annual ISOnEworld Conference, April 11-13, 2007, Las Vegas, NV
www.isoneworld.org
Figure 2: Unified Theory of Acceptance and Use of Technology (UTAUT)(Venkatesh et al., 2003)
Performance Expectancy and Perceived Usefulness
The performance expectancy factor identified in UTAUT was derived from the perceivedusefulness factor identified in TAM (Venkatesh et al., 2003). Venkatesh et al. (2003)
established that performance expectancy strongly influenced usage of ERP systems and perceived usefulness was found to be the best predictor of ERP end-user satisfaction byCalisir and Calisir (2004). Venkatesh et al. (2003, p447) describe performanceexpectancy as “the degree to which an individual believes that using the system will helphim or her to attain gains in job performance”. This definition is confirmed by Amaoko-Gyampah (2004) who found that end-users are more concerned with whether an ERPsystem can help them perform their daily job functions than with its capabilities tointegrate data. This is supported by Nah, Tan & Beethe (2005) who proposed “relativeadvantage” as being more accurate than perceived usefulness.
Effort Expectancy
Effort expectancy is defined as “the degree of ease associated with the use of the system”(Venkatesh et al., 2003, p450). Effort expectancy was derived from the perceived ease of use factor identified in TAM (Venkatesh et al., 2003). Venkatesh et al. (2003) found thateffort expectancy determined end-users’ intention to use an information system. Inagreement, Amaoko-Gyampah and Salam (2004) found in an ERP study, that perceivedease of use influenced behavioural intention to use the ERP system through influencing
perceived usefulness.

7/31/2019 2007 Seymour Isoneworld-erp
http://slidepdf.com/reader/full/2007-seymour-isoneworld-erp 5/22
Pg 26-5
In Proceedings of the 6 th Annual ISOnEworld Conference, April 11-13, 2007, Las Vegas, NV
www.isoneworld.org
Social Influence
Social influence is defined as the degree to which an individual perceives that others believe he or she should use the new system (Venkatesh et al., 2003). There is strong
evidence that the attitudes and behaviours of other individuals in a user’s social and work circles significantly impacts the user’s actions regarding technology use (Fulk, Schmitz &Steinfield 1990; Kraut, Rice, Cool & Fish, 1998; Rice, Grant, Schmitz & Torobin, 1990;Schmitz & Fulk, 1991; Yuan, Fulk & Shumate, 2005). When new technologies areimplemented within an organisation, institutional and social influence may arise becauseindividuals experience ambiguity and uncertainty about the value of a new informationtechnology for their work (Weick, 1990). Therefore, they strive to interpret and to assignmeanings to the technology and its capabilities (Prasad, 1993). During this sense making
process, individuals draw upon the prevailing institutions and social circles, in addition toexercising their own knowledge in measuring a new technology’s value to themselvesand the organisation (Jasperson, Sambamurthy & Zmud, 1999; Venkatesh et al., 2003).
Venkatesh et al. (2003) define three constructs related to social influence : Subjectivenorm, social factors and image. Empirical research conducted by Venkatesh et al. (2003)found that none of these three social constructs is significant when the systems usage isvoluntary. However, when system usage is mandatory these three constructs becomesignificant in contributing to end-user acceptance (Venkatesh & Davis, 2000). Venkateshand Davis (2000) suggested that such effects could be attributed to compliance inmandatory contexts that causes social influences to have a direct effect on intention; incontrast social influence in voluntary contexts operates by influencing perceptions aboutthe technology (Venkatesh et al., 2003). Social influence was only found to be significantin the early stages of use (Venkatesh & Davis, 2000; Venkatesh et al., 2003). Experience
was found to exert a strong moderating effect on social influence , with social influence becoming less significant as direct-use experience increased (Venkatesh et al., 2003).
Facilitating Conditions: Training, Shared Belief and Project Communication
Facilitating conditions are described as “the degree to which an individual believes thatan organisational and technical infrastructure exists to support use of the system”(Venkatesh et al., 2003, p453). There are three factors that are believed to be part of facilitating conditions, namely training and support, belief in the system and projectcommunication.
Training has been identified as one of the important factors for end-user acceptance of ERP systems (Amaoko-Gyampah, 2004; Amaoko-Gyampah & Salam, 2004; Venkatesh,1999). Amoako-Gyampah (2004) indicates how important it is for organisations installingERP systems to get the length, timing and thoroughness of end-user training right.Aldwani (2001), Amaoko-Gyampah and Salam, (2004), Galleta, Ahuja, Hartman, Teoand Peace (1995) and Venkatesh, (1999) observed how important it is to train end-usersduring ERP implementations because of the proven positive influence on end-user acceptance of the system. Training gives end-users time to adjust to the change that will

7/31/2019 2007 Seymour Isoneworld-erp
http://slidepdf.com/reader/full/2007-seymour-isoneworld-erp 6/22
Pg 26-6
In Proceedings of the 6 th Annual ISOnEworld Conference, April 11-13, 2007, Las Vegas, NV
www.isoneworld.org
occur with the implementation of an ERP system and allows them to gain first handexperience and explore the usefulness of the system (Amoako-Gyampah & Salam, 2004).Aldwani (2001) adds that through training, end-users can appreciate the benefits offered
by an ERP system. Brown et al. (2002) also noted how training increased the self-efficacy of end-users of ERP systems because they understood better how the system
could improve their job functions.
Amoako-Gyampah (2004) defines shared belief as the end-users’ belief that the ERPsystem will have an overall positive effect on the organisation. Many end-users fromdifferent functional areas of a business make use of ERP systems because such systemsare designed to integrate different business functions (Amoako-Gyampah, 2004). All end-users must therefore believe that the ERP system will benefit the organisation for it to beaccepted (Amoako-Gyampah & Salam, 2004). Wixom and Todd (2005) consider the
belief in a system to greatly influence the end-users attitude toward the informationsystem and the usage of the system. Amoako-Gyampah (2004) states that if all end-usershave a shared belief and an understanding of why the ERP system is being implemented,
including how it would benefit the organisation and improve their work environment, thesystem will be more readily accepted.
Communicating the implementation of an ERP system to end-users has been identified asan important factor in increasing end-user acceptance of the system (Ward, Hemingway& Daniel, 2000; Besson & Rowe, 2001; Nah, Lau & Kuang, 2001). Organisations need to
justify the ERP system to end-users as communication of the system benefits can lead toa shared belief in the benefits of the system and curb resistance (Amoako-Gyampah,2004; Al-Mashiri & Zairi, 2000; Oliver, Whymark & Romm, 2005). This justificationmust be communicated to end-users when the decision to implement the ERP system ismade (Amoako-Gyampah, 2004; Aldwani, 2001). End-users who feel they are included
in the decision to adopt the system from the beginning are more likely to readily acceptthe system because communication provides information about the new system andallows users to give feedback about any issues they may have (Amoako-Gyampah &Salam, 2004; Ward et al., 2000). In this way resistance to the new system is detectedearly on and measures can be taken to increase end-user acceptance (Amoako-Gyampah,2004).
Gender
Venkatesh and Morris (2000) and Yi et al. (2006) acknowledged that gender influencesthe use of any information system in both mandatory and voluntary settings. Venkatesh
and Morris (2000) and Venkatesh et al. (2003) observed how male end-users tended to bemore comfortable with new systems and this contributed more to their usage of thesystem. Female end-users were observed to have higher levels of computer anxiety andtheir perceived ease of use tended to be lower than that of their male counterparts; womenalso weighted ease of use as a much stronger determinant of behavioural intention thanmen (Venkatesh & Morris, 2000). On the other hand Yi et al. (2006) found that thefemale end-users found the system to be more useful than their male counterparts.

7/31/2019 2007 Seymour Isoneworld-erp
http://slidepdf.com/reader/full/2007-seymour-isoneworld-erp 7/22
Pg 26-7
In Proceedings of the 6 th Annual ISOnEworld Conference, April 11-13, 2007, Las Vegas, NV
www.isoneworld.org
Venkatesh et al. (2003) identified gender as a moderating variable for the followingrelationships:
• Performance expectancy and system use.• Effort expectancy and system use.• Social influence and system use.
Age
Venkatesh et al. (2003) identified age as a moderating variable for the relationship between:
• Performance expectancy and system use.• Effort expectancy and system use.• Social influence and system use.• Facilitating conditions and system use.
Burton-Jones and Hubona (2005) determined that age is a significant moderating factor between effort expectancy and usage of the system but that age was not a significantmoderating factor between performance expectancy and system use. Older end-users tendto find new information systems more difficult to users but do not seem to find them anyless useful when performing their job functions (Burton-Jones & Hubona, 2005). Morrisand Venkatesh (2000) observed how older end-users have difficulties when retrievinginformation from systems such as ERP systems because they struggle to adjust to the newenvironment necessitated by the ERP system. This leads to lower performanceexpectancy among older workers because they do not believe that the system can helpthem perform their job functions.
Experience
Increased direct-use experience has been found to influence end-user beliefs ininformation systems such as ERP systems (King & Xia, 1997; Rivard & Huff, 1988;Venkatesh & Davis, 2000; Venkatesh et al., 2003) and enhance the end-user’s confidencein their ability to understand and use the information systems in performing their tasks(DeLone 1988; Kraemer, Danziger, Dunkle & King, 1993; Venkatesh et al., 2003). Asend-users’ direct-use experience with information systems increases over time, their
perceptions and adoption intentions change substantially (Venkatesh & Davis, 2000; Xia& Lee, 2000). Venkatesh et al. (2003) defined experience in their empirical study as‘experience with the technology’. They gathered their results at different stages of thetraining program run in conjunction with their study and found in their research that
experience had a moderating influence on the relationship between:• Effort expectancy and system use.• Social influence and system use.• Facilitating conditions and system use

7/31/2019 2007 Seymour Isoneworld-erp
http://slidepdf.com/reader/full/2007-seymour-isoneworld-erp 8/22
Pg 26-8
In Proceedings of the 6 th Annual ISOnEworld Conference, April 11-13, 2007, Las Vegas, NV
www.isoneworld.org
Behavioural Intention, Use Behaviour and Symbolic Adoption
According to DeLone & McLean (1992), without a well-defined dependent variable,much Information Systems research is purely speculative. The choice of dependentvariable lies at the crux of the problem of ERP acceptance studies. The UTAUT model
uses use behaviour (actual use of the system) as the main factor indicating acceptance of a technology (Venkatesh et al., 2003). The UTAUT model suggests that behaviouralintention strongly influences use behaviour. Behavioural intention refers to the intentionof an end-user to make use of the new technology. In support, (Amaoko-Gyampah &Salam, 2004) believe it appropriate to examine behavioural intention to use a technologyeven when usage might be mandatory. They argue that use of an ERP system includes
both mandatory and voluntary usage. While, mandatory use represents the level of useneeded to perform minimal job functions; usage beyond that might become voluntary.Venkatesh et al. (2003) believe that all independent variables except for facilitatingconditions influence use behaviour indirectly through behavioural intention and in testingtheir model, only the direct effects on intention were modelled.
However the research performed by Rawstorne, Jayasuriya and Caputi (1998) and byBrown et al. (2002) concluded that the behavioural intention construct may not besuitable for measuring acceptance in a mandatory environment because the resultsobtained provided were contradicting and limited in terms of the explanations of end-users behaviours. The questions that define behavioural intention in the researchinstrument used by Venkatesh et al. (2003), shown below, indicate the inappropriatenessof using behavioural intention as a dependant variable since use of ERP systems ismandatory.
• BI1; I intend to use the system in the next <n> months.• BI2: I predict I would use the system in the next <n> months.• BI3: I plan to use the system in the next <n> months.
Nah et al. (2004) proposed that models that use behavioural intention as a measure of acceptance of mandatory technologies such as ERP systems, be revised. Because use
behaviour cannot be measured without taking into consideration behavioural intention ,this factor is also deemed unsuitable as a measure of ERP acceptance
Symbolic adoption has been proposed as a more superior dependant variable whenmeasuring end-users’ acceptance of ERP systems by Karahanna (1999), Nah et al. (2004)and Rawstorne et al. (1998). Symbolic adoption was first suggested as a means of measuring acceptance of new technologies by Klonglan and Coward (1970) and is
described as an end-user’s “mental acceptance” of a new system (Nah et al., 2004).Rawstorne et al. (1998) believe that end-users in a mandatory setting undergo symbolicadoption before actual system acceptance takes place and that end-users in a mandatoryenvironment will demonstrate differences in symbolic adoption and these differences canthen be used to investigate and evaluate end-users’ adoption of ERP systems.
7/31/2019 2007 Seymour Isoneworld-erp
http://slidepdf.com/reader/full/2007-seymour-isoneworld-erp 9/22
Pg 26-9
In Proceedings of the 6 th Annual ISOnEworld Conference, April 11-13, 2007, Las Vegas, NV
www.isoneworld.org
Research Model Proposed
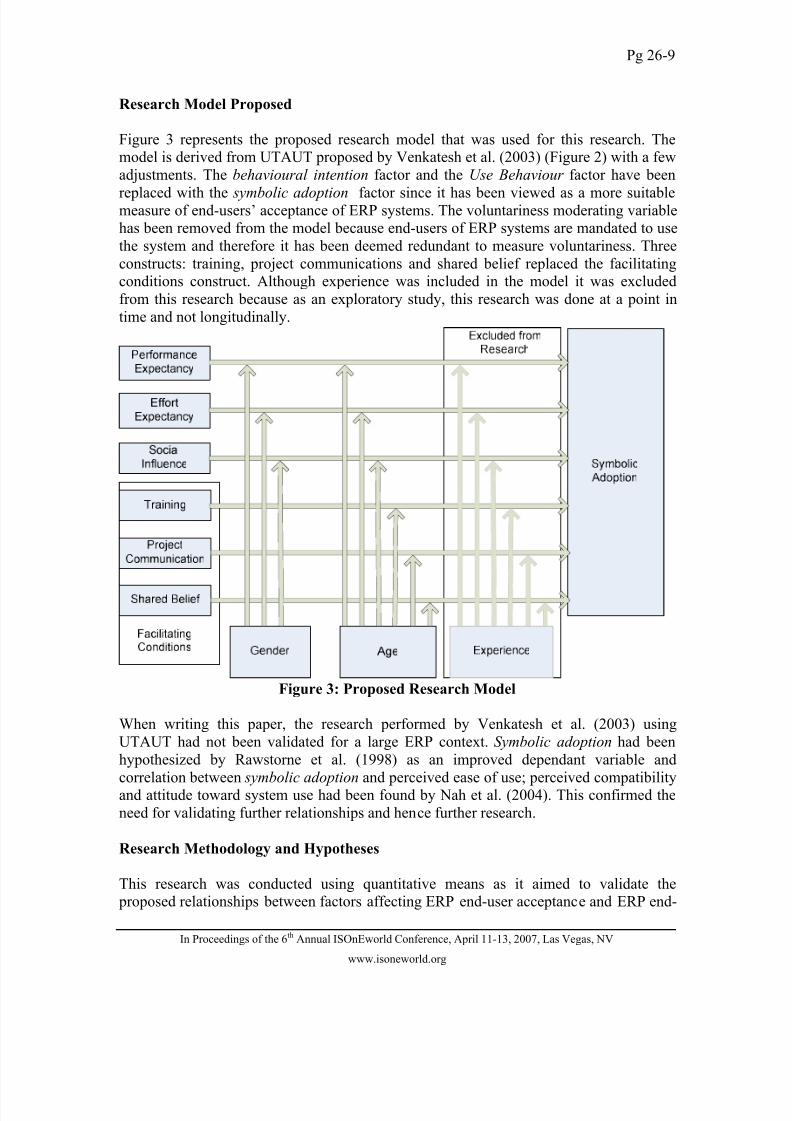
Figure 3 represents the proposed research model that was used for this research. Themodel is derived from UTAUT proposed by Venkatesh et al. (2003) (Figure 2) with a fewadjustments. The behavioural intention factor and the Use Behaviour factor have been
replaced with the symbolic adoption factor since it has been viewed as a more suitablemeasure of end-users’ acceptance of ERP systems. The voluntariness moderating variablehas been removed from the model because end-users of ERP systems are mandated to usethe system and therefore it has been deemed redundant to measure voluntariness. Threeconstructs: training, project communications and shared belief replaced the facilitatingconditions construct. Although experience was included in the model it was excludedfrom this research because as an exploratory study, this research was done at a point intime and not longitudinally.
Figure 3: Proposed Research Model
When writing this paper, the research performed by Venkatesh et al. (2003) usingUTAUT had not been validated for a large ERP context. Symbolic adoption had beenhypothesized by Rawstorne et al. (1998) as an improved dependant variable andcorrelation between symbolic adoption and perceived ease of use; perceived compatibilityand attitude toward system use had been found by Nah et al. (2004). This confirmed theneed for validating further relationships and hence further research.
Research Methodology and Hypotheses
This research was conducted using quantitative means as it aimed to validate the proposed relationships between factors affecting ERP end-user acceptance and ERP end-

7/31/2019 2007 Seymour Isoneworld-erp
http://slidepdf.com/reader/full/2007-seymour-isoneworld-erp 10/22
Pg 26-10
In Proceedings of the 6 th Annual ISOnEworld Conference, April 11-13, 2007, Las Vegas, NV
www.isoneworld.org
user acceptance. Studies performed to measure end-users acceptance of new systems areusually conducted using a longitudinal study of a single organisation or group. Theresearch instrument used is usually a questionnaire distributed to the end-users atdifferent intervals starting immediately after implementation up to a 12 month period(Brown et al., 2002; Davis, Bagozzi & Warshaw, 1989; Venkatesh et al., 2003).
From the model proposed the hypotheses listed in Table 1 were constructed. Hypotheseswere proposed to identify antecedents of symbolic adoption. The second part of each of the hypotheses then took into consideration the moderating variables that wereacknowledged as having an effect on the relationships between the independent variablesand symbolic adoption.
Table 1: Hypotheses
Instrument Development and Data Collection
The research was based on the University of Cape Town’s (UCT) 2006 implementationof the PeopleSoft ERP. The project to implement a new student administration systemwas named the Integrated Student Information System (ISIS) and aimed to investigate theviability of implementing a new student administration system (UCT ISIS ProjectHistory, 2005). A contract with PeopleSoft was signed in 2003 and the new system wentlive in January 2006. Questionnaires were distributed in July 2006 to staff members in thedifferent student administration functional areas within UCT such as the Fees office,Admissions office and the International Academic Programme Office (IAPO) as well asdepartmental and faculty office staff in the six academic faculties. The faculty office staff members were using the system to register or deregister students to particular courses and

7/31/2019 2007 Seymour Isoneworld-erp
http://slidepdf.com/reader/full/2007-seymour-isoneworld-erp 11/22
Pg 26-11
In Proceedings of the 6 th Annual ISOnEworld Conference, April 11-13, 2007, Las Vegas, NV
www.isoneworld.org
degrees while departmental staff members were using the system to maintain class listsand capture student marks. The different student administration functional areas weremaking use of the system for a range of purposes such as maintaining student feeaccounts, capturing data pertaining to student admissions and performing pre-registrationof international students.
The instrument used was adapted from instruments validated in previous quantitativestudies of a similar nature (Amoako-Gyampah & Salam, 2004; Calisir & Calisir, 2004;Davis, 1989; Davis et al., 1989; Nah et al., 2004; Venkatesh and Morris, 2000; Venkateshet al., 2003; Zviran, Pliskin & Levin, 2005). The questions were answered according to aseven point Likert scale which ranged from “strongly disagree” to “strongly agree”.
Sixty of the 120 questionnaires distributed were returned. One questionnaire was omitteddue to the inappropriate nature of the responses, which resulted in a sample of 59. Figure4 shows the various faculties and offices that respondents belong. From the figure it can
be seen that questionnaires were distributed to a wide range of PeopleSoft end-users
across UCT. It is believed that the users selected as a sample were making use of most of the functions identified for student administration. This ensured that the sample wasvaried and that end-users that were performing different functions gave their input.
Respondents Faculties & Offices
Health Sciences7%
Commerce8%
Science22%
Humanities13%Engineering and
Built Environment3%
Admissions Off ice12%
UCT Fees Office5%
International Academic Program
Office17%
Law13%
Figure 4: Respondents’ Faculties & Offices.

7/31/2019 2007 Seymour Isoneworld-erp
http://slidepdf.com/reader/full/2007-seymour-isoneworld-erp 12/22
Pg 26-12
In Proceedings of the 6 th Annual ISOnEworld Conference, April 11-13, 2007, Las Vegas, NV
www.isoneworld.org
Data Analysis
The data analysis started with testing the questions to ensure that they are suitable andreliable to be grouped and averaged, ultimately forming one individual variable that can
be used to test the model. The item reliability test performed indicates whether the set of
questions intended to test a single construct are reliable for testing that construct withoutexternal influence from other factors. Factor analysis was then used to test whether agroup of questions is testing a single factor and not related to multiple factors or constructs (Keller & Warrack, 2000).
After grouping and averaging the selected questions, t-tests were used to test whether themajority of responses differed from the neutral point (Keller & Warrack, 2000). Bi-variant Spearman correlation tests (non-parametric) were performed to test the mainhypotheses and then multiple and stepwise regression was performed to identify theequation that best describes the significant variables of the research model.
Reliability and Item Validity Testing
Table 2 acts as key to the construct codes and question summary used in the analysis andother areas of the research paper. Table 3 summarises the various Cronbach Alpha’s for all initial questions and for the final set of accepted questions for each construct.Constructs with Cronbach Alpha’s above 0.7, with a maximum value of 1.0, areconsidered reliable (Nunnaly, 1978). All constructs were considered reliable except for
social influence which had a Cronbach Alpha of 0.608. A Cronbach Alpha > 0.6 is oftenacceptable for exploratory studies and hence the construct was retained.
Table 2: Key to Construct Codes.

7/31/2019 2007 Seymour Isoneworld-erp
http://slidepdf.com/reader/full/2007-seymour-isoneworld-erp 13/22
Pg 26-13
In Proceedings of the 6 th Annual ISOnEworld Conference, April 11-13, 2007, Las Vegas, NV
www.isoneworld.org
Table 3: Reliability Analysis Summary
When conducting the factor analysis (summarised in Table 4), varimax normalisation, afactor analysis standard (Keller & Warrack, 2000), was used. Factor loadings above 0.7,with a maximum value of 1.0, are considered acceptable. Two constructs loaded in one
column (the independent variable shared belief with the dependent variable symbolicadoption ), while other columns had single factors.
Table 4: Factor Analysis Summary
Two project communication questions (PC3 and PC4) were removed as they loadedhigher with training than with communication. An investigation of the questions showed

7/31/2019 2007 Seymour Isoneworld-erp
http://slidepdf.com/reader/full/2007-seymour-isoneworld-erp 14/22
Pg 26-14
In Proceedings of the 6 th Annual ISOnEworld Conference, April 11-13, 2007, Las Vegas, NV
www.isoneworld.org
their unsuitability. Question T4 (“The training was of adequate length and detail”) wasomitted because it was neither a negative nor positive question which meant end-usersthat believed the training was too long may have similar responses to those who believedit was too short. Question PE7 (“I often make use of the reports and outputs provided bythe system”) was omitted because many of the end-users who responded to the
questionnaire had no access to the report functionality at the time of the study. A further four questions (EE1, EE3, EE5, SI3) were removed as they loaded below 0.7 and their removal resulted in an improved Cronbach alpha. Three questions which loaded below0.7 (0.66, 0.66 and 0.69) were retained as their removal did not improve the Cronbachalpha. After the removal of the relevant questions, the question responses were averagedand t-tests were performed against Neutral (4), with results shown in Table 5.
Table 5: t-test Summary.
Age and Gender
A limitation in the data gathered was the small number of male respondents (3 malesversus 56 females). For this reason gender could not be analysed. The number of respondents from various age groups is shown in Figure 5, a good spread was obtained.To analyse the moderating effect of Age, responses were separated into two groups, thoseyounger than 35 years (21 respondents) and those equal to or older than 35 years (38respondents).
Respondent Age Groups
02468
10
1214161820
Below 25 25 to 34 35 to 44 45 to 54 55 to 64 65 & Above

7/31/2019 2007 Seymour Isoneworld-erp
http://slidepdf.com/reader/full/2007-seymour-isoneworld-erp 15/22
Pg 26-15
In Proceedings of the 6 th Annual ISOnEworld Conference, April 11-13, 2007, Las Vegas, NV
www.isoneworld.org
Figure 5: Respondent Age Groups.
Correlation Testing
Spearman correlation tests were performed to test correlation between the variables. The
results are shown in Table 6. When analysing all responses, all variables were found to becorrelated at a 95% level of significance other than social influence with project communication and symbolic adoption . As the social influence construct had failed thereliability test, it was omitted from further analysis.
Table 6: Spearman bi-variant correlation results. Significant correlations are inbold font.
The correlations for the younger and older age groups showed different results indicatingthat age appears to have a moderating affect on the relationships between the variables.The only correlation that was stronger for younger respondents was the relationship
between effort expectancy and symbolic adoption .
Table 7: Regression Summary for Dependent Variable SA; Significant variables inthe regression equation are in bold font.

7/31/2019 2007 Seymour Isoneworld-erp
http://slidepdf.com/reader/full/2007-seymour-isoneworld-erp 16/22
Pg 26-16
In Proceedings of the 6 th Annual ISOnEworld Conference, April 11-13, 2007, Las Vegas, NV
www.isoneworld.org
Multiple and then forward stepwise regression was performed to look at the simultaneouseffect of the independent variables on symbolic adoption . The multiple regression resultsare shown in Table 7. The stepwise and multiple regression tests showed similar results.Because of high correlation between variables, regression equations (shown in Table 8)
were generated from the stepwise regression.
Table 8: Regression Equations
The coefficient of determination (R 2) indicates what percentage of variation in thedependent variable can be explained by variation in the independent variables (Keller &Warrack, 2000). The independent variables accounted for 79% of the total variation in thedependant variable, symbolic adoption , for older respondents. This percentage went down
to 56% for the total group and further down to 39% for younger respondents.
Discussion of Results
The results of the t-tests were shown in Table 5. Effort expectancy , project communication , shared belief and symbolic adoption showed no significant deviationfrom the neutral response point 4. The low levels of symbolic adoption , 6 months after implementation is disappointing but not unusual. The project put considerable emphasison communication so a neutral response is disappointing. Training is seen as being
positive which should be pleasing to the project. However, performance expectancy wasseen to be low. The legacy system at UCT had been in use for over 20 years and the staff
who 6 months prior had started using the PeopleSoft ERP were extremely comfortable, proficient and knowledgeable with regard to the procedures and workings of the legacysystem, this could account for the low performance expectancy .
Validation of the Model
In support of the literature, positive linear correlation was found between performanceexpectancy ; effort expectancy; project communication; training and shared belief and thedependent variable symbolic adoption . The relationships with their hypotheses numbersand Spearman correlation values are included in Figure 6. Together these relationshipsaccounted for 56% of the variation in symbolic adoption. While this is a good result, it
does show that there are other variables not tested in this study which impact symbolicadoption.
No correlation was found between social influence and symbolic adoption. According toVenkatesh & Morris (2000), subjective norm (which forms part of social influence )reduces over time and for their study it was already found to be non-significant threemonths after implementation. The social influence construct did fail the item reliabilitytest and was included for exploratory reasons only and therefore this finding is tentative.

7/31/2019 2007 Seymour Isoneworld-erp
http://slidepdf.com/reader/full/2007-seymour-isoneworld-erp 17/22
Pg 26-17
In Proceedings of the 6 th Annual ISOnEworld Conference, April 11-13, 2007, Las Vegas, NV
www.isoneworld.org
For this reason, Appendix 1, which contains the validated constructs, has social influenceomitted.
While support was found for the following relationship:H2b. The relationship between effort expectancy and symbolic adoption is influenced
by age, such that the effect will be stronger for younger respondents. No support for the following hypothesis could be found as age appeared to have theopposite affect on the relationship:“H1b - The relationship between performance expectancy and symbolic adoption isinfluenced by age , such that the effect will be stronger for younger respondents”.These findings are supported by the finding of Burton-Jones and Hubona (2005) whodetermined that age is a significant moderating factor between effort expectancy andusage of the system but that age was not a significant moderating factor between
performance expectancy and system use.
Support was also found for the following three moderating relationships:
H5b. The relationship between shared belief and symbolic adoption is influenced byage, such that the effect will be greater for older workers.H3b The relationship between project communication and symbolic adoption isinfluenced by age, such that the effect will be greater for older workersH4b. The relationship between training and symbolic adoption is influenced by age,such that the effect will be greater for older workers.Hypothesis 3b, 4b and 5b were proposed as Venkatesh et al. (2003) identified age as amoderating variable for the relationship between facilitating conditions and system use.We had split the facilitating conditions construct into three separate constructs, so thisresult is pleasing.
Figure 6: Significant Relationships

7/31/2019 2007 Seymour Isoneworld-erp
http://slidepdf.com/reader/full/2007-seymour-isoneworld-erp 18/22
Pg 26-18
In Proceedings of the 6 th Annual ISOnEworld Conference, April 11-13, 2007, Las Vegas, NV
www.isoneworld.org
This study was not able to test the affect of two variables in the model. Firstly, the studywas performed at a certain point in time and therefore the results obtained only indicatedthe level of acceptance at that point and the experience variable, which requires alongitudinal study, could not be effectively measured. Secondly, the sample selected andin fact the entire sample population did not contain enough male end-users to be able to
analyse gender as a moderating variable. This limited the study.
Conclusion
One of the main reasons ERP implementations fail to achieve their predicted benefits is because the system is not completely accepted by end-users. The ERP implementationmight have been declared successful but end-users are often only using a subset of theavailable features. This research aimed to identify the factors that affect and are related toend-user acceptance of ERP Systems. A model was proposed that was primarily based onthe Unified Theory of Acceptance and Use of Technology (UTAUT) first proposed byVenkatesh et al. (2003). The model contained the dependant variable symbolic adoption
that has been shown to better indicate end-user acceptance of mandatory technologies by Nah et al. (2004). The model was validated through a survey followed by quantitativeanalysis. Performance expectancy ; effort expectancy; project communication; training;and shared belief were all found to be antecedents to symbolic adoption and age wasfound to have a moderating influence on the relationships between:
• Effort expectancy and symbolic adoption .• Training and symbolic adoption .• Shared belief and symbolic adoption. • Project communication and symbolic adoption.
This study points to required further research. The social influence construct requires
further work and it is suggested that this is addressed in future studies and that studies arecarried out using the longitudinal approach and with sample populations that havesufficient of each gender. The findings in this paper should be of relevance to futureresearchers and to organisations that intend installing ERP systems. It is hoped that
practitioners pay attention to these factors that can influence end-user acceptance of anew ERP system. Getting end-users to use a new ERP system correctly is much harder than the actual ERP implementation and more important. The success of animplementation should, and often is, measured by how well the system is used by end-users.

7/31/2019 2007 Seymour Isoneworld-erp
http://slidepdf.com/reader/full/2007-seymour-isoneworld-erp 19/22
Pg 26-19
In Proceedings of the 6 th Annual ISOnEworld Conference, April 11-13, 2007, Las Vegas, NV
www.isoneworld.org
References
Adam, F. & O’Doherty, O. (2000). Enterprise Resource Planning: Myth and Reality . 5ème Colloque del’AIM, Montpellier, France.
Aldwani, A. M. (2001). Change Management Strategies for Successful ERP Implementation: Business Process Management Journal , 7(3), 266–275.
Al-Mashari, M. & Zairi, M. (2000). Information and business process equality: the case of SAP R/3implementation: The Electronic Journal on Information Systems in Developing Countries , 2(4), 1– 15.
Amoako-Gyampah, K. (2004). ERP Implementation Factors a Comparison of Managerial and End-User Perspectives. Business Process Management Journal , 10(2), 171-181.
Amoako-Gyampah, K. (1999). User involvement, Ease of Use, Perceived Usefulness and Behavioural Intention: A Test of the Enhanced Technology Acceptance Model in an ERP Implementation Environment . Proceedings of the 1999 Decision Sciences Annual Meeting, New Orleans, LosAngeles Retrieved April 8, 2006 fromhttp://www.sbaer.uca.edu/research/dsi/1999/pdffiles/PAPERS/Volume2/pt4/371.pdf
Amoako-Gyampah, K. & Salam, A. F. (2004). An extension of the Technology Acceptance Model in anERP Implementation Environment. Information & Management , 41(6), 731–745.
Besson, P. & Rowe, F. (2001). ERP Project Dynamics and Enacted Dialogue: Perceived Understanding,
Perceived Leeway, and the Nature of Task-related Conflicts. The DATA BASE for Advances in Information Systems , 32(4), 47–66.Boudreau, M. C. (2003). Learning to Use ERP Technology: A Causal Model . Proceedings of the 36th
Hawaii International Conference on System Sciences, Hawaii, USA. Retrieved April 12, 2006from http://csdl2.computer.org/comp/proceedings/hicss/2003/1874/08/187480235b.pdf
Brown, S. A., Massey, A. P., Montoya-Weiss, M. M. & Burkman, J. R. (2002). Do I Really Have To? User Acceptance of Mandated Technology. European Journal of Information Systems , 11(4), 283–295.
Burton-Jones, A. & Hubona, G. S. (2005). Individual Differences and Usage Behaviour: Revisiting aTechnology Acceptance Model Assumption. The DATA BASE for Advances in InformationSystems , 36(2), 58–77.
Calisir, F. & Calisir, F. (2004). The relation of interface usability characteristics, perceived usefulness, and perceived ease of use to end-user satisfaction with enterprise resource planning (ERP) systems.Computers in Human Behaviour , 20(4), 505–515.
DA Consulting Group. (2006). How to Overcome the Most Dangerous Issues Facing Corporations Today ,Available http://go.techtarget.com/r/533402/1121877
Davis, C. H. (2004). Perceived Effects of ERP on Jobs and Work in a Contact Centre. Proceedings of theInternational conference on Work with Computer Systems, Kuala Lumpur. Retrieved April 4,2006 fromhttp://www.ryerson.ca/~c5davis/publications/DavisCImpact%20of%20ERP%20on%20Work-WWC04b.pdf
Davis, F. D. (1989). Perceived Usefulness, Perceived Ease of Use, and User Acceptance of InformationTechnology. MIS Quarterly , 13(3), 319–339.
Davis, F. D. (1993). User Acceptance of Information Technology: System Characteristics, User Perceptionsand Behavioural Impacts. International Journal of Man Machine Studies , 38(3), 475–487.
Davis, F. D., Bagozzi, R. P., & Warshaw, P. R (1989). User Acceptance of Computer Technology. AComparison of Two Theoretical Models. Management Science , 35(8), 982–1003.
DeLone, W. H. (1988). Determinants of Success for Computer Usage in Small Business. MIS Quarterly , 12(1), 51–61.
DeLone, W. H., & McLean, E. R. (1992). Information Systems Success: The Quest for the DependentVariable. Information Systems Research , 3(1), 60–95.
Fulk, J., Schmitz, J., & Steinfield, C. W. (1990). A Social Influence Model of Technology Use in J. Fulk and C. W. Steinfield (eds.), Organizations and Communication Technology (pp. 117–140).
Newbury Park: Sage Publications.Galletta, D.F., Ahuja, M., Hartman, A., Teo, T. & Peace, G. (1995). Social influence and end-user training.
Communications of the ACM , 38(7), 70–80.

7/31/2019 2007 Seymour Isoneworld-erp
http://slidepdf.com/reader/full/2007-seymour-isoneworld-erp 20/22
Pg 26-20
In Proceedings of the 6 th Annual ISOnEworld Conference, April 11-13, 2007, Las Vegas, NV
www.isoneworld.org
Hartwick, J., & Barki, H. (1994). Explaining the Role of User Participation in Information System Use. Management Science, 40(4), 440– 465.
Jasperson, J. S., Carter, P. E. & Zmud, R. W. (2005). Conceptualization of Post-Adoptive BehavioursAssociated with Information Technology Enabled Work Systems. MIS Quarterly , 29(3), 525–567.
Jasperson, J., Sambamurthy, V. & Zmud, R. (1999). Social influence and individual IT use: unravelling the pathways of appropriation moves. Proceeding of the 20th international conference on Information
Systems, Charlotte, North Carolina. Retrieved April 18, 2006, from The ACM Portal Database.Karahanna, E. (1999). Symbolic adoption of information technology. Proceedings from the InternationalDecision Sciences Institute Conference, Athens, Greece.
Keller, G. & Warrack, B. (2000). Statistics for Management and Economics. 5 th Edition. Duxbury Press.Thomson Learning. Pacific Grove, CA, USA.
King, R. C. & Xia, W. (1997). Media Appropriateness: Effects of Experience on Communication MediaChoice. Decision Sciences , 28(4), 877– 910.
Klonglan, G. E., & Coward, E. W. (1970). The Concept of Symbolic Adoption: A Suggested Interpretation. Rural Sociology (35:1), 77-83.
Kraemer, L., Danziger, J. N., Dunkle, D.E., & King, J.L. (1993). The Usefulness of Computer-BasedInformation to Public Managers. MIS Quarterly , 17(2), 129–148.
Kraut, R. E., Rice, R. E., Cool, C. & Fish, R. S. (1998). Varieties of Social Influence: The Role of Utilityand Norms in the Success of a New Communication Medium. Organization Science , 9(4), 437– 453.
Morris, M.G. & Venkatesh. V. (2000). Age Differences in Technology Adoption Decisions: Implicationsfor a Changing Work Force. Personnel Psychology , 53(2), 375–403.
Nah, F. F., Lau, J. L. & Kuang, J. (2001). Critical Factors for Successful Implementation of EnterpriseSystems. Business Process Management , 7(3), 285–296.
Nah, F. F., Tan, X. & Beethe, M. (2005). End-users’ Acceptance of Enterprise Resource Planning (ERP)Systems: An Investigation Using Grounded Theory Approach . Proceedings of the EleventhAmericas Conference on Information Systems, Omaha USA. Retrieved August 24, 2006 fromhttp://aisel.isworld.org/proceedings/amcis/2005/program.asp .
Nah, F. F., Tan, X. & Teh, S. H. (2004). An Empirical Investigation on End-Users’ Acceptance of Enterprise Systems. Information Resource Management Journal , 17(3), 32–53.
Nunnaly, J. (1978). Psychometric Theory . New York: McGrawHill.Oliver, D., Whymark, G. & Romm, C. (2005). Researching ERP adoption: an Internet-based Grounded
Theory Approach. Online Information Review , 29(6), 583–603.Prasad, P. (1993). Symbolic Processes in the Implementation of Technological Change: A Symbolic
Interactionist Study of Work Computerization. Academy of Management Journal , 36(6), 1400– 1429.
Rawstorne, P., Jayasuriya, R. & Caputi, P. (1998). An integrative model of information systems use inmandatory environments. Proceedings of the Nineteenth International Conference on InformationSystems, Helsinki, Finland.
Rice, R. E., Grant, A. E., Schmitz, J. & Torobin, J. (1990). Individual and Network Influences on theAdoption and Perceived Outcomes of Electronic Messaging. Social Networks , 12(1), 27–55.
Rivard, S., & Huff, S. (1988). Factors of Success for End-user Computing. Communications of the ACM , 31(5), 552–561.
Ross, J. W., & Weill, P. (2002). Six IT Decisions Your IT People Shouldn’t Make. Harvard Business Review , 80(11), 84–91.
Schmitz, J. & Fulk, J. (1991). Organizational Colleagues, Media Richness, and Electronic Mail: A Test of
the Social Influence Model of Technology Use. Communication Research , 18(4), 487–523.Tchokogué, A., Bareil, C. & Duguay, C. R. (2005). Key lessons from the implementation of an ERP atPratt & Whitney Canada. International Journal of Production Economics , 95, 151–163.
UCT ISIS Project History. (2005). Retrieved August 24, 2006 from http://www.isis.uct.ac.za/Venkatesh, V. (1999). Creation of Favourable User Perceptions: Exploring the Role of Intrinsic Motivation.
MIS Quarterly , 23(2), 239–260.Venkatesh, V. & Davis, F. D. (2000). Theoretical Extension of the Technology Acceptance Model.
Management Science , 46(2), 186–204.

7/31/2019 2007 Seymour Isoneworld-erp
http://slidepdf.com/reader/full/2007-seymour-isoneworld-erp 21/22
Pg 26-21
In Proceedings of the 6 th Annual ISOnEworld Conference, April 11-13, 2007, Las Vegas, NV
www.isoneworld.org
Venkatesh, V. & Morris, M. G. (2000). Why Don’t Men Ever Stop to Ask for Directions? Gender, SocialInfluence and Their Role in Technology Acceptance and Usage Behaviour. MIS Quarterly , 24(1),115–139.
Venkatesh. V., Morris, M. G., Davis, G. B. & Davis, F. D. (2003). User Acceptance of InformationTechnology: Towards a Unified View. MIS Quarterly , 27(3), 425–478.
Wang, W. T. & Liu, C. Y. (2005). The Application of the Technology Acceptance Model: A New Way to
Evaluate Information System Success. Proceedings of The 23rd International Conference of theSystem Dynamics Society. Boston, USA. Retrieved April 3, 2006 fromhttp://www.albany.edu/cpr/sds/conf2005/proceed/papers/WANG224.pdf
Ward, J., Hemingway, C. & Daniel, E. (2000). A framework for addressing the organisational issues of enterprise systems implementation. Journal of Strategic Information Systems , 14, 97–119.
Weick, K. E. (1990). Technology as Equivoque: Sensemaking in New Technologies, in P. S. Goodman, L.S. Sproull and Associates (eds.), Technology and Organizations (pp. 1–44). San Francisco: Jossey-Bass Publishers.
Wixom, B. H. & Todd, P. A. (2005). A Theoretical Integration of User Satisfaction and TechnologyAcceptance. Information Systems Research , 16(1), 85–102.
Xia, W. & Lee, A. (2000). The influence of persuasion, training and experience on user perceptions and acceptance of IT innovation. Proceeding of the 21st international conference on InformationSystems, Brisbane, Queensland, Australia. Retrieved April 18, 2006, from The ACM PortalDatabase.
Yi, Y., Wu, Z. & Tung, L. L. (2005/2006). How Individual Differences Influence Technology UsageBehaviour? Towards an Integrated Framework. Journal of Computer Information Systems , 46(2),52–63.
Yuan, Y., Fulk, J. & Shumate, M. (2005). Individual participation in organizational information commons -The impact of team level social influence and technology-specific competence. HumanCommunication Research , 31(2), 212–240.
Zviran, M., Pliskin, N. & Levin, R. (2005). Measuring User Satisfaction and Perceived Usefulness in theERP context. Journal of Computer Information Systems , 45(3), 43–52.

7/31/2019 2007 Seymour Isoneworld-erp
http://slidepdf.com/reader/full/2007-seymour-isoneworld-erp 22/22
Pg 26-22
In Proceedings of the 6 th Annual ISOnEworld Conference, April 11-13, 2007, Las Vegas, NV
Appendix 1: Validated construct questions