2007 paul vanraden, mel tooker, and melvin kuhn animal improvement programs laboratory, usda...
TRANSCRIPT

2007
Paul VanRaden, Mel Tooker, and Melvin KuhnPaul VanRaden, Mel Tooker, and Melvin Kuhn
Animal Improvement Programs Laboratory, USDAAgricultural Research Service, Beltsville, MD, [email protected]
2007
Research Plans for Genomics, Research Plans for Genomics, Crossbreeding, Fertility, etc. Crossbreeding, Fertility, etc.

Genex / CRI, June 2007 (2) P.M. VanRaden200
7
AIPL 5-Year Plan 2007-2012AIPL 5-Year Plan 2007-2012
Objectives• Collect genotypes, new phenotypes• Document current status and effects
of management on dairy traits• Improve accuracy of predictions by
including SNP data, refining models • Estimate economic values of traits to
maximize lifetime profit
Genex / CRI, June 2007 (3) P.M. VanRaden200
7
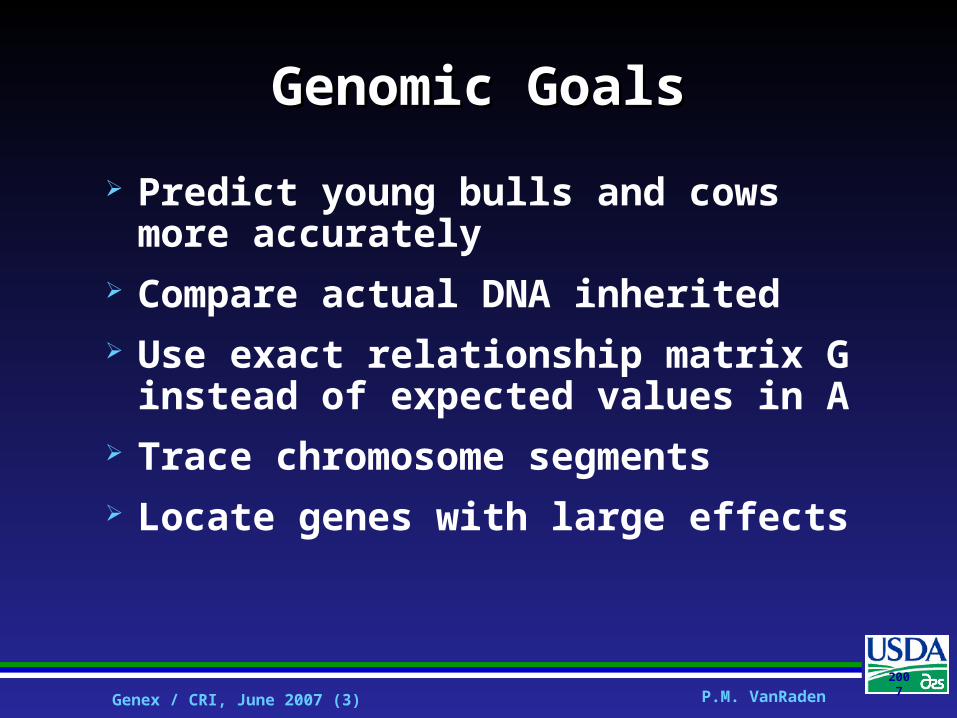
Genomic GoalsGenomic Goals
Predict young bulls and cows more accurately
Compare actual DNA inherited Use exact relationship matrix G
instead of expected values in A Trace chromosome segments Locate genes with large effects

Genex / CRI, June 2007 (4) P.M. VanRaden200
7
How Related are Relatives?How Related are Relatives?
Example: Full sibs • are expected to share 50% of their
DNA on average • may actually share 45% or 55% of
their DNA because each inherits a different mixture of chromosome segments from the two parents.
Combine genotype and pedigree data to determine exact fractions

Genex / CRI, June 2007 (5) P.M. VanRaden200
7
Genomic RelationshipsGenomic Relationships
Measures of genetic similarity• A = Expected % genes identical by
descent from pedigree (Wright, 1922)• G = Actual % of DNA shared (using
genotype data)• T = % genes shared that affect a
given trait (using genotype and phenotype)
Best measure depends on use

Genex / CRI, June 2007 (6) P.M. VanRaden200
7
QTL Relationship Matrix (QTL Relationship Matrix (TT))
Three bulls each +50 PTA protein. Are their QTL alleles the same?
• Possibly, but probably not.• Bull A could have 10 positive genes.• Bull B could have 10 positive genes,
not on same chromosomes as bull A.• Bull C could have 20 positive and 10
negative genes.

Genex / CRI, June 2007 (7) P.M. VanRaden200
7
Genes in Common at One LocusGenes in Common at One Locus
If Full Sib 1 inherits:
If Full Sib 2 inherits:
w,y w,z x,y x,z
w,y 2 1 1 0
w,z 1 2 0 1
x,y 1 0 2 1
x,z 0 1 1 2
w = gene from sire of sirex = gene from dam of sirey = gene from sire of damz = gene from dam of dam
Genex / CRI, June 2007 (8) P.M. VanRaden200
7
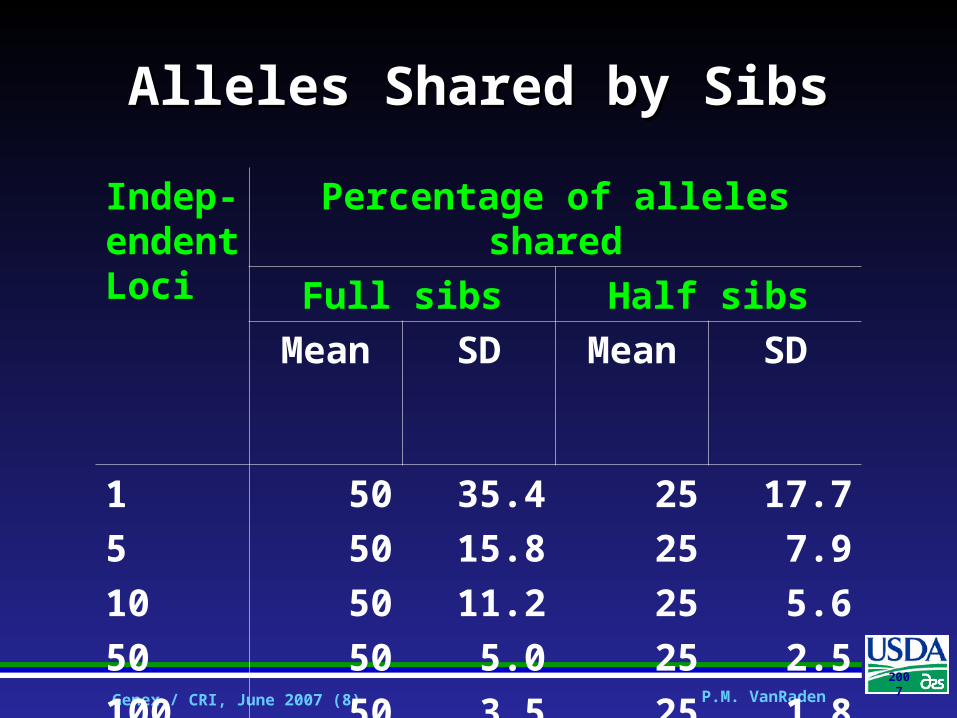
Alleles Shared by SibsAlleles Shared by Sibs
Indep-endent Loci
Percentage of alleles shared
Full sibs Half sibs
Mean SD Mean SD
1 50 35.4 25 17.7
5 50 15.8 25 7.9
10 50 11.2 25 5.6
50 50 5.0 25 2.5
100 50 3.5 25 1.8
Infinite 50 0.0 25 0.0
Genex / CRI, June 2007 (9) P.M. VanRaden200
7
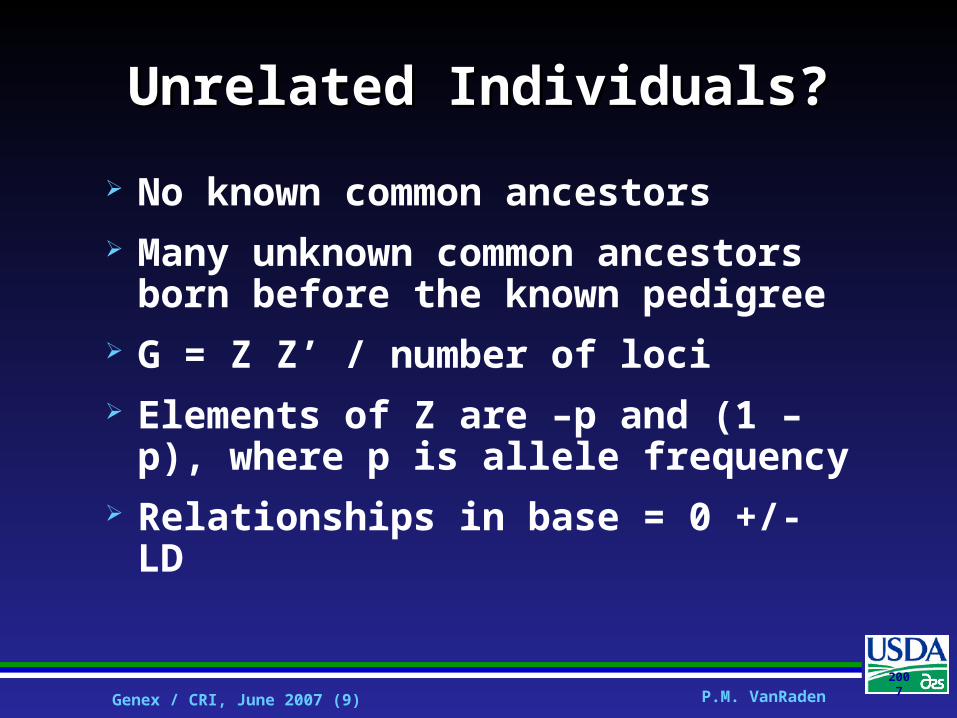
Unrelated Individuals?Unrelated Individuals?
No known common ancestors Many unknown common ancestors
born before the known pedigree G = Z Z’ / number of loci Elements of Z are –p and (1 – p),
where p is allele frequency Relationships in base = 0 +/- LD

Genex / CRI, June 2007 (10) P.M. VanRaden200
7
Traditional PedigreeTraditional Pedigree
Sire of Sire
Sire
Dam of Sire
Animal
Sire of Dam
Dam
Dam of Dam
Genex / CRI, June 2007 (11) P.M. VanRaden200
7
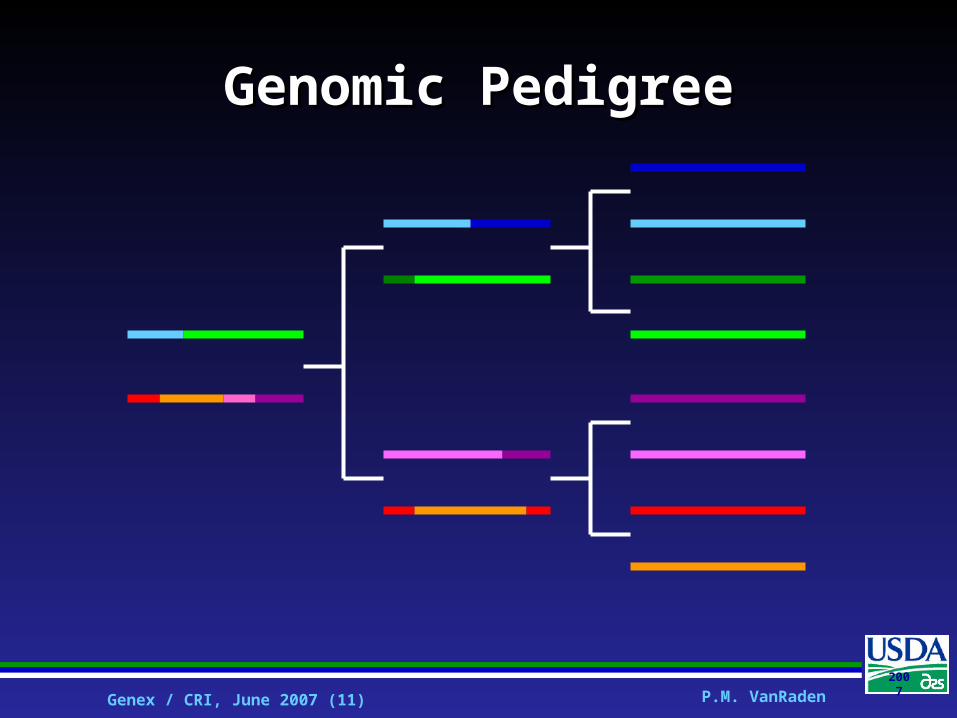
Genomic PedigreeGenomic Pedigree

Genex / CRI, June 2007 (12) P.M. VanRaden200
7
Example of a SNP haplotypeExample of a SNP haplotype
caacgtat
caacggat
SNP
atccgaat
atccgcat
…
… …
…
SNP
tctaggat
tctcggat
SNP
…
…Chr1
Chr2
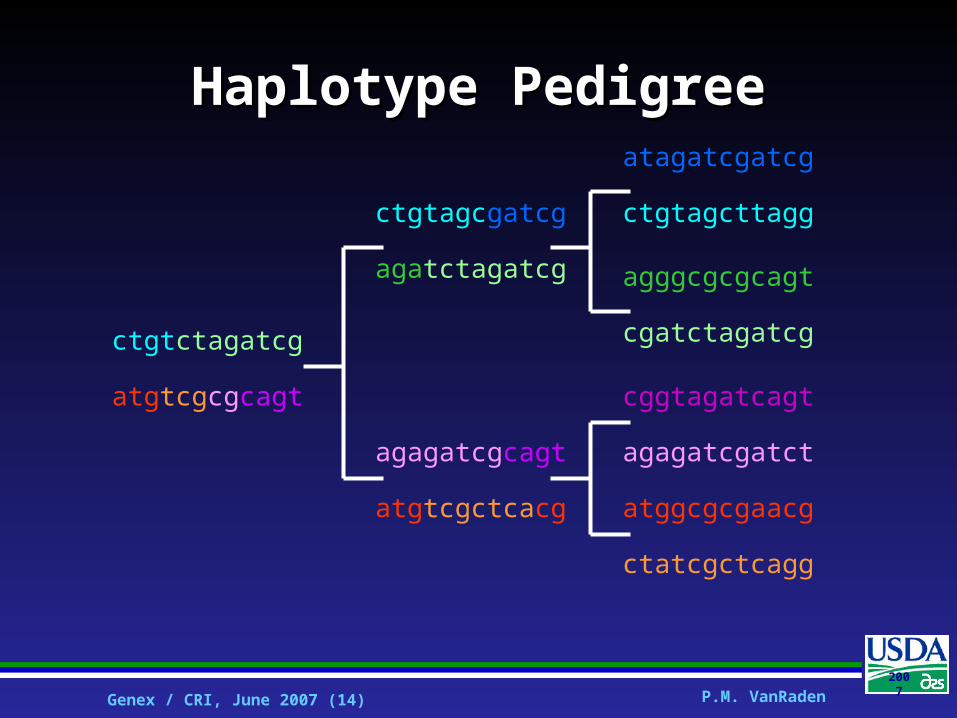
Haplotype is a set of single nucleotide polymorphisms (SNPs) associated on a single chromosome. Identification of a few alleles of a haplotype block can identify other polymorphic sites in the region.
Haplotype 1 tca
gac Haplotype 2

Genex / CRI, June 2007 (13) P.M. VanRaden200
7
SNP PedigreeSNP Pedigreeatagatcgatcg
ctgtagcttagg
agggcgcgcagt
cgatctagatcg
cggtagatcagt
agagatcgatct
atggcgcgaacg
ctatcgctcagg
ctgtagcgatcg
agatctagatcg
agagatcgcagt
atgtcgctcacg
ctgtctagatcg
atgtcgcgcagt
Genex / CRI, June 2007 (14) P.M. VanRaden200
7
Haplotype PedigreeHaplotype Pedigreeatagatcgatcg
ctgtagcttagg
agggcgcgcagt
cgatctagatcg
cggtagatcagt
agagatcgatct
atggcgcgaacg
ctatcgctcagg
ctgtagcgatcg
agatctagatcg
agagatcgcagt
atgtcgctcacg
ctgtctagatcg
atgtcgcgcagt
Genex / CRI, June 2007 (15) P.M. VanRaden200
7
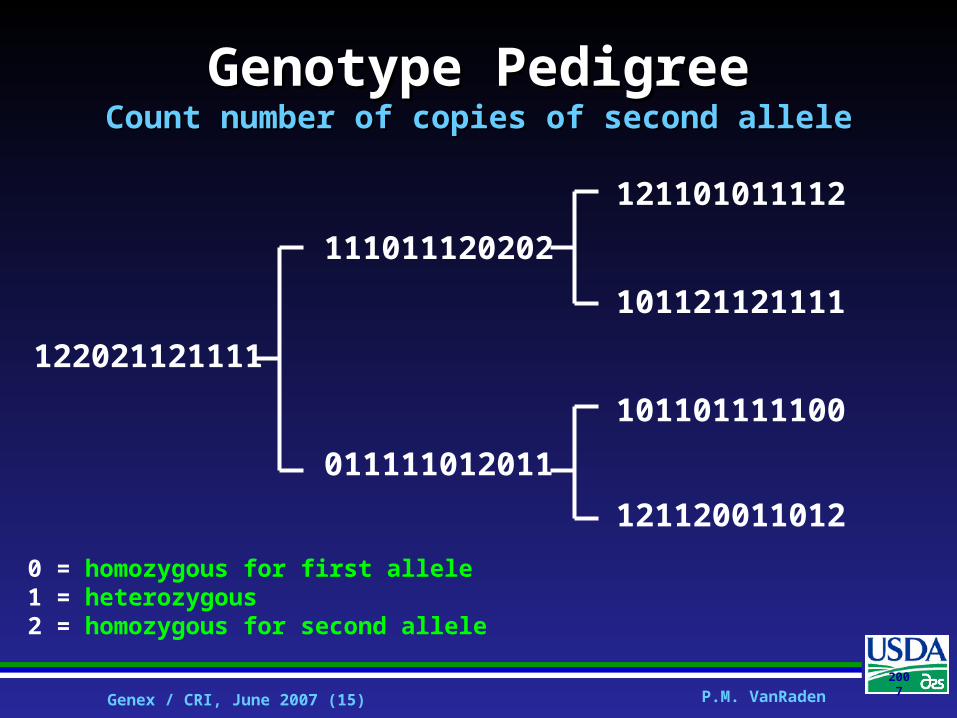
Genotype PedigreeGenotype PedigreeCount number of copies of second alleleCount number of copies of second allele
121101011112
111011120202
101121121111
122021121111
101101111100
011111012011
121120011012
0 = homozygous for first allele1 = heterozygous2 = homozygous for second allele

Genex / CRI, June 2007 (16) P.M. VanRaden200
7
Reliability from Full SibsReliability from Full SibsMarker and QTL positions identical, sib REL = 99%Marker and QTL positions identical, sib REL = 99%
Reliability Obtained From:
Full Sibs A
60 QTLs
G
30,000 QTLs
G
1 .250 .250 .250
10 .454 .494 .470
100 .495 .907 .624
Infinite .500 1.000 1.000A = traditional additive relationships, G = genomic relationships

Genex / CRI, June 2007 (17) P.M. VanRaden200
7
Bulls to GenotypeBulls to Genotype58,533 SNP Project58,533 SNP Project
Choose HO bulls with semen at BFGL
Genotype 1777 proven bulls• Born 1994-1996 with >75% REL NM• Plus 172 ancestor bulls born 1952-1993
Predict 500 bulls sampled later• Born 2001 with >75% REL NM
Include other bulls in gap years?• Born 1997-2000 (proven) or >2002 (waiting)

Genex / CRI, June 2007 (18) P.M. VanRaden200
7
Birth Years of Bulls to GenotypeBirth Years of Bulls to Genotype
0
400
800
1200
1990 1994 1998 2002 2006
Nu
mb
er
of
Bu
lls
ancestors
proven
predicted
calves
Data cutoff
Genex / CRI, June 2007 (19) P.M. VanRaden200
7
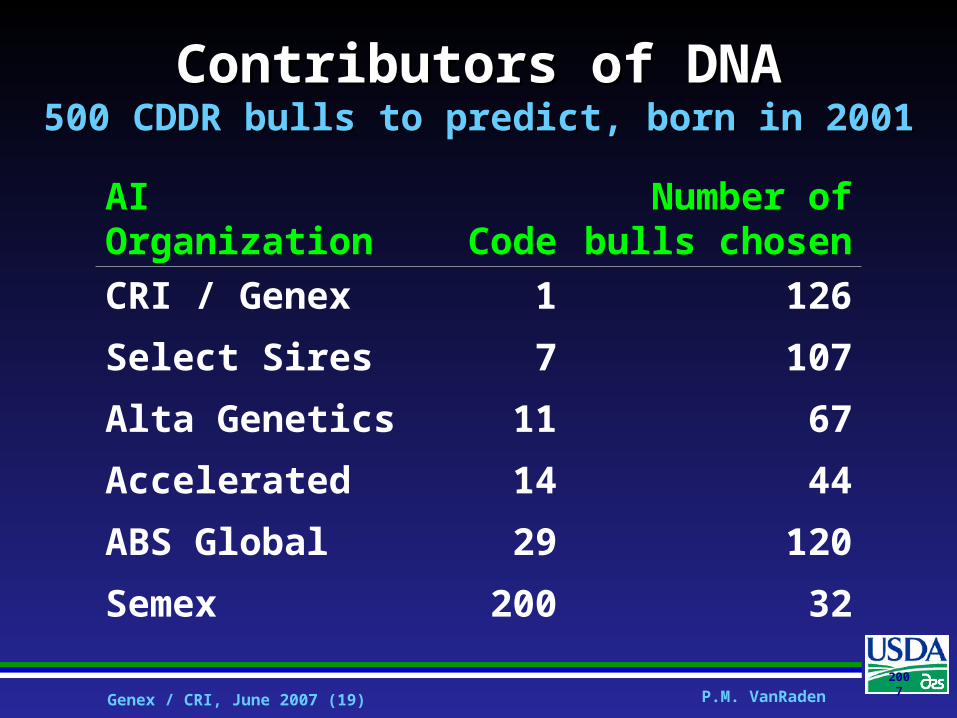
Contributors of DNAContributors of DNA500 CDDR bulls to predict, born in 2001500 CDDR bulls to predict, born in 2001
AI Organization CodeNumber of
bulls chosen
CRI / Genex 1 126
Select Sires 7 107
Alta Genetics 11 67
Accelerated 14 44
ABS Global 29 120
Semex 200 32

Genex / CRI, June 2007 (20) P.M. VanRaden200
7
Potential ResultsPotential ResultsSimulation of 50,000 SNPsSimulation of 50,000 SNPs
QTLs normally distributed, n = 100 Reliability vs parent average REL
• 58% vs 36% if QTLs are between SNPs
• 71% vs 36% if QTLs are located at SNPs (not likely)
• Higher REL if major loci and Bayesian methods used, lower if many loci (>100) affect trait

Genex / CRI, June 2007 (21) P.M. VanRaden200
7
Reliability from GenotypingReliability from Genotyping
Daughter equivalents• DETotal = DEPA + DEProg + DEY + DEG
• DEG is additional DE from genotype• REL = DEtotal / (DETotal + k)
Gains in reliability• DEG could be about 15 for Net Merit• More for traits with low heritability• Less for traits with high heritability
Genex / CRI, June 2007 (22) P.M. VanRaden200
7
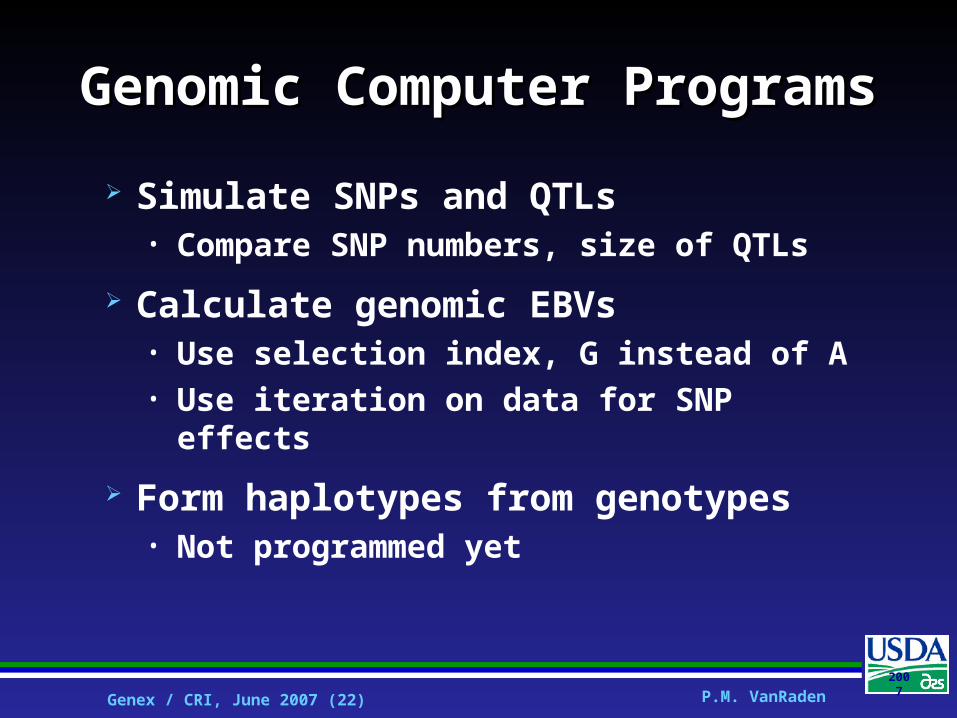
Genomic Computer ProgramsGenomic Computer Programs
Simulate SNPs and QTLs• Compare SNP numbers, size of QTLs
Calculate genomic EBVs • Use selection index, G instead of A• Use iteration on data for SNP effects
Form haplotypes from genotypes• Not programmed yet

Genex / CRI, June 2007 (23) P.M. VanRaden200
7
Computing TimesComputing Times
Inversion including G matrix• Animals2 x markers to form G matrix• Animals3 to invert selection index• 10 hours for 3000 bulls, 50,000 SNPs
Iteration on genotype data• Markers x animals x iterations• 16 hours for 1000 iterations

Genex / CRI, June 2007 (24) P.M. VanRaden200
7
Distribution of Marker EffectsDistribution of Marker Effects
0
0.02
0.04
0.06
0.08
0.1
0.12
0.14
-6 -5 -4 -3 -2 -1 0 1 2 3 4 5 6
Standardized Marker Deviation
Prob
abili
ty
Error
QTL + Error

Genex / CRI, June 2007 (25) P.M. VanRaden200
7
Linear vs Non-linear ModelsLinear vs Non-linear Models
-0.4
-0.3
-0.2
-0.1
0
0.1
0.2
0.3
0.4
-6 -5 -4 -3 -2 -1 0 1 2 3 4 5 6
Standardized Marker Deviation
QTL
Est
imat
e
Bayesian
Linear
Genex / CRI, June 2007 (26) P.M. VanRaden200
7
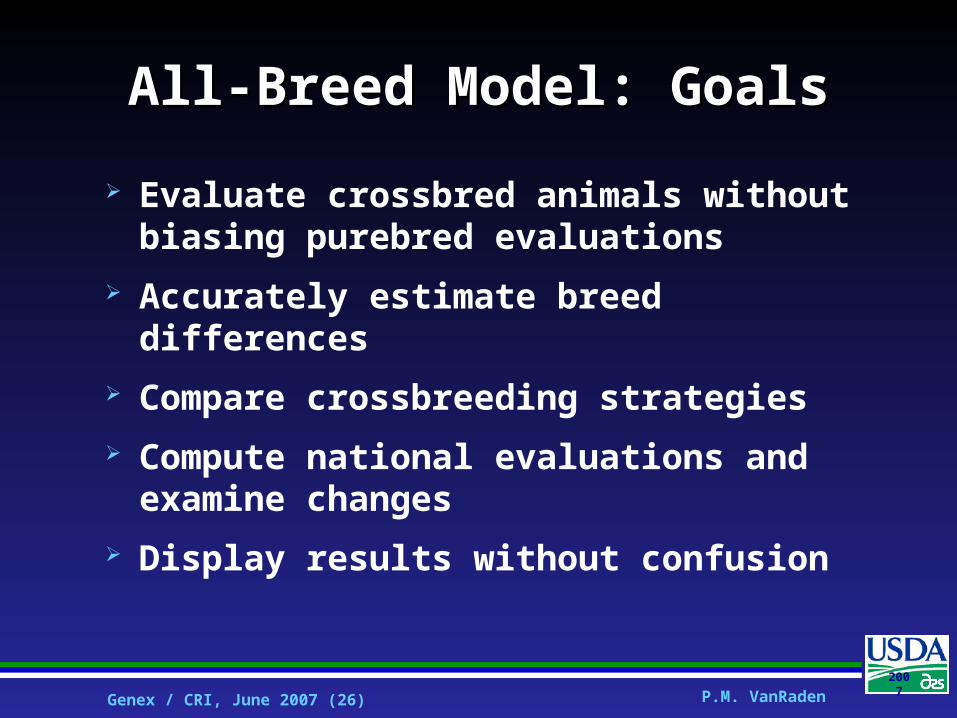
All-Breed Model: GoalsAll-Breed Model: Goals
Evaluate crossbred animals without biasing purebred evaluations
Accurately estimate breed differences
Compare crossbreeding strategies
Compute national evaluations and examine changes
Display results without confusion

Genex / CRI, June 2007 (27) P.M. VanRaden200
7
MethodsMethods
All-breed animal model• Purebreds and crossbreds together• Relationship matrix among all• Unknown parents grouped by breed• Variance adjustments by breed• Age adjust to 36 months, not mature
Within-breed-of-sire model examined but not used

Genex / CRI, June 2007 (28) P.M. VanRaden200
7
DataData
Numbers of cows of all breeds• 22.6 million for milk and fat • 16.1 million for protein• 22.5 million for productive life• 19.9 million for daughter pregnancy rate• 10.5 million for somatic cell score
Type traits are still collected and evaluated in separate breed files

Genex / CRI, June 2007 (29) P.M. VanRaden200
7
Purebred and Crossbred DataPurebred and Crossbred DataUSA milk yield recordsUSA milk yield records
Breed % of total Cows born 2003
Holstein 90.5 642,354
Jersey 6.4 45,151
Brown Swiss .8 5,960
Guernsey .4 2,563
Ayrshire .3 1,926
F1 Crossbred 1.2 8,647
Genex / CRI, June 2007 (30) P.M. VanRaden200
7
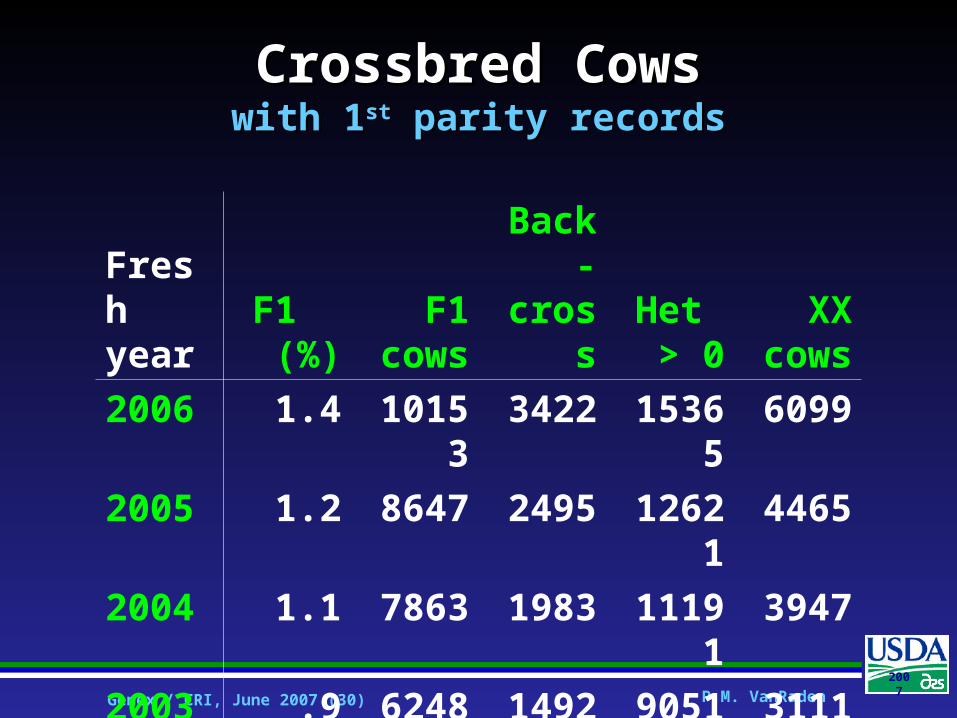
Crossbred CowsCrossbred Cowswith 1with 1stst parity records parity records
Fresh year
F1 (%)
F1 cows
Back-cross
Het > 0
XX cows
2006 1.4 10153 3422 15365 6099
2005 1.2 8647 2495 12621 4465
2004 1.1 7863 1983 11191 3947
2003 .9 6248 1492 9051 3111
2002 .7 4689 1467 7338 2564

Genex / CRI, June 2007 (31) P.M. VanRaden200
7
Number of Cows with RecordsNumber of Cows with Records (with > 50% heterosis; March 2007)
Dam Sire Breed
Breed AY BS GU JE MS XX HO
AY — 29 29 221 48 43 1796
BS 20 — 50 294 42 13 2619
GU 46 96 — 288 32 16 3256
JE 181 357 155 — 116 56 3718
MS 281 52 10 71 — 5 965
XX 489 1544 308 3568 323 — 8859
HO 1843 13993 1721 35193 1858 675 —

Genex / CRI, June 2007 (32) P.M. VanRaden200
7
Number of Cows with RecordsNumber of Cows with Records (with > 50% heterosis; March 2007)
Sire Breed
Dam Breed #
Sire Breed
Dam Breed #
BS SM 25 HO DL 47
DL HO 109 HO LD 195
MO HO 73 HO MI 60
NO HO 38 HO NR 21
NR HO 23 HO RE 22
SR HO 118 HO SM 16
Genex / CRI, June 2007 (33) P.M. VanRaden200
7
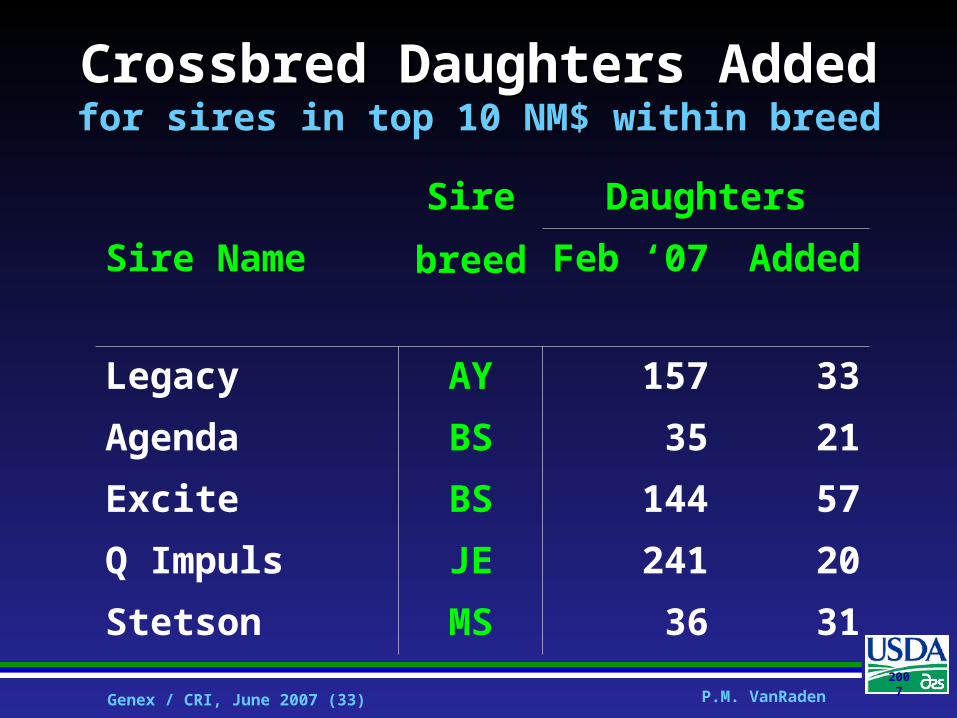
Crossbred Daughters AddedCrossbred Daughters Addedfor sires in top 10 NM$ within breedfor sires in top 10 NM$ within breed
Sire
breed
Daughters
Sire Name Feb ‘07 Added
Legacy AY 157 33
Agenda BS 35 21
Excite BS 144 57
Q Impuls JE 241 20
Stetson MS 36 31

Genex / CRI, June 2007 (34) P.M. VanRaden200
7
Heterosis for Yield TraitsHeterosis for Yield Traits Percent of Parent Breed Average
Milk Fat Protein
BreedHO Sire
HO Dam
HO Sire
HO Dam
HO Sire
HO Dam
Ayrshire 2.4 -2.0 2.7 -1.8 2.9 -2.4
Brown Swiss 5.6 3.2 4.8 4.5 4.7 3.8
Guernsey 5.2 2.4 7.1 4.4 5.5 4.0
Jersey 7.5 1.6 6.6 4.5 7.2 4.1
M. Shorthrn 2.8 0.3 3.2 1.3 3.6 1.2
Heterosis 3.4 4.4 4.1
Genex / CRI, June 2007 (35) P.M. VanRaden200
7
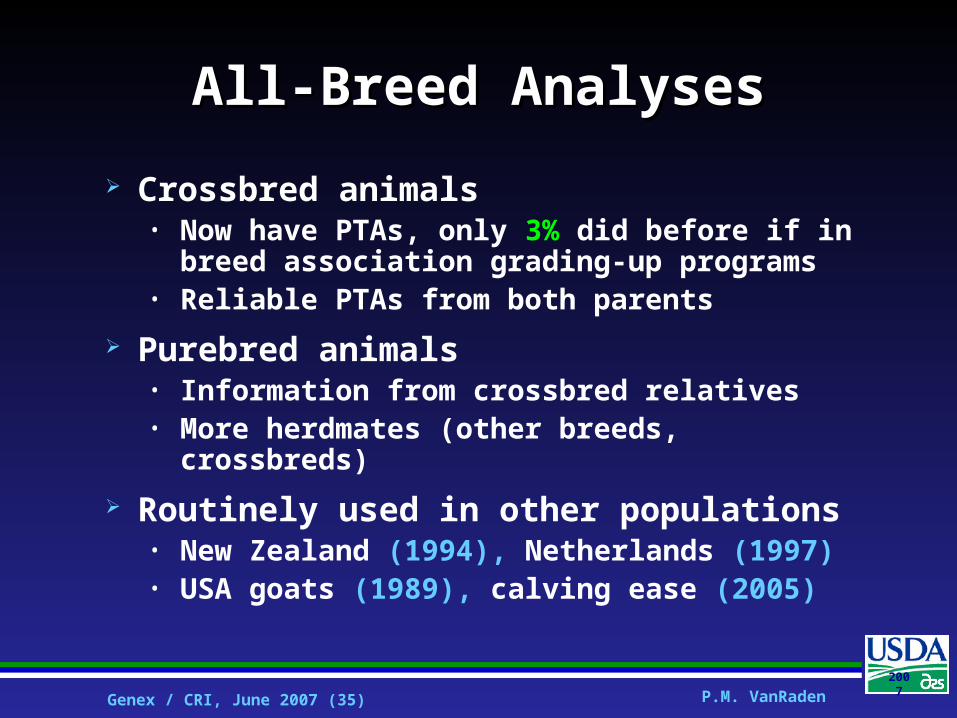
All-Breed AnalysesAll-Breed Analyses
Crossbred animals• Now have PTAs, only 3% did before if in
breed association grading-up programs• Reliable PTAs from both parents
Purebred animals• Information from crossbred relatives• More herdmates (other breeds, crossbreds)
Routinely used in other populations• New Zealand (1994), Netherlands (1997)• USA goats (1989), calving ease (2005)
Genex / CRI, June 2007 (36) P.M. VanRaden200
7
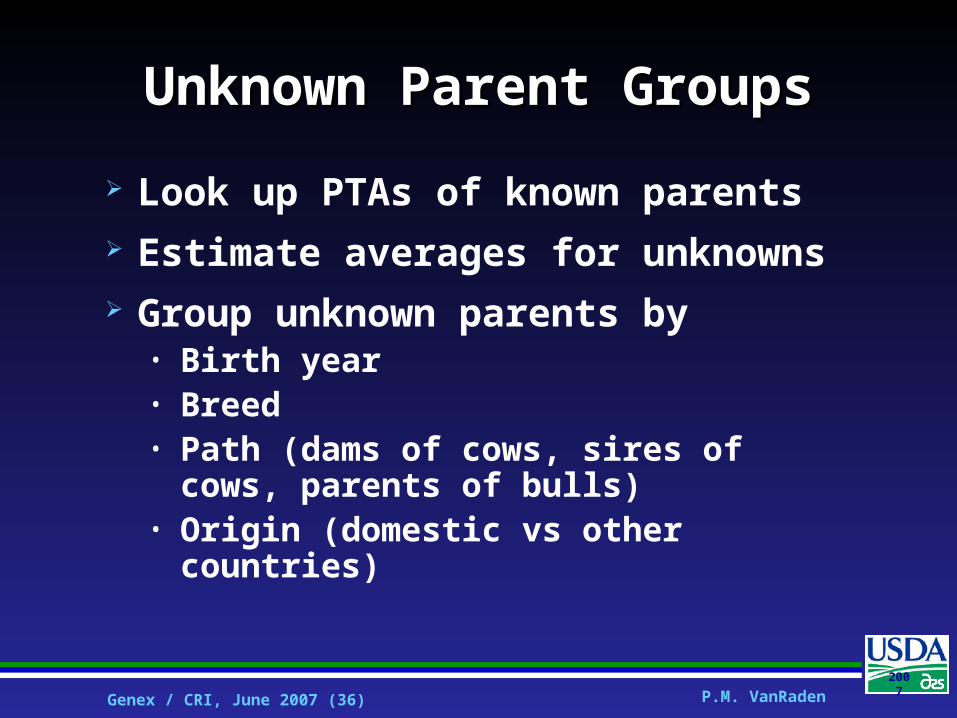
Unknown Parent GroupsUnknown Parent Groups
Look up PTAs of known parents Estimate averages for unknowns Group unknown parents by
• Birth year • Breed • Path (dams of cows, sires of cows,
parents of bulls)• Origin (domestic vs other countries)

Genex / CRI, June 2007 (37) P.M. VanRaden200
7
All- vs Within-Breed EvaluationsAll- vs Within-Breed EvaluationsCorrelations of PTA MilkCorrelations of PTA Milk
Breed99% REL bulls
Recent bulls
Recent cows
Holstein >.999 .994 .989Jersey .997 .988 .972Brown Swiss .990 .960 .942Guernsey .991 .988 .969Ayrshire .990 .963 .943
Milking Shorthorn .997 .986 .947

Genex / CRI, June 2007 (38) P.M. VanRaden200
7
Display of PTAsDisplay of PTAs
Genetic base• Convert all-breed base to within-breed
bases (or vice versa)• PTAbrd = (PTAall – meanbrd) SDbrd/SDHO
• PTAall = PTAbrd (SDHO/SDbrd) + meanbrd
Heterosis and inbreeding• Both effects removed in the animal model• Heterosis added to crossbred animal PTA• Expected Future Inbreeding (EFI) and merit
differ with mate breed
Genex / CRI, June 2007 (39) P.M. VanRaden200
7
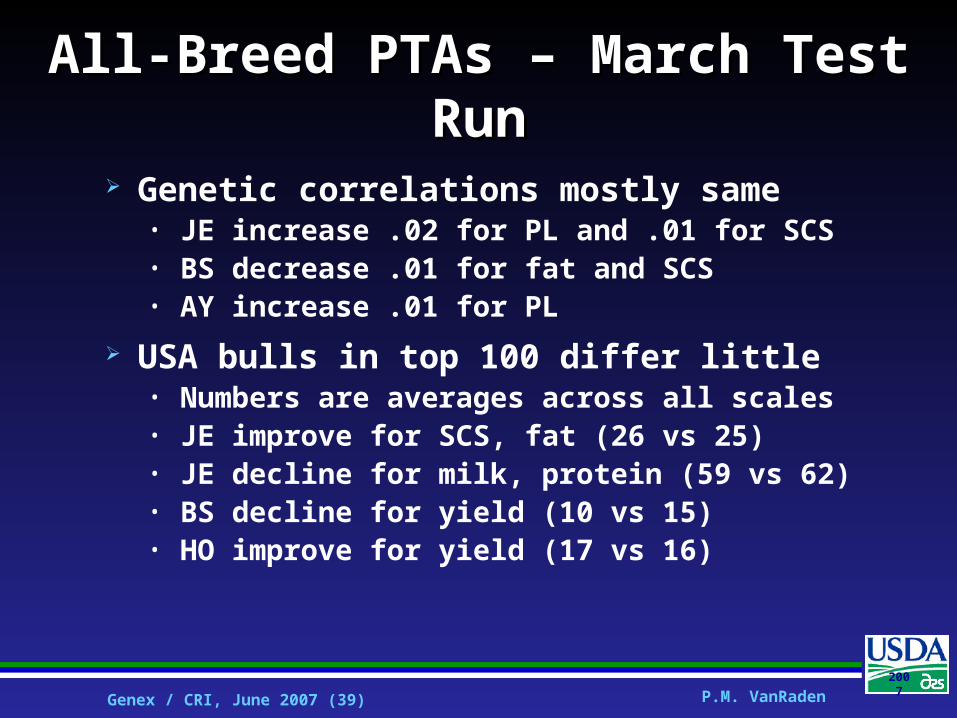
All-Breed PTAs – March Test RunAll-Breed PTAs – March Test Run
Genetic correlations mostly same• JE increase .02 for PL and .01 for SCS• BS decrease .01 for fat and SCS• AY increase .01 for PL
USA bulls in top 100 differ little• Numbers are averages across all scales• JE improve for SCS, fat (26 vs 25)• JE decline for milk, protein (59 vs 62)• BS decline for yield (10 vs 15)• HO improve for yield (17 vs 16)

Genex / CRI, June 2007 (40) P.M. VanRaden200
7
Jersey and Swiss PTAsJersey and Swiss PTAs
Base cow means changed little
Base cow SD changed little
Top bulls for protein dropped by ~9 lbs, bottom bulls dropped by ~4 lbs in both breeds
Unknown parent grouping, heterosis may be responsible

Genex / CRI, June 2007 (41) P.M. VanRaden200
7
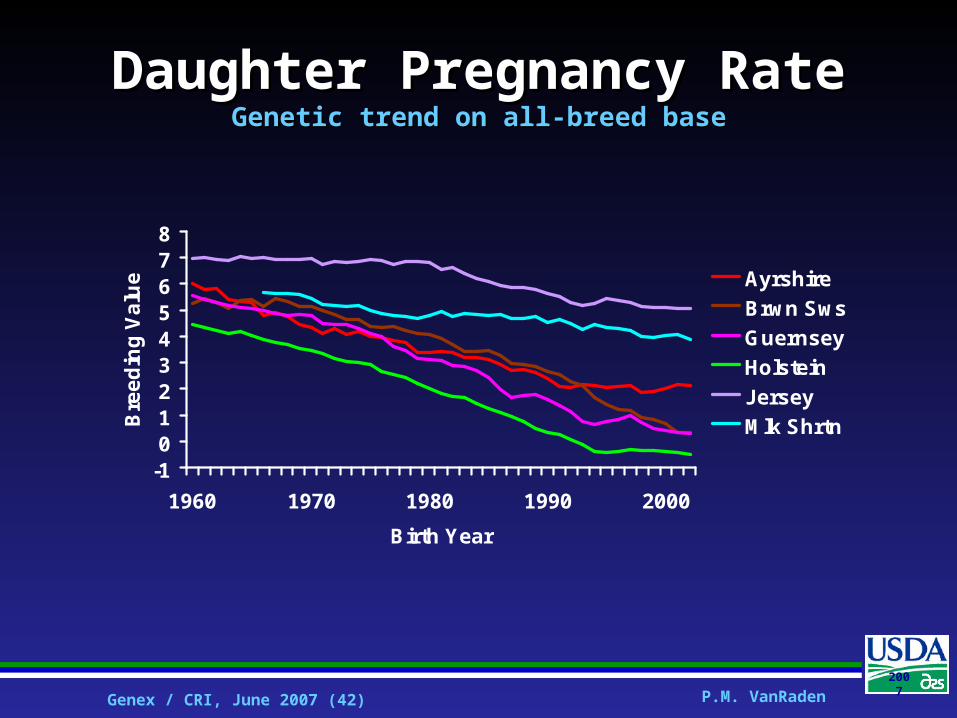
All-breed Trend ValidationAll-breed Trend Validation
85 tests, 6 were significant (.05)• None significant for milk or SCS• 1 of 15 for fat and for protein• 2 of 15 for PL and for DPR
Increase in DPR repeatability made trend more negative, helped tests
Genex / CRI, June 2007 (42) P.M. VanRaden200
7
Daughter Pregnancy RateDaughter Pregnancy RateGenetic trend on all-breed baseGenetic trend on all-breed base
-1012345678
1960 1970 1980 1990 2000
Birth Year
Bre
ed
ing
Va
lue Ayrshire
Brwn Sws
Guernsey
Holstein
Jersey
Mlk Shrtn
Genex / CRI, June 2007 (43) P.M. VanRaden200
7
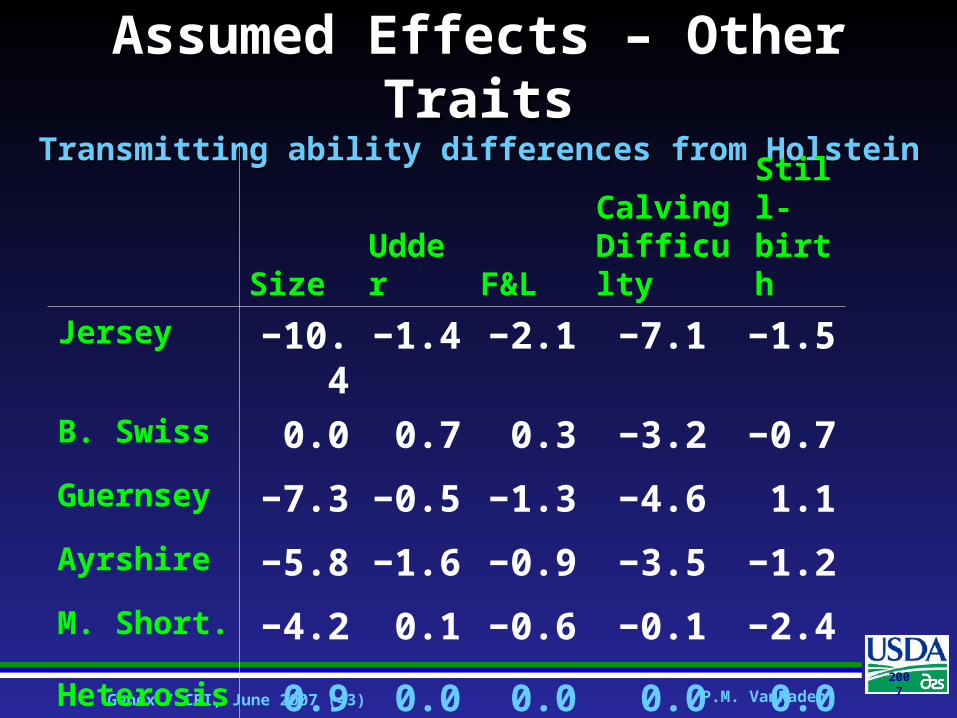
Assumed Effects – Other TraitsAssumed Effects – Other TraitsTransmitting ability differences from HolsteinTransmitting ability differences from Holstein
Size Udder F&LCalving Difficulty
Still-birth
Jersey −10.4 −1.4 −2.1 −7.1 −1.5
B. Swiss 0.0 0.7 0.3 −3.2 −0.7
Guernsey −7.3 −0.5 −1.3 −4.6 1.1
Ayrshire −5.8 −1.6 −0.9 −3.5 −1.2
M. Short. −4.2 0.1 −0.6 −0.1 −2.4
Heterosis 0.9 0.0 0.0 0.0 0.0

Genex / CRI, June 2007 (44) P.M. VanRaden200
7
Merit of FMerit of F11 Holstein Crossbreds Holstein Crossbreds2006 Merit Indexes2006 Merit Indexes
Second Breed NM$ CM$ FM$
Ayrshire −304 −261 −364
Brown Swiss 55 139 −78
Guernsey −408 −405 −503
Jersey 31 153 −158
M. Shorthorn −498 −461 −547
Compared to 2005 genetic base for Holstein
Genex / CRI, June 2007 (45) P.M. VanRaden200
7
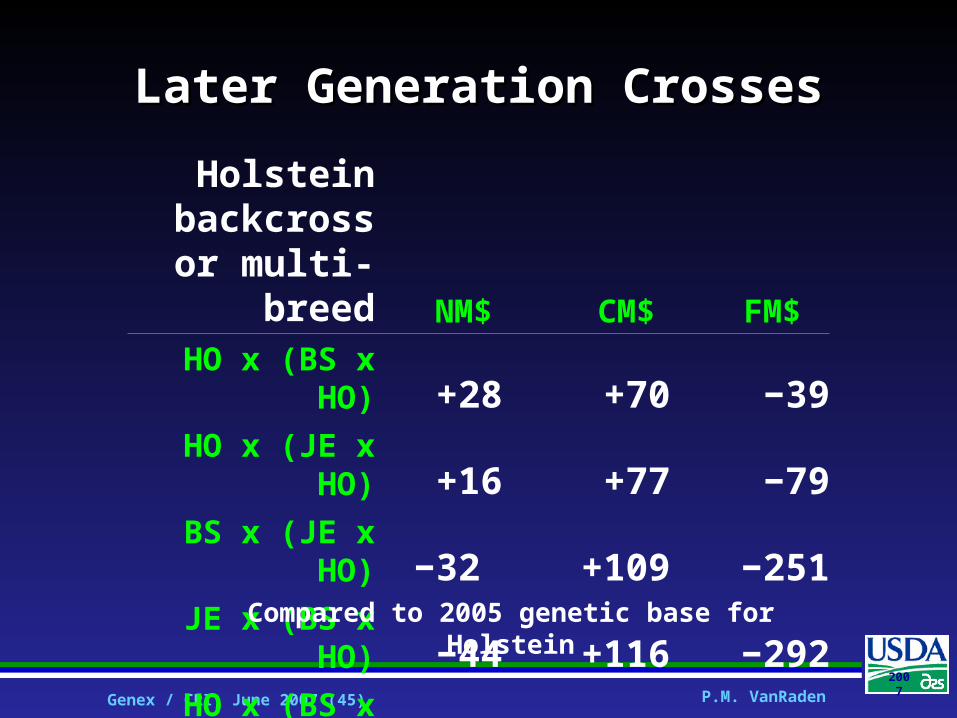
Later Generation CrossesLater Generation Crosses
Holstein backcross or
multi-breed NM$ CM$ FM$
HO x (BS x HO) +28 +70 −39
HO x (JE x HO) +16 +77 −79
BS x (JE x HO) −32 +109 −251
JE x (BS x HO) −44 +116 −292
HO x (BS x JE) +44 +147 −118
Compared to 2005 genetic base for Holstein

Genex / CRI, June 2007 (46) P.M. VanRaden200
7
Butterfat yield of three breed crosses was greater than from their F1 crossbred dams.
Three breed crosses averaged 14,927 pounds of milk and 641 pounds of butterfat as 2-year-olds in 1947.
USDA Yearbook of Agriculture 1947Three-Breed CrossesThree-Breed Crosses
Genex / CRI, June 2007 (47) P.M. VanRaden200
7
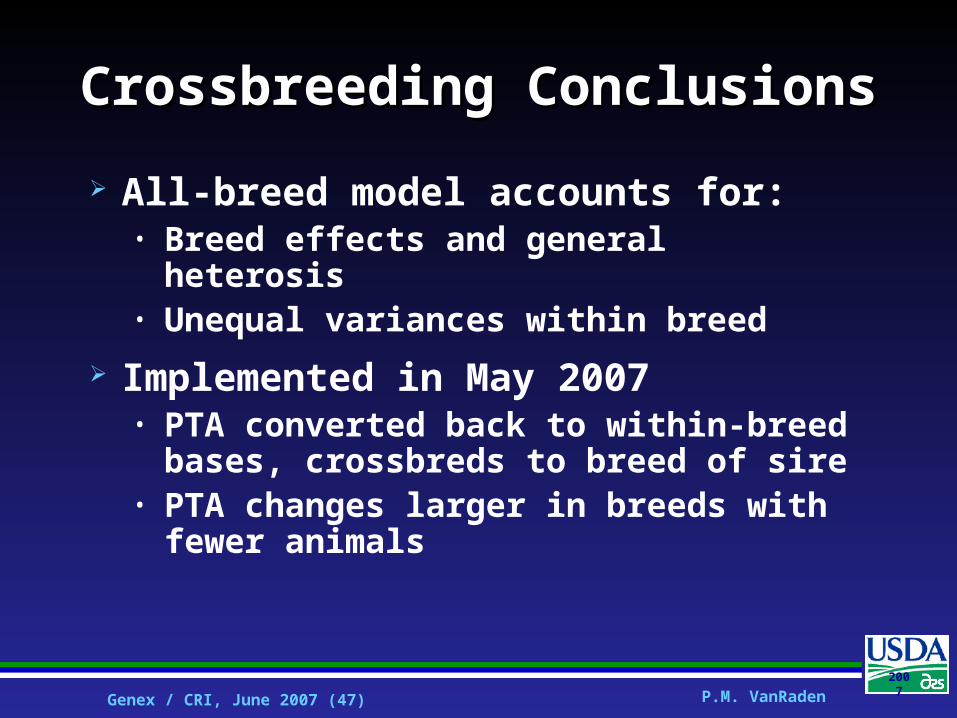
Crossbreeding ConclusionsCrossbreeding Conclusions
All-breed model accounts for:• Breed effects and general heterosis• Unequal variances within breed
Implemented in May 2007• PTA converted back to within-breed
bases, crossbreds to breed of sire• PTA changes larger in breeds with
fewer animals

Genex / CRI, June 2007 (48) P.M. VanRaden200
7
Cow Fertility ResearchCow Fertility Research
Daughter Pregnancy Rate works well, except that• Other traits are evaluated by Interbull• Other countries don’t use DPR in
their indexes, and their calving interval data comes too late
Synchronization changes traits

Genex / CRI, June 2007 (49) P.M. VanRaden200
7
Emphasis on Fertility, LongevityEmphasis on Fertility, Longevity(% of total merit)(% of total merit)
Ctry Fert Long Ctry Fert Long
USA 9 17 DNK 8 6
DEU 1 25 AUS 9 8
NLD 8 16 NZL 7 6
FRA 13 13 GBR 7 15
CAN 5 7 SWE 15 5
ITA 8 IRL 22 18
Genex / CRI, June 2007 (50) P.M. VanRaden200
7
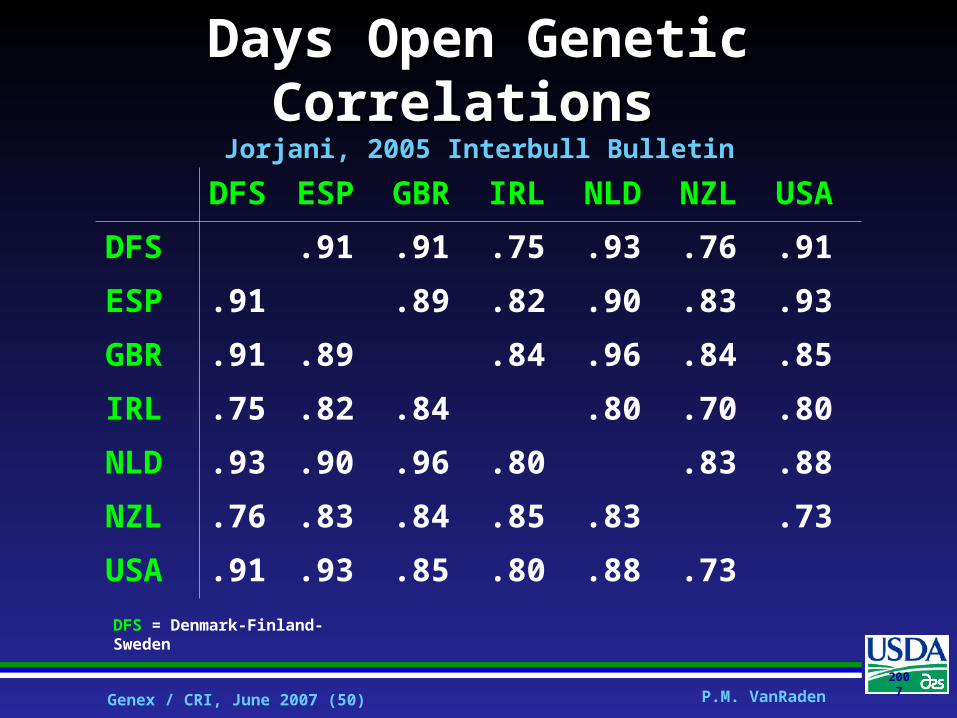
Days Open Genetic Correlations Days Open Genetic Correlations Jorjani, 2005 Interbull BulletinJorjani, 2005 Interbull Bulletin
DFS ESP GBR IRL NLD NZL USA
DFS .91 .91 .75 .93 .76 .91
ESP .91 .89 .82 .90 .83 .93
GBR .91 .89 .84 .96 .84 .85
IRL .75 .82 .84 .80 .70 .80
NLD .93 .90 .96 .80 .83 .88
NZL .76 .83 .84 .85 .83 .73
USA .91 .93 .85 .80 .88 .73
DFS = Denmark-Finland-Sweden

Genex / CRI, June 2007 (51) P.M. VanRaden200
7
DPR Results – March Test Run DPR Results – March Test Run Holstein genetic correlationsHolstein genetic correlations
Eval Model BEL DFS ESP GBR IRL ITA NLD NZL
MarAll breed 86 89 93 83 76 90 86 62
FebWithin breed 85 … 93 83 72 86 85 60
Diff +1 … 0 0 +4 +4 +1 +2
March model also included an increase in repeatability
Genex / CRI, June 2007 (52) P.M. VanRaden200
7
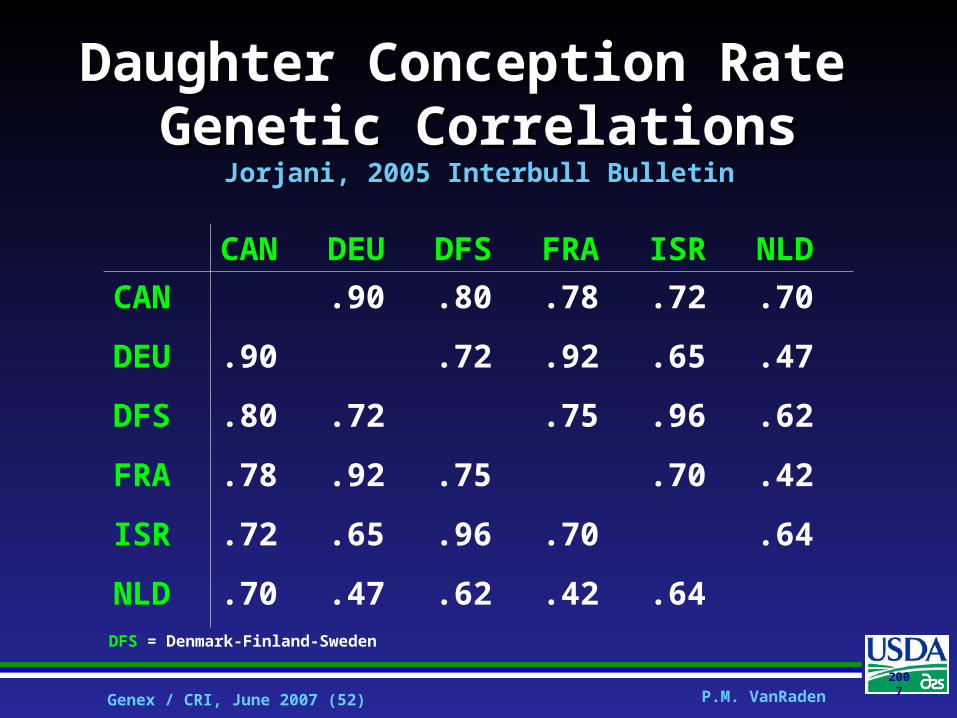
Daughter Conception Rate Daughter Conception Rate Genetic CorrelationsGenetic Correlations
Jorjani, 2005 Interbull BulletinJorjani, 2005 Interbull Bulletin
CAN DEU DFS FRA ISR NLD
CAN .90 .80 .78 .72 .70
DEU .90 .72 .92 .65 .47
DFS .80 .72 .75 .96 .62
FRA .78 .92 .75 .70 .42
ISR .72 .65 .96 .70 .64
NLD .70 .47 .62 .42 .64DFS = Denmark-Finland-Sweden

Genex / CRI, June 2007 (53) P.M. VanRaden200
7
Days to 1Days to 1stst Insemination Insemination Genetic CorrelationsGenetic Correlations
Interbull, May 2007Interbull, May 2007
CHE DFS ITA NLD NZL
CHE .95 .87 .90 .61
DFS .95 .90 .91 .57
ITA .87 .90 .86 .70
NLD .90 .91 .86 .55
NZL .61 .57 .70 .55
DFS = Denmark-Finland-Sweden

Genex / CRI, June 2007 (54) P.M. VanRaden200
7
Fertility Trait IndexesFertility Trait Indexes% relative emphasis% relative emphasis
Trait USA NLD ITA CAN DNK1 DEU FRA
Days 1st Insem.
69 33 19 25 15
Non− Return
31 41 20 65 70 100 100
Days Open
100 26 61
Heifer fertility
10 15
1Time from first to last insemination replaces non−return rate
Genex / CRI, June 2007 (55) P.M. VanRaden200
7
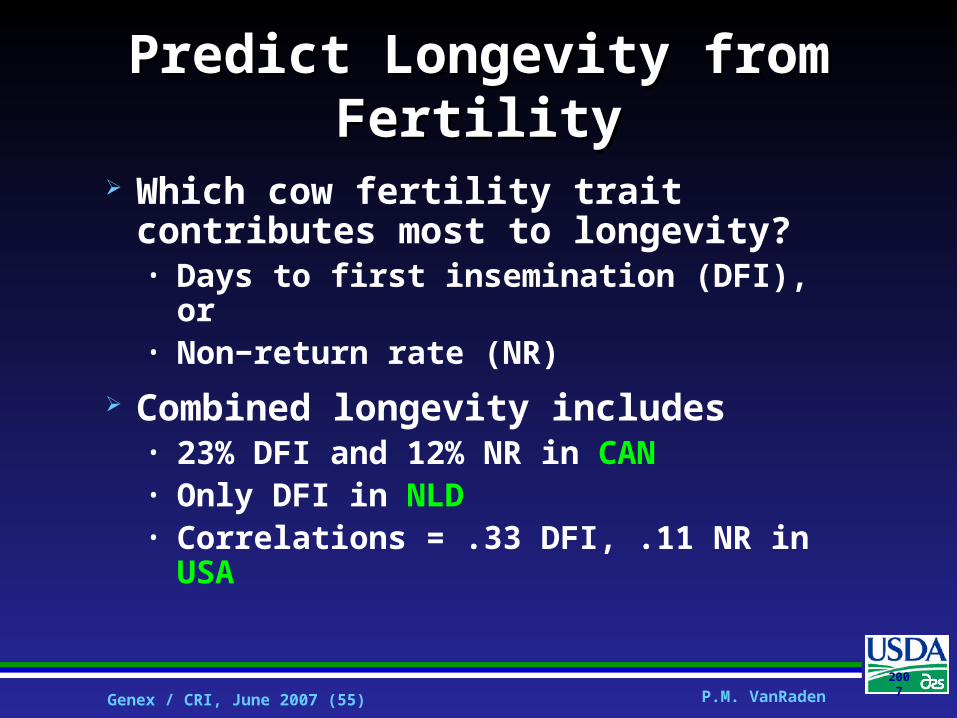
Predict Longevity from FertilityPredict Longevity from Fertility
Which cow fertility trait contributes most to longevity?• Days to first insemination (DFI), or• Non−return rate (NR)
Combined longevity includes• 23% DFI and 12% NR in CAN• Only DFI in NLD• Correlations = .33 DFI, .11 NR in USA
Genex / CRI, June 2007 (56) P.M. VanRaden200
7
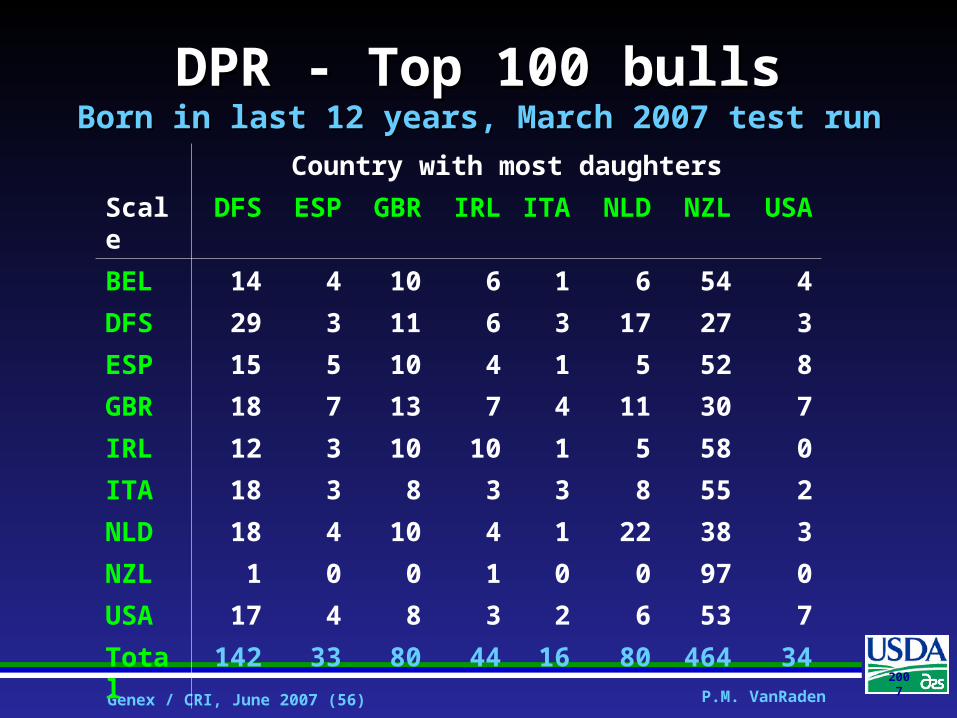
DPR - Top 100 bullsDPR - Top 100 bullsBorn in last 12 years, March 2007 test runBorn in last 12 years, March 2007 test run
Country with most daughters
Scale DFS ESP GBR IRL ITA NLD NZL USA
BEL 14 4 10 6 1 6 54 4
DFS 29 3 11 6 3 17 27 3
ESP 15 5 10 4 1 5 52 8
GBR 18 7 13 7 4 11 30 7
IRL 12 3 10 10 1 5 58 0
ITA 18 3 8 3 3 8 55 2
NLD 18 4 10 4 1 22 38 3
NZL 1 0 0 1 0 0 97 0
USA 17 4 8 3 2 6 53 7
Total 142 33 80 44 16 80 464 34

Genex / CRI, June 2007 (57) P.M. VanRaden200
7
Calving Interval CorrelationsCalving Interval Correlationswith other traits in the same countrywith other traits in the same country
Ctry Birth Milk Fat Prot Long SCS
DNK −.40 −.31 −.28 −.32 .34 −.18
ESP −.08 −.38 −.29 −.35 .38 −.16
GBR −.27 −.36 −.36 −.42 .30 −.13
IRL −.20 −.40 −.35 −.37 .49
NLD −.41 −.52 −.43 −.50 .06 −.13
NZL −.11 −.32 −.05 −.21 .59 −.10
USA −.04 −.21 −.21 −.17 .48 −.12
Genex / CRI, June 2007 (58) P.M. VanRaden200
7
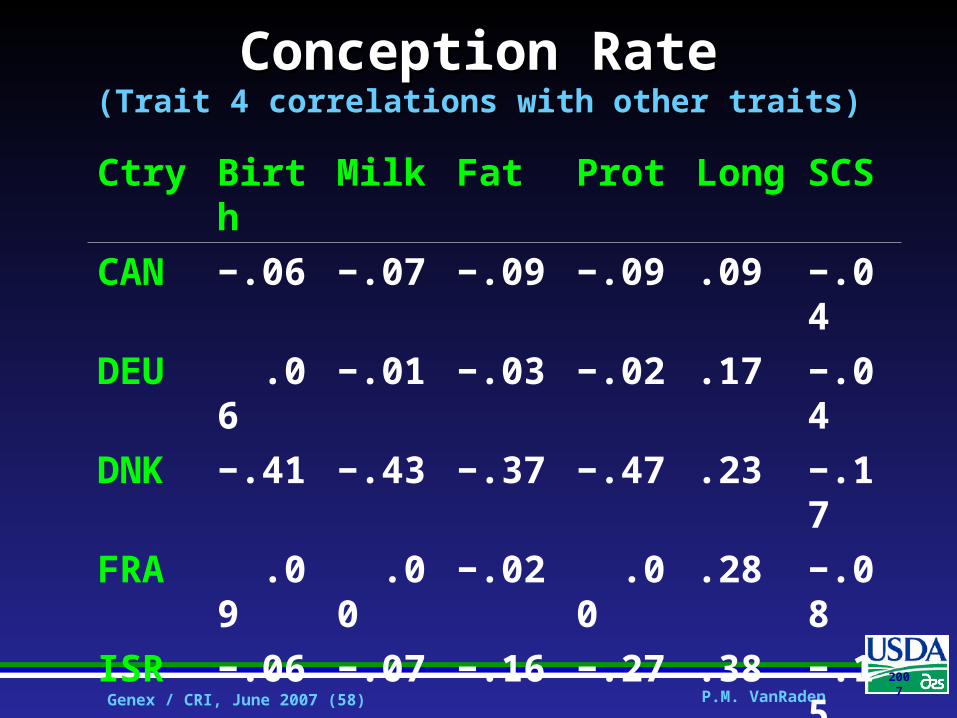
Conception RateConception Rate(Trait 4 correlations with other traits)(Trait 4 correlations with other traits)
Ctry Birth Milk Fat Prot Long SCS
CAN −.06 −.07 −.09 −.09 .09 −.04
DEU .06 −.01 −.03 −.02 .17 −.04
DNK −.41 −.43 −.37 −.47 .23 −.17
FRA .09 .00 −.02 .00 .28 −.08
ISR −.06 −.07 −.16 −.27 .38 −.15
NLD −.41 −.39 −.37 −.48 .08 −.04
Genex / CRI, June 2007 (59) P.M. VanRaden200
7
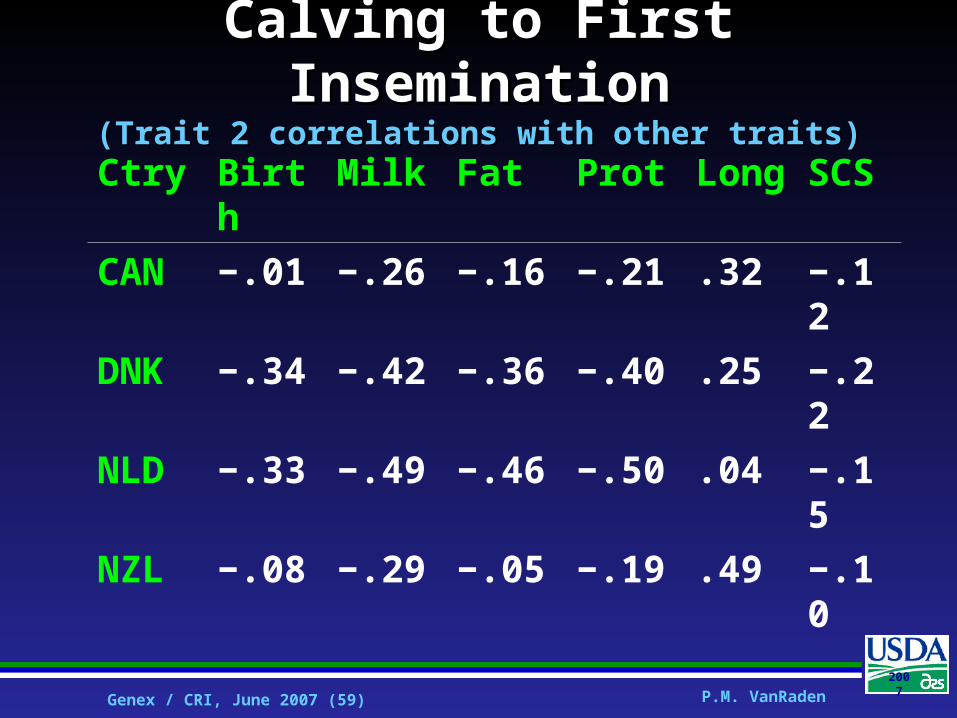
Calving to First InseminationCalving to First Insemination(Trait 2 correlations with other traits)(Trait 2 correlations with other traits)
Ctry Birth Milk Fat Prot Long SCS
CAN −.01 −.26 −.16 −.21 .32 −.12
DNK −.34 −.42 −.36 −.40 .25 −.22
NLD −.33 −.49 −.46 −.50 .04 −.15
NZL −.08 −.29 −.05 −.19 .49 −.10

Genex / CRI, June 2007 (60) P.M. VanRaden200
7
Heifer FertilityHeifer Fertility(Trait 1 correlations with other traits)(Trait 1 correlations with other traits)
Ctry Birth Milk Fat Prot Long SCS
CAN −.09 −.11 −.09 −.14 .14 −.10
DNK −.27 −.23 −.19 −.27 .03 −.05
GBR −.43 −.48 −.22 −.44 .13 −.12

Genex / CRI, June 2007 (61) P.M. VanRaden200
7
Cow Fertility ConclusionsCow Fertility Conclusions
Fertility and longevity receive a total of 8% to 40% of selection
Fertility definitions not uniform
Days to 1st insemination is more important than conception rate?
Selection for fertility reduces costs and increases longevity

Genex / CRI, June 2007 (62) P.M. VanRaden200
7
Bull Fertility ResearchBull Fertility ResearchDr. Melvin KuhnDr. Melvin Kuhn
I. Multiple services and an expanded service sire (SSR) term
II. “Type” of model: Linear, Threshold
III. Unconfirmed breedings: outcome not known with certainty
IV. Edits and Modeling of nuisance variables

Genex / CRI, June 2007 (63) P.M. VanRaden200
7
Service Sire EffectsService Sire Effects
SSR inbreeding
Inbreeding of the Mating
SSR age at mating
Stud and Stud*year
Additive genetic effect (very low heritability)

Genex / CRI, June 2007 (64) P.M. VanRaden200
7
Results: CorrelationsResults: Correlations Services
Method Predictor All 1st onlySimulation Expanded 87.2 81.0
SSR only 83.0 71.4
Split-herd Expanded 56.1 45.5SSR only 44.0 37.5
Future yr Expanded 32.1 29.4SSR only 29.3 23.6
Expd Stud*yr: 38.1 Expd, no Stud*yr: 31.6
Genex / CRI, June 2007 (65) P.M. VanRaden200
7
Linear/Threshold ModelLinear/Threshold ModelConclusions to date:Conclusions to date:
Little, if any, difference in predictions between the 2 models
Use of a good estimate of std. dev. of the predictor in thr model probability calculations may improve thr model evaluations
Threshold/Linear model is, at most and if anything at all, only a minor issue
Linear model will likely be implemented because it is computationally faster, more reliable, and simpler
Genex / CRI, June 2007 (66) P.M. VanRaden200
7
Sexed Semen (S) MatingsSexed Semen (S) Matings 22,843 S-matings reported as of April 2007 92% are Holstein, most of remainder are
Jersey 61% are on heifers (not eligible for ERCR) 69% are 1st services 4,040 ERCR-eligible Holstein S-matings 398 bulls Only 2 bulls with at least 300 ERCR-eligible
S-matings

Genex / CRI, June 2007 (67) P.M. VanRaden200
7
Bull Fertility SummaryBull Fertility Summary Research on use of multiple services and an
expanded service sire term is complete
Linear/Thr model is, at most, of minor importance only for this trait; will likely implement linear model
Expect to delete unconfirmed matings and treat those with positive preg ck as successes but impact will be evaluated
Implementation expected January 2008

Genex / CRI, June 2007 (68) P.M. VanRaden200
7
Test Day Model - Potential BenefitsTest Day Model - Potential Benefits
Increased accuracy of evaluations • Account for lactation curve differences• Account for genetic differences by parity• Evaluate persistency, rate of maturity• Include milk-only records if multi-trait• Possible earlier selection of bull dams• Promote as state-of-the-art system
Management effects more accurate• Could provide to DRPCs and herd owners