2007 measurement technology workshop september 11, 2007 epa update on the development of alternative...
TRANSCRIPT

2007 Measurement Technology Workshop September 11, 2007
EPA Update on the Development of Alternative Reference Methods
for Mercuryand
Testing Equipment
Jeff Ryan
US EPA ORD
(919) 933-2998

Topics
• Method 30A (IRM) approach• IRM field testing• Development of IRM equipment• Method 30B (sorbent trap) approach • Sorbent Trap RM laboratory and field testing

Overall Approach to New RMs …
• Performance-based• Test program-specific (site) and matrix-
specific performance verification• Use of “Method of Standard Addition” for
matrix-specific performance verification Gaseous dynamic spiking for IRM Gaseous static spiking for STRM

Method 30A - Mercury Instrumental Reference Method (IRM)
• Timely (real-time)• Performance-based
Amenable to multiple and new technologies Site/Test program-specific verification of data quality FR Notice of Intent (62 FR 52098, 10/6/97)
• Consistent w/ SOx & NOx instrumental methods• Key elements
Interference test (optional) Calibration error/linearity (Hg0) System integrity/drift (HgCl2) System response time Dynamic spiking (HgCl2)

Dynamic Spiking
• Nothing new• Included in revisions to Methods 6C and 7E (optional)• Gaseous method of “standard addition”
• Introduce known quantities of HgCl2 into probe sampling stack gas
• Spike flow minor (<20%) relative to sample flow• Requires knowing sample flow rate or dilution ratio

Lehigh Univ. Field Test
• Implement Conceptual (2/28/06) IRM on 4 available systems
• Use one common set of Hg gas standards for our calibrations Vendors still calibrated/configured their systems the way
they wanted
• Determine whether performance criteria pass/fail, but without corrective action – get what we get
• Did not perform Part 75 pre-certification tests, but IRM tests very similar
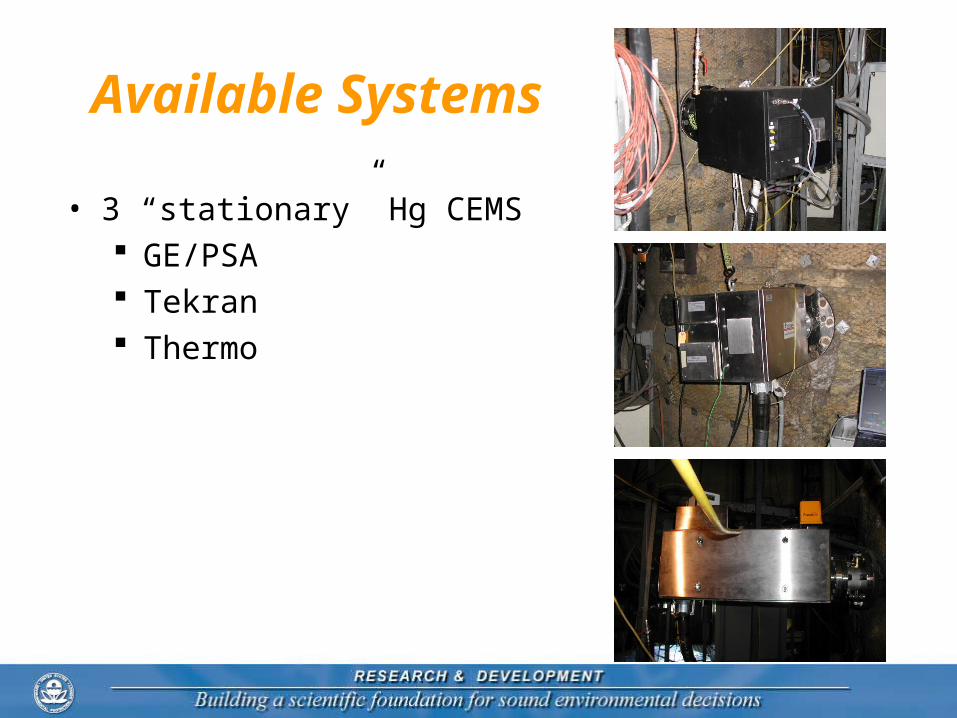
Available Systems
• 3 “stationary” Hg CEMS GE/PSA Tekran Thermo

Available Systems
• 1 “portable” Hg CEMS Ohio Lumex (fixed mount)

Total Hg Measurements, Normalized for Oxidized Cal Error
0
5
10
15
20
25
10-JulAM
10-JulPM
11-JulAM
11-JulPM
12-JulAM
12-JulPM
13-JulAM
13-JulPM
14-JulAM
14-JulPM
15-JulAM
15-JulPM
16-JulAM
16-JulPM
17-JulAM
17-JulPM
Tota
l Hg
Mea
sure
men
t, m
g/m
3
GE/PSA Ohio Lumex Tekran Thermo OHM Average O2 Corrected OH

Total Hg Measurements, Normalized for Drift
0
5
10
15
20
25
10-JulAM
10-JulPM
11-JulAM
11-JulPM
12-JulAM
12-JulPM
13-JulAM
13-JulPM
14-JulAM
14-JulPM
15-JulAM
15-JulPM
16-JulAM
16-JulPM
17-JulAM
17-JulPM
Tota
l Hg
Mea
sure
men
t, m
g/m
3
GE/PSA Tekran Thermo OHM Average O2 Corrected OH

Dynamic Spiking Data Sheet (Drift Corrected)
Facility name: Armstrong Date: 18-Jul-06 Time: 9:12Unit(s) tested: Unit 2 Test personnel: JEB, NFRAnalyzer make & model: Tekran Estimated native Hg concentration: 6.6 mg/m3
Serial number: Estimated unspiked sample flow rate: 48.25 slpmCalibration span 20 mg/m3 Estimated spike gas flow rate: 4.7 slpm
Preliminary DataCtarget C*
spike Selected Expected1
Target (mg/m3) (mg/m3) Cspike Value Css
Level Upper Lower Upper Lower (mg/m3) (mg/m3)High 13.2 11.9 75 61Low 10.6 9.3 47 34
1Calculated from the selected spike gas concentration, using Equation 6
Spiking DataCnative
Target Qprobe Qspike Css (mg/m3)Level (lpm) (lpm) (mg/m3) Pre Post Avg.
48.22 4.66 11.55 5.98 6.5448.08 4.66 11.45 6.54 6.7648.29 4.66 12.97 6.76 7.01
High 48.31 4.67 14.09 7.01 7.4948.42 4.67 14.48 7.49 7.6748.26 4.67 13.80 7.67 7.51
Avg.RSD
48.33 4.66 12.93 7.51 8.4248.34 4.65 12.59 8.42 8.2048.35 4.66 13.05 8.20 8.37
Low 48.23 4.66 13.24 8.37 8.8548.37 4.66 14.04 8.85 9.46
Avg.RSD
8.61
X 94.3% X
69 12.746 10.5
103.80%
103.10%
103.3%0.5%
102.95%
X 93.2% X103.86%
Recovery% Spike
X 104.2% X
7.587.59
6.266.656.897.25
7.978.318.29
X 96.6% X107.17%
X 111.7% X
106.8%2.6%
9.16 109.41%

RATA of Tekran Normalized to Integrity/Drift Checks ------- Arithmetic Means -------
Concentrations corrected to 20°C, wet basis Tekran OH
13.79 12.41 1.38 mg/wsm3
Test Date Times Tekran OH Difference Bias Test: Passed Confidence Coeff. 0.70 mg/wsm3
# mg/wsm3 mg/wsm3 mg/wsm3 Status Factor: 0.90 Relative Accuracy
Arithmetic Mean of all runs 13.97 12.43 1.54 mg/wsm3 Factor: 0.88
mg/wsm3
18.95%
Bias Test: Passed Confidence Coeff. 0.94
Relative Accuracy
20.19 17.76 2.43 mg/wsm3
Runs with Hg
above 10 mg/wsm3 7 ------- Arithmetic Means -------Tekran OH Difference
mg/wsm3
Factor: 0.94 Relative Accuracy 11.63%
Bias Test: Passed Confidence Coeff. 0.44
8.19 7.73 0.46 mg/wsm3
Runs with Hg
below 10 mg/wsm3 8 ------- Arithmetic Means -------Tekran OH Difference
mg/wsm3
Factor: 0.92 Relative Accuracy 13.82%
Bias Test: Passed Confidence Coeff. 0.56
11.61 10.69 0.92 mg/wsm3
Runs included in RA calculation
12 ------- Arithmetic Means -------Tekran OH Difference
Total valid runs 15Difference
16.76%
3 10-Jul 09:33-11:15 16.62
4 10-Jul 14:00-15:38 19.96
5 11-Jul 09:00-10:35 12.99
6 11-Jul 14:00-15:30 20.78
8 12-Jul 14:00-15:37 19.72
9 13-Jul 09:13-10:47 24.77
10 13-Jul 13:55-15:30 22.85
12 14-Jul 14:08-15:45 9.49
13 15-Jul 09:30-11:05 8.22
14 15-Jul 14:00-15:35 7.35
18 17-Jul 14:08-15:46 7.57
12.66 3.96 Discarded
17.29 2.67 Excluded
12.02 0.97 Included
19.28 1.50 Included
Included
17.08 2.64 Included
20.65 4.12 Excluded
0.87 Included
19.98 2.88 Excluded
9.11 0.38 Included
8.73 0.39
0.77 Included
8.14 -0.57 Included
8.25 0.05 Included
15 16-Jul 09:40-11:20
6.9016 16-Jul 13:10-14:48 7.67
7.79
17 17-Jul 09:15-10:52 8.30
18.04 2.20 Included
6.83 0.96 Included
7.38 0.84 Included
6.49
11 14-Jul 09:17-11:02 9.12
7 12-Jul 09:05-10:45 20.24

Study Conclusions …• Not all systems passed all IRM performance
criteria, but all criteria capable of being achieved• For the most part, minimal Hg CEM measurement
biases relative to OHs ( <±10%) Consistent with dynamic spiking recoveries Lack of bias is intended outcome of dynamic spiking
procedure – dynamic spiking served its purpose!• Drift correction of data improved IRM data quality
Consistent with existing methods (7E, 6C)• Test results supportive of proposed Method 30A
performance criteria

Lehigh Tests - Practical Issues …
• Spent significant amount of time trying to perform procedures on analyzers that aren’t optimized for doing IRM Not conducive to dynamic spiking (probe, flow, spiking, etc)
• Test Equipment: Not capable of traversing Required considerable set-up time Certainly not portable!
• IRM-specific test equipment is needed to make Method 30A viable

Current Focus
• Develop IRM-Specific Equipment Simple Portable Practical Traversable Probes Less expensive Working with Multiple Vendors
• Perform Stratification Testing• Perform IRM testing at multiple test sites• Objective: Fully perform (successfully) IRM in
<2 days

Lumex/M&C IRM System

EPA/APEX/PSA/THERMO IRM System

Field Testing Status …
• Well … We’re getting there …• Tracer gas approach works well• Successful dynamic spiking with new probes• Stratification testing still a challenge due to equipment
limitations• Still struggling with equipment issues – All minor yet
annoying Drift Filter Orifice dilution ratio
• Still early in the field testing stage• We’re relying on vendors to develop necessary IRM
equipment for us to test!

• Field data with Appendix K RATA tests very supportive
• Rapid advances of “Thermal” analysis techniques
• Increased understanding of “Wet” analysis techniques
• Reliable Hg0 spiking techniques
Development of Hg Method 30B Sorbent Trap Reference Method

Total Hg Measurements, Sorbent Trap and OHM
0
5
10
15
20
25
30
10-Jul AM 10-Jul PM 11-Jul AM 11-Jul PM 12-Jul AM 12-Jul PM 13-Jul AM 13-Jul PM 14-Jul AM 14-Jul PM 15-Jul AM 15-Jul PM 16-Jul AM 16-Jul PM 17-Jul AM 17-Jul PM
To
tal H
g M
easu
rem
ent,
m
g/m
3
OL Analyzed CAE Analyzed Frontier-FAMS Frontier-M324 OHM Average O2-Corrected OHM
Sorbent Traps vs. OHMSorbent Traps vs. OHM

Method 30B - Sorbent Trap Reference Method for Mercury
• Performance-based Amenable to new sorbents, equipment, and analytical
technologies• Lab verification of sorbent performance and analysis• Site/Test program-specific verification of data quality
• Capability for timely results• Minimization of trap spiking, especially in the field• Description
Known volume of stack gas is sampled through paired, in-stack 2-section sorbent traps (e.g., iodated carbon)
Analysis by any suitable system that can meet performance criteria (e.g., leaching, digestion, thermal desorption/direct combustion coupled with UV AF, UV AA, XRF)

• Key QA Elements Laboratory
• Matrix interference test (for leaching analysis)• Minimum sample mass determination• Analytical bias test
Field (for each test)• Field recovery test (assess bias by static spiking)• Paired train agreement (assess precision)• Trap second section breakthrough
Method 30B - Sorbent Trap Reference Method for Mercury, cont

Approach
• Overall focus is how to determine just how much sample must be collected that can be measured reliably
• Largely about characterizing your analytical capabilities How low can you go? Can you measure accurately at that level? Are there any measurement interferences? How does that compare to your background levels?
• Tests and criteria for characterizing measurement performance

Analytical Tests
• Analytical Matrix Interference Test For “wet” analysis technique only Serial dilution test to determine minimum dilution
ratio (if any) One time

Analytical Tests
• Minimum Sample Mass Determination Purpose is to identify the lowest Hg mass (or
concentration) that you can measure reliably that can be used to target the mass of Hg you need for sampling
• Falls within your calibration curve (≥2x lowest point)
• Factors in liquid sample volumes, sample dilutions, etc.
• Considers your detection limits, trap background levels
• Serves as lower bound for Analytical Bias Test
• Used to estimate target sample collection volumes and run times

Analytical Tests
• Analytical Bias Test Purpose is to confirm that the minimum sample mass
you’ve identified can be measured accurately by your intended analytical technique
Confirm acceptable recovery of Hg0 and HgCl2 Done at two levels that define the lower and upper bound
that actual samples must fall within One time Can expand when needed

Field Testing
• Field Recovery Test Purpose is a test-specific assessment of overall
measurement performance (bias) Based on Field Recovery Test in Method 18 Confirm acceptable recovery of Hg0 from 3 pairs of
spiked/unspiked trains Analogous to dynamic spiking-the static method of
standard addition Potential for Field Recovery Test runs to qualify as
RATA runs too Does not have to be performed before collecting field
samples, but must be successfully performed for each RATA or field test

Field Testing
• Test Runs Use target sample mass, estimated stack concentration
and nominal sample rate to estimate target sample volume and run time
Minimum run time of 30 min For RATA testing, run time relief for stack concentrations
<0.5 µg/m3
Paired train agreement:• ≤10% RD for Hg concentrations >1 µg/m3
• ≤20% RD for Hg concentrations <1 µg/m3 or ≤ 0.2 µg/m3 absolute difference

Sample Analysis• Section 1 analyses must be within valid calibrated range• Sample analyses must be bracketed by valid Continuing
Calibration Verification checks• Section 1 analyses must also be within bounds of
Analytical Bias Test• Sorbent trap Section 2 breakthrough/background
≤10% of Section 1 Hg mass for Hg concentrations >1 µg/m3
≤20% of Section 1 Hg mass for Hg concentrations >1 µg/m3
• Additional guidance for estimating Hg levels below lowest point in calibration Section 2 Section 1 where stack Hg <0.5 µg/m3

Examples and Field Data
• EPA/ORD Thermal Analysis MDL ~1 ng Lowest point in cal curve = 10 ng Minimum sample mass = 20 ng Recoveries within 90-110% for Hg0 and HgCl2 Nominal sample flow rates: 400, 800 cc/min Estimated run time for 0.5 µg/m3 stack Hg @ 400 cc/min
sample rate = 100 min Estimated run time for 0.5 µg/m3 stack Hg @ 800 cc/min
sample rate = 50 min

Field Recovery Tests
• Quad probes, paired spiked/unspiked trains at 400, 800cc/min, 1 hour runs
• Recoveries: avg = 104%, range 97-114%, n = 8• Average stack Hg concentration = 0.79 µg/m3
Average @ 400 cc/min = 0.78 µg/m3
Average @ 800 cc/min = 0.75 µg/m3
Average unspiked = 0.76 µg/m3
Average spike subtracted = 0.81 µg/m3
• RDs: All RDs <10% and < 0.2 µg/m3 absolute dif.• Breakthroughs <2%• Analyses were not performed in the field!

What Should You Know?
• Focus on RM performance criteria Most is consistent with existing RMs Method 30B is largely analytically-oriented
• Guidance and training will come! CAMD training Web sites for guidance documents and lessons
learned Data reports

Questions …
• IRM?• IRM Equipment?• Sorbent Trap RM?• Other?