2007 malt beverage industry packaging trends craft brewers conference san diego, ca april, 19, 2008...
TRANSCRIPT

2007 Malt Beverage Industry Packaging Trends
Craft Brewers ConferenceSan Diego , CAApril, 19, 2008
Lester JonesBeer InstituteWashington, DC
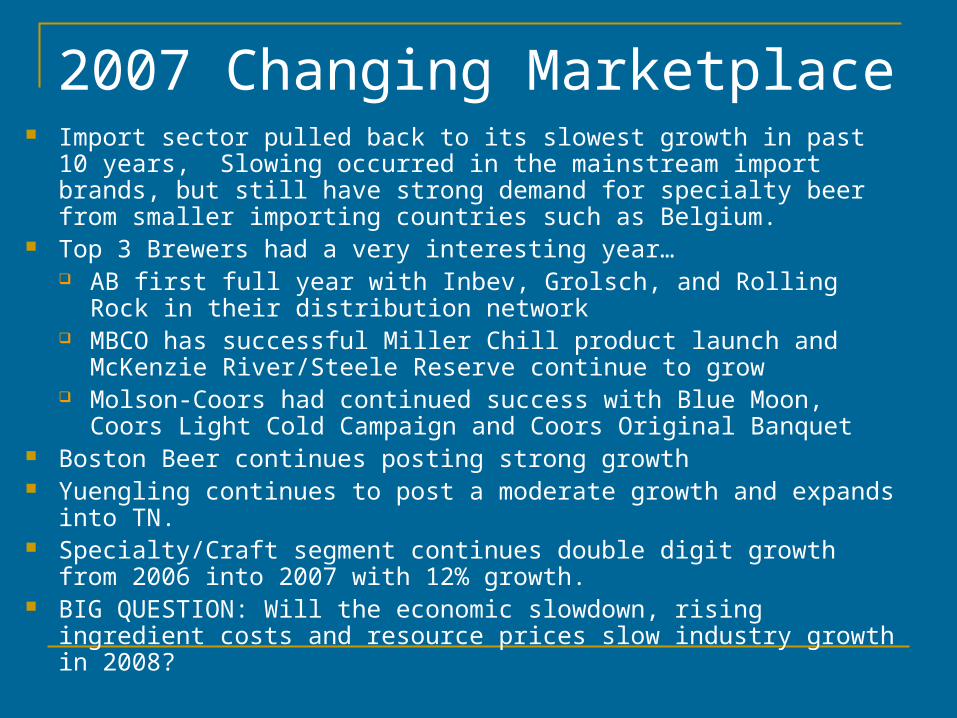
2007 Changing Marketplace Import sector pulled back to its slowest growth in past 10
years, Slowing occurred in the mainstream import brands, but still have strong demand for specialty beer from smaller importing countries such as Belgium.
Top 3 Brewers had a very interesting year… AB first full year with Inbev, Grolsch, and Rolling Rock in
their distribution network MBCO has successful Miller Chill product launch and
McKenzie River/Steele Reserve continue to grow Molson-Coors had continued success with Blue Moon, Coors
Light Cold Campaign and Coors Original Banquet Boston Beer continues posting strong growth Yuengling continues to post a moderate growth and expands
into TN. Specialty/Craft segment continues double digit growth from
2006 into 2007 with 12% growth. BIG QUESTION: Will the economic slowdown, rising ingredient
costs and resource prices slow industry growth in 2008?

Per Capita Consumption of Malt Beverages1980 to 2007 (gallons per person/total population)
19.520.020.521.021.522.022.523.023.524.024.525.0
1980
1981
1982
1983
1984
1985
1986
1987
1988
1989
1990
1991
1992
1993
1994
1995
1996
1997
1998
1999
2000
2001
2002
2003
2004
2005
2006
2007
Source: Beer Institute, 2007.
1. Second year of increase 22.2 in 2007 from a high of 24.6 in 1981
2. Changing Demographics, tastes and trading up
3. Increased alcohol beverage competition
4. Additional non-alcohol beverage choices
5. Policy Changes (21 LDA and .08)

Segment
2006 Volum
e
2007 Volum
e2007 Share
Volume
Change
Percent
Change
Domestic*180,40
1183,01
986% 2,618 1.5%
Imports 29,294 29,695 14% 401 1.4%
Total Industry209,69
5212,71
4100% 3,019 1.4%
Total Malt Beverage Industry2006 vs. 2007 (1,000’s of 31 gallon barrels)
Source: Beer Institute, 2007
Total Industry added over 3 million barrels or 42 million cases of beer for a gain of almost 1 billion 12 ounce
equivalent servings. In a dramatic reversal from 2006, over 90% of the net gain in volume came from domestic growth.
* 2007 Beer Institute Year End Reported Volume

Domestic Segment 2006 2007
2007Share
Volume
Change
Percent
Change
Packaged
163,371
165,85
9 90.4% 2,488 1.5%
Draught 16,993 17,287 9.4% 294 1.7%
Tax Determined *
414 419 0.2% 5 1.2%
Total Industry * *
180,778
183,565
100% 2,787 1.5%
Domestic Malt Beverage Industry2006 vs. 2007 (1,000’s of 31 gallon barrels)
Source: TTB and Beer Institute, 2008
* Tax Paid on beer that is served directly from serving tanks in brewpubs and tavern Small relative to total market but still 85 million 16 ounce servings. * * Industry totals may differ from year end published figures in previous slide as additional information on 2007 is collected in 2008
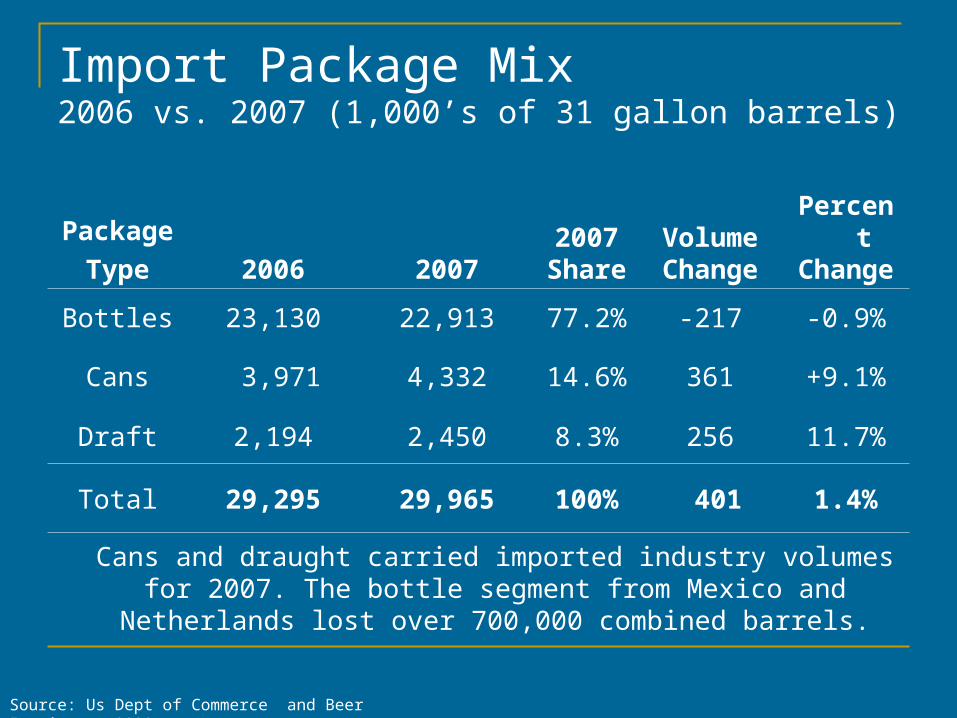
Import Package Mix2006 vs. 2007 (1,000’s of 31 gallon barrels)
Package
Type 2006 2007
2007Shar
eVolumeChange
Percent
Change
Bottles 23,130 22,913 77.2% -217 -0.9%
Cans 3,971 4,332 14.6% 361 +9.1%
Draft 2,194 2,450 8.3% 256 11.7%
Total 29,295 29,965 100% 401 1.4%
Cans and draught carried imported industry volumes for 2007. The bottle segment from Mexico and Netherlands
lost over 700,000 combined barrels.
Source: Us Dept of Commerce and Beer Institute, 2008

Imports of Draught Beer into the US1999 to 2007 (31 gallon barrels)
500
1,000
1,500
2,000
2,500
3,000
1999 2000 2001 2002 2003 2004 2005 2006 2007
Tho
usan
ds
Source: US Dept of Commerce, Bureau of Census and Beer Institute, 2007
Draught imports have grown 7% CAGR since 1999 to reach 2.4 million barrels in
2007. Measure of on premise consumption and best opportunity for
consumers to try new brands.
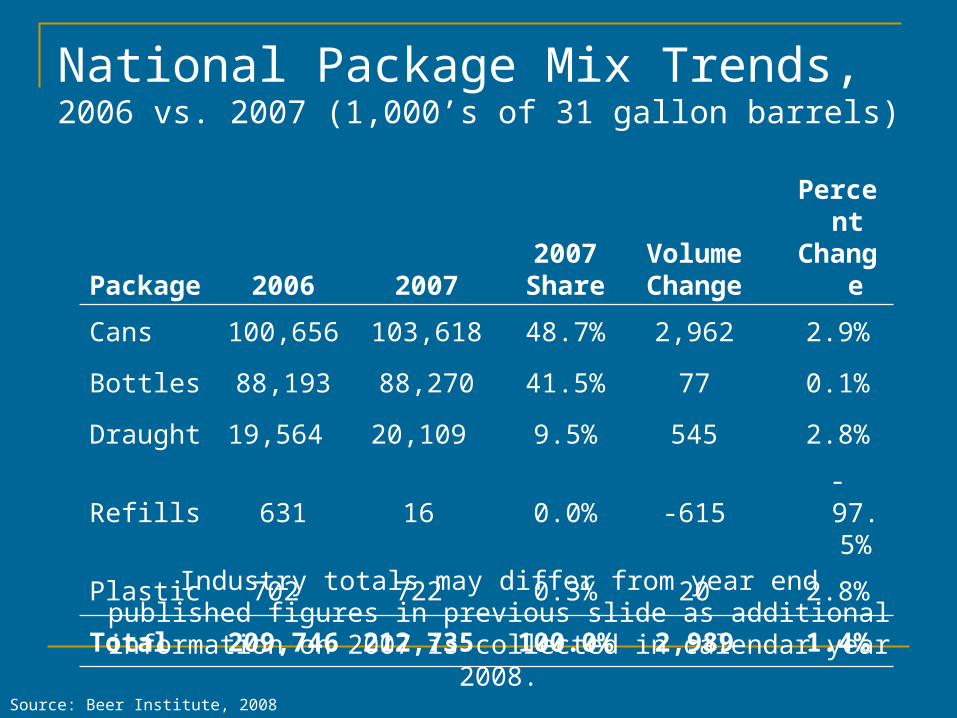
National Package Mix Trends, 2006 vs. 2007 (1,000’s of 31 gallon barrels)
Package 2006 2007
2007Share
Volume
Change
Percent
Change
Cans 100,656 103,618 48.7% 2,962 2.9%
Bottles 88,193 88,270 41.5% 77 0.1%
Draught 19,564 20,109 9.5% 545 2.8%
Refills 631 16 0.0% -615-97.5%
Plastic 702 722 0.3% 20 2.8%
Total209,74
6 212,735 100.0% 2,989 1.4%
Source: Beer Institute, 2008
Industry totals may differ from year end published figures in previous slide as additional information on 2007 is
collected in calendar year 2008.

0
20
40
60
80
100
120
1994 1995 1996 1997 1998 1999 2000 2001 2002 2003 2004 2005 2006 2007
Millions of Barrels
Cans Bottles Refills Draught
US Package Mix Volumes, 1994-2007
Source: Beer Institute Package Mix and Shipment Reports, 2008
Shares Pack 1994
2007 Cans 55%
48% Bottles 30%41.5% Draught 11% 9.5% Refills
4% 0%

Draught Beer Share – On Premise MeasureDraught Share of Market 1946 to 2007
0%
5%
10%
15%
20%
25%
30%
35%
1946
1950
1954
1958
1962
1966
1970
1974
1978
1982
1986
1990
1994
1998
2002
2006
1. Draught share of market has fallen consistently from over a third of the market to less than 10% in 2007.
2. But still significant, over 20 million barrels (domestic + imports) in 2007 for over 4.9 billion 16 ounce servings.
3. There are over 29,000 miles of draught lines in the US and over 10 million kegs in circulation.
Source: TTB and Beer Institute, 2007
Making a Dent in Keg Theft

Price Index for Scrap Metals, 2001 - 2007Four fold increase since 2001
0
50
100
150
200
250
300
350
400
450
Inde
x
2001 2002 2003 2004 2005 2006 2007
Source: BLS Producer Price Index and Beer Institute, 2008

Keg Loss Estimate2006 volumes and values
2006 Volume Estimates Total
Draught Volume Barrels 19,253,609
Total Kegs (mixed sizes) 45,120,744
Keg Turn (industry average) 4.2
Keg Float to handle volume 10,740,667
Percentage loss 3.6%
Kegs loss in 2006 386,053
Replacement Cost $136
Replacement Value $52,613,348
10.7 million kegs equals about $1.5 billion in
brewer assets on the street
386K kegs have the potential to be worth $15 million at current
scrap values
Source: Beer Institute, 2007

Keg Loss
•Surprise Issue of the Year
•300,000 Kegs Lost
•Costs Industry More than $50 million annually
•Expected to Get Worse
Fighting Back
● Partnering with ISRI, Others
● Education materials
● Ad campaign in Scrap Magazine
PR
February 8, 2008
TX
NMAZ
CA
OK
KS
NE
SD
NDMT
WY
COUT
NV
OR
WA
ID
MN
IA
MO
AR
LA
MS AL GA
FL
NC
VA
TN
KY
IL
WIMI
INOH
WV
NY
DCDE NJ
CTRI
MA
VTNH
AKHI
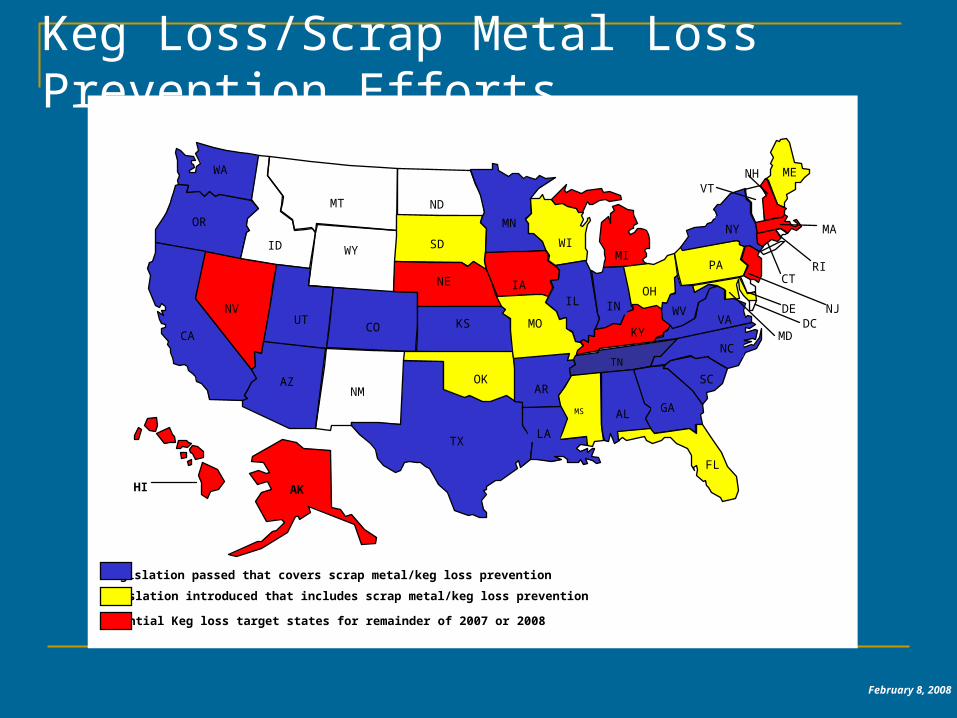
Legislation introduced that includes scrap metal/keg loss prevention
PA
MD
Legislation passed that covers scrap metal/keg loss prevention
SC
ME
Potential Keg loss target states for remainder of 2007 or 2008
Keg Loss/Scrap Metal Loss Prevention Efforts