2007 - cnb.cz
TRANSCRIPT

WORKING PAPER SERIES 5
Jiří Podpiera and Laurent Weill: Bad Luck or Bad Management? Emerging Banking Market Experience
2007

WORKING PAPER SERIES
Bad Luck or Bad Management? Emerging Banking Market Experience
Jiří Podpiera Laurent Weill
5/2007

CNB WORKING PAPER SERIES The Working Paper Series of the Czech National Bank (CNB) is intended to disseminate the results of the CNB’s research projects as well as the other research activities of both the staff of the CNB and collaborating outside contributor, including invited speakers. The Series aims to present original research contributions relevant to central banks. It is refereed internationally. The referee process is managed by the CNB Research Department. The working papers are circulated to stimulate discussion. The views expressed are those of the authors and do not necessarily reflect the official views of the CNB. Printed and distributed by the Czech National Bank. Available at http://www.cnb.cz. Reviewed by: Jan Sobotka (Czech National Bank) Karel Janda (Faculty of Social Sciences, Charles University) Jonathan Williams (University of Wales, Bangor)
Project Coordinator: Michal Hlaváček © Czech National Bank, December 2007 Jiří Podpiera, Laurent Weill

Bad Luck or Bad Management? Emerging Banking Market Experience
Jiří Podpiera and Laurent Weill ∗
Abstract
A large number of bank failures occurred in transition countries during the 1990s and at the beginning of the 2000s. These failures were related to increases in non-performing loans and deteriorated cost efficiency of banks. This paper addresses the question of the causality between non-performing loans and cost efficiency in order to examine whether either of these factors is the deep determinant of bank failures. We extend the Granger causality model developed by Berger and DeYoung (1997) by applying GMM dynamic panel estimators on a panel of Czech banks between 1994 and 2005. Our findings support the “bad management” hypothesis, according to which deteriorations in cost efficiency precede increases in non-performing loans, and reject the “bad luck” hypothesis, which predicts the reverse causality.
JEL Codes: G21, G28, D21, P20. Keywords: Bank failures, cost efficiency, non-performing loans, transition countries.
∗ Jiří Podpiera, Czech National Bank (e-mail:[email protected]). Laurent Weill, Université Robert Schuman, Strasbourg (e-mail:[email protected]). This work was supported by Czech National Bank Research Project No. C6/2005. We would like to thank M. Hlaváček, K. Janda, J. Williams, J. Sobotka, T. Holub and participants at the CNB seminar for their helpful comments and suggestions.

2 Jiří Podpiera and Laurent Weill Nontechnical Summary
This paper addresses the question of the causality between non-performing loans and cost efficiency. Since both the share of non-performing loans and the level of cost efficiency are found to be predictors of bank failures in the literature, the identification of the key determinant of bank failures is a fundamental issue for the authorities in charge of supervising the banking industry, as the appropriate policy measures strongly differ depending on its origin. Specifically, if non-performing loans influence cost efficiency, banking supervisors should limit banks’ risk exposures by restricting loan concentration and favoring diversification. In contrast, an influence of cost efficiency on risk-taking would suggest that non-performing loans are caused internally. Following the empirical observation of a negative relationship between non-performing loans and cost efficiency, two hypotheses have been proposed in the literature which differ in the direction of causality. On the one hand, the “bad luck” hypothesis states that non-performing loans influence cost efficiency, as external events affect non-performing loans. On the other hand, the “bad management” hypothesis predicts that cost efficiency exerts an impact on non-performing loans, as bad managers do not monitor loan portfolios efficiently.
Introducing a methodological innovation into the Granger-causality model which consists in the application of GMM dynamic panel data estimators, we analyze an exhaustive sample of Czech banks over the period 1994–2005. Our findings clearly support the “bad management” hypothesis, according to which deteriorations in cost efficiency precede increases in non-performing loans, and reject the “bad luck” hypothesis, which predicts the reverse causality.

Bad Luck or Bad Management? Emerging Banking Market Experience 3 1. Introduction
A large number of bank failures occurred in transition countries during the 1990s and, to a lesser degree, at the beginning of the current decade. In the Czech banking sector, for instance, out of the 48 banks operating in 1994 and another 6 licensed later on, 21 banks had failed by 2003. It is therefore of utmost interest to know which factors predict bank failures. The empirical literature identifies two main factors predicting bank failures. The first one is the volume of non-performing loans in the loan portfolio. A large proportion of non-performing loans has been widely observed in the loan portfolios of failing banks (see Lanine and Vennet, 2006, for evidence on Russia). The second one is a low level of cost efficiency (as a proxy for management quality). The role of enhanced banking efficiency in reducing bank failures has been pointed out in studies in developed countries (e.g. Barr et al., 1994) and transition countries (Podpiera and Podpiera, 2005). The underlying argument is that bad management increases the likelihood of bank failures.
In the case of the Czech Republic, for instance, Podpiera and Podpiera (2005) find that increasing non-performing loans and decreasing cost efficiency are correlated and both cause an increase in the likelihood of bank failure. However, the big question is whether either of these factors is the deep determinant of bank failures. If one factor causes the other, it may therefore be considered the key determinant of bank failures – both through its direct impact and through its indirect influence via the other factor. As a consequence, the sense of the causality between non-performing loans and cost efficiency is of great interest for the analysis of the causes of bank failures.
Following the empirical observation of a negative relationship between non-performing loans and cost efficiency, two assumptions have been proposed by Berger and DeYoung (1997). These differ in the direction of the causality. On the one hand, the “bad luck” hypothesis states that non-performing loans influence cost efficiency. The underlying argument is that external events such as economic slowdowns affect non-performing loans, resulting in banks incurring extra costs to deal with these loans, which, in turn, weakens their cost efficiency. On the other hand, the “bad management” hypothesis predicts that cost efficiency exerts an impact on non-performing loans, as bad managers do not monitor loan portfolios efficiently.
The identification of the key determinant of bank failures is a fundamental issue for the authorities in charge of supervising the banking industry, as the implications for economic policy strongly differ depending on its origin. Specifically, if non-performing loans influence cost efficiency, banking supervisors should limit banks’ risk exposures by restricting loan concentration and favoring diversification. In contrast, an influence of cost efficiency on risk-taking would suggest that non-performing loans are caused internally. Therefore, banking regulators and supervisors should focus on enhancing cost efficiency through better education of bank managers and through increased foreign ownership, as this latter element has been shown to favor cost efficiency, primarily through the transfer of know-how (Weill, 2003; Bonin et al., 2005).
A couple of papers have investigated this issue for developed countries. Berger and DeYoung (1997) provide some support for both hypotheses on a sample of US banks, as they observe that the relationship runs in both directions. Williams (2004) concludes in favor of the bad management hypothesis on a sample of European savings banks.

4 Jiří Podpiera and Laurent Weill However, this question is of greater importance in transition countries, owing to the importance of the bank failure phenomenon in these countries. In spite of this aspect, no study has yet been published providing a thorough investigation of the causality between non-performing loans and cost efficiency in transition countries. To our knowledge, the only paper on this topic is Rossi et al. (2005), which concludes in favor of the “bad luck” hypothesis on a sample of banks from nine transition countries. However, this study suffers from some flaws which cast a veil over its findings, including selection bias and the use of a proxy variable for non-performing loans, which may be endogenous in the estimations.
Our aim in this paper is to provide empirical evidence on the source of bank failures in transition countries by investigating the causality between cost efficiency and non-performing loans for the Czech banking industry. The Czech banking industry offers a relevant illustration of what has happened in transition countries. Although the Czech Republic was considered a particularly successful country at the beginning of the transition period, it later faced the same troubles as the others, with numerous bank failures and increasing non-performing loans.
We use an exhaustive dataset for all Czech banks from 1994 to 2005, which avoids any sample selection bias and any bias resulting from the adoption of proxy variables. We extend the Granger causality framework used by Berger and DeYoung (1997) and Williams (2004) by applying generalized method-of-moments (GMM) dynamic panel estimators (Arellano and Bond, 1991; Arellano and Bover, 1995). These estimators are specifically designed to address the econometric problems induced by unobserved bank-specific effects and joint endogeneity of the explanatory variables in lagged-dependent variable models such as the one adopted to test for Granger causality.
Furthermore, we consider two indicators to take into account non-performing loans. Following previous studies, we resort to the ratio of non-performing loans to total loans, which we call the conventional risk-taking measure. However, such an approach considers effective risk-taking and does not take into account the possibility of the bank increasing the risk and compensating for it with a greater return through higher interest rates. We therefore also compute a compensated risk-taking measure, defined as the difference between the ratio of non-performing loans to total loans and the ratio of interest revenue to total loans.
We are then able to undertake a comprehensive investigation of the causality between cost efficiency and non-performing loans in a transition country. The structure of the paper is as follows. Section 2 presents the empirical background and main hypotheses and describes the recent evolution of the Czech banking industry. The methodology is described in section 3 and the data and variables in section 4. Section 5 develops the empirical results. Finally, we provide some concluding remarks in section 6.
2. Background
2.1 Hypotheses and Empirical Literature
We adopt the assumptions proposed by Berger and DeYoung (1997) to explain the relationship between cost efficiency and non-performing loans. Two hypotheses have been suggested to explain the negative sign between cost efficiency and non-performing loans widely observed in

Bad Luck or Bad Management? Emerging Banking Market Experience 5 the empirical literature. These differ on the sense of the causality. It must be stressed that these assumptions are not mutually exclusive, as the relationship may be bidirectional.
First, the bad luck hypothesis predicts that external events increase non-performing loans in banks. This leads to the bank incurring greater operating costs to deal with these problem loans, which, in turn, hampers banking efficiency. These extra operating costs can result from various sources, including monitoring of delinquent borrowers and the value of collateral, as well as the costs of seizing and disposing of collateral in cases of default. Consequently, under this hypothesis, we expect that an increased volume of non-performing loans causes reduced cost efficiency.
Second, the bad management hypothesis considers low efficiency as a signal of poor managerial performance, which also affects loan granting behavior. Indeed poor managers do not adequately monitor loan portfolio management, owing to poor loan evaluation skills or to inadequate allocation of resources to loan monitoring. This results in a greater volume of non-performing loans. Therefore, this hypothesis predicts that reduced efficiency exerts a positive influence on non-performing loans.
We must also mention an alternative hypothesis which predicts a positive sign between cost efficiency and non-performing loans: the “skimping” hypothesis. It suggests that the amount of resources allocated to loan monitoring affects both non-performing loans and banking efficiency. Bank managers face a trade-off between short-term operating costs and long-term non-performing loans. Therefore, if they strongly weight short-term profits they may be motivated to reduce short-term operating costs by reducing the resources allocated to loan monitoring, even if this leads to a greater volume of non-performing loans in the future. Skimping behavior therefore gives the impression that banks are cost-efficient in the short term, because fewer inputs produce the same quantity of outputs, while non-performing loans are about to burgeon. Under this hypothesis, then, greater cost efficiency should increase the volume of non-performing loans.
We now turn to the findings of the former studies on this issue. The seminal paper is Berger and DeYoung (1997). They investigate the causality between loan quality, cost efficiency and capitalization on a large sample of US commercial banks for the period 1985–1994. Loan quality is proxied by the ratio of non-performing loans to total loans. Cost efficiency is estimated by a stochastic frontier approach to produce an annual efficiency score for each bank. To test Granger causality, the model includes three equations so that each of the three main variables is regressed on its lagged values and on those of both other variables, while other sources of cross-sectional and time variation are controlled for. Each equation is then estimated by OLS, and the sum of the lagged coefficients of each variable yields information on the causality. The paper finds a negative relationship between cost efficiency and non-performing loans which runs in both directions, corroborating both the bad luck hypothesis and the bad management hypothesis.
Williams (2004) presents a robustness test of Berger and DeYoung’s (1997) work on a large sample of European savings banks from 1990 to 1998. Loan quality is defined as the ratio of loan loss provisions to total loans. This ratio might be less relevant than the ratio of non-performing loans to total loans, as it could be endogenous in the estimations owing to the influence of bank management on provisions. Cost and profit efficiency scores, all measured by the stochastic frontier approach, are alternatively used in the tests. Otherwise, the methodology is similar to that of Berger and DeYoung (1997). This study concludes that decreases in cost and profit efficiency

6 Jiří Podpiera and Laurent Weill tend to be followed by deteriorations in loan quality, in accordance with the bad management hypothesis.
Finally, Rossi, Schwaiger, and Winkler (2005) extend Williams’s (2004) work to the case of transition countries. Their analysis is performed on a sample of 278 banks from 9 transition countries from 1995 to 2002. They investigate the relationships between loan quality, cost and profit efficiency, and capitalization similarly to both former papers. Loan quality is again defined by the ratio of loan loss provisions to total loans, and efficiency scores are estimated by the stochastic frontier approach. The paper concludes in favor of the bad luck hypothesis, as reductions in loan quality precede reductions in cost and profit efficiency.
However the investigation of the causality between loan quality and efficiency in transition countries has several flaws. The paper first suffers from bank selection bias, owing to the use of data from Bankscope. Even though this database covers a large proportion of total banking sector assets in most countries, several papers have raised some suspicions regarding its selectivity bias (e.g. Corvoisier and Gropp, 2002), while Bhattacharya (2003) shows that in the case of India some categories of banks are omitted from Bankscope. As a consequence, some categories of banks, and more particularly small banks, are likely to be under-represented. This is a major problem in addressing, for example, the bad management hypothesis in transition countries, as bad management may have been more prevalent in small banks, which had huge non-performing loans and which failed. Furthermore, this work suffers from misspecifications in the combination of inputs and outputs, with deposits considered unexplainably on both sides. Moreover, the price of labor is proxied by the ratio of personnel expenses to total assets, owing to data limitations as regards the number of employees. Finally, it uses the ratio of loan loss provisions to total loans to proxy asset quality, which could be endogenous in the estimations owing to the influence of bank management on provisions, as observed by the authors themselves.
2.2 The Evolution of the Czech Banking Industry
Under the communist regime, the Czech banking system was dominated by a “monobank” in which both the functions of the central bank and those of the commercial banks were concentrated. The Czech authorities decided soon after the collapse of the old regime to separate the activities of this bank. Its commercial activities were initially transferred to two banks, but the number of banks increased rapidly in the first years of the transition, from 9 in 1989 to 52 in 1993, partly because of a lack of adequate regulation.
After 1993, however, the Czech authorities decided to tighten up their prudential rules in order to avoid a mass bankruptcy of the banking system due to the large amount of non-performing loans owned by the major banks and the poor financial condition of the newly created banks. The Czech central bank, which is responsible for the supervision and regulation of the banking sector, decided in 1994 to cut back on issuing new banking licenses. Also, starting in 1996, several programs were adopted to enhance the financial condition of small and medium-sized banks in order to prevent a mass bankruptcy of these establishments: 15 banks were targeted, and strong measures – such as revoking banking licenses and requiring shareholders to increase capital – were taken against them.
To resolve the problem of the increasing amount of non-performing loans, the Czech government decided in 1993 to transfer the bulk of the non-performing loans from the major state-owned
Bad Luck or Bad Management? Emerging Banking Market Experience 7 banks to a special institution created for this purpose, called “Konsolidacni Banka.” This procedure cleaned up the loan portfolios of the main Czech banks with a view to privatization. However, no privatizations took place until the late 1990s. This delay was mainly due to political reasons, as privatization presented a danger of increasing unemployment and there was no consensus on the idea of selling the major Czech banks to foreign investors.
Furthermore, the difficulties of the Czech economy, accompanied by bank management inefficiencies (due partly to persisting links between the major state-owned banks and state-owned firms) led to the share of non-performing loans in total loans reaching 30% in 1997 (CNB, 1998). The Czech government finally adopted a bank privatization program in 1998, leading to the banking sector being gradually acquired by foreign investors.
Consequently, the period from 1994 to 2005 saw two main trends. The first was the failure of numerous banks. Out of the 48 banks operating in 1994 and another 6 licensed later on, 21 banks had failed by 2003. Most of these failures occurred between 1994 and 2000.1 Only 2 failures happened after 2000, both of them in 2003. We can thus distinguish two periods regarding bank failures: the “troubled” subperiod 1994–2000, and the “quiet” subperiod 2001–2005. As a consequence of the bank failures, the number of banks in the Czech market decreased from 48 at the beginning of 1994 to 36 at the end of 2005.
The second trend was an increasing share of foreign investors in the banking industry. After the privatization of one public bank, Zivnostenka Banka, sold to foreign investors in 1992, there was a steady rise in foreign branches and subsidiaries specializing in providing investment banking and services to companies and high-income households in the Czech market. However the biggest change occurred between 1999 and 2002 with the privatization and sale of the three largest banks to foreign banks. Owing to the failures of Czech-owned banks and sales to foreign investors, foreign investors controlled 96.2% of the assets of the banking sector by the end of 2005 (CNB, 2006).
3. Methodology
This section develops the methodology adopted to investigate the sense of the causality between non-performing loans and cost efficiency. The first subsection displays the econometric model used to investigate the causality, while the second presents how we estimate cost efficiency.
3.1. The Granger Causality Framework
In order to test the hypotheses of bad luck and bad management, we employ the Granger causality framework, similarly to Berger and DeYoung (1997). In particular, we test the relationship between the following pair of variables: a risk-taking measure RTM, which takes into account non-performing loans, and the cost efficiency score EFF, which measures management quality. We formulate the following standard specification for Granger causality testing:
RTMi,t = f(RTMi,t-1,…, RTMi,t-n; EFFi,t-1,…, EFFi,t-n) + ei+ η1i,t (1)
EFFi,t = f(RTMi t-1,…, RTMi,t-n; EFFi,t-1,…, EFFi,t-n) +ei + η2i,t (2)
1 Number of bank failures for each year from 1994 to 2000: 1, 3, 2, 5, 3, 3, 2.
8 Jiří Podpiera and Laurent Weill where n is the number of lags, ei is a bank-specific effect that captures the systematic differences across banks, and ηi,t is the i.i.d. random error.
The focus of the analysis is the total effect of cost efficiency on the risk-taking measure (the sum of the EFF coefficients in equation (1)) and vice versa, namely, the size and the significance of the total effect of the risk-taking measure on cost efficiency (equation (2)). If the total effect of cost efficiency is negative and significant in equation (1), we can conclude that the bad management hypothesis, according to which reduced cost efficiency favors excessive risk-taking, is consistent with the data. In the other case, namely, if the total effect of risk-taking is negative and significant in equation (2), we can say that the data are consistent with the bad luck hypothesis.
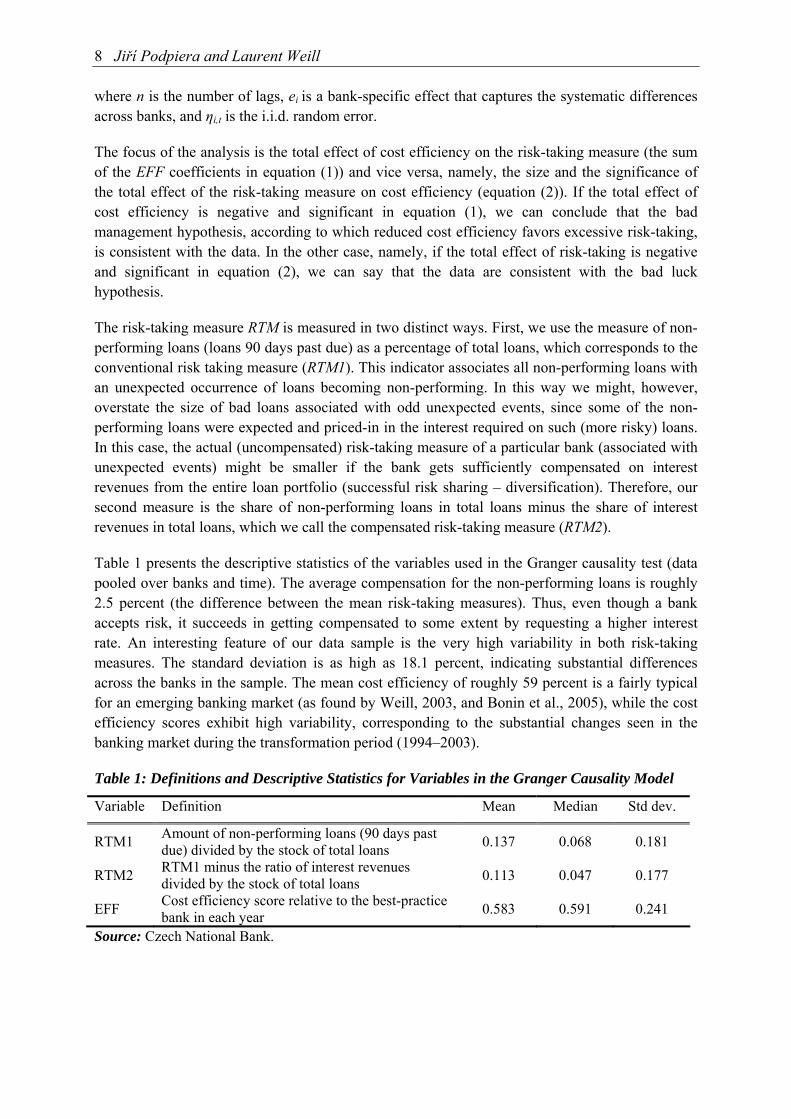
The risk-taking measure RTM is measured in two distinct ways. First, we use the measure of non-performing loans (loans 90 days past due) as a percentage of total loans, which corresponds to the conventional risk taking measure (RTM1). This indicator associates all non-performing loans with an unexpected occurrence of loans becoming non-performing. In this way we might, however, overstate the size of bad loans associated with odd unexpected events, since some of the non-performing loans were expected and priced-in in the interest required on such (more risky) loans. In this case, the actual (uncompensated) risk-taking measure of a particular bank (associated with unexpected events) might be smaller if the bank gets sufficiently compensated on interest revenues from the entire loan portfolio (successful risk sharing – diversification). Therefore, our second measure is the share of non-performing loans in total loans minus the share of interest revenues in total loans, which we call the compensated risk-taking measure (RTM2).
Table 1 presents the descriptive statistics of the variables used in the Granger causality test (data pooled over banks and time). The average compensation for the non-performing loans is roughly 2.5 percent (the difference between the mean risk-taking measures). Thus, even though a bank accepts risk, it succeeds in getting compensated to some extent by requesting a higher interest rate. An interesting feature of our data sample is the very high variability in both risk-taking measures. The standard deviation is as high as 18.1 percent, indicating substantial differences across the banks in the sample. The mean cost efficiency of roughly 59 percent is a fairly typical for an emerging banking market (as found by Weill, 2003, and Bonin et al., 2005), while the cost efficiency scores exhibit high variability, corresponding to the substantial changes seen in the banking market during the transformation period (1994–2003).
Table 1: Definitions and Descriptive Statistics for Variables in the Granger Causality Model
Variable Definition Mean Median Std dev.
RTM1 Amount of non-performing loans (90 days past due) divided by the stock of total loans 0.137 0.068 0.181
RTM2 RTM1 minus the ratio of interest revenues divided by the stock of total loans 0.113 0.047 0.177
EFF Cost efficiency score relative to the best-practice bank in each year 0.583 0.591 0.241
Source: Czech National Bank.

Bad Luck or Bad Management? Emerging Banking Market Experience 9 The model outlined in equations (1) and (2) is estimated using a dynamic panel data estimator in order to reflect the panel data structure, i.e., mainly to account for the time dependence of the observations within each bank and for bank-specific effects in the studied variables. We made use of the Arellano and Bond (1991) dynamic panel data estimator. The estimator removes the bank-specific effects by data first-differencing and uses instruments to carry out the GMM estimation. We use equally distributed lags for both specifications, i.e., equations (1) and (2), which allows for an independent estimation of each equation.
We specify a three-year-lag model. Our choice is motivated by three considerations. On the one hand, a reasonably high number of lags is necessary to fully capture the effects of cost efficiency on non-performing loans, since less careful loan-granting practice is reflected in a greater amount of non-performing loans in the bank’s portfolio only with a delay of a few years. On the other hand, the small sample of banks and short time span make us favor a lower number of lags. And finally, we opt for a three-year lag partially also because some studies have shown that three- and four-year-lag models do not significantly differ from each other (see Berger and DeYoung, 1997).
3.2. The Measurement of Efficiency
For the cost efficiency estimation we opt for quarterly data panel estimation with time and fixed effects – a distribution free approach – estimated for each year separately. This approach delivers constant cost efficiency scores for each bank and each year, as is needed for the Granger causality described above. While the fixed effects represent the constant differences in cost inefficiency over time across banks, the time effects account for any specific regularity within the time span, i.e., the cost inefficiency common to all banks in a specific quarter.
We assume a translog form for the cost frontier as follows:
∑ ∑∑ ∑ +⎟⎟⎠
⎞⎜⎜⎝
⎛++=⎟
⎟⎠
⎞⎜⎜⎝
⎛ l
j j k m t
tmmtktjjktjj
t
ti
ww
YYYw
TC 2 2 2
,3
,,,,
,3
, lnlnln21lnln γββ
∑∑ ∑∑ ⎟⎟⎠
⎞⎜⎜⎝
⎛+⎟
⎟⎠
⎞⎜⎜⎝
⎛⎟⎟⎠
⎞⎜⎜⎝
⎛+
2 2 2 2
,3
,,
,3
,
,3
, lnlnlnln21
m n j m t
tmtjjm
t
tn
t
tmmn w
wY
ww
ww
ργ + ti,υ (3)
where TC denotes total operating costs, Yj is the jth bank’s output (j=1,2), i.e., total loans and investment assets, and wm is the mth input price (m=1,2,3), i.e., the price of labor, the price of physical capital, and the price of borrowed funds. ti,υ is the composite error term, i.e.,
tititi u ,,, ευ += , consisting of the inefficiency factor ui,t = ui + ut and ti,ε , i.e., the random error i.i.d. (0, εσ ), accounting for measurement error or other exogenous factors which can temporarily either increase or decrease costs. ui is the fixed effect that brings the costs above those of the best-performing bank, and ut represents the shift in costs common to all banks in quarter t (the time effect), which does not affect the relative ranking. The inclusion of the time effect is motivated by the fact that quarterly data might exhibit considerable seasonality, as some of the payments tend to be concentrated in the last quarter, for instance. We impose the restriction of linear homogeneity in input prices by normalizing total costs and input prices by one input price.
The cost frontier is estimated for each separate year in the period 1994–2005. The fixed effects estimation framework assumes that bank cost inefficiency is time invariant. This means in our case that differences in efficiency among banks are constant within a year (in our case, four

10 Jiří Podpiera and Laurent Weill quarters, as the cost efficiency is estimated from a quarterly panel for each year). The relative inefficiency is then given by
{ }ˆ ˆmin | 1,...,i i j jINEFF u u j n= − = , (4)
where ju is the j-th bank-specific estimated constant (fixed effect). The relative cost efficiency for bank i is computed as EFFi=exp {-INEFFi}.
4. Data and Variables
We had access to monthly data from the Czech National Bank (CNB) for all Czech banks during the period 1994–2005 and transformed them into quarterly real data.2 The data are based on balance sheets and income statements of banks reported to CNB Banking Supervision. After dropping banks with missing data we have an unbalanced panel of 43 banks with 1,052 quarterly observations.
We need to define the inputs and outputs for the estimation of the cost frontier. We then adopt the intermediation approach. It assumes that the bank collects deposits to transform them, using labor and capital, into loans, as opposed to the production approach, which views the bank as using labor and capital to produce deposits and loans.3 Two outputs are included: total loans, and investment assets. Total loans comprise the quarterly average of the Czech koruna real value of loans denominated in all currencies granted to both resident and non-resident clients, loans to government, loans to and deposits with the central bank, and loans to and deposits with other financial institutions.4 We did not exclude non-performing loans, as their maintenance is costly, which might have consequences for measures of cost efficiency. This approach has been taken by the mainstream of the literature (e.g. Wheelock and Wilson, 2000). Investment assets represent the quarterly average of the Czech koruna real value of securities for trading and held to maturity denominated in all currencies.
The inputs whose prices are used to estimate the cost frontier include labor, physical capital, and borrowed funds. The price of labor represents the unit price of labor and is constructed as the quarterly average of the total expenses for employees divided by the end-of-quarter number of employees. The price of physical capital represents the unit price of physical capital and is constructed as the quarterly average of expenses for rents, leasing, amortization, and materials divided by the book value of fixed assets. And finally, the price of borrowed funds is the quarterly average of interest expenses on funds borrowed from the government, central bank, other banks, 2 Nominal data were deflated by the GDP deflator with the 1994 average as the base, as this is generally less prone to measurement biases than the CPI. 3 Two studies have shown that the choice of approach has an impact on efficiency levels but does not imply strong modifications in their rankings (Wheelock and Wilson, 1995; Berger, Leusner, and Mingo, 1997). 4 Besides the usual industrial and commercial loans, real estate loans and loans to individuals, total loans also comprise interbank market loans. This is motivated by the fact that in the Czech banking sector interbank loans represent a significant share of total bank loans. Loans to other banks and to the central bank accounted on average for 30% of total loans over 1994–2002. Moreover, as Dinger and von Hagen (2003) claim, the Czech banking sector operates as a two-tier system in which the interbank market is an important source of financing for small banks. In these conditions, excluding the interbank market would imply that cost efficiency would be systematically biased upward for small banks.

Bad Luck or Bad Management? Emerging Banking Market Experience 11 and clients, and on securities issued, divided by the amount of these funds. Total costs are the quarterly average of the sum of expenditures incurred for labor, physical capital, and borrowed funds.
The risk-taking measures are the conventional one, measured by the ratio of non-performing loans to total loans, and the compensated one, defined as the first one minus the ratio of interest revenues to total loans. Descriptive statistics for the variables used for the efficiency scores and for the risk-taking measures are displayed in table 2.
Table 2: Definitions and Descriptive Statistics for Variables Used for the Efficiency Scores and Risk-taking Measures
Variable Definition Mean Median Std dev.
Loans
Quarterly average of the real value of loans denominated in all currencies granted to both resident and non-resident clients, loans to government, loans to and deposits with the central bank, and loans to and deposits with other financial institutions
54.5 18.9 93.5
Investment assets
Quarterly average of the real value of securities for trading and held to maturity denominated in all currencies
20.0 3.2 47.3
Price of labor
Quarterly average of the total expenses for employees divided by the end-of-quarter number of employees (thousands of Czech koruna)
108.5 86.7 78.9
Price of physical capital
Quarterly average of expenses for rents, leasing, amortization, and materials divided by the book value of fixed assets (%)
0.13 0.09 0.11
Price of borrowed funds
Quarterly average of interest expenses on funds borrowed from the government, central bank, other banks and clients, and on securities issued, divided by the amount of these funds (%)
0.016 0.015 0.011
Total costs Quarterly average of the sum of expenditures incurred for labor, physical capital, and borrowed funds (millions of Czech koruna)
0.79 0.29 1.38
Non-performing loans
Quarterly average of non-performing loans (90 days past due) 6.6 0.8 15.8
Interest revenues Quarterly average of interest revenues on all loans 0.11 0.04 0.2
Source: Czech National Bank. Notes: All values are in billions of Czech koruna unless indicated otherwise.

12 Jiří Podpiera and Laurent Weill 5. Results
This section presents the empirical results of the Granger causality model. We use the Arellano and Bond (1991) panel data estimator on the Czech banking industry during the period 1994–2005. Lagged dependent and independent variables up to lag 10 as well as bank-specific statistics for total assets, borrowed funds, and expenses on labor were used as instruments for the identification of the equations.
The diagnostics of the estimation comprise a Sargan test for over-identifying restrictions and tests for an autoregressive process of first and second order. As we can see from the results displayed in the last lines of tables 3 and 4, the Sargan test never rejects the validity of the instruments at the 1% significance level. Similarly, based on the tests we can reject the first-order autoregressive process and cannot reject the second-order autoregressive process, which is in line with the theory.
Table 3: The Granger Causality Model with the Risk-taking Measure RTM1
∆RTM1(t) ∆EFF(t)
Intercept -0.006* (0.002) -0.041*** (0.008) ∆RTM1(t-1) 0.58*** (0.14) -0.56 (0.61) ∆RTM1(t-2) -0.11 (0.13) -0.15 (0.77) ∆RTM1(t-3) 0.08 (0.06) 0.28 (0.68) ∆RTM1(total) 0.55*** (0.08) -0.42 (0.48) ∆RTM1(F-test, F(3,83)) - 2.14 (0.54) ∆EFF(t-1) -0.03 (0.02) -0.14 (0.09) ∆EFF(t-2) -0.02 (0.02) -0.22*** (0.08) ∆EFF(t-3) -0.06*** (0.02) -0.11* (0.09) ∆EFF(total) -0.10** (0.05) -0.48*** (0.2) ∆EFF(F-test, F(3,83)) 6.26 (0.09) - Sargan test (p-value) 90.14 (0.001) 95.7 (0.001) AR(1) (p-value) -3.56 (0.0004) -2.41 (0.01) AR(2) (p-value) 0.16 (0.87) -0.68 (0.49)
Notes: The set of instruments comprises lagged dependent and independent variables (up to lag 10), total assets, borrowed funds, and labor expenses. The table reports coefficients with standard errors in parentheses. *, **, *** denote estimates significantly different from 0 at the 10%, 5% and 1% levels, respectively.
Table 3 displays the results for the relationship between the conventional risk-taking measure (RTM1) and cost efficiency (EFF). We observe that the total effect of the risk-taking measure on cost efficiency is not significant (as is also confirmed by the F-test for joint insignificance of the lagged values – p-value 0.53), which speaks in favor of the hypothesis that changes in non-performing loans (expected and unexpected all together) did not Granger-cause changes in cost efficiency. This finding is inconsistent with the bad luck hypothesis, in which cost efficiency influences non-performing loans. However, we point out at the same time a significant and negative total effect of the risk-taking measure on cost efficiency. The total effect of change in EFF on change in RTM1 is -0.1 and statistically significant (which is also confirmed by the F-test for joint significance of the lagged values – p-value 0.09), which implies that a reduction in cost

Bad Luck or Bad Management? Emerging Banking Market Experience 13 efficiency by one standard deviation (0.24) leads to an increase in the share of non-performing loans in total loans of 2.4%. Our finding is in accordance with the bad management hypothesis, according to which deteriorating cost efficiency exerts an impact on the accumulation of non-performing loans.
We now investigate the relationship between the compensated risk-taking measure (RTM2) and cost efficiency (EFF). As this measure considers that the share of non-performing loans in total loans can be compensated for by a higher amount of interest revenues earned on the entire loan portfolio, an increase in this measure can be considered as a greater volume of unexpected non-performing loans. The results are reported in table 4.
Table 4: The Granger Causality Model with the Risk-taking Measure RTM2
∆RTM2(t) ∆EFF(t) Intercept 0.001 (0.002) -0.04*** (0.008) ∆RTM2(t-1) 0.44*** (0.13) -0.43 (0.56) ∆RTM2(t-2) -0.02 (0.13) 0.09 (0.69) ∆RTM2(t-3) 0.08 (0.06) -0.34 (0.63) ∆RTM2(total) 0.50*** (0.08) -0.67 (0.47) ∆RTM2(F-test, F(3,83)) - 2.21 (0.53) ∆EFF(t-1) -0.02 (0.02) -0.13 (0.09) ∆EFF(t-2) -0.016 (0.02) -0.22*** (0.08) ∆EFF(t-3) -0.058*** (0.02) -0.09 (0.09) ∆EFF(total) -0.097** (0.045) -0.45** (0.2) ∆EFF(F-test, F(3,83)) 6.67 (0.08) - Sargan test (p-value) 81.34 (0.007) 98.14 (0.001) AR(1) (p-value) -3.23 (0.001) -2.33 (0.02) AR(2) (p-value) 0.36 (0.71) 0.85 (0.39)
Notes: The set of instruments comprises lagged dependent and independent variables (up to lag 10), total assets, borrowed funds, and labor expenses. The table reports coefficients with standard errors in parentheses. *, **, *** denote estimates significantly different from 0 at the 10%, 5% and 1% levels, respectively.
Similarly to the first estimations, we observe that the total effect of cost efficiency on the risk-taking measure is significantly negative at the 1% level, and is equal to -0.097. We can then conclude again that cost efficiency Granger-causes both expected as well as unexpected non-performing loans in accordance with the bad management hypothesis. When investigating the reverse causality, we show that an increase in the risk-taking measure does not significantly reduce cost efficiency. This latter finding supports the bad management hypothesis also for the accumulation of unexpected non-performing loans.
Finally, we ought to mention the fact that the total effect of cost efficiency on the change in cost efficiency is significantly negative at the 1% level, with the coefficients being respectively equal to -0.48 and -0.45 with risk-taking measures RTM1 and RTM2. This observation documents the mean reverting tendency of the cost efficiency scores for individual banks.
In summary, our findings clearly support the bad management hypothesis, according to which cost efficiency exerts a negative influence on non-performing loans. We do not obtain support for

14 Jiří Podpiera and Laurent Weill the bad luck hypothesis, which predicts the reverse causality. These results hold for both risk-taking measures considered, i.e. compensated as well as uncompensated. The skimping hypothesis is clearly rejected, as we strongly support a negative sign between risk-taking measures and cost efficiency.
Our findings are thus quite similar to those obtained by Williams (2004), which support only the bad management hypothesis in the case of European savings banks, and are partially different from those obtained by Berger and DeYoung (1997) for US banks, which support causality in both directions between non-performing loans and cost efficiency. It may appear surprising at first glance that our results differ significantly from those of Rossi, Schwaiger, and Winkler (2005), who investigated this issue on the most relevant sample – a sample of banks from transition countries – and who only support the bad luck hypothesis. However, as mentioned above, their work suffers from several limitations, which may have influenced their findings.
6. Conclusion
This research has provided new evidence on the causality between non-performing loans and cost efficiency of banks in emerging markets. This issue is of utmost interest for such countries, owing to the importance of bank failures in these countries and the empirical finding that non-performing loans and cost efficiency positively influence the likelihood of bank failures. We have therefore attempted to identify whether either of these determinants is the key determinant of bank failures.
We provide clear support for the “bad management” hypothesis, according to which reduced cost efficiency fosters an increase in non-performing loans. Furthermore, we do not find support for the “bad luck” hypothesis, which suggests that an accumulation of non-performing loans hampers cost efficiency. Our findings hold for both measures of risk-taking considered, i.e., compensated as well as uncompensated non-performing loans.
The normative implications of our findings are therefore mainly that support should be provided for all measures favoring cost efficiency, based on the evidence of the “bad management” hypothesis. Given the empirical observation of a positive influence of foreign ownership on cost efficiency, this assertion means that supervisory authorities in emerging markets should strongly favor foreign ownership in the banking industry. They should also favor education of bank managers so as to enhance their managerial performance.

Bad Luck or Bad Management? Emerging Banking Market Experience 15 References
ARELLANO, M. AND S. BOND (1991): “Some Tests of Specification for Panel Data: Monte Carlo Evidence and an Application to Employment Equations.” Review of Economic Studies 58, 277–297.
ARELLANO, M. AND O. BOVER (1995): “Another Look at the Instrumental-Variable Estimation of Error-Components.” Journal of Econometrics 68, 29–52.
BARR, R., L. SEIFORD, AND T. SIEMS (1994): “Forecasting Bank Failure: A Non-Parametric Frontier Estimation Approach.” Recherches Economiques de Louvain 60(4), 417–429.
BERGER, A. AND R. DEYOUNG (1997): “Problem Loans and Cost Efficiency in Commercial Banks.” Journal of Banking and Finance 21, 849–870.
BERGER, A., J. LEUSNER, AND J. MINGO (1997): “The Efficiency of Bank Branches.” Journal of Monetary Economics 40(1), 141–162.
BHATTACHARYA, K. (2003): “How Good is the Bankscope Database? A Cross-Validation Exercise with Correction Factors for Market Concentration Measures.” BIS Working Paper No. 133.
BONIN, J., I. HASAN, AND P. WACHTEL (2005): “Bank Performance, Efficiency and Ownership in Transition Countries.” Journal of Banking and Finance 29, 31–53.
CNB (1998): Banking Supervision in the Czech Republic, Czech National Bank, Prague.
CNB (2006): Financial Stability Report 2005, Czech National Bank, Prague.
CORVOISIER, S. AND R. GROPP (2002): “Bank Concentration and Retail Interest Rates.” Journal of Banking and Finance 26(11), 2155–2189.
DINGER, V. AND J. VON HAGEN (2003): “Bank Structure and Profitability in Central and Eastern European Countries.” Paper prepared for IAES Conference, Lisbon.
LANINE, G. AND R. V. VENNET (2006): “Failure Prediction in the Russian Bank Sector with Logit and Trait Recognition Models.” Expert Systems with Applications 30, 463–478.
PODPIERA, A. AND J. PODPIERA (2005): “Deteriorating Cost Efficiency in Commercial Banks Signals an Increasing Risk of Failure.” Working Paper No. 6, Czech National Bank.
ROSSI, S., M. SCHWAIGER, AND G. WINKLER (2005): “Managerial Behaviour and Cost/Profit Efficiency in the Banking Sectors of Central and Eastern European Countries.” Working Paper No. 96, Austrian National Bank.
WEILL, L. (2003): “Banking Efficiency in Transition Economies: The Role of Foreign Ownership.” Economics of Transition 11(3), 569–592.
WHEELOCK, D. AND P. WILSON (1995): “Evaluating the Efficiency of Commercial Banks: Does Our View of What Banks Do Matter?” Review of Federal Reserve Bank of Saint-Louis 77(4), 39–52.
WHEELOCK, D. AND P. WILSON (2000): “Why do Banks Disappear? The Determinants of US Bank Failures and Acquisitions.” Review of Economics and Statistics 82, 127–138.
WILLIAMS, J. (2004): “Determining Management Behaviour in European Banking.” Journal of Banking and Finance 28, 2427–2460.

CNB WORKING PAPER SERIES 5/2007 Jiří Podpiera
Laurent Weill Bad luck or bad management? Emerging banking market experience
4/2007 Roman Horváth The time-varying policy neutral rate in real time: A predictor for future inflation?
3/2007 Jan Brůha Jiří Podpiera Stanislav Polák
The convergence of a transition economy: The case of the Czech Republic
2/2007 Ian Babetskii Nauro F. Campos
Does reform work? An econometric examination of the reform-growth puzzle
1/2007 Ian Babetskii Fabrizio Coricelli Roman Horváth
Measuring and explaining inflation persistence: Disaggregate evidence on the Czech Republic
13/2006 Frederic S. Mishkin
Klaus Schmidt-Hebbel
Does inflation targeting make a difference?
12/2006 Richard Disney Sarah Bridges John Gathergood
Housing wealth and household indebtedness: Is there a household ‘financial accelerator’?
11/2006 Michel Juillard Ondřej Kameník Michael Kumhof Douglas Laxton
Measures of potential output from an estimated DSGE model of the United States
10/2006 Jiří Podpiera Marie Raková
Degree of competition and export-production relative prices when the exchange rate changes: Evidence from a panel of Czech exporting companies
9/2006 Alexis Derviz Jiří Podpiera
Cross-border lending contagion in multinational banks
8/2006 Aleš Bulíř Jaromír Hurník
The Maastricht inflation criterion: “Saints” and “Sinners”
7/2006 Alena Bičáková Jiří Slačálek Michal Slavík
Fiscal implications of personal tax adjustments in the Czech Republic
6/2006 Martin Fukač Adrian Pagan
Issues in adopting DSGE models for use in the policy process
5/2006 Martin Fukač New Keynesian model dynamics under heterogeneous expectations and adaptive learning
4/2006 Kamil Dybczak Vladislav Flek Dana Hájková Jaromír Hurník
Supply-side performance and structure in the Czech Republic (1995–2005)
3/2006 Aleš Krejdl Fiscal sustainability – definition, indicators and assessment of Czech public finance sustainability
2/2006 Kamil Dybczak Generational accounts in the Czech Republic 1/2006 Ian Babetskii Aggregate wage flexibility in selected new EU member states

14/2005 Stephen G. Cecchetti The brave new world of central banking: The policy challenges posed by asset price booms and busts
13/2005 Robert F. Engle Jose Gonzalo Rangel
The spline GARCH model for unconditional volatility and its global macroeconomic causes
12/2005 Jaromír Beneš Tibor Hlédik Michael Kumhof David Vávra
An economy in transition and DSGE: What the Czech national bank’s new projection model needs
11/2005 Marek Hlaváček Michael Koňák Josef Čada
The application of structured feedforward neural networks to the modelling of daily series of currency in circulation
10/2005 Ondřej Kameník Solving SDGE models: A new algorithm for the sylvester equation 9/2005 Roman Šustek Plant-level nonconvexities and the monetary transmission
mechanism 8/2005 Roman Horváth Exchange rate variability, pressures and optimum currency
area criteria: Implications for the central and eastern european countries
7/2005 Balázs Égert Luboš Komárek
Foreign exchange interventions and interest rate policy in the Czech Republic: Hand in glove?
6/2005 Anca Podpiera Jiří Podpiera
Deteriorating cost efficiency in commercial banks signals an increasing risk of failure
5/2005 Luboš Komárek Martin Melecký
The behavioural equilibrium exchange rate of the Czech koruna
4/2005 Kateřina Arnoštová Jaromír Hurník
The monetary transmission mechanism in the Czech Republic (evidence from VAR analysis)
3/2005 Vladimír Benáček Jiří Podpiera Ladislav Prokop
Determining factors of Czech foreign trade: A cross-section time series perspective
2/2005 Kamil Galuščák Daniel Münich
Structural and cyclical unemployment: What can we derive from the matching function?
1/2005 Ivan Babouček Martin Jančar
Effects of macroeconomic shocks to the quality of the aggregate loan portfolio
10/2004 Aleš Bulíř Kateřina Šmídková
Exchange rates in the new EU accession countries: What have we learned from the forerunners
9/2004 Martin Cincibuch Jiří Podpiera
Beyond Balassa-Samuelson: Real appreciation in tradables in transition countries
8/2004 Jaromír Beneš David Vávra
Eigenvalue decomposition of time series with application to the Czech business cycle
7/2004 Vladislav Flek, ed. Anatomy of the Czech labour market: From over-employment to under-employment in ten years?
6/2004 Narcisa Kadlčáková Joerg Keplinger
Credit risk and bank lending in the Czech Republic
5/2004 Petr Král Identification and measurement of relationships concerning inflow of FDI: The case of the Czech Republic
4/2004 Jiří Podpiera Consumers, consumer prices and the Czech business cycle identification

3/2004 Anca Pruteanu The role of banks in the Czech monetary policy transmission mechanism
2/2004 Ian Babetskii EU enlargement and endogeneity of some OCA criteria: Evidence from the CEECs
1/2004 Alexis Derviz Jiří Podpiera
Predicting bank CAMELS and S&P ratings: The case of the Czech Republic
12/2003 Tibor Hlédik Modelling the second-round effects of supply-side shocks on inflation
11/2003 Luboš Komárek Zdeněk Čech Roman Horváth
ERM II membership – the view of the accession countries
10/2003 Luboš Komárek Zdeněk Čech Roman Horváth
Optimum currency area indices – how close is the Czech Republic to the eurozone?
9/2003 Alexis Derviz Narcisa Kadlčáková Lucie Kobzová
Credit risk, systemic uncertainties and economic capital requirements for an artificial bank loan portfolio
8/2003 Tomáš Holub Martin Čihák
Price convergence: What can the Balassa–Samuelson model tell us?
7/2003 Vladimír Bezděk Kamil Dybczak Aleš Krejdl
Czech fiscal policy: Introductory analysis
6/2003 Alexis Derviz
FOREX microstructure, invisible price determinants, and the central bank’s understanding of exchange rate formation
5/2003 Aleš Bulíř
Some exchange rates are more stable than others: Short-run evidence from transition countries
4/2003 Alexis Derviz
Components of the Czech koruna risk premium in a multiple-dealer FX market
3/2003 Vladimír Benáček Ladislav Prokop Jan Á. Víšek
Determining factors of the Czech foreign trade balance: Structural issues in trade creation
2/2003 Martin Čihák Tomáš Holub
Price convergence to the EU: What do the 1999 ICP data tell us?
1/2003 Kamil Galuščák Daniel Münich
Microfoundations of the wage inflation in the Czech Republic

CNB RESEARCH AND POLICY NOTES
2/2006 Garry J. Schinasi Private finance and public policy 1/2006 Ondřej Schneider The EU budget dispute – A blessing in disguise?
5/2005 Jan Stráský Optimal forward-looking policy rules in the quarterly projection model of the Czech National Bank
4/2005 Vít Bárta Fulfilment of the Maastricht inflation criterion by the Czech Republic: Potential costs and policy options
3/2005 Helena Sůvová Eva Kozelková David Zeman Jaroslava Bauerová
Eligibility of external credit assessment institutions
2/2005 Martin Čihák Jaroslav Heřmánek
Stress testing the Czech banking system: Where are we? Where are we going?
1/2005 David Navrátil Viktor Kotlán
The CNB’s policy decisions – Are they priced in by the markets?
4/2004 Aleš Bulíř External and fiscal sustainability of the Czech economy: A quick look through the IMF’s night-vision goggles
3/2004 Martin Čihák Designing stress tests for the Czech banking system 2/2004 Martin Čihák Stress testing: A review of key concepts 1/2004 Tomáš Holub Foreign exchange interventions under inflation targeting:
The Czech experience
2/2003 Kateřina Šmídková Targeting inflation under uncertainty: Policy makers’ perspective
1/2003 Michal Skořepa Viktor Kotlán
Inflation targeting: To forecast or to simulate?
CNB ECONOMIC RESEARCH BULLETIN
December 2007 Fiscal policy and its sustainability August 2007 Financial stability in a transforming economy November 2006 ERM II and euro adoption August 2006 Research priorities and central banks November 2005 Financial stability May 2005 Potential output October 2004 Fiscal issues May 2004 Inflation targeting December 2003 Equilibrium exchange rate

Czech National Bank Economic Research Department Na Příkopě 28, 115 03 Praha 1
Czech Republic phone: +420 2 244 12 321
fax: +420 2 244 14 278 http://www.cnb.cz
e-mail: [email protected]