2006 trustees report - cms2006 annual report of the boards of trustees of the federal hospital...
TRANSCRIPT

2006 ANNUAL REPORT OF
THE BOARDS OF TRUSTEES OF THE
FEDERAL HOSPITAL INSURANCE AND
FEDERAL SUPPLEMENTARY MEDICAL INSURANCE
TRUST FUNDS
COMMUNICATION
From
THE BOARDS OF TRUSTEES,
FEDERAL HOSPITAL INSURANCE AND
FEDERAL SUPPLEMENTARY MEDICAL INSURANCE
TRUST FUNDS
Transmitting
THE 2006 ANNUAL REPORT OF
THE BOARDS OF TRUSTEES OF THE
FEDERAL HOSPITAL INSURANCE AND
FEDERAL SUPPLEMENTARY MEDICAL INSURANCE
TRUST FUNDS


LETTER OF TRANSMITTAL
__________
BOARDS OF TRUSTEES OF THE
FEDERAL HOSPITAL INSURANCE AND
FEDERAL SUPPLEMENTARY MEDICAL INSURANCE TRUST FUNDS,
Washington, D.C., May 1, 2006
HONORABLE J. Dennis Hastert Speaker of the House of Representatives Washington, D.C.
HONORABLE Richard B. Cheney President of the Senate Washington, D.C.
GENTLEMEN:
We have the honor of transmitting to you the 2006 Annual Report of the Boards of Trustees of the Federal Hospital Insurance Trust Fund and the Federal Supplementary Medical Insurance Trust Fund, the 41st such report.
Respectfully,
/S/ John W. Snow, Secretary of the
Treasury, and Managing Trustee of the Trust Funds.
/S/ Elaine L. Chao, Secretary of Labor,
and Trustee.
/S/ Michael O. Leavitt, Secretary of
Health and Human Services, and Trustee.
/S/ Jo Anne B. Barnhart, Commissioner
of Social Security, and Trustee.
/S/ John L. Palmer, Trustee.
/S/ Thomas R. Saving, Trustee.
/S/ Mark B. McClellan, M.D., Ph.D., Administrator
of the Centers for Medicare & Medicaid Services, and Secretary, Boards of Trustees.


III
CONTENTS
I. INTRODUCTION................................................................................. 1 II. OVERVIEW ........................................................................................ 2
A. Highlights ........................................................................................ 2 B. Medicare Data for Calendar Year 2005 ......................................... 5 C. Economic and Demographic Assumptions .................................... 6 D. Financial Outlook for the Medicare Program ............................. 10 E. Financial Status of the HI Trust Fund ....................................... 15 F. Financial Status of the SMI Trust Fund ..................................... 20 G. Conclusion ..................................................................................... 27
III. ACTUARIAL ANALYSIS ............................................................... 29 A. Medicare Financial Projections .................................................... 29 B. HI Financial Status ...................................................................... 40
1. Financial Operations in Fiscal Year 2005 ............................... 40 2. 10-Year Actuarial Estimates (2006-2015) ............................... 46 3. 75-Year Actuarial Estimates (2006-2080) ............................... 53 4. Long-Range Sensitivity Analysis ............................................. 69
C. SMI Financial Status ................................................................... 74 1. Total SMI ................................................................................... 74
a. 10-Year Actuarial Estimates (2006-2015) ........................... 75 b. 75-Year Actuarial Estimates (2006-2080) ........................... 77 c. Implications of SMI Cost Growth ......................................... 77
2. Part B Account .......................................................................... 81 a. Financial Operations in Fiscal Year 2005 ........................... 81 b. 10-Year Actuarial Estimates (2006-2015) ........................... 88 c. 75-Year Actuarial Estimates (2006-2080) ......................... 101
3. Part D Account ........................................................................ 105 a. Financial Operations in Fiscal Year 2005 ......................... 106 b. 10-Year Actuarial Estimates (2006-2015) ......................... 106 c. 75-Year Actuarial Estimates (2006-2080) ......................... 113
IV. ACTUARIAL METHODOLOGY .................................................. 118 A. Hospital Insurance ..................................................................... 118 B. Supplementary Medical Insurance ............................................ 131
1. Part B ....................................................................................... 131 2. Part D ....................................................................................... 145
C. Long-Range Medicare Cost Growth Assumptions .................... 153 V. APPENDICES ................................................................................. 156
A. Medicare Amendments since the 2005 Report ......................... 156 B. Average Medicare Expenditures per Beneficiary ..................... 159 C. Medicare Cost Sharing and Premium Amounts ....................... 162 D. Supplementary Assessment of Uncertainty in Part B Cost
Projections ................................................................................... 168 E. Medicare and Social Security Trust Funds and the Federal
Budget .......................................................................................... 179 F. Fiscal Year Historical Data and Projections through 2015...... 187 G. Glossary ....................................................................................... 195 C. List of Tables ............................................................................... 214 C. List of Figures ............................................................................. 218 H. Statement of Actuarial Opinion ................................................ 219


1
I. INTRODUCTION
The Medicare program has two components. Hospital Insurance (HI),
or Medicare Part A, helps pay for hospital, home health, skilled
nursing facility, and hospice care for the aged and disabled.
Supplementary Medical Insurance (SMI) consists of Medicare Part B
and Part D.1 Part B helps pay for physician, outpatient hospital,
home health, and other services for the aged and disabled who have
voluntarily enrolled. Part D initially provided access to prescription
drug discount cards and transitional assistance to low-income
beneficiaries. In 2006 and later, Part D provides subsidized access to
drug insurance coverage on a voluntary basis for all beneficiaries and
premium and cost-sharing subsidies for low-income enrollees.
The Medicare Board of Trustees was established under the Social
Security Act to oversee the financial operations of the HI and SMI
trust funds.2 The Board comprises six members. Four members serve
by virtue of their positions in the Federal Government: the Secretary
of the Treasury, who is the Managing Trustee; the Secretary of Labor;
the Secretary of Health and Human Services; and the Commissioner
of Social Security. The other two members, John L. Palmer and
Thomas R. Saving, are public representatives initially appointed by
the President on October 28, 2000, and reappointed on April 18, 2006.
The Administrator of the Centers for Medicare & Medicaid Services
(CMS) is designated as Secretary of the Board.
The Social Security Act requires that the Board, among other duties,
report annually to the Congress on the financial and actuarial status
of the HI and SMI trust funds. This 2006 report is the 41st to be
submitted.
1Medicare also has a Part C, which provides Part A and Part B coverage and,
optionally, Part D coverage through private health insurance plans. 2Technically, separate boards are established for HI and SMI. Because both boards
have the same membership, for convenience they are collectively referred to as the
Medicare Board of Trustees in this report.
Overview
2
II. OVERVIEW
A. HIGHLIGHTS
The major findings of this report under the intermediate set of
assumptions are summarized below.
In 2005
In 2005, 42.5 million people were covered by Medicare: 35.8 million
aged 65 and older, and 6.7 million disabled. Total benefits paid in
2005 were $330 billion. Income was $357 billion, expenditures were
$336 billion, and assets held in special issue U.S. Treasury securities
grew to $310 billion.
Short-Range Results
The HI trust fund is not adequately financed over the next 10 years
under the intermediate assumptions. From the beginning of 2006 to
the end of 2015, the assets of the HI trust fund are projected to
decrease from $286 billion to $197 billion, which would be less than
the recommended minimum level of 1 year‟s expenditures.
The SMI trust fund is adequately financed over the next 10 years
because of the automatic financing established for Parts B and D.
Over the next 10 years, however, projected Part B payments are
unrealistically constrained due to multiple years of physician fee
reductions that would occur under current law. Moreover, Part B
assets are substantially below appropriate levels. Part B benefit
payments have increased by an average of 10.6 percent annually over
the last 6 years. For Part D, the average annual increase in benefit
payments is estimated to be 11.5 percent from 2006 to 2015,
compared to an average annual growth rate of 4.9 percent for GDP
over the same period. Roughly 1.2 percent of this projected annual
increase is due to the expected growth in the participation rate
among the eligible population.
The difference between Medicare‟s total outlays and its “dedicated
financing sources” is estimated to reach 45 percent of outlays in fiscal
year 2012. As a result, under section 801 of the Medicare
Modernization Act, the Board of Trustees is issuing a determination
of “excess general revenue Medicare funding” in this report.

Highlights
3
Long-Range Results
Under the intermediate assumptions the HI trust fund is projected to
be exhausted in 2018, 2 years earlier than in last year‟s report, due to
slightly higher costs in 2005 than previously estimated and some
upward revisions in the short-range assumptions about utilization of
HI services. For the 75-year projection period, the actuarial deficit is
3.51 percent of taxable payroll, 0.42 percentage points higher than in
last year‟s report.
The HI annual cost rate is projected to increase from 3.11 percent of
taxable payroll in 2005 to 11.59 percent in 2080—8.17 percent of
taxable payroll more than the projected income rate for 2080.
Expressed in relation to the projected Gross Domestic Product (GDP),
HI cost is estimated to rise from the current level of 1.5 percent of
GDP to 4.9 percent in 2080. Projected costs are initially higher than
in last year‟s report, but ultimately significantly lower, as a result of
a refinement in the long-range cost growth assumptions.
Part B outlays were 1.3 percent of GDP in 2005 and are projected to
grow to about 3.8 percent by 2080. Compared to the projections in last
year‟s report, Part B costs are generally a somewhat smaller share of
GDP after 2016, especially by the end of the 75-year projection period.
This change reflects a number of factors, including the refinement to
the long-range growth rate assumptions.
Part D outlays are estimated to be 0.4 percent of GDP in 2006 and
are projected to grow to about 2.3 percent by 2080, a significantly
lower level than projected in last year‟s report. Part D costs are
projected at lower levels in part as a result of new data on drug cost
trends in 2004 and 2005 and on plan cost and enrollment levels for
2006. The refinement in the cost growth assumptions also affects the
long-range Part D projections.
Conclusion
The financial outlook for the Medicare program continues to raise
serious concerns, despite its lower projected costs at the end of the
75-year projection period. Total Medicare expenditures were
$336 billion in 2005 and are expected to increase in future years at a
faster pace than either workers‟ earnings or the economy overall. As a
percentage of GDP, expenditures are projected to increase from
2.7 percent in 2005 to 11.0 percent by 2080 (based on our
intermediate set of assumptions). Although this level compares
favorably with the corresponding estimate of 13.6 percent of GDP

Overview
4
shown in last year‟s report, growth of this magnitude, if realized,
would still substantially increase the strain on the nation‟s workers,
Medicare beneficiaries, and the Federal Budget.
HI tax income began falling short of HI expenditures in 2004 and is
projected to do so in all future years. The HI trust fund does not meet
our short-range test of financial adequacy, and fund assets are
projected to be exhausted in 2018. In the long range, projected
expenditures and scheduled tax income are substantially out of
balance, and the trust fund does not meet our test of long-range close
actuarial balance. Currently, this imbalance is relatively small, with
tax income covering 98 percent of costs in 2006, but will grow rapidly
in the absence of changes to current law: taxes would cover
80 percent of estimated costs in 2018, and only 29 percent at the end
of the long-range period. Closing deficits of this magnitude will
require very substantial increases in tax revenues and/or reductions
in expenditures.
The Part B and Part D accounts in the SMI trust fund are adequately
financed under current law, since premium and general revenue
income are reset each year to match expected costs. Such financing,
however, would have to increase rapidly to match expected
expenditure growth under current law and, more immediately, to
rebuild the Part B assets to an appropriate level.
These projections demonstrate the need for timely and effective
action to address Medicare‟s financial challenges. Consideration of
such reforms should occur in the relatively near future. The sooner
the solutions are enacted, the more flexible and gradual they can be.
Moreover, the early introduction of reforms increases the time
available for affected individuals and organizations—including health
care providers, beneficiaries, and taxpayers—to adjust their
expectations. We believe that prompt, effective, and decisive action is
necessary to address these challenges—both the exhaustion of the HI
trust fund and the anticipated rapid growth in HI, SMI Part B, and
SMI Part D expenditures.

Medicare Data
5
B. MEDICARE DATA FOR CALENDAR YEAR 2005
HI and SMI have separate trust funds, sources of revenue, and
categories of expenditures. Table II.B1 presents Medicare data for
calendar year 2005, in total and for each part of the program. The
largest category of HI expenditures is inpatient hospital services,
while the largest SMI expenditure category is physician services.
Table II.B1.—Medicare Data for Calendar Year 2005 HI SMI Total
Assets at end of 2004 (billions) $269.3 $19.4 $288.8
Total income $199.4 $158.1 $357.5
Payroll taxes 171.4 — 171.4 Interest 15.2 1.4 16.6 Taxation of benefits 8.8 — 8.8 Premiums 2.4 37.5 40.0 General revenue 0.5 118.1 118.6 Other 1.1 1.1 2.2
Total expenditures $182.9 $153.5 $336.4
Benefits 180.0 150.3 330.3 Hospital 121.7 23.6 145.2 Skilled nursing facility 18.5 — 18.5 Home health care 5.9 6.6 12.6 Physician fee schedule services — 57.8 57.8 Managed care 24.9 22.1 47.1 Drug card subsidies — 1.0 1.0 Other 8.9 39.2 48.2
Administrative expenses $2.9 $3.2 $6.1
Net change in assets $16.4 $4.6 $21.0
Assets at end of 2005 $285.8 $24.0 $309.8
Enrollment (millions) Aged 35.4 33.7 35.8 Disabled 6.7 5.9 6.7 Total 42.0 39.6 42.5
Average benefit per enrollee $4,284 $3,796 $8,080
Note: Totals do not necessarily equal the sums of rounded components.
For HI, the primary source of financing is the payroll tax on covered
earnings. Employers and employees each pay 1.45 percent of wages,
while self-employed workers pay 2.9 percent of their net income.
Other HI revenue sources include a portion of the federal income
taxes that people pay on their Social Security benefits, and interest
paid on the U. S. Treasury securities held in the HI trust fund.
For SMI, transfers from the general fund of the Treasury represent
the largest source of income, currently covering roughly 75 percent of
program costs. Beneficiaries pay monthly premiums that finance
about 25 percent of Part B costs. As with HI, interest is paid on the
U. S. Treasury securities held in the SMI trust fund.

Overview
6
C. ECONOMIC AND DEMOGRAPHIC ASSUMPTIONS
Actual future Medicare expenditures will depend on a number of
factors, including the size and composition of the population eligible
for benefits, changes in the volume and intensity of services, and
increases in the price per service. For HI, future trust fund income
will depend on the size and characteristics of the covered work force
and the level of workers‟ earnings. These factors will depend in turn
upon future birth rates, death rates, labor force participation rates,
wage increases, and many other economic and demographic
circumstances affecting Medicare. To illustrate the uncertainty and
sensitivity inherent in estimates of future Medicare trust fund
operations, projections have been prepared under a “low cost” and a
“high cost” set of assumptions as well as under an intermediate set.
Table II.C1 summarizes the key assumptions used in this report.
Many of the demographic and economic variables that determine
Medicare costs and income are common to the Old-Age, Survivors,
and Disability Insurance (OASDI) program and are explained in
detail in the report of the OASDI Board of Trustees. These variables
include changes in the Consumer Price Index (CPI) and wages, real
interest rates, fertility rates, and mortality rates. (“Real” indicates
that the effects of inflation have been removed.) The assumptions
vary, in most cases, from year to year during the first 5 to 30 years
before reaching their so-called “ultimate” values for the remainder of
the 75-year projection period. Other assumptions are specific to
Medicare.
As with all of the assumptions underlying the Trustees‟ financial
projections, the Medicare-specific assumptions are reviewed annually
and updated based on the latest available data and analysis of trends.
In addition, the assumptions and projection methodology are subject
to periodic review by independent panels of expert actuaries and
economists. The most recent such review was conducted by the 2004
Medicare Technical Review Panel, which issued its findings in
December 2004.

Economic and Demographic Assumptions
7
Table II.C1.—Ultimate Assumptions
Intermediate Low Cost High Cost
Economic: Annual percentage change in:
Gross Domestic Product (GDP) per capita1 ................ 4.1 3.5 4.6
Average wage in covered employment........................ 3.9 3.4 4.4 Consumer Price Index (CPI) ........................................ 2.8 1.8 3.8
Real-wage differential (percent) ...................................... 1.1 1.6 0.6 Real interest rate (percent) ............................................. 2.9 3.6 2.1
Demographic: Total fertility rate (children per woman) ........................... 2.00 2.30 1.70 Average annual percentage reduction in total
age-sex adjusted death rates from 2030 to 2080 ....... 0.70 0.33 1.22
Health cost growth: Annual percentage change in per beneficiary
Medicare expenditures (excluding demographic impacts)
1 ...................................................................... 5.1
2 3
3
1The assumed ultimate increases in per capita GDP and per beneficiary Medicare expenditures can also
be expressed in real terms, adjusted to remove the impact of assumed inflation growth. Adjusting by the chain-weighted GDP price index, assumed real per capita GDP growth is 1.5 percent, and real per beneficiary Medicare cost growth is 2.5 percent. 2Cost growth assumptions in the last 50 years of the projection vary year by year and follow a smooth
downward path that is equivalent to growth at the GDP plus one percent level for the last 50 years (5.1 percent). 3See section III.B for further explanation.
The assumed long-range rate of growth in annual Medicare
expenditures per beneficiary is one of the most critical determinants
of the projected cost of Medicare-covered health care services in the
more distant future. In recent reports, the increase in average
expenditures per beneficiary for the 25th through 75th years of the
projection has been assumed to equal the growth in per capita GDP
plus 1 percentage point.3 This assumption was recommended by the
2000 Medicare Technical Review Panel. With the inclusion of infinite-
horizon projections starting in the 2004 Trustees Report, per
beneficiary expenditures after the 75th year were assumed to increase
at the same rate as per capita GDP. The 2004 Technical Review
Panel recommended that these assumptions continue to be used,
given the limits of current knowledge, but that further research also
be conducted.
For this year‟s report, the Board of Trustees has adopted a slight
refinement of the long-range growth assumption that provides a more
gradual transition from current health cost growth rates, which have
been roughly 2 to 3 percentage points above the level of GDP growth,
to the ultimate assumed level of GDP plus zero percent just after the
75th year and for the indefinite future. The year-by-year growth
assumptions are based on a simplified economic model and are
3This assumed increase in the average expenditures per beneficiary excludes the
impacts of the aging of the population and changes in the gender composition of the
Medicare population, which are estimated separately.

Overview
8
determined in a way such that the 75-year actuarial balance for the
HI trust fund is consistent with that generated by the “GDP plus
1 percent” assumption. An independent group of experts in health
economics and long-range forecasting reviewed the new model and
advised that its use for this purpose was appropriate. Consistent with
the recommendations of this group and the 2000 and 2004 Technical
Panels, further research is being conducted on long-range health cost
growth trends.
As in the past, detailed growth rate assumptions are established for
the next 10 years by individual type of service (for example, inpatient
hospital care, physician services, etc.), reflecting recent trends and
the impact of specific statutory provisions. Under the new economic
model, in 2030 the growth rate for all Medicare services is assumed to
be about 1.4 percentage points above the level of GDP growth for that
year. This differential gradually declines to about 0.8 percent in 2050
and to 0.2 percent in 2080.4 Compared to the assumptions used in the
prior several reports, the new growth assumption is initially higher
but subsequently lower than the constant “GDP plus 1 percent”
assumption. Beyond 75 years, the assumed growth rate of GDP plus
zero percent is essentially unchanged.
In HI, for the high cost assumptions, the annual increase in
aggregate costs (relative to increases in taxable payroll) during the
initial 25-year period is assumed to be 2 percentage points greater
than under the intermediate assumptions. Under low cost
assumptions, the increase during the same period is assumed to be
2 percentage points less than under intermediate assumptions. The
2-percentage-point differentials are assumed to decline gradually
until 2055, when the same rate of increase in HI costs (relative to
taxable payroll) is assumed for all three sets of assumptions.
Because of its automatic financing provisions for Parts B and D, the
SMI trust fund is expected to be adequately financed into the
indefinite future, so a long-range analysis using high cost and low
cost assumptions has not been conducted. The 2004 Technical Panel
recommended refining the presentation of long-range uncertainty
through stochastic techniques or long-range high- and low-cost
alternatives for Parts A, B, and D. The trustees and their staffs
intend to consider alternative methods to illustrate the long-range
uncertainty in the Medicare projections.
4The new cost growth assumptions thus follow a smooth, downward path over the last
50 years of the projection rather than remaining constant.

Economic and Demographic Assumptions
9
While it is reasonable to expect that actual trust fund experience will
fall within the range defined by the three alternative sets of
assumptions, no assurance can be given in light of the wide variations
in experience that have occurred since the beginning of the Medicare
program. In general, a greater degree of confidence can be placed in
the assumptions and estimates for the earlier years than for the later
years. Nonetheless, even for the earlier years, the estimates are only
an indication of the expected trend and the general range of future
Medicare experience. For simplicity of presentation, much of the
analysis in this overview centers on the projections under the
intermediate assumptions.

Overview
10
D. FINANCIAL OUTLOOK FOR THE MEDICARE PROGRAM
This report evaluates the financial status of the HI and SMI trust
funds. For HI, the Trustees apply formal tests of financial status for
both the short range and the long range; for SMI, the Trustees assess
the ability of the trust fund to meet incurred costs over the period for
which financing has been set.
HI and SMI are financed in very different ways. Within SMI, Part B
and Part D premiums and general revenue financing are
reestablished annually to match expected costs for the following year.
In contrast, HI is subject to substantially greater variation in asset
growth, since financing is established through statutory tax rates
that cannot be adjusted to match expenditures except by enactment
of new legislation.
Despite the significant differences in benefit provisions and financing,
the two components of Medicare are closely related. Most
beneficiaries are enrolled in both HI and SMI Part B, and a majority
have enrolled in SMI Part D. Many receive health care services from
both HI and SMI in a given year. Thus, efforts to improve and reform
either component must necessarily involve the other component as
well. In view of the anticipated growth in Medicare expenditures, it is
also important to consider the distribution among the various sources
of revenues for financing Medicare and the manner in which this will
change over time under current law.
In this section, the projected total expenditures for the Medicare
program are considered, along with the primary sources of financing.
Figure II.D1 shows projected costs as a percentage of GDP. Medicare
expenditures represented 2.7 percent of GDP in 2005. With the
additional benefits provided in the new Part D program, total
Medicare spending is projected to be 3.2 percent of GDP in 2006. It
increases to about 7.3 percent of GDP by 2035 under the intermediate
assumptions and to 11.0 percent of GDP by the end of the 75-year
period.

Medicare Financial Outlook
11
Figure II.D1.—Medicare Expenditures as a Percentage of the Gross Domestic Product
0%
2%
4%
6%
8%
10%
12%
2000 2010 2020 2030 2040 2050 2060 2070 2080
Calendar year
Total
HI
Part B
Part D
This forecast reflects (i) continuing growth in the volume and
intensity of services provided per beneficiary throughout the
projection period, (ii) the impact of a large increase in beneficiaries
starting in about 2010 as the leading edge of the 1946-65 baby boom
generation reaches age 65 and becomes eligible to receive benefits,
and (iii) the introduction of the Part D program in 2004, along with
the other provisions of the Medicare Prescription Drug, Improvement,
and Modernization Act of 2003 (also known informally as the
Medicare Modernization Act, or MMA) and the Deficit Reduction Act
of 2005. Other key demographic trends are also reflected, including
future birth rates at roughly the same level as during the last
2 decades and continuing improvements in life expectancy.
The past and projected amounts of Medicare revenues, under current
law, are shown in figure II.D2. Interest income is excluded since it
would not be a significant part of program financing in the long
range. Medicare revenues—from HI payroll taxes, HI income from
the taxation of Social Security benefits, SMI Part D State transfers
for certain Medicaid beneficiaries, HI and SMI premiums, and HI and
SMI general revenues—are compared to total Medicare expenditures.
Over the next 6 years, such Medicare revenues are estimated to be
slightly below program expenditures, reflecting the automatic
financing of SMI for Parts B and D plus a small but increasing deficit
of HI expenditures over tax income. Thereafter, overall expenditures

Overview
12
are projected to exceed aggregate revenues to a far greater extent, as
a result of the projected large financial imbalance in the HI trust
fund.
Figure II.D2.—Medicare Sources of Non-Interest Income and Expenditures as a Percentage of the Gross Domestic Product
0%
3%
6%
9%
12%
1966 1976 1986 1996 2006 2016 2026 2036 2046 2056 2066 2076
Calendar year
Historical Estimated
Payroll taxesTax on benefits
Premiums
General revenue
transfers
Total expenditures
HI deficit
State transfers
As shown in figure II.D2, payroll tax revenues increased steadily as a
percentage of GDP in the historical period, due to increases in the HI
payroll tax rate and the limit on taxable earnings, the latter of which
was eliminated in 1994. In the future, however, payroll taxes are
projected to grow more slowly than GDP.5 HI revenue from income
taxes on Social Security benefits would increase as a share of GDP as
additional beneficiaries become subject to such taxes.
By comparison, growth in SMI Part B and Part D premiums and
general fund transfers is expected to continue to outpace GDP growth
and HI payroll tax growth in the future. This phenomenon occurs
primarily because, under current law, SMI revenue increases at the
same rate as expenditures, whereas HI revenue does not. Thus, as
the HI sources of revenue become increasingly inadequate to cover HI
costs, SMI revenues would represent a growing share of total
Medicare revenues. Soon after the Part D program becomes fully
5Although total worker compensation is projected to grow at the same rate as GDP,
wages and salaries are expected to increase more slowly and fringe benefits (health
insurance costs in particular) more rapidly. Thus, earnings are projected to gradually
decline as a percentage of GDP. Absent any change to the tax rate scheduled under
current law, HI payroll tax revenue would similarly decrease as a percentage of GDP.

Medicare Financial Outlook
13
implemented in 2006, general revenue transfers are expected to
constitute the largest single source of income to the Medicare
program as a whole—and would add significantly to the Federal
Budget pressures. Although a smaller share of the total, SMI
premiums would grow just as rapidly as general revenue transfers,
thereby also placing a growing burden on beneficiaries.
The interrelationship between the Medicare program and the Federal
Budget is an important topic—one that will become increasingly so
over time as the general revenue requirements for SMI continue to
grow. While these transfers are an important source of financing for
the SMI trust fund, and are central to the automatic financial balance
of the fund‟s two accounts, they represent a large and growing
requirement for the Federal Budget. Moreover, in the absence of
corrective legislation, the difference between HI tax revenues and
expenditures would be met for a number of years by interest earnings
on trust fund assets and by redeeming those assets. Both of these
financial resources for the HI trust fund require cash transfers from
the general fund of the Treasury, thereby placing a further obligation
on the budget. Appendix E describes the interrelationship between
the Federal Budget and the Medicare and Social Security trust funds
and illustrates the programs‟ long-range financial outlook from both a
“trust fund perspective” and a “budget perspective.”
The Medicare Modernization Act requires the Board of Trustees to
test whether the difference between program outlays and dedicated
financing sources exceeds 45 percent of Medicare outlays.6 If this level
is attained within the first 7 years of the projection (2006-2012), a
determination of “excess general revenue Medicare funding” is
required. The difference is projected to first reach the 45-percent level
in fiscal year 2012. Consequently, the Trustees are announcing such a
determination in this year‟s annual report (the first such finding). If
such determinations are present in two consecutive Trustees Reports,
then a “Medicare funding warning” is triggered, as described in
section III.A of this report.
This section has summarized the total financial obligation posed by
Medicare and the manner in which it is financed. Under current law,
however, the HI and SMI components of Medicare have separate and
distinct trust funds, each with its own sources of revenues and
mandated expenditures. Accordingly, the financial status of each
6The dedicated financing sources are HI payroll taxes, the HI share of income taxes on
Social Security benefits, Part D State transfers, and beneficiary premiums. These
sources are the first four layers depicted in figure II.D2.

Overview
14
Medicare trust fund must be assessed separately. The next two
sections of the overview present such assessments for the HI trust
fund and the SMI trust fund, respectively.

HI Financial Status
15
E. FINANCIAL STATUS OF THE HI TRUST FUND
1. 10-Year Actuarial Estimates (2006-2015)
Over the next 10 years, HI expenditures are expected to grow faster
than income. Expenditure growth is estimated to average 7.1 percent
per year. HI income growth averages 4.9 percent per year over this
period. Currently, the HI trust fund is experiencing small annual
surpluses of total income over expenditures. These surpluses are
expected to decline until expenditures exceed income and deficits
emerge in 2010 and later. If interest earnings and general revenues
are excluded from income, then expenditures exceed tax income in
2004 and thereafter. Interest and trust fund assets are needed to pay
expenditures in full and on time from 2004 until the HI trust fund is
projected to become exhausted in 2018.
Table II.E1 presents the projected operations of the HI trust fund
under the intermediate assumptions for the next decade. At the
beginning of 2006, HI assets significantly exceeded annual
expenditures. The Board of Trustees has recommended that assets be
maintained at a level at least equal to annual expenditures, to serve
as an adequate contingency reserve in the event of adverse economic
or other conditions.
Based on the 10-year projection shown in table II.E1, the Board of
Trustees applies an explicit test of short-range financial adequacy,
which is described in section III.B of this report. The HI trust fund
does not meet this test because assets are estimated to fall below
100 percent of annual expenditures within the next 10 years.
Table II.E1.—Estimated Operations of the HI Trust Fund under Intermediate Assumptions, Calendar Years 2005-2015
[Dollar amounts in billions]
Calendar year Total income1
Total expenditures
Change in fund Fund at year end
Ratio of assets to expenditures
2
(percent)
2005 3 199.4 182.9 16.4 285.8 147
2006 210.2 200.5 9.7 295.5 143 2007 219.0 213.1 5.9 301.4 139 2008 233.4 226.6 6.9 308.3 133 2009 245.7 242.6 3.1 311.3 127 2010 257.4 259.2 -1.8 309.6 120 2011 270.9 276.9 -6.1 303.5 112 2012 284.3 296.5 -12.2 291.3 102 2013 296.4 317.7 -21.3 270.0 92 2014 308.4 339.6 -31.1 238.9 80 2015 320.3 362.5 -42.2 196.6 66 1Includes interest income.
2Ratio of assets in the fund at the beginning of the year to expenditures during the year.
3Figures for 2005 represent actual experience.
Note: Totals do not necessarily equal the sums of rounded components.

Overview
16
A comparison with last year‟s estimates reveals that actual payroll
tax and other income in 2005 and projected future amounts are
slightly higher than previously projected. In addition, projected HI
expenditures are slightly higher than before, due to higher growth in
2005 and slightly higher assumed future growth rates. Together,
these factors result in a more rapid depletion of trust fund assets
than previously estimated, thereby lowering interest earnings as
well. The cumulative effect of these factors is a significantly lower
level of projected HI assets relative to annual expenditures.
2. 75-Year Actuarial Estimates (2006-2080)
Each year, 75-year estimates of the financial and actuarial status of
the HI trust fund are prepared. Although financial outcomes are
inherently uncertain, particularly over periods as long as 75 years,
such estimates can indicate whether the trust fund—as seen from
today‟s vantage point—is considered to be in satisfactory financial
condition.
Because of the difficulty in comparing dollar values for different
periods without some type of relative scale, income and expenditure
amounts are shown relative to the earnings in covered employment
that are taxable under HI (referred to as “taxable payroll”). The ratio
of tax income (including both payroll taxes and income from taxation
of Social Security benefits, but excluding interest income) to taxable
payroll is called the “income rate,” and the ratio of expenditures to
taxable payroll is the “cost rate.”
Since HI payroll tax rates are not scheduled to change in the future
under current law, payroll tax income as a percentage of taxable
payroll will remain constant at 2.90 percent. Income from taxation of
benefits will increase only gradually as a greater proportion of Social
Security beneficiaries become subject to such taxation over time.
Thus, the income rate is not expected to increase significantly over
current levels. The cost rate, though, will sharply escalate due to
retirements of those in the baby boom generation and continuing
health services cost growth, as mentioned in the prior section.
Figure II.E1 compares projected income and cost rates under the
intermediate assumptions. As indicated, HI expenditures are
projected to continue to exceed tax income by a rapidly growing
margin. In 2018, for example, taxes would cover only 80 percent of
estimated expenditures and, in 2050, only 38 percent. By the end of
the 75-year period, HI costs would be over three times the level of
scheduled tax revenues—a substantial deficit by any standard.

HI Financial Status
17
The shaded area in figure II.E1 represents the excess of expenditures
over tax income that could be met by interest earnings and the
redemption of trust fund assets. Both types of transactions occur
through transfers from the general fund of the Treasury. Beginning
in 2004, the fund began using interest earnings to cover the excess of
expenditures over tax income. Beginning in 2010, trust fund assets
will begin to be used also, to cover the excess. In the absence of other
changes, this process will continue through 2018, at which time the
fund is projected to be exhausted. The HI trust fund‟s projected year
of exhaustion often receives considerable attention. In practice,
however, the demands on general revenue (to pay interest and
redeem the Treasury bonds held by the trust fund) have already
begun, some 14 years before the exhaustion date. By 2017, in the
absence of legislation to address the HI deficits, an estimated
18 percent of HI expenditures would have to be met by redeeming
assets as opposed to being covered by tax income for that year.
Figure II.E1.—Long-Range HI Income and Cost as a Percentage of Taxable Payroll, Intermediate Assumptions
0%
2%
4%
6%
8%
10%
12%
1967 1977 1987 1997 2007 2017 2027 2037 2047 2057 2067 2077
Calendar year
Cost rate
Income rate
Historical Estimated
Deficit
Amount of deficit that would be covered by
interest earnings and asset redemptions
The year-by-year cost rates and income rates shown in figure II.E1
can be summarized into single values representing, in effect, the
average value over a given period. Based on the intermediate
assumptions, an actuarial deficit of 3.51 percent of taxable payroll is
projected for the 75-year period, representing the difference between
the summarized income rate of 3.39 percent and the corresponding

Overview
18
cost rate of 6.90 percent. Based on this measure, the HI trust fund
continues to fail the Trustees‟ test for long-range financial balance.
The long-range financial imbalance could be addressed in several
different ways. In theory, the 2.90-percent payroll tax could be
immediately increased to 6.41 percent, or expenditures could be
reduced by a corresponding amount. Note, however, that these
changes would require an immediate 121-percent increase in the tax
rate or an immediate 51-percent reduction in expenditures.7 More
realistically, the tax and/or benefit changes could be made gradually,
rather than immediately, but would ultimately have to reach much
more substantial levels to eliminate the deficit throughout the long-
range period. At the end of the 75-year period, for example, the tax
rate would have to be more than three times its current level, or
benefit expenditures would have to be less than one-third of their
projected amount (or some combination). These examples illustrate
the severe magnitude of the projected long-range deficits for the HI
trust fund and the need for reform.
Under the intermediate assumptions, the assets of the HI trust fund
would continue decreasing, as a percentage of annual expenditures,
from about 143 percent of annual expenditures at the beginning of
2006 until becoming exhausted in 2018, as illustrated in figure II.E2.
This date is 2 years earlier than estimated in the 2005 annual report,
due to the slightly higher expenditure projections mentioned earlier.
7Under either of these two scenarios, tax income would initially be substantially
greater than expenditures, and trust fund assets would accumulate rapidly.
Subsequently, however, financing would be increasingly inadequate, and assets would
be drawn down to cover the difference. At the end of the 75-year period, tax income
would cover only about 60 percent of annual expenditures. Level changes in either
taxes or benefits, consequently, would not permanently address the long-range
financial imbalance and would result in unusual patterns of asset accumulation and
redemption.

HI Financial Status
19
Figure II.E2.—HI Trust Fund Balance at Beginning of Year as a Percentage of Annual Expenditures
0%
25%
50%
75%
100%
125%
150%
175%
1990 1995 2000 2005 2010 2015 2020 2025
Beginning of January
EstimatedHistorical
To the extent that actual future conditions vary from the
intermediate assumptions, the date of exhaustion could differ
substantially in either direction from this estimate. Under the low
cost assumptions, trust fund assets would not be depleted until 2041.
Under the high cost assumptions, however, asset depletion would
occur in 2013.

Overview
20
F. FINANCIAL STATUS OF THE SMI TRUST FUND
SMI differs fundamentally from HI in regard to the nature of
financing and the method by which financial status is evaluated. As a
result of the Medicare Modernization Act, SMI is now composed of
two parts, Part B and Part D, each with its own separate account
within the SMI trust fund. The financial status of the SMI trust fund
must be determined by evaluating the financial status of each
account separately, since there is no provision in the law for
transferring assets between the Part B and Part D accounts. The
nature of the financing for both parts of SMI is similar, in that the
Part B premium and the Part D premium, and the corresponding
transfers from general revenues for each part, are established
annually at a level sufficient to cover the following year‟s estimated
expenditures. Thus, each account within SMI is automatically in
financial balance under current law. For OASDI and HI, however,
financing established many years earlier may prove significantly
higher or lower than subsequent actual costs. Moreover, Part B and
Part D are voluntary (whereas OASDI and HI are generally
compulsory), and income is not based on payroll taxes. These
disparities result in a financial assessment that differs in some
respects from that for OASDI or HI, as described in the following
sections.
1. 10-Year Actuarial Estimates (2006-2015)
Table II.F1 shows the estimated operations of the Part B account, the
Part D account, and the total SMI trust fund under the intermediate
assumptions during calendar years 2005 through 2015. For Part B,
expenditures grew at an average annual rate of 10.9 percent over the
past 5 years, primarily as a result of significant increases in the
volume and complexity of most types of covered services. Part B cost
increases are estimated to average about 7.0 percent for the 10-year
period 2006 to 2015. (Much of the slower projected spending growth is
attributable to unrealistically low physician payment updates
required by current law.) For comparison, GDP grew at an average
annual rate of 4.9 percent over the past 5 years, and is expected to
grow at an average annual rate of 5.0 percent over the next 10 years.
Part B income growth normally matches expenditure growth fairly
closely. In 2007, however, significantly faster growth in income will
be necessary to restore the Part B assets to an adequate contingency
reserve, which is low for reasons discussed later in this section.

SMI Financial Status
21
As noted, the projected Part B expenditure and income growth is
unrealistically low, due to the structure of physician payment
updates under current law. Future physician payment increases must
be adjusted downward if cumulative past actual physician spending
exceeds a statutory target. Prior to the Medicare Modernization Act
(MMA), past spending was already above the target level. The MMA
raised the physician fee updates for 2004 and 2005, but without
raising the target. The Deficit Reduction Act again raised the
physician fee schedule update for 2006 without raising the target.
Together, these factors yield projected physician updates of about
−5 percent for at least 9 consecutive years, from 2007 through 2015.
Given recent history, multiple years of significant reductions in
physician payments per service are very unlikely to occur before
legislative changes intervene. Scheduled negative physician fee
updates in 2003 through 2006 have already been avoided by
legislation. However, these unrealistic payment reductions are
required under the current law payment system and are reflected in
the Part B projections shown in this report.

Overview
22
Table II.F1.—Estimated Operations of the SMI Trust Fund under Intermediate Assumptions, Calendar Years 2005-2015
[Dollar amounts in billions]
Calendar year Total income1 Total expenditures Change in fund Fund at year end
Part B account: 2005
2 $157.0 $152.4 $4.6 $24.0
2006 177.4 173.3 4.1 28.1 2007 199.1 181.6 17.5 45.6 2008 204.0 194.0 10.0 55.6 2009 228.4
3 207.6 20.8 76.4
2010 204.3 3 220.1 −15.8 60.6
2011 235.3 232.9 2.4 63.0 2012 250.7 248.0 2.7 65.7 2013 267.7 264.8 2.9 68.6 2014 284.7 282.0 2.7 71.3 2015 304.0 299.8 4.1 75.4
Part D account: 2005
2 $1.1 $1.1 — —
2006 59.1 59.1 — — 2007 69.3 69.3 — — 2008 78.9 78.9 — — 2009 87.8 87.8 — — 2010 94.2 94.2 — — 2011 104.8 104.8 — — 2012 115.8 115.8 — — 2013 127.9 127.9 — — 2014 141.2 141.2 — — 2015 155.8 155.8 — —
Total SMI: 2005
2 $158.1 $153.5 $4.6 $24.0
2006 236.5 232.4 4.1 28.1 2007 268.4 250.9 17.5 45.6 2008 282.9 272.9 10.0 55.6 2009 316.1
3 295.3 20.8 76.4
2010 298.5 3 314.3 −15.8 60.6
2011 340.1 337.6 2.4 63.0 2012 366.5 363.8 2.7 65.7 2013 395.6 392.7 2.9 68.6 2014 425.8 423.2 2.7 71.3 2015 459.8 455.7 4.1 75.4 1Includes interest income.
2Figures for 2005 represent actual experience.
3Section 708 of the Social Security Act modifies the provisions for the delivery of Social Security benefit
checks when the regularly designated day falls on a Saturday, Sunday, or legal public holiday. Delivery of benefit checks normally due January 3, 2010 is expected to occur on December 31, 2009. Consequently, the Part B premiums withheld from the checks and the associated general revenue contributions are expected to be added to the Part B account on December 31, 2009. These amounts are excluded from the premium income and general revenue income for 2010.
In general, Part B income and outgo will remain in approximate
balance as a result of the annual adjustment of premium and general
revenue income to match costs. Over temporary periods, it is possible
for these amounts to differ, sometimes significantly. For example,
financing rates for 2004 were set with the intention of increasing the
assets in the Part B account of the trust fund to a more adequate
level. The subsequent enactment of the MMA, however, increased
Part B expenditures significantly above the level anticipated when
the financing was set. Moreover, other factors in 2004 also raised

SMI Financial Status
23
costs faster than anticipated. As a result, Part B assets declined by
$4.5 billion in 2004. This deficit brought the total asset loss during
1999 through 2004 to $26.8 billion, leaving assets at the end of 2004
substantially below the normal level that is optimal for the Part B
account.
Therefore, the financing rates for 2005 and 2006 were set with the
intention of taking steps toward restoring the assets to a more
adequate level. However, the 2005 financing rates were determined
before actual 2004 costs were known, and the 2006 financing rates
were similarly determined before actual 2005 costs were known. In
addition, the Deficit Reduction Act (DRA) increased Part B costs for
2006 and later after the 2006 financing had been determined.
Because of higher-than-anticipated 2004 and 2005 costs and the DRA,
the Part B account assets increased minimally in 2005 and are now
expected to increase minimally in 2006 and remain substantially
below the desired level. Correcting this situation would require an
11-percent increase in the 2007 premium, along with the
corresponding general revenue transfers. Should legislative changes
block the negative physician updates that will occur for 2007 and
later under current law, this increase would need to be larger. After
2007, assets held in the Part B account are projected to maintain an
adequate contingency reserve for the Part B account of the trust fund.
The Part D account of the SMI trust fund was established in 2004 for
Medicare prescription drug coverage, which began in 2006. For 2004
and 2005, the Transitional Assistance Account handled the
transactions for transitional assistance under the prescription drug
card program, with any remaining assets transferred to the Part D
account in 2006.8 Income and expenditures for the Part D account are
projected to grow at an average annual rate of 11.4 percent for the
8-year period 2007 to 2015. As with Part B, income and outgo are
projected to remain in balance as a result of the annual adjustment of
premium and general revenue income to match costs. As a result of
the planned appropriations process for Part D general revenues, it
will not be necessary to maintain a contingency reserve in the
account (see section III.C3 for further details).
The projected Part D costs shown in this report are significantly
lower than those in the 2005 report. The difference is primarily
attributable to three factors.
8For simplicity, the Transitional Assistance Account is treated in this report as if it
were included in the Part D account.

Overview
24
• Actual growth in prescription drug spending in 2004 and 2005 was
much slower than previously expected based on prior trends.
Assumed future growth rates were adjusted accordingly.
• Expected retail discounts, manufacturer rebates, and utilization
management savings, as shown in Part D plan bid data, are greater
than previously assumed for 2006-2010.
• Based on preliminary data on beneficiary enrollment, significantly
fewer beneficiaries are joining Part D plans. Projected Part D costs
are not reduced in full proportion to the reduced enrollment,
however, since the average risk score of enrollees indicates that
they have below-average health status and therefore higher
per-person drug costs.
The primary test of financial adequacy for Parts B and D pertains to
the level of the financing that has been formally established for a
given period (normally, through the end of the current calendar year).
As noted, the financial adequacy must be determined for Part B and
Part D separately. The financing for each part of SMI is considered
satisfactory if it is sufficient to fund all services, including benefits
and administrative expenses, provided through a given period.
Further, to protect against the possibility that cost increases under
either part of SMI will be higher than expected, the accounts of the
trust fund need assets adequate to cover a reasonable degree of
variation between actual and projected costs. For Part B, the
financing established through December 2006 is estimated to be
sufficient to cover benefits and administrative costs incurred through
that time period. As a result of the current higher-than-anticipated
Part B expenditure level and the DRA, however, only slight progress
is expected in 2006 toward restoring the account balance to a more
adequate contingency reserve level. The financing established for
Part D is estimated to be sufficient to cover benefits and
administrative costs incurred through 2006.
The amount of the contingency reserve needed in Part B is much
smaller (both in absolute dollars and as a fraction of annual costs)
than in HI or OASDI. This is so because the premium rate and
corresponding general revenue transfers for Part B are determined
annually based on estimated future costs, while the HI and OASDI
payroll tax rates are set in law and are therefore much more difficult
to adjust should circumstances change. Part D revenues are also
established annually to match estimated costs. Moreover, general
revenue transfers for Part D will be made as funds are needed,

SMI Financial Status
25
thereby eliminating the need for a contingency reserve to cover
unexpectedly higher costs.
2. 75-Year Actuarial Estimates (2006-2080)
Figure II.F1 shows past and projected total SMI expenditures and
premium income as a percentage of the Gross Domestic Product
(GDP). It is important to note that SMI expenditures are significantly
understated as a result of unrealistic negative physician payment
updates required under the current law sustainable growth rate
system, but these updates are included in the intermediate estimates.
Under the intermediate assumptions, annual SMI expenditures
would grow from about 1.3 percent of GDP in 2005 to 1.7 percent of
GDP in 2006 with the commencement of the general prescription
drug coverage. Then, within 25 years, they would grow to 4 percent of
GDP and to more than 6 percent by the end of the projection period.
Figure II.F1.—SMI Expenditures and Premiums as a Percentage of the Gross Domestic Product
0%
1%
2%
3%
4%
5%
6%
7%
1960 1990 2020 2050 2080
Calendar year
Total
expendituresHistorical Estimated
B
Total
premiums Part B
expenditures
Part D
expenditures
D
The projected SMI cost under current law would place steadily
increasing demands on beneficiaries and society at large. Average
per-beneficiary costs for Part B and Part D benefits are projected to
increase in most years by at least 5 percent annually. The associated
beneficiary premiums would increase by approximately the same
rate, as would the average levels of beneficiary coinsurance for
covered services. In contrast, from one generation to the next,

Overview
26
scheduled Social Security benefit levels increase at about the rate of
growth in average earnings (estimated at roughly 3.8 percent).9 Over
time, the Part B and Part D premiums and coinsurance amounts paid
by beneficiaries would typically represent a growing share of their
total Social Security and other income. (Beneficiaries who qualify for
Medicaid and the Part D low-income subsidy are an important
exception to this trend, since they generally pay little or no premiums
and cost-sharing amounts.)
Similarly, aggregate SMI general revenue financing for Parts B and
D is expected to increase by roughly 6.5 percent annually, well in
excess of the projected 4.4-percent growth in GDP. As a result, if
personal and corporate federal income taxes are maintained at their
long-term historical level, relative to the national economy in the
future, then SMI general revenue financing would represent a
growing share of the total income tax revenue of the Federal
Government.
9For each generation, after they are initially eligible, their benefit level is adjusted to
keep up with inflation (estimated at 2.8 percent).

Conclusion
27
G. CONCLUSION
Total Medicare expenditures were $336 billion in 2005 and are
expected to increase in future years at a faster pace than either
workers‟ earnings or the economy overall. As a percentage of GDP,
expenditures are projected to increase from 2.7 percent currently to
11.0 percent by 2080 (based on our intermediate set of assumptions).
The level of Medicare expenditures is expected to exceed that for
Social Security in 2027 and, by 2080, to represent almost twice the
cost of Social Security. Growth of this magnitude, if realized, would
place a substantially greater strain on the nation‟s workers, Medicare
beneficiaries, and the Federal Budget.
Total Medicare outlays, less dedicated revenues, are projected to
exceed 45 percent of outlays in 2012. Since this would be the seventh
year of the projection, the requirements of section 801 of the Medicare
Modernization Act are met, and the Board finds that a condition of
“excess general revenue Medicare funding” exists. A second such
finding, in the 2007 Trustees Report, would trigger a “Medicare
funding warning.”
The HI trust fund ratio has been declining since 2003. The trust fund
is projected to be exhausted in 2018—2 years earlier than estimated
in last year‟s report, primarily as a result of slightly higher costs in
2005 than previously estimated and some upward revisions in the
short-range assumptions about utilization of HI services. The HI
trust fund fails to meet our short-range test of financial adequacy.
The long-range financial projections for HI continue to show a
substantial financial imbalance. The long-range HI actuarial deficit
in this year‟s report is 3.51 percent of taxable payroll, up from
3.09 percent in last year‟s report due to 2005 actual experience and
associated adjustments to utilization assumptions. Tax income is
expected to be less than expenditures in all future years, and trust
fund assets would begin to decline in 2010. Without legislation to
address these deficits, HI would increasingly rely on interest income
and the redemption of fund assets, thereby adding to the draw on the
Federal Budget. Scheduled HI tax income would cover only
80 percent of estimated expenditures in 2018 and only 38 percent in
2050. By the end of the 75-year period, less than one-third of HI costs
could be paid from HI tax revenues. Accordingly, bringing the HI
program into long-range financial balance would require very
substantial increases in revenues and/or reductions in expenditures.
As in past reports, the HI trust fund fails to meet our long-range test
of close actuarial balance.

Overview
28
The financial outlook for SMI is fundamentally different than for HI,
as a result of the statutory differences in how these components of
Medicare are financed. However, rapid expenditure growth is a
serious issue for both components. The Medicare Modernization Act
established a separate account within the SMI trust fund to handle
transactions for the new Medicare drug benefit. Because there is no
authority to transfer assets between the new Part D account and the
existing Part B account, it is necessary to evaluate each account‟s
financial adequacy separately. The financing established for the
Part B account for calendar year 2006 is estimated to be sufficient to
cover expenditures for that year but not to meaningfully increase
assets to a more adequate contingency reserve. Part B assets minus
liabilities are now at their lowest level, relative to annual outlays, in
nearly 30 years. The Part B premium and corresponding general
revenue transfers will need to be increased significantly for 2007 to
match projected costs and to restore Part B assets to a more adequate
reserve level.
No financial imbalance is anticipated for the Medicare Prescription
Drug Account, since the general revenue subsidy for this benefit is
expected to be drawn on a daily, as-needed basis. The projected
Part D costs shown in this report are significantly lower than in
previous reports, reflecting the latest data on drug cost trends
generally and Part D bid and enrollment levels.
For both the Part B and Part D accounts, income is projected to equal
expenditures for all future years—but only because beneficiary
premiums and general revenue transfers will be set to meet expected
costs each year.
The projections shown in this report continue to demonstrate the
need for timely and effective action to address Medicare‟s financial
challenges—both the long-range financial imbalance facing the HI
trust fund and the heightened problem of rapid growth in
expenditures. We believe that solutions can and must be found to
ensure the financial integrity of HI in the long term and to reduce the
rate of growth in Medicare costs. Consideration of such reforms
should occur in the relatively near future. The sooner the solutions
are enacted, the more flexible and gradual they can be. Moreover, the
early introduction of reforms increases the time available for affected
individuals and organizations—including health care providers,
beneficiaries, and taxpayers—to adjust their expectations. We believe
that prompt, effective, and decisive action is necessary to address
these challenges.

29
III. ACTUARIAL ANALYSIS
A. MEDICARE FINANCIAL PROJECTIONS
Medicare is the nation‟s second largest social insurance program,
exceeded only by Social Security (OASDI). Although Medicare‟s two
components—Hospital Insurance and Supplementary Medical
Insurance—are very different from each other in many key respects,
it is important to consider the overall cost of Medicare and the
manner in which that cost is financed. By reviewing Medicare‟s total
expenditures, the financial obligation posed by the program can be
assessed. Similarly, the sources and relative magnitudes of HI and
SMI revenues are an important policy matter.
The issues of Medicare‟s total cost to society and how that cost is met
are different from the question of the financial status of the Medicare
trust funds. The latter focuses on whether a specific trust fund‟s
income and expenditures are in balance. As discussed later in this
section, such an analysis must be performed for each trust fund
individually. The separate HI and SMI financial projections prepared
for this purpose, however, can be usefully combined for the broader
purposes outlined above. To that end, this section presents
information on combined HI and SMI costs and revenues. Sections
III.B and III.C of this report present detailed assessments of the
financial status of the HI trust fund and the SMI trust fund,
respectively.
1. 10-year Actuarial Estimates (2006-2015)
Table III.A1 shows past and projected Medicare income,
expenditures, and trust fund assets in dollar amounts for calendar
years.10 Projections are shown under the intermediate set of
assumptions for the short-range projection period 2006 through 2015.
(A more detailed breakdown of expenditures and income for HI and
SMI is provided in tables III.B4 and III.C1, respectively)
10Amounts are shown on a “cash” basis, reflecting actual expenditures made during the
year, even if the payments were for services performed in an earlier year. Similarly,
income figures represent amounts actually received during the year, even if incurred in
an earlier year.

Actuarial Analysis
30
Table III.A1.—Total Medicare Income, Expenditures, and Trust Fund Assets during Calendar Years 1970-2015
[In billions]
Calendar year Total income Total expenditures Net change in
assets Assets at end of
year
Historical data: 1970 $8.2 $7.5 $0.7 $3.4 1975 17.7 16.3 1.3 12.0 1980 37.0 36.8 0.1 18.3 1985 76.5 72.3 4.2 31.4 1990 126.3 111.0 15.3 114.4 1995 175.3 184.2 −8.9 143.4 1996 210.2 200.3 9.9 153.3 1997 212.1 213.6 −1.5 151.8 1998 228.3 213.4 14.9 166.6
1999 232.5 213.0 19.5 186.2 2000 257.1 221.8 35.3 221.5 2001 273.3 244.8 28.5 250.0 2002 284.8 265.7 19.1 269.1 2003 291.6 280.8 10.8 280.0 2004 317.7 308.9 8.8 288.8 2005 357.5 336.4 21.0 309.8
Intermediate estimates: 2006 445.9 432.0 13.9 323.6 2007 485.8 462.4
1 23.4 347.1
2008 515.8 499.0 16.8 363.9 2009 561.3
2 537.4 23.8 387.7
2010 555.3 2 572.9 −17.6 370.2
2011 610.3 613.9 −3.6 366.6 2012 650.0 659.5 −9.5 357.0 2013 691.2 709.6 −18.4 338.6 2014 733.3 761.8 −28.5 310.1 2015 779.1 817.2 −38.1 272.0
1Includes payment of estimated contingent liability payable to States (to reimburse them for payments
they have made on behalf of beneficiaries) for probable unasserted claims that resulted from processing errors in which incorrect Medicare eligibility determinations were made ($1,869 million). 2Section 708 of the Social Security Act modifies the provisions for the delivery of Social Security benefit
checks when the regularly designated day falls on a Saturday, Sunday, or legal public holiday. Delivery of benefit checks normally due January 3, 2010 will occur on December 31, 2009.
Note: Totals do not necessarily equal the sums of rounded components.
As indicated in table III.A1, Medicare expenditures have increased
rapidly during most of the program‟s history and are expected to
continue doing so in the future. Health care cost increases, including
those for Medicare, Medicaid, and private health insurance, are
affected by the following factors:
• Growth in the number of beneficiaries;
• Increases in the prices paid per service, which reflect both higher
wages for health care workers and inflation in the goods and
services purchased by health care providers;
• Increases in the average number of services per beneficiary
(“utilization”); and
• Increases in the average complexity of services (“intensity”).

Financial Projections
31
Medicare expenditures are projected to increase at an average annual
rate of 7.3 percent during 2007-2015. The average growth rate
reflects the continuing impact of each of the factors listed above,
together with the effects of the other provisions of the Medicare
Modernization Act and the Deficit Reduction Act.
Through most of Medicare‟s history, trust fund income has kept pace
with increases in expenditures.11 In the future, however, Medicare
income is projected to increase less rapidly than expenditures,
primarily because HI payroll tax revenues would not keep pace with
HI benefits under current law. In contrast to the growth factors listed
above for health care costs, HI payroll taxes increase only as a
function of the number of workers and increases in their average
earnings. Moreover, with past declines in birth rates, continuing
improvements in life expectancy, and prevailing rates of disability
incidence, the number of workers is expected to grow slowly while the
number of beneficiaries increases much more rapidly.
Past excesses of income over expenditures have been invested in
U.S. Treasury securities, with total fund assets accumulating to
$310 billion at the end of calendar year 2005. Combined assets are
projected to continue increasing until reaching about $388 billion in
2009 and to begin declining thereafter.12
2. 75-year Actuarial Estimates (2006-2080)
Expressing Medicare expenditures as a percentage of GDP gives a
relative measure of the size of the Medicare program compared to the
general economy. The projection of this measure affords the public an
idea of the relative financial resources that will be necessary to pay
for Medicare services.
Table III.A2 shows past and projected Medicare expenditures
expressed as a percentage of GDP.13 Medicare expenditures
represented 0.7 percent of GDP in 1970 and had grown to 2.7 percent
of GDP by 2005, reflecting rapid increases in the factors affecting
11This balance resulted from periodic increases in HI payroll tax rates and other HI
financing, from annual increases in SMI premium and general revenue financing rates
(to match the following year‟s estimated expenditures), and from frequent legislation
designed to slow the rate of growth in expenditures. 12See sections III.B and III.C regarding the asset projections for HI and SMI,
separately. 13In contrast to the expenditure amounts shown in table III.A1, long-range expenditure
projections are shown on an incurred basis. Incurred amounts relate to the
expenditures for services performed in a given year, even if those expenditures are paid
in a later year.

Actuarial Analysis
32
health care cost growth, as mentioned previously. Starting in 2006,
Medicare provides subsidized access to prescription drug coverage
through Part D, increasing projected Medicare expenditures to an
estimated 3.2 percent of GDP.
Continuing rapid growth is expected thereafter, with total Medicare
expenditures projected to reach about 11.0 percent of GDP by 2080.
For comparison, projected Medicare costs would exceed those for
Social Security in 2027 and would continue to grow more rapidly
until, in 2080, the expenditure level for Medicare would be nearly
twice that for Social Security. Another comparison would be that over
the last 50 years, total Federal income tax receipts have averaged
11 percent of GDP.
As indicated, part of the projected substantial increase is attributable
to the new prescription drug benefit in Medicare. In its first full year
of operation, this benefit is expected to increase aggregate Medicare
costs by nearly one-sixth. With continuing faster growth in drug
costs, relative to the traditional HI and SMI Part B expenditures, this
new benefit is projected to increase costs by roughly one-fourth for
2020 and later.14
The cost projections shown in table III.A2 for total Medicare, as well
as for the Parts A, B, and D components, are somewhat different than
those in the 2005 annual report. These differences arise for a number
of reasons, which are described in sections III.B and III.C.
14Costs beyond the first 25 years for HI, SMI Part B, and SMI Part D are each based on
the assumption that age-sex-adjusted per beneficiary expenditures will increase at the
rate determined by the economic model mentioned earlier. This rate is about
1.4 percent faster than the per capita GDP in 2030, slowing down to about the same
rate as per capita GDP by 2080.

Financial Projections
33
Table III.A2.—HI and SMI Incurred Expenditures as a Percentage of the Gross Domestic Product
Calendar year
HI SMI
Total Part A Part B Part D
Historical data: 1970 0.52 0.22 — 0.74 1975 0.73 0.30 — 1.03 1980 0.91 0.41 — 1.32 1985 1.12 0.56 — 1.68 1990 1.14 0.76 — 1.90 1995 1.57 0.90 — 2.47 1996 1.62 0.90 — 2.53 1997 1.62 0.89 — 2.52 1998 1.48 0.90 — 2.38 1999 1.38 0.90 — 2.29 2000 1.33 0.95 — 2.28 2001 1.41 1.03 — 2.44 2002 1.44 1.08 — 2.52 2003 1.43 1.13 — 2.57 2004 1.46 1.20 0.00 2.66 2005 1.47 1.25 0.01 2.73
Intermediate estimates: 2006 1.48 1.30 0.43 3.21 2007 1.51 1.31 0.49 3.30 2008 1.53 1.33 0.54 3.40 2009 1.56 1.35 0.56 3.47 2010 1.58 1.36 0.59 3.53 2011 1.61 1.38 0.61 3.60 2012 1.64 1.40 0.65 3.69 2013 1.69 1.43 0.69 3.80 2014 1.72 1.45 0.72 3.90 2015 1.77 1.48 0.76 4.01 2020 2.01 1.68 0.98 4.68 2025 2.36 1.96 1.23 5.55 2030 2.77 2.28 1.44 6.49 2035 3.17 2.57 1.59 7.33 2040 3.50 2.79 1.71 7.99 2045 3.75 2.95 1.81 8.52 2050 3.96 3.10 1.91 8.97 2055 4.13 3.24 2.00 9.36 2060 4.31 3.38 2.08 9.77 2065 4.48 3.51 2.15 10.14 2070 4.65 3.63 2.22 10.50 2075 4.78 3.71 2.27 10.76 2080 4.90 3.78 2.31 10.99
As with the other projections in this report, the estimates shown in
table III.A2 assume no change in current law. The 75-year projection
period fully allows for the presentation of future developments that
are expected to occur, such as the impact of a large increase in
enrollees that will begin within the next 10 years. This increase in
the number of beneficiaries will occur because the relatively large
number of persons born during the period between the end of World
War II and the mid-1960s (known as the baby boom generation) will
reach eligibility age and begin to receive benefits. Moreover, as the
average age of Medicare beneficiaries increases, these individuals will
experience greater health care utilization and costs, thereby adding

Actuarial Analysis
34
further to growth in program expenditures. Table III.A3 shows past
and projected enrollment in the Medicare program.
Table III.A3.—Medicare Enrollment [In thousands]
Calendar year HI SMI
Part C1 Total
2 Part A Part B Part D
Historical data: 1970 20,104 19,496 — — 20,398 1975 24,481 23,744 — — 24,864 1980 28,002 27,278 — — 28,433 1985 30,621 29,869 — 842 31,081 1990 33,747 32,567 — 1,181 34,251 1995 37,175 35,641 — 2,714 37,594 1996 37,701 36,104 — 3,672 38,122 1997 38,099 36,445 — 4,735 38,514 1998 38,472 36,756 — 5,732 38,889 1999 38,765 37,022 — 6,191 39,187 2000 39,257 37,335 — 6,233 39,688 2001 39,669 37,667 — 5,608 40,102 2002 40,065 37,982 — 5,005 40,508 2003 40,738 38,584 — 4,655 41,188 2004 41,438 39,099 1,217 4,683 41,882 2005 42,019 39,601 1,841 5,084 42,457
Intermediate estimates: 2006 42,707 40,136 29,203
3 5,714 43,140
2007 43,427 40,735 34,012 6,609 43,855 2008 44,298 41,478 36,696 7,555 44,719 2009 45,207 42,261 37,649 8,540 45,621 2010 46,108 43,019 38,340 9,550 46,515 2011 47,171 43,889 39,164 10,619 47,572 2012 48,570 45,095 40,255 11,811 48,964 2013 50,070 46,440 41,462 13,092 50,458 2014 51,526 47,721 42,630 14,408 51,906 2015 53,035 49,045 43,840 15,422 53,407 2020 61,258 56,324 50,571 17,738 61,601 2025 70,400 64,550 58,066 20,348 70,730 2030 78,268 71,722 64,523 22,621 78,596 2035 83,121 76,226 68,506
4 83,448
2040 86,074 79,006 70,930 4
86,400 2045 88,331 81,038 72,786
4 88,662
2050 90,874 83,394 74,886 4
91,219 2055 93,466 85,749 77,028
4 93,829
2060 96,430 88,498 79,485 4
96,821 2065 99,048 90,892 81,660
4 99,471
2070 102,252 93,865 84,327 4
102,719 2075 104,795 96,201 86,453
4 105,309
2080 107,414 98,610 88,649 4
107,984 1Number of beneficiaries enrolled in a Medicare Advantage plan. Figures from early 1980s to 1997
represent those enrolled in a risk HMO, and figures from 1998 to 2003 represents those enrolled in a Medicare+Choice plan. In order to enroll in a Medicare Advantage plan, a beneficiary must be enrolled in both Part A and Part B. Therefore, Part C enrollment is a subset of both Part A and Part B enrollment. 2Number of beneficiaries with HI and/or SMI coverage.
3The initial enrollment period runs through May 15, 2006 at which time 31.4 million beneficiaries are
projected to have enrolled in Part D. The figure on the table reflects the average monthly enrollment for 2006. 4Enrollment in Medicare Advantage plans is not explicitly projected beyond 2030.
The past and projected amounts of Medicare revenues as a
percentage of GDP are shown in table III.A4, based on the
intermediate assumptions. Interest income is excluded, since, under

Financial Projections
35
current law, it would not be a significant part of program financing in
the long range.
Table III.A4.—Medicare Sources of Income and Expenditures as a Percentage of the Gross Domestic Product
Calendar year Payroll taxes
Tax on benefits Premiums
1
State transfers
General revenue
Total income
2
Total expenditures
Historical data: 1970 0.5 0.0 0.1 0.0 0.2 0.8 0.7 1980 0.9 0.0 0.1 0.0 0.3 1.3 1.3 1990 1.2 0.0 0.2 0.0 0.6 2.0 1.9 2000 1.5 0.1 0.2 0.0 0.7 2.5 2.3 2005 1.4 0.1 0.3 0.0 1.0 2.7 2.7
Intermediate estimates: 2010 1.4 0.1 0.4 0.1 1.4 3.3 3.5 2020 1.4 0.2 0.6 0.1 2.0 4.2 4.7 2030 1.3 0.2 0.8 0.1 2.8 5.3 6.5 2040 1.3 0.2 1.0 0.2 3.4 6.0 8.0 2050 1.3 0.2 1.1 0.2 3.8 6.6 9.0 2060 1.3 0.2 1.2 0.2 4.1 7.0 9.8 2070 1.2 0.2 1.4 0.2 4.4 7.4 10.5 2080 1.2 0.2 1.5 0.2 4.6 7.7 11.0
1Includes premium revenue from HI and both accounts in the SMI trust fund.
2Excludes interest earnings on invested HI and SMI trust fund assets.
Note: Totals do not necessarily equal the sums of rounded components.
In 2005, HI payroll taxes represented 50 percent of total non-interest
income to the Medicare program. General revenues (primarily those
for SMI) were the next largest source of overall financing, at
35 percent. Beneficiary premiums (again, primarily for SMI) were
third, at 12 percent. Under current law, HI tax revenues are projected
to fall increasingly short of HI expenditures after 2004. In contrast,
SMI premium and general revenues will keep pace with SMI
expenditure growth, and, once fully phased down15, state payments
(on behalf of Medicare beneficiaries who also qualify for full Medicaid
benefits) will grow with Part D expenditures. Consequently, in the
absence of legislation, HI tax income would represent a declining
portion of total Medicare revenues. In 2017, for example, just prior to
the projected exhaustion of the HI trust fund, currently scheduled HI
payroll taxes would represent about 35 percent of total non-interest
Medicare income. General revenues and beneficiary premiums would
equal about 46 and 14 percent, respectively.16
15State payments will amount to 90 percent of their projected foregone prescription
drug payments in 2006, with this percentage phasing down over a 10-year period to
75 percent in 2015. 16The general revenue share of total Medicare revenues cannot be directly compared to
the difference between outlays and dedicated revenues as a share of outlays (described
previously). Although somewhat similar in magnitude, the former measure does not
reflect the HI deficit, whereas the latter measure does.

Actuarial Analysis
36
The Medicare Modernization Act (MMA) requires an expanded
analysis of the combined expenditures and dedicated revenues of the
HI and SMI trust funds. In particular, a determination needs to be
made as to whether projected annual “general revenue funding”
exceeds 45 percent of total Medicare outlays within the next 7 fiscal
years (2006-2012). For this purpose, general revenue funding is
defined in the law as total Medicare outlays minus dedicated
Medicare financing sources. Dedicated Medicare financing sources
include HI payroll taxes; income from taxation of Social Security
benefits; State transfers for the prescription drug benefit; premiums
paid under Parts A, B, and D; and any gifts received by the Medicare
trust funds. The test is applied using incurred expenditures and
revenues to avoid temporary distortions arising from the payment of
Medicare Advantage capitation amounts in September when the
normal October payment date is a Saturday or Sunday. Figure III.A1
shows the projected difference between total Medicare outlays and
dedicated funding sources as a percentage of total outlays over the
long-range projection period.
Figure III.A1.—Projected Difference between Total Medicare Outlays and Dedicated Financing Sources, as a Percentage of Total Outlays
02
2
1970
1
-15%
0%
15%
30%
45%
60%
75%
2000 2030 2060
Calendar year
As indicated in figure III.A1, the difference between annual outlays
and dedicated financing would first exceed 45 percent of total
expenditures in 2012 under the intermediate assumptions (the same
year as estimated in the 2004 and 2005 reports). Since this estimate

Financial Projections
37
is within the 7-year test period prescribed in the law, a determination
of “excess general revenue Medicare funding” is made in this report.
If in two consecutive reports, it is determined that the difference
between Medicare outlays and dedicated financing sources will reach
45 percent within the first 7 years, then a “Medicare funding
warning” will be triggered, indicating that a trust fund‟s financing is
inadequate or that the general revenues provided under current law
are becoming unduly large. This finding would require the President
to submit to Congress, within 15 days after the date of the next
budget submission, proposed legislation to respond to the warning.
Congress is then required to consider this legislation on an expedited
basis. This new requirement will help call attention to Medicare‟s
impact on the Federal Budget.
As indicated in figure III.A1, the difference between outlays and
dedicated funding sources is projected to continue growing
throughout the 75-year period, reaching 63 percent of total outlays in
2030 and 73 percent in 2080. Although the law characterizes this
difference as “general revenue funding,” it is important to recognize
that current law provides for general revenue transfers only for
certain purposes related to Parts A, B, and D, as follows:
• Financing specified portions of SMI Part B and Part D
expenditures;
• Reimbursing the HI trust fund for the costs of certain uninsured
beneficiaries;
• Paying interest on invested assets of the trust funds; and
• Redeeming the special Treasury securities held as assets by the
trust funds.
The difference between outlays and dedicated funding sources, as
shown in figure III.A1, will reflect all of these general revenue
transfers, plus the imbalance between HI expenditures and dedicated
revenues after 2018, for which there is no provision under current
law to cover the shortfall. In particular, transfers from the general
fund of the Treasury could not be made for this purpose without new
legislation.
The MMA also requires that projected growth in the difference
between outlays and dedicated revenues be compared with other
health spending growth rates. Table III.A5 contains this comparison.

Actuarial Analysis
38
Table III.A5.—Comparative Growth Rates of Medicare, Private Health Insurance, and National Health Expenditures
Calendar year
Average annual growth in:
Incurred outlays minus dedicated
revenues Incurred
Medicare outlays GDP National health expenditures
1
Private health insurance
1
2000 -8.0 % 5.5 % 5.9 % 6.9 % 8.2 % 2001 30.6 10.4 3.2 8.5 9.4 2002 22.2 7.3 3.5 9.1 11.0 2003 24.8 6.7 4.9 8.2 9.8 2004 18.5 10.5 6.7 7.9 8.6 2005 6.2 9.2 6.4 7.4 7.3 2006 44.7 24.1 5.7 7.3 5.5 2007 9.2 8.0 5.3 7.2 8.2 2008 10.4 8.6 5.3 7.7 8.6 2009 10.0 7.4 5.1 7.6 8.6 2010 8.9 6.9 5.0 7.1 7.1 2011 8.1 6.9 4.9 6.9 6.8 2012 9.2 7.4 4.8 7.1 7.0 2013 10.0 7.6 4.5 7.1 6.8 2014 9.4 7.3 4.5 6.9 6.3 2015 9.9 7.6 4.6 6.8 5.8
2016-2030 7.9 9.7 4.5 — — 2031-2055 5.5 5.9 4.4 — — 2056-2080 5.0 5.1 4.4 — —
1According to the national health expenditure (NHE) projections article, which was published on
February 22, 2006. This article, along with the paper outlining the methodology, is available at http://www.cms.hhs.gov/NationalHealthExpendData/03_NationalHealthAccountsProjected.asp.
As shown in table III.A5, the gap between outlays and dedicated
revenues, and Medicare outlays, will both increase substantially
when the prescription drug benefit is fully implemented in 2006. In
addition, the outlay gap will increase faster than outlays throughout
the 75-year period, since the dedicated sources of income to the HI
trust fund will cover a decreasing percentage of HI outlays.
In addition to projected Medicare outlay growth, table III.A5 shows
projected growth in GDP, total expenditures on health care in the
U.S., and private health insurance expenditures. Each of the health
expenditure categories is expected to increase more rapidly than
GDP, continuing a longstanding trend. Private health insurance
expenditures equal the total premiums earned by private health
insurers, including benefits incurred and the net cost of insurance.
The net cost of insurance includes administrative costs, additions to
reserves, rate credits and dividends, premium taxes, and profits or
losses. Comparisons between aggregate Medicare and private health
insurance cost growth are affected by several factors:
• The number of Medicare beneficiaries is currently increasing by
about 1.5 percent per year, and this growth rate will approximately
double after 2010 when the post-World War II baby boom
generation reaches eligibility age. In recent years, the number of

Financial Projections
39
individuals with private health insurance has declined and is
projected to increase only slowly in the future.
• The benefits covered by Medicare and private health insurance
plans can vary. In particular, most prescription drugs were not
covered by Medicare prior to 2006 but will be thereafter. Moreover,
many Medicare beneficiaries who currently have private drug
insurance coverage (such as Medigap policies) are expected to
switch to the subsidized Part D coverage in 2006, thereby
accelerating Medicare outlay growth while slowing private health
insurance growth.
• The use of health care services differs significantly between
Medicare beneficiaries (who are generally over 65) and individuals
with private health insurance (who are predominantly below
age 65). The former group, for example, has a higher incidence of
hospitalization, skilled nursing care, and home health care. For the
latter group, physician services represent a greater proportion of
their total health care needs. Different cost growth trends by type
of service will affect overall growth rates, reflecting the distribution
of services for each category of people.
A number of research studies have attempted to control for some or
all of these differences in comparing growth trends. Over long
historical periods, average, demographically adjusted, per capita
growth rates have been similar for Medicare and private health
insurance. For shorter periods, however, the rates of growth have
often diverged substantially. More information on past and projected
national and private health expenditures, and comparisons to
Medicare growth rates, is available in the sources cited in
table III.A5.
Under current law, the HI and SMI trust funds are separate and
distinct, each with its own sources of financing. There are no
provisions for using HI revenues to finance SMI expenditures, or vice
versa, or for lending assets between the two trust funds. Moreover,
the benefit provisions, financing methods, and, to a lesser degree,
eligibility rules are very different between these Medicare
components. In particular, both accounts of the SMI trust fund are
automatically in financial balance under current law, whereas the HI
fund is not.
For these reasons, the financial status of the Medicare trust funds
can be evaluated only by separately assessing the status of each fund.

Actuarial Analysis
40
The following two sections of this report present such assessments for
HI and SMI, respectively.
B. HI FINANCIAL STATUS
1. Financial Operations in Fiscal Year 2005
The Federal Hospital Insurance Trust Fund was established on
July 30, 1965 as a separate account in the U.S. Treasury. All the HI
financial operations are handled through this fund.
A statement of the revenue and expenditures of the fund in fiscal year
2005, and of its assets at the beginning and end of the fiscal year, is
presented in table III.B1.
The total assets of the trust fund amounted to $264,943 million on
September 30, 2004. During fiscal year 2005, total revenue amounted
to $196,921 million, and total expenditures were $184,142 million.
Total assets thus increased by $12,779 million during the year, to
$277,723 million on September 30, 2005.

HI Financial Status
41
Table III.B1.—Statement of Operations of the HI Trust Fund during Fiscal Year 2005 [In thousands]
Total assets of the trust fund, beginning of period .............................................................. $264,943,209 Revenue:
Payroll taxes ............................................................................................................... $168,954,028 Income from taxation of OASDI benefits .................................................................... 8,765,000 Interest on investments .............................................................................................. 15,125,575 Premiums collected from voluntary participants......................................................... 2,302,982 Transfer from Railroad Retirement account ............................................................... 415,900 Reimbursement, transitional uninsured coverage ...................................................... 286,000 Reimbursement, program management general fund ............................................... 215,000 Interest on reimbursements, CMS
1 ............................................................................ 507
Interest on reimbursements, Railroad Retirement ..................................................... 28,992 Other ........................................................................................................................... 256 Reimbursement, Union Activity .................................................................................. 1,316 Fraud and abuse control receipts:
Criminal fines ......................................................................................................... 347,896 Civil monetary penalties ......................................................................................... 13,135 Civil penalties and damages, CMS ........................................................................ 1,105 Civil penalties and damages, Department of Justice ............................................ 339,165 3% administrative expense reimbursement, Department of Justice ..................... 10,493 Fraud and abuse appropriation for FBI .................................................................. 114,000
Total revenue ................................................................................................................... $196,921,352
Expenditures: Net benefit payments ............................................................................................. $181,291,833 Administrative expenses:
Treasury administrative expenses .................................................................... 129,954 Salaries and expenses, SSA
2 ........................................................................... 661,690
Salaries and expenses, CMS3 .......................................................................... 940,029
Salaries and expenses, Office of the Secretary, HHS ...................................... 30,990 Medicare Payment Advisory Commission ........................................................ 5,940
Fraud and abuse control expenses: HHS Medicare integrity program ....................................................................... 716,886 HHS Office of Inspector General ...................................................................... 187,581 Department of Justice ....................................................................................... 62,972 FBI ..................................................................................................................... 114,000
Total expenditures................................................................................................................ $184,141,874
Net addition to the trust fund ................................................................................................ 12,779,477
Total assets of the trust fund, end of period ........................................................................ $277,722,686
1A positive figure represents a transfer to the HI trust fund from the other trust funds. A negative figure
represents a transfer from the HI trust fund to the other funds. 2For facilities, goods, and services provided by SSA.
3Includes administrative expenses of the intermediaries.
Note: Totals do not necessarily equal the sums of rounded components.
a. Revenues
The trust fund‟s primary source of income consists of amounts
appropriated to it, under permanent authority, on the basis of taxes
paid by workers, their employers, and individuals with self-
employment income, in work covered by HI. Included in HI are
workers covered under the OASDI program, those covered under the

Actuarial Analysis
42
Railroad Retirement program, and certain Federal, State, and local
employees not otherwise covered under the OASDI program.
HI taxes are payable on a covered individual‟s total wages and self-
employment income, without limit. For calendar years prior to 1994,
taxes were computed on a person‟s annual earnings up to a specified
maximum annual amount, called the maximum tax base. The
maximum tax bases for 1966-1993 are presented in table III.B2.
(Legislation enacted in 1993 removed the limit on taxable income
beginning in calendar year 1994.)
The HI tax rates applicable in each of the calendar years 1966 and
later are also shown in table III.B2. For 2007 and thereafter, the tax
rates shown are the rates scheduled in current law.
Table III.B2.—Tax Rates and Maximum Tax Bases
Calendar years Maximum tax base
Tax rate (Percentage of taxable earnings)
Employees and employers, each Self-employed
Past experience: 1966 $6,600 0.35 0.35 1967 6,600 0.50 0.50
1968-71 7,800 0.60 0.60 1972 9,000 0.60 0.60 1973 10,800 1.00 1.00 1974 13,200 0.90 0.90 1975 14,100 0.90 0.90 1976 15,300 0.90 0.90 1977 16,500 0.90 0.90
1978 17,700 1.00 1.00 1979 22,900 1.05 1.05 1980 25,900 1.05 1.05 1981 29,700 1.30 1.30 1982 32,400 1.30 1.30 1983 35,700 1.30 1.30 1984 37,800 1.30 2.60 1985 39,600 1.35 2.70 1986 42,000 1.45 2.90 1987 43,800 1.45 2.90 1988 45,000 1.45 2.90 1989 48,000 1.45 2.90 1990 51,300 1.45 2.90 1991 125,000 1.45 2.90 1992 130,200 1.45 2.90 1993 135,000 1.45 2.90
1994-2006 no limit 1.45 2.90
Scheduled in current law: 2007 & later no limit 1.45 2.90
Total HI payroll tax income in fiscal year 2005 amounted to
$168,954 million—an increase of 10.1 percent over the amount of
$153,448 million for the preceding 12-month period. This increase in
tax income resulted from an increase in the number of workers and

HI Financial Status
43
their earnings, together with a substantial net positive adjustment
for prior years‟ actual-versus-estimated tax differences.
Up to 85 percent of an individual‟s or couple‟s OASDI benefits may be
subject to Federal income taxation if their income exceeds certain
thresholds. The income tax revenue attributable to the first
50 percent of OASDI benefits is allocated to the OASI and DI trust
funds. The revenue associated with the amount between 50 and
85 percent of benefits is allocated to the HI trust fund. Income from
the taxation of OASDI benefits amounted to $8,765 million in fiscal
year 2005.
Another substantial source of trust fund income is interest credited
from investments in government securities held by the fund. In fiscal
year 2005, $15,126 million in interest was credited to the fund. The
trust fund‟s investment procedures are described later in this section.
Section 1818 of the Social Security Act provides that certain persons
not otherwise eligible for HI protection may obtain coverage by
enrolling in HI and paying a monthly premium. Premiums collected
from such voluntary participants in fiscal year 2005 amounted to
about $2,303 million.
The Railroad Retirement Act provides for a system of coordination
and financial interchange between the Railroad Retirement program
and the HI trust fund. This financial interchange requires a transfer
that would place the HI trust fund in the same position in which it
would have been if railroad employment had always been covered
under the Social Security Act. In accordance with these provisions, a
transfer of $416 million in principal and about $16 million in interest
from the Railroad Retirement program‟s Social Security Equivalent
Benefit Account to the HI trust fund balanced the two systems as of
September 30, 2004. This amount, together with interest to the date
of transfer totaling about $13 million, was transferred to the trust
fund in June 2005.
Two sections of the statute authorize HI benefits for certain
uninsured persons aged 65 and over. Entitlement to HI benefits was
provided to almost all persons aged 65 and over, or near that age,
when the HI trust fund first began operations. Legislation in 1982
added similar transitional entitlement for those Federal employees
who would retire before having had a chance to earn sufficient
quarters of Medicare-qualified Federal employment. The costs of such
coverage, including administrative expenses, are reimbursed from the
general fund of the Treasury. In fiscal year 2005, such

Actuarial Analysis
44
reimbursement amounted to $286 million: $285 million for estimated
benefit payments and $1 million for administrative expenses. The
$285 million for benefit payments consisted of $86 million for non-
Federal uninsured and $199 million for Federal uninsured
beneficiaries.
The Health Insurance Portability and Accountability Act of 1996
established a health care fraud and abuse control account within the
HI trust fund. Monies derived from the fraud and abuse control
program are transferred from the general fund of the Treasury to the
HI trust fund. During fiscal year 2005, the trust fund was credited
with about $826 million in receipts from this program.
b. Expenditures
Expenditures for HI benefit payments and administrative expenses
are paid out of the trust fund. All expenses incurred by the
Department of Health and Human Services, the Social Security
Administration, the Department of the Treasury (including the
Internal Revenue Service), and the Department of Justice in
administering HI are charged to the trust fund. Such administrative
duties include payment of benefits, the collection of taxes, fraud and
abuse control activities, and experiments and demonstration projects
designed to determine various methods of increasing efficiency and
economy in providing health care services, while maintaining the
quality of such services, under HI and SMI.
In addition, Congress has authorized expenditures from the trust
funds for construction, rental and lease, or purchase contracts of
office buildings and related facilities for use in connection with the
administration of HI. These costs are included in trust fund
expenditures. The net worth of facilities and other fixed capital
assets, however, is not carried in the statement of trust fund assets
presented in this report, since the value of fixed capital assets does
not represent funds available for benefit or administrative
expenditures and is not, therefore, considered in assessing the
actuarial status of the funds.
Of the $184,142 million in total HI expenditures, $181,292 million
represented net benefits paid from the trust fund for health services.17
Net benefit payments increased 10.5 percent in fiscal year 2005 over
17Net benefits equal the total gross amounts initially paid from the trust fund during
the year, less recoveries of overpayments identified through fraud and abuse control
activities.

HI Financial Status
45
the corresponding amount of $164,079 million paid during the
preceding fiscal year. This increase reflected the impact of the
Medicare Modernization Act. Additional information on HI benefits
by type of service is available in section IV.A.
The remaining $2,850 million of expenditures was for net HI
administrative expenses, after adjustments to the preliminary
allocation of administrative costs among the Social Security and
Medicare trust funds and the general fund of the Treasury. This
amount includes $1,081 million for the health care fraud and abuse
control program.
c. Actual experience versus prior estimates
Table III.B3 compares the actual experience in fiscal year 2005 with
the estimates presented in the 2004 and 2005 annual reports. A
number of factors can contribute to differences between estimates and
subsequent actual experience. In particular, actual values for key
economic and other variables can differ from assumed levels, and
legislative and regulatory changes may be adopted after a report‟s
preparation. The comparison in table III.B3 indicates that actual HI
tax income in 2005 was slightly higher than estimated in the 2004
and 2005 reports, primarily because actual wage growth was higher
than earlier estimates for the last few years. Actual HI benefit
payments in fiscal year 2005 were slightly higher than the amount
projected in the 2005 report primarily as a result of higher growth in
inpatient hospital expenditures than had been estimated. The actual
amount was very close to the amount projected in the 2004 report.
Table III.B3.—Comparison of Actual and Estimated Operations of the HI Trust Fund, Fiscal Year 2005
[Dollar amounts in millions]
Comparison of actual experience with estimates for fiscal year 2005 published in—
2005 report 2004 report
Item Actual
amount Estimated amount
1
Actual as percentage of estimate
Estimated amount
1
Actual as percentage of estimate
Payroll taxes $168,954 $165,623 102% $167,178 101% Benefit payments 182,292 176,982 103% 182,861 100% 1Under the intermediate assumptions.
d. Assets
The portion of the trust fund that is not required to meet current
expenditures for benefits and administration is invested, on a daily
basis, in interest-bearing obligations of the U.S. Government. The
Social Security Act authorizes the issuance of special public-debt

Actuarial Analysis
46
obligations for purchase exclusively by the trust fund. The law
requires that these special public-debt obligations bear interest, at a
rate based on the average market yield (computed on the basis of
market quotations as of the end of the calendar month immediately
preceding the date of such issue), on all marketable interest-bearing
obligations of the United States forming a part of the public debt that
are not due or callable until after 4 years from the end of that month.
Currently, all invested assets of the HI trust fund are in the form of
such special-issue securities.18 Table V.F6, presented in appendix F,
shows the assets of the HI trust fund at the end of fiscal years 2004
and 2005.
2. 10-Year Actuarial Estimates (2006-2015)
While the previous section addressed the transactions of the HI trust
fund during the preceding fiscal year, this section presents estimates
of the trust fund‟s operations and financial status for the next
10 years. The long-range actuarial status of the trust fund is
discussed in the next section. In both this and the following section,
no changes are assumed to occur in the present statutory provisions
and regulations under which HI operates.
The estimates shown in this section provide detailed information
concerning the short-range financial status of the trust fund. The
estimated levels of future income and outgo, annual differences
between income and outgo, and annual trust fund balances are
explained and examined. Two particularly important indicators of
solvency for the HI trust fund—the estimated year of exhaustion and
the test of short-range financial adequacy—are also discussed.
To illustrate the sensitivity of future costs to different economic and
demographic trends, estimates are shown under three alternative
sets of assumptions, which are intended to portray a reasonable
range of possible future trends. Due to the uncertainty inherent in
such projections, however, the actual operations of the HI trust fund
in the future could differ significantly from these estimates.
Figure III.B1 shows past and projected income and expenditures for
the HI trust fund. Following the Balanced Budget Act of 1997, the
fund experienced annual surpluses in the range of $21 billion to
$36 billion through 2003. This difference decreased to between
$13 billion and $16 billion in 2004 and 2005 and is expected to
18Investments may also be made in obligations guaranteed as to both principal and
interest by the United States, including certain federally sponsored agency obligations.

HI Financial Status
47
continue narrowing thereafter until expenditures exceed income in
2010 and later. The assumptions underlying these estimates are
discussed in section IV.A of this report.
Figure III.B1.—HI Expenditures and Income [In billions]
$0
$25
$50
$75
$100
$125
$150
$175
$200
$225
$250
$275
$300
$325
$350
$375
1990 1992 1994 1996 1998 2000 2002 2004 2006 2008 2010 2012 2014
Calendar year
Expenditures
Income
EstimatedHistorical
The expected operations of the HI trust fund during calendar years
2006 to 2015, together with the past experience, are shown in
table III.B4. The estimates shown in this table are based on the
intermediate set of assumptions. The assumptions underlying the
intermediate projections are presented in section IV.A of this report.
The increases in estimated income shown in table III.B4 primarily
reflect increases in payroll tax income to the trust fund. As noted
previously, the main source of HI financing is the payroll tax on
covered earnings paid by employees, employers, and self-employed
workers. While the payroll tax rate is scheduled to remain constant,
covered earnings are assumed to increase every year through 2015
under the intermediate assumptions. These increases in taxable
earnings are due primarily to projected increases both in the number
of HI workers covered and in the average earnings of these workers.

Table III.B4.—Operations of the HI Trust Fund during Calendar Years 1970-2015 [In billions]
Calendar year
Income Expenditures Trust fund
Payroll taxes
Income from
taxation of benefits
Railroad Retirement
account transfers
Reimburse- ment for
uninsured persons
Premiums from
voluntary enrollees
Payments for military
wage credits
Interest and
other1,2
Total Benefit
payments2,3
Adminis-trative
expenses4 Total
Net change
Fund at end of year
Historical data: 1970 $4.9 — $0.1 $0.9 — $0.0 $0.2 $6.0 $5.1 $0.2 $5.3 $0.7 $3.2 1975 11.5 — 0.1 0.6 $0.0 0.0 0.7 13.0 11.3 0.3 11.6 1.4 10.5 1980 23.8 — 0.2 0.7 0.0 0.1 1.1 26.1 25.1 0.5 25.6 0.5 13.7 1985 47.6 — 0.4 0.8 0.0 −0.7
5 3.4 51.4 47.6 0.8 48.4 4.8
6 20.5
1990 72.0 — 0.4 0.4 0.1 −1.0 7 8.5 80.4 66.2 0.8 67.0 13.4 98.9
1995 98.4 $3.9 0.4 0.5 1.0 0.1 10.8 115.0 116.4 1.2 117.6 −2.6 130.3 1996 110.6 4.1 0.4 0.4 1.2 −2.3
8 10.2 124.6 128.6 1.3 129.9 −5.3 124.9
1997 114.7 3.6 0.4 0.5 1.3 0.1 9.6 130.2 137.8 1.7 139.5 −9.3 115.6 1998 124.3 5.1 0.4 0.0 1.3 0.1 9.3 140.5 134.0
9 1.8 135.8 4.8 120.4
1999 132.3 6.6 0.4 0.7 1.4 0.1 10.1 151.6 128.8 9 1.9 130.6 21.0 141.4
2000 144.4 8.8 0.5 0.5 1.4 0.0 11.7 167.2 128.5 9 2.6 131.1 36.1 177.5
2001 152.0 7.5 0.5 0.5 1.4 −1.2 10
14.0 174.6 141.2 9 2.2 143.4 31.3 208.7
2002 152.7 8.3 0.4 0.4 1.6 0.0 15.1 178.6 149.9 9 2.6 152.5 26.1 234.8
2003 149.2 8.3 0.4 0.4 1.6 0.0 15.8 175.8 152.1 9 2.5 154.6 21.2 256.0
2004 156.5 8.6 0.4 0.4 1.9 0.2 16.0 183.9 167.6 3.0 170.6 13.3 269.3 2005 171.4 8.8 0.4 0.3 2.4 0.0 16.1 199.4 180.0 2.9 182.9 16.4 285.8
Intermediate estimates: 2006 180.8 10.1 0.5 0.4 2.6 0.0 15.8 210.2 197.3 3.1 200.5 9.7 295.5 2007 188.2 11.2 0.5 0.5 2.8 0.0 15.9 219.0 208.8 3.2 213.1
11 5.9 301.4
2008 200.3 13.3 0.5 0.2 2.9 0.0 16.2 233.4 223.3 3.3 226.6 6.9 308.3 2009 210.8 14.6 0.5 0.3 3.1 0.0 16.4 245.7 239.3 3.4 242.6 3.1 311.3 2010 221.7 15.2 0.5 0.3 3.4 0.0 16.4 257.4 255.8 3.4 259.2 -1.8 309.6 2011 232.9 17.4 0.5 0.3 3.6 0.0 16.1 270.9 273.4 3.5 276.9 -6.1 303.5 2012 244.0 20.0 0.5 0.3 3.8 0.0 15.6 284.3 292.9 3.6 296.5 -12.2 291.3 2013 254.6 22.4 0.5 0.3 4.0 0.0 14.6 296.4 314.1 3.7 317.7 -21.3 270.0
2014 265.6 24.7 0.6 0.3 4.2 0.0 13.1 308.4 335.8 3.8 339.6 -31.1 238.9
2015 277.4 26.7 0.6 0.3 4.5 0.0 10.9 320.3 358.7 3.9 362.5 -42.2 196.6
48
Actu
aria
l An
aly
sis
1Other income includes recoveries of amounts reimbursed from the trust fund that are not obligations of the trust fund, receipts from the fraud and abuse control program, and a small
amount of miscellaneous income. These amount to $0.5 billion for the 10-year projection period. 2Values after 2005 include additional premiums for Medicare Advantage (MA) plans that are deducted from beneficiaries’ Social Security checks. These additional premiums are
beneficiary obligations and occur when a beneficiary chooses an MA plan whose monthly plan payment exceeds the benchmark amount. Beneficiaries subject to such premiums may choose to either reimburse the plans directly or have the premiums deducted from their Social Security checks. The premiums deducted from the Social Security checks are transferred to the HI and SMI trust funds and then transferred from the trust funds to the plans. 3Includes costs of Peer Review Organizations from 1983 through 2001 (beginning with the implementation of the prospective payment system on October 1, 1983) and costs of Quality
Improvement Organizations beginning in 2002. 4Includes costs of experiments and demonstration projects. Beginning in 1997, includes fraud and abuse control expenses, as provided for by Public Law 104-191.
5Includes the lump-sum general revenue adjustment of −$0.8 billion, as provided for by section 151 of Public Law 98-21.
6Includes repayment of loan principal, from the OASI trust fund, of $1.8 billion.
7Includes the lump-sum general revenue adjustment of −$1.1 billion, as provided for by section 151 of Public Law 98-21.
8Includes the lump-sum general revenue adjustment of −$2.4 billion, as provided for by section 151 of Public Law 98-21.
9For 1998 to 2003, includes monies transferred to the SMI trust fund for home health agency costs, as provided for by Public Law 105-33.
10Includes the lump-sum general revenue adjustment of −$1.2 billion, as provided for by section 151 of Public Law 98-21.
11Includes payment of estimated contingent liability payable to States (to reimburse them for payments they have made on behalf of beneficiaries) for probable unasserted claims that
resulted from processing errors in which incorrect Medicare eligibility determinations were made ($1,107 million).
Note: Totals do not necessarily equal the sums of rounded components.
49
HI F
ina
ncia
l Sta
tus

Actuarial Analysis
50
Over the next 10 years, most of the smaller sources of financing for
the HI trust fund are projected to increase as well. More detailed
descriptions of these sources of income can be found in section III.B1.
Interest earnings have been a significant source of income to the trust
fund for many years, surpassed only by payroll taxes. As the trust
fund levels off in the near future, with income roughly equal to
expenditures, interest earnings would also remain about level.
Benefit expenditures are projected to increase each year from 2006 to
2015. For the entire short-range period and beyond, benefits are
expected to increase at a faster rate than income.
Since future economic, demographic, and health care usage and cost
experience may differ considerably from the intermediate
assumptions on which the cost estimates shown in table III.B4 were
based, projections have also been prepared on the basis of two
different sets of assumptions, labeled “low cost” and “high cost.” The
three sets of assumptions were selected to illustrate the sensitivity of
costs to different economic and demographic trends, and to provide an
indication of the uncertainty associated with HI financial projections.
The low cost and high cost alternatives provide for a fairly wide range
of possible experience. While actual experience may be expected to
fall within the range, no assurance can be made that this will be the
case, particularly in light of the wide variations in experience that
have occurred in the past. The assumptions used in preparing
projections under the low cost and high cost alternatives, as well as
under the intermediate assumptions, are discussed more fully in
section IV.A of this report.
The estimated operations of the HI trust fund during calendar years
2005 to 2015, under all three alternatives, are summarized in
table III.B5. The trust fund ratio, defined as the ratio of assets at the
beginning of the year to expenditures during the year, was
147 percent for 2005. Under the intermediate assumptions, the trust
fund ratio is projected to steadily decline to a level of 66 percent by
2015. Beyond the 10-year short-term projection period, the ratio
would continue to decline, with the fund becoming exhausted in 2018
under the intermediate assumptions.
Under the low cost alternative, exhaustion would occur in 2041, while
under the high cost alternative, exhaustion would occur in 2013,
within the 10-year period. Without corrective legislation, therefore,
the assets of the HI trust fund would be exhausted within the next
7 to 12 years under the high cost and intermediate assumptions. The

HI Financial Status
51
fact that exhaustion would occur under a fairly broad range of future
economic conditions, and is expected to occur in the not-distant
future, indicates the importance of promptly addressing the HI trust
fund‟s financial imbalance.
Table III.B5.—Estimated Operations of the HI Trust Fund during Calendar Years 2005-2015, under Alternative Sets of Assumptions
[Dollar amounts in billions]
Calendar year Total income
Total expenditures
Net increase in fund
Fund at end of year
Ratio of assets to expenditures
1
(percent)
Intermediate: 2005
2 $199.4 $182.9 $16.4 $285.8 147
2006 210.2 200.5 9.7 295.5 143 2007 219.0 213.1 5.9 301.4 139 2008 233.4 226.6 6.9 308.3 133 2009 245.7 242.6 3.1 311.3 127 2010 257.4 259.2 -1.8 309.6 120 2011 270.9 276.9 -6.1 303.5 112 2012 284.3 296.5 -12.2 291.3 102 2013 296.4 317.7 -21.3 270.0 92 2014 308.4 339.6 -31.1 238.9 80 2015 320.3 362.5 -42.2 196.6 66
Low cost: 2005
2 199.4 182.9 16.4 285.8 147
2006 210.6 196.6 14.0 299.8 145 2007 219.6 204.9 14.7 314.5 146 2008 233.6 213.1 20.5 335.0 148 2009 246.0 223.2 22.8 357.8 150 2010 258.0 233.2 24.8 382.6 153 2011 272.4 244.1 28.3 411.0 157 2012 287.4 256.1 31.2 442.2 160 2013 301.7 269.2 32.5 474.7 164 2014 316.2 281.8 34.4 509.1 168 2015 330.6 294.1 36.4 545.6 173
High cost: 2005
2 199.4 182.9 16.4 285.8 147
2006 206.4 204.1 2.3 288.1 140 2007 210.4 220.0 -9.6 278.5 131 2008 226.1 238.5 -12.4 266.0 117 2009 234.8 259.3 -24.5 241.5 103 2010 247.0 286.2 -39.1 202.4 84 2011 266.2 320.6 -54.3 148.1 63 2012 282.0 356.1 -74.1 74.0 42 2013
3 294.2 392.1 -97.9 -24.0 19
2014 3 306.5 429.7 -123.2 -147.2 -6
2015 3 315.3 470.0 -154.7 -301.8 -31
1Ratio of assets in the fund at the beginning of the year to expenditures during the year.
2Figures for 2005 represent actual experience.
3Estimates for 2013 and later are hypothetical, since the HI trust fund would be exhausted in those
years.
Note: Totals do not necessarily equal the sums of rounded components.
The Board of Trustees has established an explicit test of short-range
financial adequacy. The requirements of this test are as follows: (i) If
the HI trust fund ratio is at least 100 percent at the beginning of the
projection period, then it must be projected to remain at or above

Actuarial Analysis
52
100 percent throughout the 10-year projection period;
(ii) alternatively, if the fund ratio is initially less than 100 percent, it
must be projected to reach a level of at least 100 percent within
5 years (and the trust fund not be depleted at any time during this
period), and then remain at or above 100 percent throughout the rest
of the 10-year period. This test is applied to trust fund projections
made under the intermediate assumptions.
Failure of the trust fund to meet this test is an indication that HI
solvency over the next 10 years is in question and that action is
needed to improve the short-range financial adequacy of the trust
fund. As can be seen from table III.B5, the HI trust fund does not
meet this short-range test. The trust fund ratio, which was above the
100-percent level at the beginning of 2005, is projected to decrease
through 2015, becoming less than 100 percent by 2013. Accordingly,
the financing for HI is not considered adequate in the short-range
projection period (2006-2015).
The ratios of assets in the HI trust fund at the beginning of each
calendar year to total expenditures during that year are shown in
table III.B6 for all historical years.
Table III.B6.—Ratio of Assets at the Beginning of the Year to Expenditures during the Year for the HI Trust Fund
Calendar year Ratio
1967 28% 1970 47% 1975 79% 1980 52% 1985 32% 1990 128% 1995 113% 1996 100% 1997 90% 1998 85% 1999 92% 2000 108% 2001 124% 2002 137% 2003 152% 2004 150% 2005 144%
Figure III.B2 shows the historical trust fund ratios and the projected
ratios under the three sets of assumptions. The labels “I,” “II,” and
“III” indicate projections under the low cost, intermediate, and high
cost alternatives, respectively. Figure III.B2 indicates the declining
growth of assets (as a percentage of expenditures) in the relatively
near future, except under conditions of exceptionally robust economic

HI Financial Status
53
growth and modest health care cost increases, as assumed in the low
cost alternative.
Figure III.B2.—HI Trust Fund Balance at Beginning of Year as a Percentage of Annual Expenditures
II
0%
25%
50%
75%
100%
125%
150%
175%
200%
1965 1970 1975 1980 1985 1990 1995 2000 2005 2010 2015
Beginning of January
III
Historical Estimated
I
The Trustees have recommended that HI trust fund assets be
maintained at a level of at least 100 percent of annual expenditures.
Such a level is estimated to provide a cushion of roughly 5 years or
more in the event that income falls short of expenditures, thereby
allowing time for policy makers to devise and implement legislative
corrections. Thus, while the short-range test is stringent, it is
intended to ensure that health care benefits continue to be available
without interruption to the millions of aged and disabled Americans
who rely on such coverage.
3. 75-Year Actuarial Estimates (2006-2080)
Section III.B2 presented HI expected operations over the next
10 years. In this section, the long-range actuarial status of the trust
fund is examined under the three alternative sets of assumptions.
The assumptions used in preparing projections are summarized in
section IV.A of this report. Since the vast majority of total HI costs
are related to insured beneficiaries, and since general revenue
appropriations and premium payments are expected to support the
uninsured segments (those paying the HI premium and those
receiving HI coverage through special statutes requiring general

Actuarial Analysis
54
revenue transfers to cover their costs), the remainder of this section
will focus on the financing for insured beneficiaries only.
The long-range actuarial status of the HI trust fund is measured by
comparing, on a year-by-year basis, the income (from payroll taxes
and from taxation of OASDI benefits) with the corresponding
incurred costs, expressed as percentages of taxable payroll.19 These
percentages are referred to as “income rates” and “cost rates,”
respectively.
The historical and projected HI costs under the intermediate
assumptions, expressed as percentages of taxable payroll, and the
income rates under current law for selected years over the 75-year
period, are shown in table III.B7. The ratio of expenditures to taxable
payroll has generally increased over time, rising from 0.94 percent in
1967 to 3.40 percent in 1996, reflecting both the higher rate of
increase in medical care costs than in average earnings subject to HI
taxes, and the more rapid increase in the number of HI beneficiaries
than in the number of covered workers. Cost rates declined
significantly between 1996 and 2000 to 2.60 percent in 2000, due to
favorable economic performance, the impact of the Balanced Budget
Act of 1997, and efforts to curb fraud and abuse in the Medicare
program. The cost rate increased to 2.78 in 2001, 2.95 in 2002, and
2.99 in 2003 as a result of the Benefits Improvement and Protection
Act of 2000 and the 2001 economic recession. In 2004 and 2005, the
cost rate increased to 3.06 percent and 3.11 percent, respectively.
19Taxable payroll is the total amount of wages, salaries, tips, self-employment income,
and other earnings subject to the HI payroll tax.

HI Financial Status
55
Table III.B7.—HI Cost and Income Rates1
Calendar year Cost rates2 Income rates Difference
3
Historical data: 1967 0.94% 1.00% +0.06% 1970 1.20% 1.20% 0.00% 1975 1.69% 1.80% +0.11% 1980 2.19% 2.10% −0.09% 1985 2.62% 2.70% +0.08% 1990 2.70% 2.90% +0.20% 1995 3.29% 3.01% −0.28% 1996 3.40% 3.01% −0.39% 1997 3.35% 3.02% −0.33% 1998 2.99% 3.04% +0.05% 1999 2.77% 3.03% +0.26% 2000 2.60% 3.05% +0.45% 2001 2.78% 3.05% +0.27% 2002 2.95% 3.05% +0.10% 2003 2.99% 3.05% +0.06% 2004 3.06% 3.05% −0.01% 2005 3.11% 3.06% −0.05%
Intermediate estimates: 2006 3.13% 3.08% −0.05% 2007 3.18% 3.09% −0.09% 2008 3.22% 3.12% −0.10% 2009 3.27% 3.10% −0.17% 2010 3.32% 3.12% −0.20% 2011 3.38% 3.14% −0.24% 2012 3.45% 3.16% −0.30% 2013 3.55% 3.17% −0.37% 2014 3.63% 3.18% −0.45% 2015 3.72% 3.19% −0.53% 2020 4.28% 3.25% −1.03% 2025 5.06% 3.29% −1.77% 2030 5.99% 3.33% −2.66% 2035 6.92% 3.36% −3.56% 2040 7.71% 3.37% −4.34% 2045 8.34% 3.37% −4.97% 2050 8.88% 3.37% −5.50% 2055 9.35% 3.38% −5.97% 2060 9.83% 3.39% −6.44% 2065 10.31% 3.39% −6.92% 2070 10.80% 3.40% −7.39% 2075 11.21% 3.41% −7.80% 2080 11.59% 3.42% −8.17%
1Under the intermediate assumptions.
2Estimated costs attributable to insured beneficiaries only, on an incurred basis. Benefits and
administrative costs for noninsured persons are expected to be financed through general revenue transfers and premium payments, rather than through payroll taxes. Gratuitous credits for military service for 1957-2001 are included in taxable payroll. 3Difference between the income rates and cost rates. Negative values represent deficits.
After 2005, the income rates under current law are projected to be
insufficient, by a growing margin, to support the projected costs. By
the end of the long-range projection period, HI tax income is
estimated to cover less than one-third of the cost. As a result, the
trust fund is seriously out of financial balance in the long range, and
substantial reform will be required.
Figure III.B3 shows the year-by-year costs as a percentage of taxable
payroll for each of the three sets of assumptions. The labels “I,” “II,”

Actuarial Analysis
56
and “III” indicate projections under the low cost, intermediate, and
high cost alternatives, respectively. The income rates are also shown,
but only for the intermediate assumptions in order to simplify the
graphical presentation—and because the variation in the income
rates by alternative is very small (by 2080, the annual income rates
under the low cost and high cost alternatives differ by less than
0.4 percent of taxable payroll).
Figure III.B3.—Estimated HI Cost and Income Rates as a Percentage of Taxable Payroll
0%
5%
10%
15%
20%
25%
30%
1955 1965 1975 1985 1995 2005 2015 2025 2035 2045 2055 2065 2075 2085
Calendar year
Income rate
Cost rate
Historical Estimated
III
I
II
Figure III.B3 further reinforces the financial imbalance projected
under the intermediate assumptions. After 2005, cost rates are
projected to exceed income rates under current law by a steadily and
rapidly growing margin. By the end of the 75-year period, this
differential would be more than 8 percent of taxable payroll and
would continue to worsen thereafter. Under the more favorable
economic and demographic conditions assumed in the low cost
assumptions, HI costs would exceed scheduled income by 2021, with a
more modest but steadily growing deficit thereafter. The high cost
projections illustrate the severe financial imbalance that could occur
if future economic conditions resemble those of the 1973-95 period, if
HI expenditure growth accelerates toward pre-1997 levels, and if
fertility rates decline to the levels currently experienced in key
European countries such as the United Kingdom and France.

HI Financial Status
57
Costs beyond the initial 25-year projection period for the intermediate
estimate are based upon the assumption that average HI
expenditures per beneficiary will increase at a rate determined by the
economic model described in sections II.C and IV.C. This rate is about
1.4 percent faster than the Gross Domestic Product (GDP) per capita
in 2030, slowing down to about the same rate as GDP per capita by
2080. Therefore, changes in the next 50 years of the projection period
reflect both the impact of the changing demographic composition of
the population and average benefits that increase more rapidly than
average wages. Beyond the initial 25-year projection period, the low
cost and high cost alternatives assume that HI cost increases, relative
to taxable payroll increases, are initially 2 percentage points less
rapid and 2 percentage points more rapid, respectively, than the
results under the intermediate assumptions. The initial
2-percentage-point differentials are assumed to gradually decrease
until the year 2055, when HI cost increases (relative to taxable
payroll) are assumed to be the same as under the intermediate
assumptions.
The cost rates and income rates are shown over a 75-year valuation
period in order to fully present the future economic and demographic
developments that may reasonably be expected to occur, such as the
impact of the large shift in the demographic composition of the
population that will take place beginning in the next decade. As
figure III.B4 indicates, estimated HI expenditures, expressed as
percentages of taxable payroll, increase rapidly beginning around
2010. This rapid increase in costs occurs in part because the
relatively large number of persons born during the period between
the end of World War II and the mid-1960s (known as the baby boom
generation) will reach eligibility age and begin to receive benefits,
while the relatively smaller number of persons born during later
years will comprise the labor force. During the last 25 years of the
projection period, the demographic impacts moderate somewhat.20
For the most part, current benefits are paid for by current workers.
Consequently, the baby boom generation will be financed by the
relatively small number of persons born after the baby boom.
Figure III.B4 shows the projected ratio of workers per HI beneficiary
from 2005 to 2080.
20HI costs as a percentage of taxable payroll are projected to continue to increase due to
demographic changes, reflecting assumed further improvements in life expectancy and
assumed birth rates that are at roughly the same level as those experienced during the
last 2 decades.

Actuarial Analysis
58
Figure III.B4.—Workers per HI Beneficiary [Based on intermediate assumptions]
0.0
1.0
2.0
3.0
4.0
5.0
2005 2015 2025 2035 2045 2055 2065 2075
Calendar Year
As figure III.B4 indicates, while every beneficiary in 2005 had about
3.9 workers to pay for his or her HI benefit, in 2030 there would be
only about 2.4 workers. This ratio would then continue to decline
until there are only 2.0 workers per beneficiary by 2080.
While year-by-year comparisons of revenues and costs are necessary
to measure the adequacy of HI financing, the financial status of the
trust fund is often summarized, over a specific valuation period, by a
single measure known as the actuarial balance. The actuarial balance
of the HI trust fund is defined as the difference between the
summarized income rate for the valuation period and the
summarized cost rate for the same period.
The summarized income rates, cost rates, and actuarial balance are
based upon the present values of future income, costs, and taxable
payroll. The present values are calculated, as of the beginning of the
valuation period, by discounting the future annual amounts of income
and outgo at the assumed rates of interest credited to the HI trust
fund. The summarized income and cost rates over the projection
period are then obtained by dividing the present value of income and
cost, respectively, by the present value of taxable payroll. The
difference between the summarized income rate and cost rate over
the long-range projection period, after an adjustment to take into
account the fund balance at the valuation date and a target trust

HI Financial Status
59
fund balance at the end of the valuation period, is the actuarial
balance.
In keeping with a decision by the Board of Trustees that it is
advisable to maintain a balance in the trust fund equal to a minimum
of 1 year‟s expenditures, the target trust fund balance is equal to the
following year‟s estimated costs at the end of the 75-year projection
period. It should be noted that projecting an end-of-period target trust
fund balance does not necessarily insure that the trust fund will
maintain such a balance on a year-by-year basis.
The actuarial balance can be interpreted as the percentage that must
be added to the current law income rates and/or subtracted from the
current law cost rates immediately and throughout the entire
valuation period in order for the financing to support HI costs and
provide for the targeted trust fund balance at the end of the
projection period. The income rate increase according to this method
is 3.51 percent of taxable payroll. However, if no changes were made
until the year the trust fund would be exhausted, then the required
increase would be 4.51 percent of taxable payroll under the
intermediate assumptions. If changes were instead made year by
year, as needed to balance each year‟s costs and tax revenues, then
the changes would be minimal through about 2010, but would grow
rapidly thereafter to more than 8 percent of taxable payroll by the
end of the projection period.
The actuarial balances under all three alternative sets of
assumptions, for the next 25, 50, and 75 years, are shown in
table III.B8. The summarized income rate for the entire 75-year
period under the intermediate assumptions is 3.39 percent of taxable
payroll. The summarized HI cost rate under the intermediate
assumptions, for the entire 75-year period, is 6.90 percent. As a
result, the HI trust fund fails to meet the Trustees‟ long-range test of
close actuarial balance by a wide margin. (Section V.G contains the
definition of this test.)

Actuarial Analysis
60
Table III.B8.—HI Actuarial Balances under Three Sets of Assumptions
Intermediate assumptions
Alternative
Low Cost High Cost
Valuation periods:1
25 years, 2006-2030: Summarized income rate 3.41% 3.40% 3.43% Summarized cost rate 4.39% 3.33% 6.08% Actuarial balance −0.98% 0.07% −2.65%
50 years, 2006-2055: Summarized income rate 3.39% 3.35% 3.44% Summarized cost rate 5.87% 3.63% 10.25% Actuarial balance −2.48% −0.28% −6.81%
75 years, 2006-2080:
Summarized income rate 3.39% 3.34% 3.47% Summarized cost rate 6.90% 3.95% 12.93% Actuarial balance −3.51% −0.61% −9.47%
1Income rates include beginning trust fund balances, and cost rates include the cost of attaining a trust
fund balance at the end of the period equal to 100 percent of the following year’s estimated expenditures.
Notes: Totals do not necessarily equal the sums of rounded components.
The divergence in outcomes among the three alternatives is reflected
both in the estimated operations of the trust fund on a cash basis (as
discussed in section III.B2) and in the 75-year summarized costs. The
variations in the underlying assumptions can be characterized as
(i) moderate in terms of magnitude of the differences on a year-by-
year basis, and (ii) persistent over the duration of the projection
period. Under the low cost alternative, the summarized cost rate for
the 75-year valuation period is 3.95 percent of taxable payroll, and
the summarized income rate is 3.34 percent of taxable payroll,
meaning HI income rates provided in current law would not be
adequate on average under the low cost alternative.21 Under the high
cost alternative, the summarized cost rate for the 75-year projection
period is 12.93 percent of taxable payroll, nearly four times the
summarized income rate of 3.47 percent of taxable payroll.
As suggested earlier, past experience has indicated that economic and
demographic conditions that are as financially adverse as those
assumed under the high cost alternative can, in fact, occur. None of
the alternative projections should be viewed as unlikely or
unrealistic. The wide range of results under the three alternatives is
indicative of the uncertainty of HI‟s future cost and its sensitivity to
future economic and demographic conditions. Accordingly, it is
important that an adequate balance be maintained in the HI trust
21As seen in figure III.B3, however, this balance would reflect a significant period of
slight surpluses followed by a period of growing deficits. Under such a scenario, trust
fund assets would initially build up to large levels but would then be drawn down
rapidly and be exhausted before the end of the projection period.

HI Financial Status
61
fund, as a reserve for contingencies, and that financial imbalances be
addressed promptly through corrective legislation.
Table III.B9 shows the long-range actuarial balance under the
intermediate projections with its component parts—the present
values of tax income, expenditures, and asset requirement of the HI
program over the next 75 years. The estimates are for the
“open-group” population—all persons who will participate during the
period as either taxpayers or beneficiaries, or both—and consist of
payments from, and on behalf of, employees now in the workforce, as
well as those who will enter the workforce over the next 75 years. The
estimates also include expenditures attributable to these current and
future workers, in addition to current beneficiaries.
Table III.B9.—Components of 75-Year HI Actuarial Balance under Intermediate Assumptions (2006-2080)
Present value as of January 1, 2006 (in billions): a. Payroll tax income ........................................................................................... $9,340% b. Taxation of benefits income ............................................................................ 1,296% c. Fraud and abuse control receipts ................................................................... 7% d. Total income (a + b + c) .................................................................................. 10,644% e. Expenditures ................................................................................................... 21,934% f. Expenditures minus income (e − d) ................................................................ 11,290% g. Trust fund assets at start of period ................................................................. 285% h. Open-group unfunded obligation (f − g).......................................................... 11,006% i. Ending target trust fund
1 ................................................................................. 285%
j. Present value of actuarial balance (d − e + g − i) ........................................... −11,290% k. Taxable payroll ................................................................................................ 322,083%
Percent of taxable payroll: Actuarial balance (j ÷ k) ............................................................................ −3.51%
1The calculation of the actuarial balance includes the cost of accumulating a target trust fund balance
equal to 100 percent of annual expenditures by the end of the period.
Note: Totals do not necessarily equal the sums of rounded components.
The present value of future expenditures less future tax income,
decreased by the amount of HI trust fund assets on hand at the
beginning of the projection, amounts to $11.0 trillion. This value is
referred to as the 75-year “unfunded obligation” for the HI trust fund.
This value is 29 percent larger than last year‟s value of $8.6 trillion.
The primary reasons for the increase are (i) the lower ultimate real
interest rate assumption, (ii) the later valuation date, and (iii) the
addition of a large deficit year to the calculation. Other reasons for
the change are discussed in more detail later in this section. The
unfunded obligation (adjusted for the ending target trust fund) can be
expressed as a percentage of the present value of future taxable
payroll to calculate the traditional actuarial balance of the HI
program. Under the intermediate assumptions, the present value of
the actuarial deficit is $11.3 trillion. Dividing by the present value of

Actuarial Analysis
62
future taxable payroll (estimated to be $322 trillion), results in the
actuarial balance of −3.51 percent shown in table III.B9.
Figure III.B5 shows the present values, as of January 1, 2006, of
cumulative HI taxes less expenditures (plus the 2006 trust fund)
through each of the next 75 years. These values are estimated under
current law legislated expenditures and tax rates.
Figure III.B5.—Present Value of Cumulative HI Taxes Less Expenditures through Year Shown, Evaluated under Current Law Tax Rates and Legislated Expenditures
[Present value as of January 1, 2006; in trillions]
-$11
-$9
-$7
-$5
-$3
-$1
$1
2006 2016 2026 2036 2046 2056 2066 2076
Ending year of valuation period
The cumulative annual balance of the trust fund is highest at the
beginning of 2006, reflecting the beginning trust fund assets of nearly
$0.3 trillion. The cumulative present value then turns downward over
the projection period, reflecting the anticipated shortfall of tax
revenues, relative to expenditures, in 2006 and later. The trust fund
is projected to become exhausted in 2018, at which time cumulative
expenditures would have exceeded cumulative tax revenues by
enough to equal the initial fund assets accumulated with interest.
The continuing decline in the line thereafter further illustrates the
unsustainable difference between the HI expenditures promised
under current law and the financing currently scheduled to support
these expenditures. As noted previously, over the full 75-year period,
the fund has a projected present value unfunded obligation of
$11.0 trillion. These unfunded obligations indicate that if
$11.0 trillion were added to the trust fund at the beginning of 2006,

HI Financial Status
63
the program could meet the projected cost of current-law
expenditures over the next 75 years. More realistically, additional
annual revenues and/or reductions in expenditures, with a present
value totaling $11.0 trillion, would be required to reach financial
balance.
The estimated unfunded obligation of $11.0 trillion and the closely
associated present value of the actuarial deficit ($11.3 trillion) are
useful indicators of the sizable responsibility facing the American
public. In other words, increases in revenues and/or reductions in
benefit expenditures—equivalent to a lump-sum amount today of
more than $11 trillion—would be required to bring the HI trust fund
into long-range financial balance. At the same time, long-range
measures expressed in dollar amounts, even when expressed as
present values, can be difficult to interpret. For this reason, the
Board of Trustees has customarily emphasized relative measures
such as the income rate and cost rate comparisons shown earlier in
this section.
Consistent with the practice of previous reports, this report focuses
on the 75-year period from 2006 to 2080 for the evaluation of the
long-run financial status of the HI program on an open-group basis
(i.e., including past, current, and future participants). Table III.B10
shows that the present value of open-group unfunded obligations for
the program over that period is $11.0 trillion, which is equivalent to
3.4 percent of taxable payroll or 1.6 percent of GDP. Some experts,
however, have expressed concern that overemphasis on summary
measures (such as the actuarial balance and open-group unfunded
obligations) can obscure the underlying year-by-year patterns of the
long-range financial deficits. If legislative solutions were designed
only to eliminate the overall actuarial deficit, without consideration of
such year-by-year patterns, then a substantial financial imbalance
could still remain at the end of the period, and the long-range
sustainability of the program could still be in doubt.
Reflecting these same concerns, the Medicare Trustees Report has
traditionally focused on the projected year-by-year pattern of HI
income versus expenditures and placed less emphasis on summary
measures. As noted previously in this section, the scheduled tax
revenues for HI represent less than one-third of projected
expenditures at the end of the 75-year projection period, and the
projected financial imbalance worsens throughout this period.

Actuarial Analysis
64
Concern has also been expressed that limiting the projections to
75 years understates the magnitude of the long-range unfunded
obligations for HI, because summary measures reflect the full amount
of taxes paid by the next two or three generations of workers, but not
the full amount of their benefits. One approach to addressing the
limitations of 75-year summary measures is to extend the projection
horizon indefinitely, so that the projected large deficits after the first
75 years are reflected in the overall results.22 Such extended
projections can also help indicate whether the HI financial imbalance
would be improving or continuing to worsen beyond the normal
75-year period. Accordingly, table III.B10 presents estimates of HI
unfunded obligations that extend to the infinite horizon. The
extension assumes that the current-law HI program and the
demographic and economic trends used for the 75-year projection
continue indefinitely except that average HI expenditures per
beneficiary will increase at the same rate as GDP per capita
beginning in about 2080. Extending the calculations beyond 2080
adds $17.1 trillion in unfunded obligations to the amount estimated
through 2080. That is, over the infinite horizon, the HI unfunded
obligations are projected to be $28.1 trillion. This amount represents
5.8 percent of the present value of future HI taxable payroll over the
infinite horizon, or 2.5 percent of GDP.
Table III.B10.—Unfunded HI Obligations from Program Inception through the Infinite Horizon
[Present values as of January 1, 2006; dollar amounts in trillions]
Present value
As a percentage of:
HI taxable payroll GDP
Unfunded obligations through the infinite horizon1 28.1 5.8% 2.5%
Unfunded obligations from program inception through 20801 11.0 3.4% 1.6%
1Present value of future expenditures less income, reduced by the amount of trust fund assets at the
beginning of the period.
Notes: 1. The present values of future HI taxable payroll for 2006-2080 and for 2006 through the infinite horizon are $322.1 trillion and $484.9 trillion, respectively.
2. The present values of GDP for 2006-2080 and for 2006 through the infinite horizon are $707.0 trillion and $1,120.2 trillion, respectively.
3. Totals do not necessarily equal the sums of rounded components.
The projected HI unfunded obligation over the infinite horizon can be
separated into the portions associated with current participants
22The calculation of present values, in effect, applies successively less weight to future
amounts over time, through the process of interest discounting. For example, the
weights associated with the 25th, 75th, and 200th years of the projection would be about
28 percent, 2 percent, and 0.0015 percent, respectively, of the weight for the first year.
In this way, a finite summary measure can be calculated for an infinite projection
period.

HI Financial Status
65
versus future participants. The first line of table III.B11 shows the
present value of future expenditures less future taxes for all current
participants, including both beneficiaries and covered workers.
Subtracting the current value of the HI trust fund (the accumulated
value of past HI taxes less outlays) gives a “closed group” unfunded
obligation of $11.9 trillion. The remaining $16.2 trillion of the total
unfunded obligation is the projected difference between taxes and
expenditures for future participants.
The year-by-year HI deficits described previously in this section have
shown that HI taxes will not be adequate to finance the program on a
“pay-as-you-go” basis (whereby payroll taxes from today‟s workers are
used to provide benefits to today‟s beneficiaries).23 The unfunded
obligations shown in table III.B11 further indicate that workers‟ HI
taxes are not adequate to cover their own future costs when they
become eligible for HI benefits—and that this situation has occurred
for workers in the past and will continue to be true for future workers
under current law. In practice, the projected HI deficits could be
addressed by raising additional revenue or reducing benefits (or some
combination of these actions). The impact of such changes on the
unfunded obligation amounts for current versus future participants
would depend on the specific policies selected.
Table III.B11.—Unfunded HI Obligations for Current and Future Program Participants through the Infinite Horizon
[Present values as of January 1, 2006; dollar amounts in trillions]
Present value
As a percentage of:
HI taxable payroll GDP
Future expenditures less income for current participants ............................................................... $12.2 2.5% 1.1%
Less current trust fund (income minus expenditures to date for past and current participants)...................................... 0.3 0.1% 0.0%
Equals unfunded obligations for past and current participants1 ..................................................... 11.9 2.4% 1.1%
Plus expenditures less income for future participants for the infinite horizon ................................ 16.2 3.3% 1.4%
Equals unfunded obligations for all participants for the infinite future ............................................ 28.1 5.8% 2.5% 1This concept is also referred to as the closed-group unfunded obligation.
Notes: 1. The estimated present value of future HI taxable payroll for 2006 through the infinite horizon is $484.9 trillion.
2. The estimated present value of GDP for 2006 through the infinite horizon is $1,120.2 trillion. 3. Totals do not necessarily equal the sums of rounded components.
The remainder of this section describes the changes in long-range HI
actuarial projections made since the prior year‟s annual report to
23As noted previously, small amounts of income are also received in the form of income
taxes on OASDI benefits, interest, and general revenue reimbursements for certain
uninsured beneficiaries.

Actuarial Analysis
66
Congress was released. Figure III.B6 compares the year-by-year HI
cost and income rates for the current annual report with the
corresponding projections from the 2005 report.
Figure III.B6.—Comparison of HI Cost and Income Rate Projections: Current versus Prior Year’s Reports
0%
2%
4%
6%
8%
10%
12%
14%
1955 1965 1975 1985 1995 2005 2015 2025 2035 2045 2055 2065 2075 2085
Calendar year
Current report
Prior report
Historical Estimated
Cost rate
Income rate
As figure III.B6 indicates, the intermediate HI cost rate projections in
this year‟s report are somewhat higher than in the 2005 report for
most of the projection period. The differential starts at 0.04 percent of
payroll in 2005 and increases, eventually increasing to 0.70 percent
by 2046. The differential then decreases until becoming about zero in
2065. At this point the values in this year‟s report become somewhat
lower than last year‟s values for the rest of the projection period. In
contrast, the projected income rates are not perceptibly different in
the chart.
The cost differentials described above reflect projected rates of
increase in HI costs that are initially faster than those from last
year‟s report but ultimately slower. This difference in the pattern of
growth rates is largely attributable to the refinement in the long-
range growth assumptions adopted in this report, as described in
sections II.C and IV.C. In particular, the growth rates for last year‟s
report were relatively constant for the last 50 years of the projection
and were based on the per capita GDP increase plus 1 percent
(together with demographic impacts). For this year‟s report, the
growth rates are drawn from a simplified economic model that
produces a smoother transition from the current faster rates of

HI Financial Status
67
growth to the ultimate assumption for the infinite horizon based on
the GDP increase plus zero percent. The new growth assumptions
produce the more curved expenditure projection, compared to the
prior more linear pattern. By design, however, as described in section
IV.C, the new assumptions do not affect the overall 75-year actuarial
deficit. The detailed reasons for the change in the actuarial deficit are
described below.
As mentioned earlier, the 75-year HI actuarial balance, under the
intermediate assumptions, is estimated to be −3.51 percent of taxable
payroll. The actuarial balance under the intermediate assumptions as
shown in the 2005 annual report was −3.09 percent. The major
reasons for the change in the 75-year actuarial balance are
summarized in table III.B12. In more detail, these changes consist of
the following:
(1) Change in valuation period: Changing the valuation period
from 2005-2079 to 2006-2080 adds a large deficit year to
the calculation of the actuarial balance. The effect on the
actuarial balance is −0.10 percent of taxable payroll.
(2) Updating the projection base: The actual cost as a
percentage of payroll for 2005 was higher than estimated in
last year‟s report. The increase was primarily attributable
to incurred HI expenditures that were about 2 percent
higher than estimated. This impact is believed attributable
to factors that will similarly affect later years as well. In
the absence of other changes, starting the projection from
the higher actual cost rate in 2005 results in a permanently
higher level of projected costs. This factor results in a total
average change in the actuarial balance of
−0.09 percent of taxable payroll.
(3) Managed care assumptions: Some of the assumptions
regarding health status of new managed care enrollees
have changed since last year‟s report. In addition, the
projected rate of growth in enrollment in MA plans is now
somewhat lower compared to last year‟s rate of growth,
based on preliminary data on such enrollees for 2006. The
combined effect is a −0.12-percent change in the actuarial
balance.
(4) Hospital assumptions: Changes in the hospital assumptions
described in section IV.A result in a +0.11-percent change
in the actuarial balance. The primary assumptions
contributing to this change are lower labor price
differentials for hospitals in the short range, based on the

Actuarial Analysis
68
most recent actual differentials; lower increases in the
short range for various “pass-through” payment amounts;
and a recent policy decision to extend the “hospital transfer
policy” to most diagnosis related groups (DRGs).
(5) Other provider assumptions: Based on recent experience,
changes have been made to the non-hospital provider
utilization and price assumptions. The primary factors are
the implementation of refinements to the resource
utilization groups (RUGs) for skilled nursing facilities and
the slightly higher assumed utilization increases for skilled
nursing facilities and home health agencies. This change
results in a −0.13-percent difference in the actuarial
balance.
(6) Economic and demographic assumptions: Changes to the
economic and demographic assumptions result in a change
of −0.02 percent in the actuarial balance. The primary
changes are faster assumed economic growth in the short
range (which improves the actuarial balance) and a lower
ultimate real interest rate (which worsens the actuarial
balance).
(7) Legislative changes: The 2005 Deficit Reduction Act is
estimated to change the actuarial balance by +0.01 percent,
primarily as a result of lower payments to skilled nursing
facilities and home health agencies. More details on this
legislation are available in section V.A of this report.
(8) Transition from short-range to long-range projection: The
period for explicit HI projection factors has been reduced
from 25 years to 10 years. This change conforms the
methodology to that used for SMI Parts B and D. The
resulting HI costs in the new transition period between the
short-range and long-range assumption periods (years
11-25) are slightly higher than before, resulting in a
−0.08-percent change in the actuarial balance.

HI Financial Status
69
Table III.B12.—Change in the 75-Year Actuarial Balance since the 2005 Report
1. Actuarial balance, intermediate assumptions, 2005 report −3.09%
2. Changes: a. Valuation period −0.10% b. Base estimate −0.09% c. Managed care assumptions −0.12% d. Hospital assumptions 0.11% e. Other provider assumptions −0.13% f. Economic and demographic assumptions −0.02% g. Legislative changes 0.01% h. Methodological changes (short-range to long-range transition) −0.08%
Net effect, above changes −0.42%
3. Actuarial balance, intermediate assumptions, 2006 report −3.51%
4. Long-Range Sensitivity Analysis
This section presents estimates that illustrate the sensitivity of the
long-range cost rate and actuarial balance of HI to changes in
selected individual assumptions. The estimates based on the three
alternative sets of assumptions (that is, intermediate, low cost, and
high cost) demonstrate the effects of varying all of the principal
assumptions simultaneously in order to portray a generally more
optimistic or pessimistic future, in terms of the projected financial
status of the HI trust fund. In the sensitivity analysis presented in
this section, the intermediate set of assumptions is used as the
reference point, and one assumption at a time is varied within that
alternative.
Each table that follows shows the effects of changing a particular
assumption on the HI summarized income rates, summarized cost
rates, and actuarial balances (as defined earlier in this report) for
25-year, 50-year, and 75-year valuation periods. Because the income
rate varies only slightly with changes in assumptions, it is not
considered in the discussion of the tables. The change in each of the
actuarial balances is approximately equal to the change in the
corresponding cost rate, but in the opposite direction. For example, a
lower projected cost rate would result in an improvement or increase
in the corresponding projected actuarial balance.
a. Real-Wage Differential
Table III.B13 shows the estimated HI income rates, cost rates, and
actuarial balances on the basis of the intermediate assumptions, with
various assumptions about the real-wage differential. These
assumptions are that the ultimate real-wage differential will be
0.6 percentage point (as assumed for the high cost alternative),

Actuarial Analysis
70
1.1 percentage points (as assumed for the intermediate assumptions),
and 1.6 percentage points (as assumed for the low cost alternative).
In each case, the ultimate annual increase in the Consumer Price
Index (CPI) is assumed to be 2.8 percent (as assumed for the
intermediate assumptions), yielding ultimate percentage increases in
average annual wages in covered employment of 3.4, 3.9, and
4.4 percent under the three illustrations, respectively.
Past increases in real earnings have exhibited substantial variation.
During 1951-1970, real earnings grew by an average of 2.2 percent
per year. During 1972-1996, however, the average annual increase in
real earnings amounted to only 0.53 percent.24 Poor performance in
real-wage growth would be a matter of some concern; as shown in
table III.B13, projected HI costs are fairly sensitive to the assumed
growth rates in real wages. For the 75-year period 2006-2080, the
summarized cost rate decreases from 7.29 percent (for a real-wage
differential of 0.6 percentage point) to 6.62 percent (for a differential
of 1.6 percentage points). The HI actuarial balance over this period
shows a corresponding improvement for faster rates of growth in real
wages.
Table III.B13—Estimated HI Income Rates, Cost Rates, and Actuarial Balances, Based on Intermediate Estimates with Various Real-Wage Assumptions
[As a percentage of taxable payroll]
Valuation period
Ultimate percentage increase in wages-CPI1
3.4-2.8 3.9-2.8 4.4-2.8
Summarized income rate: 25-year: 2006-2030 3.45 3.41 3.39 50-year: 2006-2055 3.44 3.39 3.36 75-year: 2006-2080 3.44 3.39 3.36
Summarized cost rate: 25-year: 2006-2030 4.57 4.39 4.31 50-year: 2006-2055 6.16 5.87 5.69 75-year: 2006-2080 7.29 6.90 6.62
Actuarial balance: 25-year: 2006-2030 −1.12 −0.98 −0.92 50-year: 2006-2055 −2.73 −2.48 −2.33 75-year: 2006-2080 −3.85 −3.51 −3.27
1The first value in each pair is the assumed ultimate annual percentage increase in average wages in
covered employment. The second value is the assumed ultimate annual percentage increase in the CPI. The difference between the two values is the real-wage differential.
The sensitivity of the HI actuarial balance to different real-wage
assumptions is significant, but not as substantial as one might
intuitively expect. Higher real-wage differentials immediately
increase both HI expenditures for health care and wages for all
workers. Though there is a full effect on wages and payroll taxes, the
24This period was chosen because it begins and ends with years in which the economy
reached full employment. The period thus allows measurement of trend growth over
complete economic cycles.

HI Financial Status
71
effect on benefits is only partial, since not all health care costs are
wage-related. Thus, the HI cost rate decreases with increasing real-
wage differentials, because the higher real-wage levels increase the
taxable payroll to a greater extent than they increase HI benefits. In
particular, each 0.5-percentage-point increase in the assumed real-
wage differential increases the long-range HI actuarial balance, on
average, by about 0.29 percent of taxable payroll.
b. Consumer Price Index
Table III.B14 shows the estimated HI income rates, cost rates, and
actuarial balances on the basis of the intermediate alternative, with
various assumptions about the rate of increase for the CPI. These
assumptions are that the ultimate annual increase in the CPI will be
1.8 percent (as assumed for the low cost alternative), 2.8 percent (as
assumed for the intermediate assumptions), and 3.8 percent (as
assumed for the high cost alternative). In each case, the ultimate
real-wage differential is assumed to be 1.1 percent (as assumed for
the intermediate assumptions), yielding ultimate percentage
increases in average annual wages in covered employment of 2.9, 3.9,
and 4.9 percent under the three illustrations.
Table III.B14.—Estimated HI Income Rates, Cost Rates, and Actuarial Balances, Based on Intermediate Estimates with Various CPI-Increase Assumptions
[As a percentage of taxable payroll]
Valuation period
Ultimate percentage increase in wages-CPI1
2.9-1.8 3.9-2.8 4.9-3.8
Summarized income rate: 25-year: 2006-2030 3.42 3.41 3.39 50-year: 2006-2055 3.40 3.39 3.36 75-year: 2006-2080 3.41 3.39 3.36
Summarized cost rate: 25-year: 2006-2030 4.40 4.39 4.37 50-year: 2006-2055 5.88 5.87 5.84 75-year: 2006-2080 6.91 6.90 6.86
Actuarial balance: 25-year: 2006-2030 −0.98 −0.98 −0.98 50-year: 2006-2055 −2.47 −2.48 −2.47 75-year: 2006-2080 −3.50 −3.51 −3.50
1The first value in each pair is the assumed ultimate annual percentage increase in average wages in
covered employment. The second value is the assumed ultimate annual percentage increase in the CPI.
The cost rate remains about the same with greater assumed rates of
increase in the CPI. Over the 75-year projection period, for example,
the cost rate decreases from 6.91 percent (for CPI increases of
1.8 percent) to 6.86 percent (for CPI increases of 3.8 percent). The
relative insensitivity of projected HI cost rates to different levels of
general inflation occurs because inflation is assumed to affect both

Actuarial Analysis
72
the taxable payroll of workers and medical care costs about equally.25
In practice, differing rates of inflation could occur between the
economy in general and the medical-care sector. The effect of such a
difference can be judged from the sensitivity analysis shown in the
subsequent section on miscellaneous health care cost factors. An
increase of 1 percentage point in the rate of change assumed for the
CPI has a negligible effect on the long-range actuarial balance.
c. Real-Interest Rate
Table III.B15 shows the estimated HI income rates, cost rates, and
actuarial balances under the intermediate alternative, with various
assumptions about the annual real-interest rate for special public-
debt obligations issuable to the trust fund. These assumptions are
that the ultimate annual real-interest rate will be 2.1 percent (as
assumed for the high cost alternative), 2.9 percent (as assumed for
the intermediate assumptions), and 3.6 percent (as assumed for the
low cost alternative). In each case, the ultimate annual increase in
the CPI is assumed to be 2.8 percent (as assumed for the
intermediate assumptions), resulting in ultimate annual yields of 4.9,
5.7, and 6.4 percent under the three illustrations.
Table III.B15.—Estimated HI Income Rates, Cost Rates, and Actuarial Balances, Based on Intermediate Estimates with Various Real-Interest Assumptions
[As a percentage of taxable payroll]
Valuation period
Ultimate annual real-interest rate
2.1 percent 2.9 percent 3.6 percent
Summarized income rate: 25-year: 2006-2030 3.40 3.41 3.42 50-year: 2006-2055 3.38 3.39 3.40 75-year: 2006-2080 3.39 3.39 3.40
Summarized cost rate: 25-year: 2006-2030 4.45 4.39 4.33 50-year: 2006-2055 6.11 5.87 5.66 75-year: 2006-2080 7.36 6.90 6.52
Actuarial balance: 25-year: 2006-2030 −1.05 −0.98 −0.91 50-year: 2006-2055 −2.73 −2.48 −2.26 75-year: 2006-2080 −3.97 −3.51 −3.12
For all periods, the cost rate decreases with increasing real-interest
rates. Over 2006-2080, for example, the summarized HI cost rate
would decline from 7.36 percent (for an ultimate real-interest rate of
2.1 percent) to 6.52 percent (for an ultimate real-interest rate of
3.6 percent). Thus, each 1.0-percentage-point increase in the assumed
real-interest rate increases the long-range actuarial balance, on
25The slight sensitivity shown in the table results primarily from the fact that the fiscal
year 2006 payment rates for all providers have already been set before the actual CPI
is known.
HI Financial Status
73
average, by about 0.57 percent of taxable payroll. The fact that the HI
actuarial balance is sensitive to the interest assumption is not an
indication of the actual role that interest plays in the financing. In
reality, interest finances only a minimal portion of the HI cost. The
sensitivity of the actuarial balance to the interest assumption is
implicit in the present-value method used to determine the actuarial
balance, since the present-value calculations are very sensitive to the
interest rates used to discount future amounts to their present
equivalent values.
d. Health Care Cost Factors
Table III.B16 shows the estimated HI income rates, cost rates, and
actuarial balances on the basis of the intermediate set of
assumptions, with two variations on the relative annual growth rate
in the aggregate cost of providing covered health care services to HI
beneficiaries. These assumptions are that the ultimate annual growth
rate in such costs, relative to the growth in taxable payroll, will be
1 percentage point slower than the intermediate assumption, the
same as the intermediate assumption, and 1 percentage point faster
than the intermediate assumption. In each case, the taxable payroll
will be the same as assumed for the intermediate assumptions.
As noted previously, factors such as wage and price increases may
simultaneously affect HI tax income and the costs incurred by
hospitals and other providers of medical care to HI beneficiaries. (The
sensitivity of the trust fund‟s financial status to these factors is
evaluated in sections III.B4a and III.B4b.) Other factors, such as the
utilization of services by beneficiaries or the relative complexity of the
services provided, can affect provider costs without affecting HI tax
income. The sensitivity analysis shown in table III.B16 illustrates the
financial effect of any combination of these factors that results in
aggregate provider costs increasing by 1 percentage point faster or
slower than the intermediate assumptions, relative to growth in
taxable payroll under the intermediate assumptions.

Actuarial Analysis
74
Table III.B16.—Estimated HI Income Rates, Cost Rates, and Actuarial Balances, Based on Intermediate Estimates with Various Health Care Cost Growth Rate
Assumptions [As a percentage of taxable payroll]
Valuation period
Annual cost/payroll relative growth rate
−1 percentage point 0 percentage point +1 percentage point
Summarized income rate: 25-year: 2006-2030 3.41 3.41 3.41 50-year: 2006-2055 3.39 3.39 3.39 75-year: 2006-2080 3.39 3.39 3.39
Summarized cost rate: 25-year: 2006-2030 3.81 4.39 5.08 50-year: 2006-2055 4.48 5.87 7.81 75-year: 2006-2080 4.73 6.90 10.44
Actuarial balance: 25-year: 2006-2030 −0.40 −0.98 −1.67 50-year: 2006-2055 −1.09 −2.48 −4.42 75-year: 2006-2080 −1.34 −3.51 −7.05
As illustrated in table III.B16, the financial status of the HI trust
fund is extremely sensitive to the relative growth rates for health
care service costs versus taxable payroll. For the 75-year period, the
cost rate increases from 4.73 percent (for an annual cost/payroll
growth rate of 1 percentage point less than the intermediate
assumptions) to 10.44 percent (for an annual cost/payroll growth rate
of 1 percentage point more than the intermediate assumptions). Each
1.0-percentage-point increase in the assumed cost/payroll relative
growth rate decreases the long-range actuarial balance, on average,
by about 2.86 percent of taxable payroll.
C. SMI FINANCIAL STATUS
1. Total SMI
The Federal Supplementary Medical Insurance Trust Fund was
established on July 30, 1965 as a separate account in the U.S.
Treasury. All the financial operations of SMI are handled through
this fund. Beginning in 2004, the trust fund consists of two separate
accounts—one for Part B and one for Part D. The purpose of the two
accounts is to ensure that funds from one part are not used to finance
the other.
In order to evaluate the financial status of the SMI trust fund, each
account needs to be assessed individually, since the financing rates
for each part are established separately, their program benefits are
quite different in nature, and there is no provision for transferring
assets. Sections III.C2 and III.C3 will discuss the financial status of
Parts B and D individually. The purpose of this section is to present
the expected operations of the SMI trust fund in total, combining the

SMI Financial Status
75
expected operations for Parts B and D, and to discuss the implications
of continuing rapid SMI cost growth.
a. 10-Year Actuarial Estimates (2006-2015)
Future operations of the SMI trust fund are projected using the
Trustees‟ economic and demographic assumptions, as detailed in the
OASDI Trustees Report, as well as other assumptions unique to SMI.
Section IV.B presents an explanation of the effects of the Trustees‟
intermediate assumptions, and of the other assumptions unique to
SMI, on the estimates in this report. It is important to note that
projected SMI expenditures are substantially understated because
projected physician payment updates are unrealistically reduced
under the current-law sustainable growth rate system. However, for
the benefit expenditure estimates, it is assumed that current
statutory provisions are maintained. In addition, although Part B
financing rates have been set only through December 31, 2006, it is
assumed that financing for future periods will be determined
according to the statutory provisions described in section III.C2 for
Part B and section III.C3 for Part D.
Table III.C1 shows the estimated operations of the SMI trust fund
under the intermediate assumptions on a calendar-year basis through
2015. This table combines the operations of the Part B and Part D
accounts to present the expected operations of the trust fund in total.

Actuarial Analysis
76
Table III.C1.—Operations of the SMI Trust Fund (Cash Basis) during Calendar Years 1970-2015
[In billions]
Calendar year
Income Expenditures Trust fund
Premium income
1
General revenue
2
Transfers from
States
Interest and
other3,4
Total Benefit
payments4,5
Adminis-trative
expense Total Net
change
Balance at end of
year6
Historical data: 1970 $1.1 $1.1 — $0.0 $2.2 $2.0 $0.2 $2.2 −$0.0 $0.2 1975 1.9 2.6 — 0.1 4.7 4.3 0.5 4.7 −0.1 1.4 1980 3.0 7.5 — 0.4 10.9 10.6 0.6 11.2 −0.4 4.5 1985 5.6 18.3 — 1.2 25.1 22.9 0.9 23.9 1.2 10.9 1990 11.3 33.0 — 1.6 45.9 42.5 1.5 44.0 1.9 15.5 1995 19.7 39.0 — 1.6 60.3 65.0 1.6 66.6 −6.3 13.1 1996 18.8 65.0 — 1.8 85.6 68.6 1.8 70.4 15.2 28.3 1997 19.3 60.2 — 2.5 81.9 72.8 1.4 74.1 7.8 36.1 1998 20.9
7 64.1
7 — 2.7 87.7 76.1
8 1.5 77.6 10.1 46.2
1999 19.0 7 59.1
7 — 2.8 80.9 80.7
8 1.6 82.3 −1.4 44.8
2000 20.6 65.9 — 3.4 89.9 88.9 8 1.8 90.7 −0.8 44.0
2001 22.8 72.8 — 3.1 98.6 99.7 8 1.7 101.4 −2.8 41.3
2002 25.1 78.3 — 2.8 106.2 111.0 8 2.2 113.2 −7.0 34.3
2003 27.4 86.4 — 2.0 115.8 123.8 8 2.3 126.1 −10.3 24.0
2004 31.4 100.9 — 1.5 133.8 135.4 2.9 138.3 −4.5 19.4 2005 37.5 119.2 — 1.4 158.1 150.3 3.2 153.5 4.6 24.0
Intermediate estimates: 2006 48.0 178.9 $7.0 1.7 235.7 228.2 3.4 231.5 4.1 28.1 2007 56.5 200.3 7.5 2.4 266.8 245.1 3.4 249.3
9 17.5 45.6
2008 61.1 210.1 8.1 3.1 282.4 268.9 3.5 272.4 10.0 55.6 2009 69.6
7 233.6
7 8.7 3.7 315.5 291.1 3.6 294.8 20.8 76.4
2010 62.6 7 222.0
7 9.4 4.0 297.9 309.9 3.8 313.7 −15.8 60.6
2011 72.8 252.3 10.1 4.2 339.4 333.0 3.9 337.0 2.4 63.0 2012 78.3 272.1 10.9 4.4 365.7 358.9 4.1 363.0 2.7 65.7 2013 84.2 294.1 11.9 4.6 394.7 387.6 4.2 391.8 2.9 68.6 2014 90.2 317.1 12.8 4.8 424.9 417.9 4.4 422.2 2.7 71.3 2015 97.0 342.8 13.9 5.0 458.7 450.1 4.5 454.6 4.1 75.4
1Premiums for Part D include only amounts withheld from the Social Security benefit checks or other
Federal payments. 2Includes Part B general fund matching payments, Part D subsidy costs, and certain interest-adjustment
items. 3Other income includes recoveries of amounts reimbursed from the trust fund that are not obligations of
the trust fund and other miscellaneous income. 4See footnote 2 of table III.B4.
5Includes costs of Peer Review Organizations from 1983 through 2001, and costs of Quality
Improvement Organizations beginning in 2002. Values after 2005 include additional premiums collected from beneficiaries and transferred to managed care plans, in which the monthly plan cost exceeds the benchmark amount, and Part D drug premiums collected from beneficiaries and transferred to Medicare Advantage plans and private drug plans. 6The financial status of SMI depends on both the assets and the liabilities of the trust fund (see
table III.C12). 7Section 708 of the Social Security Act modifies the provisions for the delivery of Social Security benefit
checks when the regularly designated day falls on a Saturday, Sunday, or legal public holiday. Delivery of benefit checks normally due January 3, 1999 occurred on December 31, 1998. Consequently, the Part B premiums withheld from the checks ($1.5 billion) and the associated general revenue contributions ($4.7 billion) were added to the SMI trust fund on December 31, 1998. These amounts are excluded from the premium income and general revenue income for 1999. January 3, 2010 will fall on a Sunday, and therefore the delivery of the Social Security checks is expected to occur on December 31, 2009. 8Benefit payments less monies transferred from the HI trust fund for home health agency costs, as
provided for by the Balanced Budget Act of 1997.
9Includes payment of estimated contingent liability payable to States (to reimburse them for payments
they have made on behalf of beneficiaries) for probable unasserted claims that resulted from processing errors in which incorrect Medicare eligibility determinations were made ($762 million).
Note: Totals do not necessarily equal the sums of rounded components.
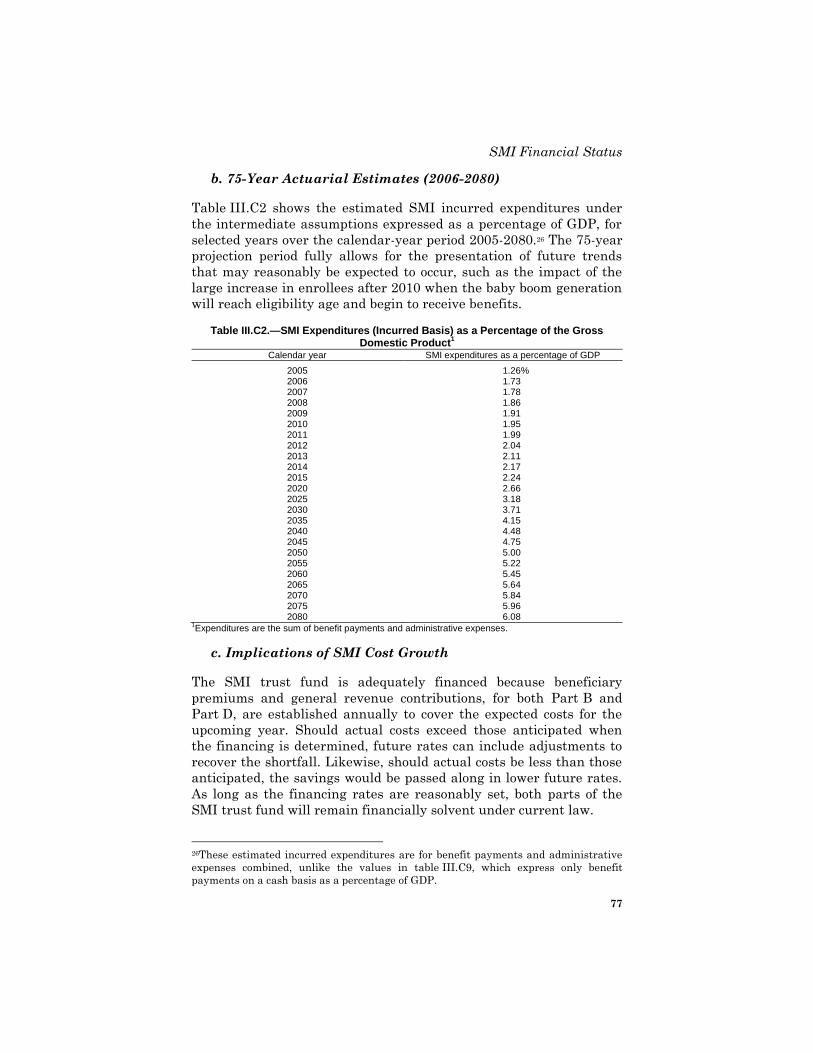
SMI Financial Status
77
b. 75-Year Actuarial Estimates (2006-2080)
Table III.C2 shows the estimated SMI incurred expenditures under
the intermediate assumptions expressed as a percentage of GDP, for
selected years over the calendar-year period 2005-2080.26 The 75-year
projection period fully allows for the presentation of future trends
that may reasonably be expected to occur, such as the impact of the
large increase in enrollees after 2010 when the baby boom generation
will reach eligibility age and begin to receive benefits.
Table III.C2.—SMI Expenditures (Incurred Basis) as a Percentage of the Gross Domestic Product
1
Calendar year SMI expenditures as a percentage of GDP
2005 1.26 % 2006 1.73 2007 1.78 2008 1.86 2009 1.91 2010 1.95 2011 1.99 2012 2.04 2013 2.11 2014 2.17 2015 2.24 2020 2.66 2025 3.18 2030 3.71 2035 4.15 2040 4.48 2045 4.75 2050 5.00 2055 5.22 2060 5.45 2065 5.64 2070 5.84 2075 5.96 2080 6.08
1Expenditures are the sum of benefit payments and administrative expenses.
c. Implications of SMI Cost Growth
The SMI trust fund is adequately financed because beneficiary
premiums and general revenue contributions, for both Part B and
Part D, are established annually to cover the expected costs for the
upcoming year. Should actual costs exceed those anticipated when
the financing is determined, future rates can include adjustments to
recover the shortfall. Likewise, should actual costs be less than those
anticipated, the savings would be passed along in lower future rates.
As long as the financing rates are reasonably set, both parts of the
SMI trust fund will remain financially solvent under current law.
26These estimated incurred expenditures are for benefit payments and administrative
expenses combined, unlike the values in table III.C9, which express only benefit
payments on a cash basis as a percentage of GDP.

Actuarial Analysis
78
However, a critical issue for the SMI program is the impact of the
rapid growth of SMI costs, which place steadily increasing demands
on beneficiaries and taxpayers. This section compares the past and
projected growth in SMI costs with GDP growth and assesses the
implications of the rapid growth on beneficiaries and the budget of
the Federal Government. Projected SMI cost growth is substantially
understated, however, because projected physician payment updates
are unrealistically reduced under the current-law sustainable growth
rate system.
Table III.C3 compares the growth in SMI expenditures with that of
the economy as a whole. Based on our current-law estimates, SMI
costs will continue to outpace growth in GDP. Compared to the last
10 years, the growth differential in the next 25 years is generally
estimated to be similar, reflecting the net effects of (i) the increase in
the SMI population as the baby boom generation turns age 65,
enrolls, and is eligible to receive benefits, (ii) the faster growth trend
associated with the new Part D prescription drug benefit, and (iii) the
negative physician payment updates that would occur under current
law during 2007-2015. The introduction of the full drug benefit in
2006 causes a one-time very large increase in the growth rate.
Table III.C3.—Average Annual Rates of Growth in SMI and the Economy [In percent]
Calendar years
SMI U.S. Economy
Growth differential
1
Beneficiary population
Per capita expenditures
Total expenditures
Total population
Per capita GDP Total GDP
Historical data: 1968-1985 2.9 13.8 17.1 1.0 8.4 9.4 7.0 1985-1995 1.8 8.9 10.9 1.1 4.7 5.8 4.8 1995-2005 1.1 7.9 9.0 1.0 4.4 5.4 3.4
Intermediate estimates: 2006-2015 2.2 8.8
2 11.2
2 0.8 4.1 5.0 5.9
2
2016-2030 2.6 5.3 8.0 0.7 3.8 4.5 3.4 2031-2055 0.7 5.1 5.9 0.4 4.1 4.4 1.4 2056-2080 0.6 4.4 5.0 0.3 4.1 4.4 0.6 1Excess of total SMI benefit growth above total GDP growth.
2Includes the addition of the prescription drug benefit to the SMI program in 2006. Excluding 2006, the
projected per capita benefits increase by 5.6 percent, the total benefits increase by 8.0 percent, and the growth differential increases by 3.0 percent.
Since SMI per capita benefits are expected to continue to grow faster
than per capita GDP, the premiums and coinsurance amounts paid by
beneficiaries would generally represent a growing share of their total
income. Figure III.C1 compares past and projected growth in average
benefits for SMI versus Social Security. Amounts are also shown for
the average SMI premium payments and average cost-sharing
payments. (Each of these SMI amounts increases in 2006 with the
introduction of the Part D prescription drug benefit.) To facilitate

SMI Financial Status
79
comparison across long time periods, all values are shown in constant
2005 dollars.
Over time, the average Social Security benefit tends to increase at
about the rate of growth in average earnings. As noted previously,
health care costs generally reflect increases in the earnings of health
care professionals, other medical cost inflation, and growth in the
utilization and intensity of services. As indicated in figure III.C1,
average SMI benefits in 1970 were only about one-twelfth the level of
average Social Security benefits but had grown to more than
one-third by 2005. Under the intermediate projections, SMI benefits
would continue increasing at a faster rate and would exceed the
average Social Security retired worker benefit after 2057.
Average beneficiary premiums and cost-sharing payments for SMI
will increase at about the same rate as average SMI benefits.27 Thus,
a growing proportion of beneficiaries‟ Social Security and other
income would generally be required over time to pay total out-of-
pocket costs for SMI, including both premiums and cost-sharing
amounts. Most SMI enrollees have other income in addition to Social
Security benefits. Other possible sources include earnings from
employment, employer-sponsored pension benefits, and investment
earnings. For simplicity, the comparisons in figure III.C1 are relative
to Social Security benefits only; a comparison of average SMI
premiums and cost-sharing amounts to average total beneficiary
income would lead to similar conclusions. For illustration, the
average Part B plus Part D premium in 2010 is estimated to equal
12 percent of the average Social Security benefit but would increase
to an estimated 26 percent in 2080. Similarly, an average cost-
sharing amount in 2010 would be equivalent to 17 percent of the
Social Security benefit, increasing to 37 percent in 2080.
It is important to note that the availability of SMI Part B and Part D
benefits greatly reduces the costs that beneficiaries would otherwise
face for health care services. The introduction of the prescription drug
benefit increases beneficiaries‟ costs for SMI premiums and cost
sharing, but reduces their costs for previously uncovered services by
substantially more. The purpose of the illustrations in figure III.C1 is
to highlight the impact of rapid cost growth for a given SMI benefit
package.
27As a result, the ratio of average SMI out-of-pocket payments to average SMI benefits
is projected to be nearly constant over time.

Actuarial Analysis
80
Figure III.C1.—Comparison of Average Monthly SMI Benefits, Premiums, and Cost-Sharing to the Average Monthly Social Security Benefit
[Amounts in constant 2005 dollars]
$0
$500
$1,000
$1,500
$2,000
$2,500
1970 1985 2000 2015 2030 2045 2060 2075 2090
Historical Estimated Average
SMI benefit
Average SS
benefit
Total SMI
out-of-pocket
Average SMI
premium
Average SMI
cost-sharing
The Social Security benefits shown in figure III.C1 are based on the
average OASI benefit amount for all retired workers; individual
retirees may receive significantly more or less than the average,
depending on their past earnings. The value of SMI benefits to
individual enrollees, and their cost-sharing payments, varies even
more substantially, depending on their income, assets, and use of
covered health services in a given year. In particular, Part B
premiums and cost-sharing amounts for beneficiaries with very low
incomes are paid by Medicaid, and (except for nominal copayments)
the corresponding Part D amounts are paid through the Medicare
low-income drug subsidy. Moreover, Part B beneficiaries with very
high incomes will pay a higher income-related premium beginning in
2007. For purposes of illustration, the average SMI benefit value and
cost-sharing liability for all beneficiaries are shown. Results for
individual beneficiaries can vary substantially from these
illustrations. Further information on the nature of this comparison,
and the variations from the illustrative average results, is available
at http://www.cms.hhs.gov/ReportsTrustFund/04_Beneficiaryoop.asp.
Another way to evaluate the implications of rapid SMI growth is to
compare the government contributions to the SMI trust fund with
total Federal income taxes (personal and corporate income taxes).

SMI Financial Status
81
Table III.C4 indicates that SMI general revenues in fiscal year 2005
were equivalent to about 9.6 percent of total Federal income taxes
collected in that year. With the addition of the prescription drug
benefit in 2006, SMI general revenues will substantially increase as a
percentage of total income taxes. If such taxes in the future maintain
their historical average level of the last 50 years, relative to the
national economy, then SMI general revenue financing in 2080 would
represent about 40 percent of total income taxes, based on the
intermediate projections.
Table III.C4.—SMI General Revenues as a Percentage of Personal and Corporate Federal Income Taxes
Fiscal year Percentage of income taxes1
Historical data: 1970 0.8 % 1980 2.2 1990 5.9 2000 5.4 2005 9.6
Intermediate estimates: 2010 14.2 2020 17.5 2030 24.4 2040 29.5 2050 32.9 2060 35.9 2070 38.4 2080 40.0
1Includes the Part D prescription drug benefit beginning in 2006.
These examples illustrate the significant impact that SMI
expenditure growth has had to date on beneficiaries and the Federal
Budget. Under current law, the projected SMI expenditure increases
associated with the cost of providing health care generally, plus the
impact of the baby boom generation reaching eligibility age, would
continue to exert growing pressure. This outlook reinforces the
Trustees‟ recommendation for development and enactment of reforms
to reduce the rate of growth in SMI expenditures.
2. Part B Account
a. Financial Operations in Fiscal Year 2005
A statement of the revenue and expenditures of the Part B account of
the SMI trust fund in fiscal year 2005, and of its assets at the
beginning and end of the fiscal year, is presented in table III.C5.

Actuarial Analysis
82
Table III.C5.—Statement of Operations of the Part B Account in the SMI Trust Fund during Fiscal Year 2005
[In thousands]
Total assets of the Part B account in the trust fund, beginning of period ................................................................................................................................... $17,114,354
Revenue: Premiums from enrollees:
Enrollees aged 65 and over ................................................................................... $30,393,605 Disabled enrollees under age 65 ........................................................................... 5,545,738
Total premiums ........................................................................................................... 35,939,343 Government contributions:
Enrollees aged 65 and over ................................................................................... 92,002,315 Disabled enrollees under age 65 ........................................................................... 21,999,685
Total Government contributions ................................................................................. 114,002,000 Other ........................................................................................................................... 2,262 Interest on investments .............................................................................................. 1,363,523
Total revenue ................................................................................................................... 151,307,129
Expenditures: Net Part B benefit payments ...................................................................................... 148,622,812 Administrative expenses:
Transfer to Medicaid1 ............................................................................................. 242,289
Treasury administrative expenses ......................................................................... 259 Salaries and expenses, CMS
2 ............................................................................... 1,512,859
Salaries and expenses, Office of the Secretary, HHS........................................... 27,702 Salaries and expenses, SSA ................................................................................. 554,413 Medicare Payment Assessment Commission ....................................................... 3,960 Railroad Retirement administrative expenses ....................................................... 6,413 Transitional assistance administrative expenses .................................................. 107,455 Prescription drug administrative expenses ............................................................ 458,818
Total administrative expenses .................................................................................... 2,914,169
Total expenditures ........................................................................................................... 151,536,981
Net addition to the trust fund ........................................................................................... −229,852
Total assets of the Part B account in the trust fund, end of period .....................................
$16,884,502
1Represents amount transferred from the Part B account in the SMI trust fund to Medicaid to pay the
Part B premium for certain qualified individuals, as legislated by the Balanced Budget Act of 1997. 2Includes administrative expenses of the carriers and intermediaries.
Note: Totals do not necessarily equal the sums of rounded components.
The total assets of the account amounted to $17,114 million on
September 30, 2004. During fiscal year 2005, total revenue amounted
to $151,307 million, and total expenditures were $151,537 million.
Total assets thus decreased $230 million during the year, to
$16,885 million as of September 30, 2005. The decline in assets
occurred because the appropriation for Part B general revenue
matching funds was smaller than needed for the fiscal year and
because actual Part B costs were greater than previously estimated.
A supplemental general revenue transfer payment was made on
December 31, 2005 as a result of the general revenue appropriation
shortfall in fiscal year 2005.

SMI Financial Status
83
(1) Revenues
The major sources of revenue for the Part B account are
(i) contributions of the Federal Government that are authorized to be
appropriated and transferred from the general fund of the Treasury,
and (ii) premiums paid by eligible persons who are voluntarily
enrolled. Eligible persons aged 65 and over have been able to enroll in
Part B since its inception in July 1966. Since July 1973, disabled
persons who are under age 65 and who have met certain eligibility
requirements have also been able to enroll.
Of the total Part B revenue, $35,939 million represented premium
payments by (or on behalf of) aged and disabled enrollees—an
increase of 18.5 percent over the amount of $30,341 million for the
preceding year. This increase resulted from the growth in the number
of persons enrolled in Part B and the 17.4-percent increase in the
Part B premium to $78.20 for calendar year 2005. (This unusually
large premium increase was necessary to prevent a substantial
reduction in the level of Part B assets.)
Premiums paid for fiscal years 1967 through 1973 were matched by
an equal amount of government contributions. Beginning July 1973,
the amount of government contributions corresponding to premiums
paid by each of the two groups of enrollees is determined by applying
a “matching ratio,” prescribed in the law for each group, to the
amount of premiums received from that group. The ratio is equal to
(i) twice the monthly actuarial rate applicable to the particular group
of enrollees, minus the standard monthly premium rate, divided by
(ii) the standard monthly premium rate.
Standard monthly premium rates and actuarial rates are
promulgated each year by the Secretary of Health and Human
Services. Past monthly premium rates and actuarial rates are shown
in table III.C6, together with the corresponding percentages of Part B
costs covered by the premium rate. Estimated future premium
amounts under the intermediate set of assumptions appear in
section V.C.

Actuarial Analysis
84
Table III.C6.—Standard Part B Monthly Premium Rates, Actuarial Rates, and Premium Rates as a Percentage of Part B Cost
Standard monthly
premium rate
Monthly actuarial rate Premium rates as a
percentage of Part B cost
Enrollees aged 65 and over
Disabled enrollees under
age 65 Enrollees aged
65 and over
Disabled enrollees
under age 65
July 1966-March 1968 $3.00 — — 50.0 % —
April 1968-June 1970 4.00 — — 50.0 —
12-month period ending June 30 of 1971 5.30 — — 50.0 — 1972 5.60 — — 50.0 — 1973 5.80 — — 50.0 — 1974
1 6.30 $6.30 $14.50 50.0 21.7 %
1975 6.70 6.70 18.00 50.0 18.6 1976 6.70 7.50 18.50 44.7 18.1 1977 7.20 10.70 19.00 33.6 18.9 1978 7.70 12.30 25.00 31.3 15.4 1979 8.20 13.40 25.00 30.6 16.4 1980 8.70 13.40 25.00 32.5 17.4 1981 9.60 16.30 25.50 29.4 18.8 1982 11.00 22.60 36.60 24.3 15.0 1983 12.20 24.60 42.10 24.8 14.5
July 1983-December 1983 12.20 27.00 46.10 22.6 13.2
Calendar year 1984 14.60 29.20 54.30 25.0 13.4 1985 15.50 31.00 52.70 25.0 14.7 1986 15.50 31.00 40.80 25.0 19.0 1987 17.90 35.80 53.00 25.0 16.9 1988 24.80 49.60 48.60 25.0 25.5 1989 31.90
2 55.80 34.30 25.0
3 40.7
3
1990 28.60 57.20 44.10 25.0 32.4 1991 29.90 62.60 56.00 23.9 26.7 1992 31.80 60.80 80.80 26.2 19.7 1993 36.60 70.50 82.90 26.0 22.1 1994 41.10 61.80 76.10 33.3 27.0 1995 46.10 73.10 105.80 31.5 21.8 1996 42.50 84.90 105.10 25.0 20.2 1997 43.80 87.60 110.40 25.0 19.8 1998 43.80 87.90 97.10 24.9 22.6 1999 45.50 92.30 103.00 24.6 22.1 2000 45.50 91.90 121.10 24.8 18.8 2001 50.00 101.00 132.20 24.8 18.9 2002 54.00 109.30 123.10 24.7 21.9 2003 58.70 118.70 141.00 24.7 20.8 2004 66.60 133.20 175.50 25.0 19.0 2005 78.20 156.40 191.80 25.0 20.4 2006 88.50 176.90 203.70 25.0 21.7 1In accordance with limitations on the costs of health care imposed under Phase III of the Economic
Stabilization program, the standard premium rates for July and August 1973 were set at $5.80 and $6.10, respectively. Effective September 1973, the rate increased to $6.30. 2This rate includes the $4.00 catastrophic coverage monthly premium that was paid by most enrollees
under the Medicare Catastrophic Coverage Act of 1988 (subsequently repealed). 3The premium rates as a percentage of Part B cost for calendar year 1989 apply to the non-catastrophic
portion of the standard monthly premium rate.
Figure III.C2 is a graphical representation of the monthly per capita
financing rates, for financing periods since 1983, for enrollees aged 65
and over and for disabled individuals under age 65. The graph shows

SMI Financial Status
85
the portion of the financing contributed by the beneficiaries and by
general revenues. As indicated, general revenue financing is the
largest income source for Part B.
Figure III.C2.—Part B Aged and Disabled Monthly Per Capita Trust Fund Income
$0
$25
$50
$75
$100
$125
$150
$175
$200
$225
$250
$275
$300
$325
1984 1986 1988 1990 1992 1994 1996 1998 2000 2002 2004 2006
Beneficiary premium
Aged general revenue contribution
Disabled general revenue contribution
Financing period
Note: The amounts shown do not include the catastrophic coverage monthly premium rate for 1989.
In fiscal year 2005, contributions received from the general fund of
the Treasury amounted to $114,002 million, which accounted for
75.3 percent of total revenue.
Another source of Part B revenue is interest received on investments
held by the Part B account. The investment procedures of the Part B
account are described later in this section. In fiscal year 2005,
$1,364 million of revenue consisted almost entirely of interest on the
investments of the account.
The Managing Trustee may accept and deposit in the Part B account
unconditional money gifts or bequests made for the benefit of the
fund. Contributions in the amount of $2 million were made in fiscal
year 2005.

Actuarial Analysis
86
(2) Expenditures
Expenditures for Part B benefit payments and administrative
expenses are paid out of the account. All expenses incurred by the
Department of Health and Human Services, the Social Security
Administration, and the Department of the Treasury in
administering Part B are charged to the account. Such administrative
duties include payment of benefits, the fraud and abuse control
activities, and experiments and demonstration projects designed to
determine various methods of increasing efficiency and economy in
providing health care services, while maintaining the quality of such
services.
In addition, Congress has authorized expenditures from the trust
funds for construction, rental and lease, or purchase contracts of
office buildings and related facilities for use in connection with the
administration of Part B. Such costs are included in the account
expenditures. The net worth of facilities and other fixed capital
assets, however, is not carried in the statement of Part B assets
presented in this report, since the value of fixed capital assets does
not represent funds available for benefit or administrative
expenditures and is not, therefore, pertinent in assessing the
actuarial status of the funds.
Of the $151,537 million in total Part B expenditures, $148,623 million
represented net benefits paid from the account for health services.28
Net benefits increased 13.1 percent over the corresponding amount of
$131,457 million paid during the preceding fiscal year. This increase
reflects (i) the impact of the Medicare Modernization Act (MMA),
which increased payments to physicians in 2005, and (ii) sizable
increases in certain other Part B benefit categories. Additional
information on Part B benefits by type of service is available in
section IV.B1.
The remaining $2,914 million of expenditures was for administrative
expenses made up of (i) the net Part B administrative expenses, after
adjustments to the preliminary allocation of administrative costs
among the Social Security and Medicare trust funds and the general
fund of the Treasury, (ii) the net transitional drug assistance
administrative expenses, and (iii) certain other net Part D
administrative expenses. The start-up administrative expenses for
28Net benefits equal the total gross amounts initially paid from the trust fund during
the year less recoveries of overpayments identified through fraud and abuse control
activities.

SMI Financial Status
87
transitional assistance and Part D are paid out of the Part B account,
as specified by the MMA.
(3) Actual experience versus prior estimates
Table III.C7 compares the actual experience in fiscal year 2005 with
the estimates presented in the 2004 and 2005 annual reports. A
number of factors can contribute to differences between estimates and
subsequent actual experience. In particular, actual values for key
economic and other variables can differ from assumed levels, and
legislative and regulatory changes may be adopted after a report‟s
preparation. Table III.C7 indicates that actual Part B benefit
payments were higher than estimated in the 2004 report and 2005
report, reflecting the higher-than-expected expenditures in 2004 and
2005. Actual premiums were nearly identical to those estimated in
the 2004 report. Actual government contributions, however, were
somewhat lower than estimated in the 2004 report because the fiscal
year 2005 appropriation for government contributions limited the
actual government contributions to an amount that was below what
was needed in fiscal year 2005, resulting in additional government
contributions in fiscal year 2006. Actual premium collections were
slightly higher than the estimates in the 2005 report. Government
contributions were nearly identical to the estimates in the 2005
report, which reflected the actual 2005 financing rates.
Table III.C7.—Comparison of Actual and Estimated Operations of the Part B Account in the SMI Trust Fund, Fiscal Year 2005
[Dollar amounts in millions]
Item Actual
amount
Comparison of actual experience with estimates for fiscal year 2005 published in:
2005 report 2004 report
Estimated amount
1
Actual as a percentage of estimate
Estimated amount
1
Actual as a percentage of estimate
Premiums from enrollees $35,940 $35,752 101% $35,901 100% Government contributions 114,002 114,002 100% 117,762 97% Benefit payments 148,623 147,514 101% 141,551 103% 1Under the intermediate assumptions.
(4) Assets
The portion of the Part B account that is not required to meet current
expenditures for benefits and administration is invested in interest-
bearing obligations of the U.S. Government.
The Social Security Act authorizes the issuance of special public-debt
obligations for purchase exclusively by the account. The law requires
that these special public-debt obligations shall bear interest, at a rate

Actuarial Analysis
88
based on the average market yield (computed on the basis of market
quotations as of the end of the calendar month immediately preceding
the date of such issue), on all marketable interest-bearing obligations
of the United States forming a part of the public debt that are not due
or callable until after 4 years from the end of that month. Since the
inception of the SMI trust fund, the assets have always been invested
in special public-debt obligations.29 Table V.F7, presented in
appendix F, shows the assets of the Part B account at the end of fiscal
years 2004 and 2005.
b. 10-Year Actuarial Estimates (2006-2015)
Future operations of the Part B account are projected using the
Trustees‟ economic and demographic assumptions, as detailed in the
OASDI Trustees Report, as well as other assumptions unique to
Part B. Section IV.B1 presents an explanation of the effects of these
assumptions, on the estimates in this report. It is also assumed that
financing for future periods will be determined according to the
statutory provisions described in section III.C2a, although Part B
financing rates have been set only through December 31, 2006. In
addition, for the benefit expenditure estimates, it is assumed that
current statutory provisions are maintained. It is important to note
that the Part B expenditures are substantially understated because
projected current-law physician payment updates are unrealistically
reduced under the sustainable growth rate system.
Table III.C8 shows the estimated operations of the Part B account
under the intermediate assumptions on a calendar-year basis through
2015.
29Investments may also be made in obligations guaranteed as to both principal and
interest by the United States, including certain federally sponsored agency obligations.

SMI Financial Status
89
Table III.C8.—Operations of the Part B Account in the SMI Trust Fund (Cash Basis) during Calendar Years 1970-2015
[In billions]
Calendar year
Income Expenditures Account
Premium income
General revenue
1
Interest and other
2,3 Total
Benefit payments
3,4
Adminis-trative
expenses Total Net
change
Balance at end
of year5
Historical data: 1970 $1.1 $1.1 $0.0 $2.2 $2.0 $0.2 $2.2 −$0.0 $0.2 1975 1.9 2.6 0.1 4.7 4.3 0.5 4.7 −0.1 1.4 1980 3.0 7.5 0.4 10.9 10.6 0.6 11.2 −0.4 4.5 1985 5.6 18.3 1.2 25.1 22.9 0.9 23.9 1.2 10.9 1990 11.3 33.0 1.6 45.9 42.5 1.5 44.0 1.9 15.5 1995 19.7 39.0 1.6 60.3 65.0 1.6 66.6 −6.3 13.1 1996 18.8 65.0 1.8 85.6 68.6 1.8 70.4 15.2 28.3 1997 19.3 60.2 2.5 81.9 72.8 1.4 74.1 7.8 36.1 1998 20.9
6 64.1
6 2.7 87.7 76.1
7 1.5 77.6 10.1 46.2
1999 19.0 6 59.1
6 2.8 80.9 80.7
7 1.6 82.3 −1.4 44.8
2000 20.6 65.9 3.4 89.9 88.9 7 1.8 90.7 −0.8 44.0
2001 22.8 72.8 3.1 98.6 99.7 7 1.7 101.4 −2.8 41.3
2002 25.1 78.3 2.8 106.2 111.0 7 2.2 113.2 −7.0 34.3
2003 27.4 86.4 2.0 115.8 123.8 7 2.3 126.1 −10.3 24.0
2004 31.4 100.4 1.5 133.3 135.0 2.9 137.9 −4.5 19.4 2005 37.5 118.1 1.4 157.0 149.2 3.2 152.4 4.6 24.0
Intermediate estimates: 2006 43.0 132.8 1.6 177.4 170.6 2.6 173.3 4.1 28.1 2007 49.0 147.8 2.3 199.1 178.1 2.7 181.6
8 17.5 45.6
2008 50.6 150.3 3.0 204.0 191.1 2.9 194.0 10.0 55.6 2009 56.8
6 167.9
6 3.6 228.4 204.6 3.0 207.6 20.8 76.4
2010 50.7 6 149.8
6 3.8 204.3 217.0 3.1 220.1 −15.8 60.6
2011 58.4 172.8 4.0 235.3 229.6 3.2 232.9 2.4 63.0 2012 62.3 184.2 4.2 250.7 244.6 3.4 248.0 2.7 65.7 2013 66.5 196.7 4.4 267.7 261.3 3.5 264.8 2.9 68.6 2014 70.7 209.4 4.6 284.7 278.4 3.6 282.0 2.7 71.3 2015 75.5 223.6 4.8 304.0 296.1 3.8 299.8 4.1 75.4
1General fund matching payments, plus certain interest-adjustment items.
2Other income includes recoveries of amounts reimbursed from the trust fund that are not obligations of
the trust fund and other miscellaneous income. 3See footnote 2 of table III.B4.
4Includes costs of Peer Review Organizations from 1983 through 2001, and costs of Quality
Improvement Organizations beginning in 2002. 5The financial status of Part B depends on both the assets and the liabilities of the trust fund (see
table III.C12). 6Section 708 of the Social Security Act modifies the provisions for the delivery of Social Security benefit
checks when the regularly designated day falls on a Saturday, Sunday, or legal public holiday. Delivery of benefit checks normally due January 3, 1999 occurred on December 31, 1998. Consequently, the Part B premiums withheld from the checks ($1.5 billion) and the associated general revenue contributions ($4.7 billion) were added to the SMI trust fund on December 31, 1998. These amounts are excluded from the premium income and general revenue income for 1999. January 3, 2010 will fall on a Sunday, and therefore the delivery of the Social Security checks is expected to occur on December 31, 2009. 7Benefit payments less monies transferred from the HI trust fund for home health agency costs, as
provided for by the Balanced Budget Act of 1997. 8See footnote 9 of table III.C1.
Note: Totals do not necessarily equal the sums of rounded components.
As shown in table III.C8, the account is estimated to increase during
2006 to an estimated $28.1 billion by the end of the year. The
beneficiary premiums and actuarial rates for calendar year 2006 were
promulgated with specific margins to increase the size of the Part B

Actuarial Analysis
90
account. However, actual program expenditures for calendar year
2005 were higher than expected, producing a higher projection base
for estimating 2006 expenditures. In addition, legislation raised the
physician payment update to 0.2 percent for 2006 after the financing
rates had been determined for 2006.30 (In the absence of this
legislation, the update would have been −4.4 percent.) The legislation
and higher projection base result in a smaller-than-targeted projected
increase in the account in 2006.
Actual deficits in the Part B account in 2003 and 2004 drew account
assets to a level that is well below the range preferred for contingency
purposes. As a result, beneficiary premiums and matching general
revenue financing were increased substantially for 2005 and 2006.
The estimated expenditures shown in table III.C8 are substantially
understated beginning in 2007 as a result of the current-law negative
physician payment updates for 2007 through at least 2015. For 2007,
the projections are based on a 12-percent increase in income and an
assumed physician payment update of −4.7 percent, as would be
required under current law. Accordingly, the account is then
projected to increase to $45.6 billion by the end of 2007, with the
inclusion of financing margins to restore contingency reserves to the
preferred level. After 2007, the financing margins are set in such a
way that the account assets will increase with the estimated
expenditures plus a margin, so that the preferred contingency level
would be maintained. If legislation is again enacted to prevent a
reduction in physician fees and is done so after the Part B financing
is established for 2007—as has happened for 3 of the last 4 years—
then the increase in assets would be much smaller, and the reserve
adequacy would remain far below the appropriate level.
The statutory provisions governing Part B financing have changed
over time. Most recently, the Balanced Budget Act of 1997 provided
for the permanent establishment of the Part B premium at the level
of about 25 percent of aged expenditures. Figure III.C3 shows
historical and projected ratios of premium income to Part B
expenditures.
30The Deficit Reduction Act froze the conversion factor for 2006. Changes in relative
value units (RVUs), which increased the average RVU by about 0.2 percent, result in a
physician fee schedule update of 0.2 percent for 2006.
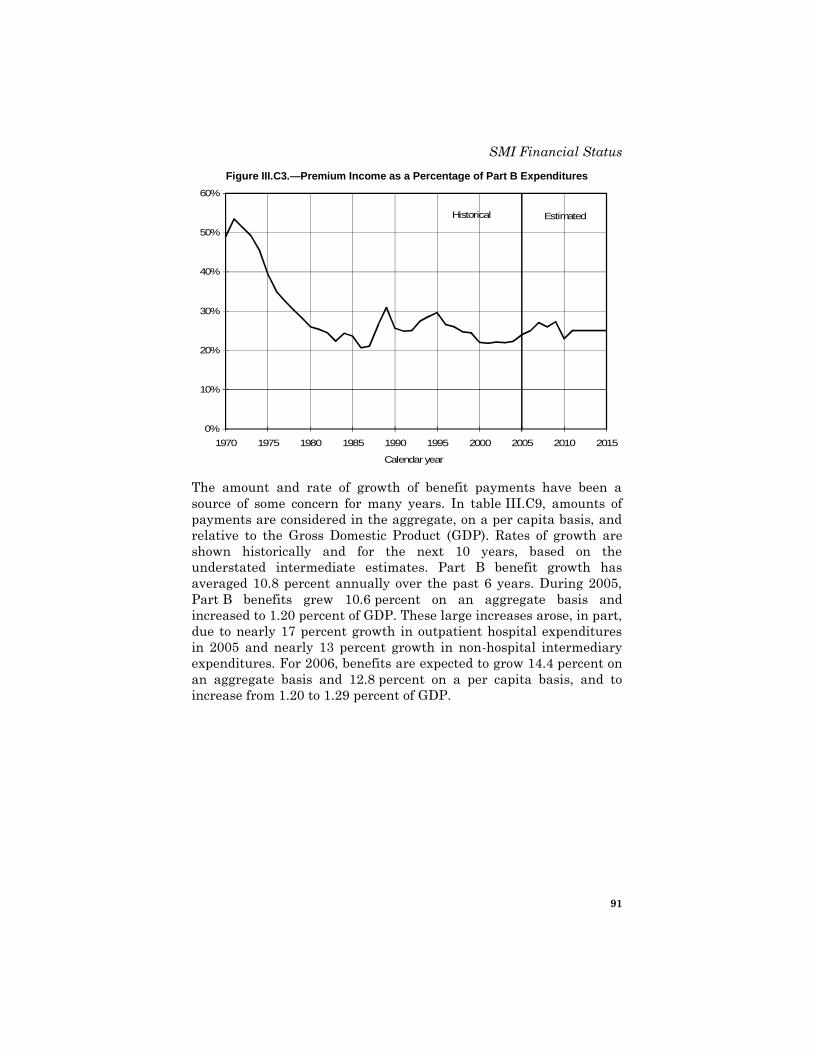
SMI Financial Status
91
Figure III.C3.—Premium Income as a Percentage of Part B Expenditures
0%
10%
20%
30%
40%
50%
60%
1970 1975 1980 1985 1990 1995 2000 2005 2010 2015
Calendar year
Historical Estimated
The amount and rate of growth of benefit payments have been a
source of some concern for many years. In table III.C9, amounts of
payments are considered in the aggregate, on a per capita basis, and
relative to the Gross Domestic Product (GDP). Rates of growth are
shown historically and for the next 10 years, based on the
understated intermediate estimates. Part B benefit growth has
averaged 10.8 percent annually over the past 6 years. During 2005,
Part B benefits grew 10.6 percent on an aggregate basis and
increased to 1.20 percent of GDP. These large increases arose, in part,
due to nearly 17 percent growth in outpatient hospital expenditures
in 2005 and nearly 13 percent growth in non-hospital intermediary
expenditures. For 2006, benefits are expected to grow 14.4 percent on
an aggregate basis and 12.8 percent on a per capita basis, and to
increase from 1.20 to 1.29 percent of GDP.

Actuarial Analysis
92
Table III.C9.—Growth in Part B Benefits (Cash Basis) through December 31, 2015
Calendar year Aggregate benefits
[billions] Percent change
Per capita benefits
Percent change
Part B benefits as a percentage of GDP
Historical data: 1970 $2.0 5.9 $101 3.5 0.19 1975 4.3 28.8 180 24.6 0.26 1980 10.6 22.1 390 19.3 0.38 1985 22.9 16.7 768 14.5 0.54 1990 42.5 10.9 1,304 9.1 0.73 1995 65.0 10.8 1,823 9.2 0.88 1996 68.6 5.6 1,900 4.2 0.88 1997 72.8 6.1 1,996 5.1 0.88 1998 76.1
1 4.6 2,071 3.7 0.87
1999 80.7 1 6.0 2,180 5.3 0.87
2000 88.9 1 10.1 2,381 9.2 0.91
2001 99.7 1 12.1 2,646 11.1 0.98
2002 111.0 1 11.3 2,922 10.4 1.06
2003 123.8 1 11.6 3,209 9.8 1.13
2004 135.0 9.0 3,452 7.6 1.15 2005 149.2 10.6 3,768 9.2 1.20
Intermediate estimates: 2006 170.6 14.4 4,252 12.8 1.29 2007 178.1 4.4 4,372 2.8 1.28 2008 191.1 7.3 4,608 5.4 1.31 2009 204.6 7.1 4,842 5.1 1.33 2010 217.0 6.0 5,044 4.2 1.34 2011 229.6 5.8 5,232 3.7 1.36 2012 244.6 6.5 5,424 3.7 1.38 2013 261.3 6.8 5,626 3.7 1.41 2014 278.4 6.5 5,833 3.7 1.44 2015 296.1 6.4 6,037 3.5 1.46
1See footnote 7 of table III.C8.
The projected growth in Part B benefits slows dramatically during
the next 10 years under current law. This is principally because the
physician fee schedule payment updates are determined based on the
sustainable growth rate system (SGR). The SGR requires that future
physician payment increases be adjusted for past actual physician
spending relative to a target spending level. The cumulative
implications of past physician spending being over the target levels,
exacerbated by the physician updates legislated in the Medicare
Modernization Act and the Deficit Reduction Act (for which no
corresponding increase in target spending was allowed), yield
projected physician payment updates of about −5 percent annually for
at least 9 consecutive years, beginning in 2007. Multiple years of
significant reductions in physician payments per service are very
unlikely to occur before legislative changes intervene, but these
payment reductions are required under the current-law SGR system
and are included in the physician fee schedule projections.
Consequently, the current-law Part B projections shown in this report
are expected to substantially understate actual future expenditures
in 2007 and later.

SMI Financial Status
93
Reflecting the recent actual experience and the impact of the DRA,
the estimated Part B costs shown in this annual report are higher
than those in the 2005 annual report. The costs are projected to be
higher throughout the entire 10-year period. Despite the statutory
reductions to physician payments, Part B costs in the 2006 annual
report are expected to continue increasing faster than GDP, as
indicated in table III.C9.
Since future economic, demographic, and health care usage and cost
experience may vary considerably from the intermediate assumptions
on which the preceding cost estimates were based, estimates have
also been prepared using two alternative sets of assumptions: low
cost and high cost. The estimated operations of the Part B account for
all three alternatives are summarized in table III.C10. The
assumptions underlying the intermediate assumptions are presented
in substantial detail in section IV.B1. The assumptions used in
preparing estimates under the low cost and high cost alternatives are
also summarized in that section.

Actuarial Analysis
94
Table III.C10.—Estimated Operations of the Part B Account in the SMI Trust Fund during Calendar Years 2005-2015, under Alternative Sets of Assumptions
[Dollar amounts in billions]
Calendar year
Premiums from enrollees Other income
1 Total income
Total expenditures
Balance in fund at end of year
Intermediate: 2005
2 $37.5 $119.5 $157.0 $152.4 $24.0
2006 43.0 134.4 177.4 173.3 28.1 2007 49.0 150.0 199.1 181.6
3 45.6
2008 50.6 153.4 204.0 194.0 55.6 2009 56.8
4 171.5
4 228.4 207.6 76.4
2010 50.7 4 153.6
4 204.3 220.1 60.6
2011 58.4 176.9 235.3 232.9 63.0 2012 62.3 188.4 250.7 248.0 65.7 2013 66.5 201.1 267.7 264.8 68.6 2014 70.7 214.0 284.7 282.0 71.3 2015 75.5 228.4 304.0 299.8 75.4
Low cost: 2005
2 $37.5 $119.5 $157.0 $152.4 $24.0
2006 43.0 134.5 177.4 170.2 31.2 2007 46.1 140.8 186.8 174.6
3 43.5
2008 47.5 143.7 191.2 182.3 52.4 2009 49.0
4 147.1
4 196.1 190.6 57.9
2010 49.9 4 150.6
4 200.4 197.4 60.9
2011 51.2 155.1 206.4 204.3 62.9 2012 53.4 161.7 215.1 213.0 65.0 2013 55.8 169.1 224.9 222.6 67.3 2014 58.0 175.9 233.9 231.9 69.4 2015 60.5 183.3 243.8 240.7 72.4
High cost: 2005
2 $37.5 $119.5 $157.0 $152.4 $24.0
2006 43.0 134.3 177.3 176.6 24.6 2007 52.2 159.5 211.7 188.7
3 47.6
2008 53.8 163.1 216.9 206.1 58.5 2009 56.1
4 169.9
4 226.0 223.0 61.4
2010 61.7 4 187.1
4 248.8 245.7 64.5
2011 69.0 209.2 278.2 275.0 67.7 2012 76.3 230.9 307.2 303.5 71.5 2013 84.1 254.0 338.2 332.6 77.0 2014 91.9 277.6 369.5 363.7 82.8 2015 100.6 304.0 404.7 396.7 90.8 1Other income contains government contributions and interest.
2Figures for 2005 represent actual experience.
3See footnote 9 of table III.C1.
4See footnote 6 of table III.C8.
Note: Totals do not necessarily equal the sums of rounded components.
The three sets of assumptions were selected in order to indicate the
general range in which the cost might reasonably be expected to fall.
The low and high cost alternatives provide for a fairly wide range of
possible experience. Actual experience is expected to fall within the
range, but no assurance can be given that this will be the case,
particularly in light of the wide variations in experience that have
occurred since Part B began. In addition to the alternative projections
shown here, a supplementary assessment of the possible range of
Part B expenditures is shown in section V.D, based on a statistical
analysis of past variation in Part B expenditure growth rates.

SMI Financial Status
95
Part B expenditures are estimated to grow significantly faster than
GDP under the intermediate and high cost assumptions. Based on the
low cost assumptions, expenditures would increase more slowly than
GDP in 2007 through 2015.
The alternative projections shown in table III.C10 illustrate two
important aspects of the financial operations of the Part B account:
• Despite the widely differing assumptions underlying the three
alternatives, the balance between Part B income and expenditures
remains relatively stable. Under the low cost assumptions, for
example, by 2015 both income and expenditures would be around
20 percent lower than projected under the intermediate
assumptions. The corresponding amounts under the high cost
assumptions would be around 33 percent higher than the
intermediate estimates.
This result occurs because the premiums and general revenue
contributions underlying Part B financing are reestablished
annually to match each year‟s anticipated incurred benefit costs
and other expenditures. Thus, Part B income will automatically
track Part B expenditures fairly closely, regardless of the specific
economic and other conditions.
• As a result of the close matching of income and expenditures
described above, projected account assets show stable patterns of
change under all three sets of assumptions. The annual adjustment
of premiums and general revenue contributions permits the
maintenance of a Part B account balance that, while relatively
small, is sufficient to guard against chance fluctuations.
It should be noted, however, that continued enactment of
legislation to prevent a reduction in physician fees, after financing
for a year has been set, jeopardizes the adequacy of Part B assets.
Such legislative actions in recent years have contributed to a
substantial decline in Part B assets, which, minus corresponding
liabilities, are now at their lowest level relative to annual
expenditures in nearly 30 years. Efforts to restore assets to a more
appropriate level have required premium and general revenue
increases of 13.4 percent, 17.4 percent, and 13.2 percent in 2004
through 2006, respectively, with only minimal progress made in
increasing asset adequacy.

Actuarial Analysis
96
Adequacy of Part B Financing Established for Calendar Year 2006
The traditional concept of financial adequacy, as it applies to Part B,
is closely related to the concept as it applies to many private group
insurance plans. Part B is somewhat similar to yearly renewable
term insurance, with financing from premium income paid by the
enrollees and from income contributed from general revenue by the
Federal Government. Consequently, the income during a 12-month
period for which financing is being established should be sufficient to
cover the costs of services expected to be rendered during that period
(including associated administrative costs), even though payment for
some of these services will not be made until after the period closes.
The portion of income required to cover those benefits not paid until
after the end of the year is added to the account. Thus, the assets that
are in the account at any time should be no less than the costs of the
benefits and the administrative expenses incurred but not yet paid.
Since the income per enrollee (premium plus government
contribution) is established prospectively each year, it is subject to
projection error. Additionally, legislation enacted after the financing
has been established, but effective for the period for which financing
has been set, may affect costs. Account assets, therefore, should be
maintained at a level that is adequate to cover not only the value of
incurred but unpaid expenses but also a reasonable degree of
variation between actual and projected costs (in case actual costs
exceed projected).
The actuarial status or financial adequacy of the Part B account is
traditionally evaluated over the period for which the enrollee
premium rates and level of general revenue financing have been
established. The primary tests are that (i) the assets and income for
years for which financing has been established should be sufficient to
meet the projected benefits and associated administrative expenses
incurred for that period; and (ii) the assets should be sufficient to
cover projected liabilities that have not yet been paid as of the end of
the period. If these adequacy tests are not met, Part B can still
continue to operate if the account remains at a level adequate to
permit the payment of claims as presented. However, to protect
against the possibility that costs will be higher than assumed, assets
should be sufficient to include contingency levels that cover a
reasonable degree of variation between actual and projected costs.

SMI Financial Status
97
The traditional tests of asset adequacy described above have been
augmented by a supplementary assessment of uncertainty using
statistical methods, as shown in section V.D of this report.
As noted above, the tests of financial adequacy for Part B rely on the
incurred experience of the account, including a liability for the costs
of services performed in a year but not yet paid. Table III.C11 shows
the estimated transactions of the account on an incurred basis. The
incurred experience must be viewed as an estimate, even for
historical years.31
Table III.C11.—Estimated Part B Income and Expenditures (Incurred Basis) for Financing Periods through December 31, 2006
[In millions]
Financing period
Income Expenditures
Net operations
in year Premium income
General revenue
Interest and other Total
Benefit payments
Adminis-trative
expenses Total
Historical data:
12-month period ending June 30, 1970 $936 $936 $12 $1,884 $1,928 $213 $2,141 −$257 1975 1,887 2,396 105 4,388 3,957 438 4,395 −7 1980 2,823 6,627 421 9,871 9,840 645 10,485 −614
Calendar year 1985 5,613 18,243 1,248 25,104 22,750 986 23,736 1,368 1990 11,320 33,035 1,558 45,913 42,578 1,541 44,119 1,794 1995 19,717 45,743 1,739 67,199 64,918 1,607 66,525 674 1996 18,763 58,068 1,885 78,716 68,762 1,807 70,569 8,147 1997 19,289 60,169 2,466 81,924 72,726 1,367 74,093 7,831 1998 19,421 59,357 2,711 81,489 77,239
1 1,438 78,677 2,812
1999 20,479 63,806 2,841 87,126 81,506 1 1,603 83,109 4,017
2000 20,555 65,898 3,450 89,903 89,757 1 1,770 91,526 −1,623
2001 22,764 72,793 3,071 98,629 100,286 1 2,008 102,294 −3,665
2002 25,066 78,338 2,792 106,196 112,223 1 2,196 114,419 −8,223
2003 27,402 86,402 1,992 115,796 122,094 1 2,318 124,412 −8,616
2004 31,435 100,418 1,495 133,347 137,755 2,893 141,410 2 −8,063
2005 37,535 118,091 1,365 156,992 153,128 3,185 156,313 679
Intermediate estimates: 2006 42,987 132,771 1,649 177,407 169,368 2,626 171,994 5,413
1See footnote 7 of table III.C8.
2See footnote 9 of table III.C1.
The liability outstanding at any time, for the cost of services
performed for which no payment has been made, is referred to as
“benefits incurred but unpaid.” Estimates of the amount of benefits
incurred but unpaid as of the end of each financing period, and of the
administrative expenses related to processing these benefits, appear
31Part B experience is substantially more difficult to determine on an incurred basis
than on a cash basis. Payment for some services is reported only on a cash basis, and
the incurred experience must be inferred from the cash payment information.
Moreover, for recent time periods, the tabulations of bills are incomplete due to normal
processing delays.

Actuarial Analysis
98
in table III.C12. In some years, account assets have not been as large
as liabilities. Nonetheless, the fund has remained positive, allowing
claims to be paid.
Table III.C12.—Summary of Estimated Part B Assets and Liabilities as of the End of the Financing Period, for Periods through December 31, 2006
[Dollar amounts in millions]
Balance in trust fund
General revenue due but unpaid
Total assets
Benefits incurred
but unpaid
Administrative costs incurred
but unpaid Total
liabilities
Excess of assets over
liabilities Ratio1
Historical data:
As of June 30, 1970 $57 $15 $72 $567 — $567 −$495 −0.21 1975 1,424 67 1,491 1,257 $14 1,271 — 0.04 1980 4,657 — 4,657 2,621 188 2,809 1,848 0.15
As of December 31, 1985 10,924 — 10,924 3,142 −38 3,104 7,820 0.28 1990 15,482 — 15,482 4,060 20 4,080 11,402 0.24 1995 20,023 6,893 26,916 4,282 −214 4,068 22,847 0.23 1996 28,331 — 28,331 4,446 −217 4,230 24,102 0.33 1997 36,131 — 36,131 4,416 −217 4,199 31,933 0.41 1998 46,212 — 46,212 5,531 −285 5,246 40,966 0.42 1999 44,787 — 44,787 6,312 −285 6,028 38,760 0.42 2000 44,027 — 44,027 7,176 −285 6,891 37,136 0.36 2001 41,889 620 42,509 7,799 — 7,799 34,711 0.30 2002 34,301 — 34,301 9,053 — 9,053 25,248 0.20 2003 23,953 — 23,953 7,322 — 7,322 16,631 0.12 2004 19,430 — 19,430 9,337 — 10,099 9,331 0.06 2005 24,008 — 24,008 13,237 — 13,999 10,009 0.06
Intermediate estimates: 2006 28,144 — 28,144 11,959 — 12,721 15,423 0.09
1Ratio of the excess of assets over liabilities to the following year’s total incurred expenditures.
2This amount includes both the principal of $6,736 million and the accumulated interest through
December 31, 1995 for the shortfall in the fiscal year 1995 appropriation for government contributions. Normally, this transfer would have been made on December 31, 1995 and, therefore, would have been reflected in the trust fund balance. However, due to absence of funding, the transfer of the principal and the appropriate interest was delayed until March 1, 1996. 3Section 708 of the Social Security Act modifies the provisions for the delivery of Social Security benefit
checks when the regularly designated day falls on a Saturday, Sunday, or legal public holiday. Delivery of benefit checks normally due January 3, 1999 occurred on December 31, 1998. Consequently, the SMI premiums withheld from the checks ($1,512 million) and the general revenue matching contributions ($4,711 million) were added to the SMI trust fund on December 31, 1998 and were included in the liabilities. 4See footnote 2 of table III.C11.
The amount of assets minus liabilities can be compared with the
estimated incurred expenditures for the following calendar year to
form a relative measure of the Part B account‟s financial status. The
last column in table III.C12 shows such ratios for past years and the
estimated ratio at the end of 2006. Past studies have indicated that a
ratio of roughly 15-20 percent is sufficient to protect against
unforeseen contingencies, such as unusually large increases in Part B
expenditures. At the end of 2005, the Part B reserve ratio was
6 percent, or significantly below normal requirements.

SMI Financial Status
99
Part B financing has been established through December 31, 2006.
The financing for calendar year 2006 was designed with specific
margins to increase the excess of assets over liabilities as a
percentage of incurred expenditures for the following year. However,
actual program expenditures for 2005 were higher than expected,
producing a higher projection base for estimating 2006 expenditures.
In addition, the Deficit Reduction Act (DRA) increased physician
payments for 2006 after the financing had been determined. The
effects of the DRA, together with the higher projection base, result in
estimated 2006 incurred expenditures that are higher than expected
when the financing was set. As a result, the calendar year 2006
incurred income is expected to exceed incurred expenditures by
$5,413 million, as shown in table III.C11, and the excess of assets
over liabilities is expected to increase from $10,009 million at the end
of December 2005 to $15,423 million at the end of December 2006,
under the intermediate assumptions, as indicated in table III.C12.
This excess as a percentage of incurred expenditures for the following
year is expected to increase slightly from 5.8 percent as of
December 31, 2005 to 8.5 percent as of December 31, 2006. Thus, the
higher-than-anticipated expenditures are expected to again limit
progress in restoring the net asset ratio to the preferred range.
Since the financing rates are set prospectively, the actuarial status of
the Part B account could be affected by variations between assumed
cost increases and subsequent actual experiences. To test the status
of the account under varying assumptions, a lower growth range
projection and an upper growth range projection were prepared by
varying the key assumptions through the period for which the
financing has been set. These two alternative sets of assumptions
provide a range of financial outcomes within which the actual
experience of Part B might reasonably be expected to fall. The values
for the lower and upper growth range assumptions were determined
from a statistical analysis of the historical variation in the respective
increase factors. Section V.D of this report describes the statistical
methodology in more detail and also extends the analysis through
2015.
This sensitivity analysis differs from the low cost and high cost
projections discussed previously in this section in that this analysis
examines the variation in the projection factors in the period for
which the financing has been established (2006 for this report). The
low cost and high cost projections, on the other hand, illustrate the
financial impact of slower or faster growth trends throughout the
short-range projection period.

Actuarial Analysis
100
Table III.C13 indicates that, under the lower growth range scenario,
account assets would exceed liabilities at the end of December 2006
by a margin equivalent to 14.2 percent of the following year‟s
incurred expenditures. Under the upper growth range scenario,
account assets would still exceed liabilities by the end of
December 2006, but only by a narrow margin of 3.4 percent of the
following year‟s incurred expenditures. Therefore, under either
scenario, assets would be sufficient to cover outstanding liabilities.
However, if the higher growth range scenario were actually to
materialize, then subsequent financing rates would have to be
adjusted upward to an even greater degree than already anticipated
to increase the excess of assets over liabilities in order to maintain an
appropriate contingency level in the account. Figure III.C4 shows this
ratio for historical years and for projected years under the
intermediate scenario, as well as under the lower growth range
(optimistic) and the upper growth range (pessimistic) cost sensitivity
scenarios.
Table III.C13.—Actuarial Status of the Part B Account in the SMI Trust Fund under Three Cost Sensitivity Scenarios for Financing Periods through December 31, 2006
As of December 31, 2004 2005 2006
Intermediate scenario: Actuarial status (in millions) Assets $19,430 $24,008 $28,144 Liabilities 10,099 13,999 12,721
Assets less liabilities 9,331 10,009 15,423
Ratio1 6.0 % 5.8 % 8.5 %
Low range scenario: Actuarial status (in millions) Assets $19,430 $24,008 $35,029 Liabilities 10,099 13,999 11,549
Assets less liabilities 9,331 10,009 23,480
Ratio1 6.1 % 6.2 % 14.2 %
Upper range scenario: Actuarial status (in millions) Assets $19,430 $24,008 $20,772 Liabilities 10,099 13,999 13,939
Assets less liabilities 9,331 10,009 6,833
Ratio1 5.8 % 5.4 % 3.4 %
1Ratio of assets less liabilities at the end of the year to the total incurred expenditures during the
following year, expressed as a percent.

SMI Financial Status
101
Figure III.C4.—Actuarial Status of the SMI Trust Fund through Calendar Year 2005
0%
5%
10%
15%
20%
25%
30%
35%
40%
45%
50%
1975 1980 1985 1990 1995 2000 2005 2010 2015
End of calendar year
Historical Estimated
Intermediate
Upper growthrange
Lower growthrange
Note: The actuarial status of the SMI trust fund is measured by the ratio of (i) assets minus liabilities at the end of the year to; (ii) the following year’s incurred expenditures.
Based on the tests described above, the Trustees conclude that while
the financing established for the Part B account for calendar year
2006 is adequate to cover 2006 expected expenditures, the financial
status of the Part B account in 2006 is still minimally satisfactory.
Thus, the Part B financing rates for 2007 will have to be increased
significantly—for the fourth year in a row—in an effort to return to
an adequate contingency reserve.
c. 75-Year Actuarial Estimates (2006-2080)
In section III.C2b, the expected operations of the Part B account over
the next 10 years were presented. In this section, the long-range
expenditures of the account are examined under the intermediate
assumptions. Because of its automatic financing provisions, the
Part B account is expected to be adequately financed into the
indefinite future, so a long-range analysis using high cost and low
cost assumptions is not conducted.
Table III.C14 shows the estimated Part B incurred expenditures
under the intermediate assumptions expressed as a percentage of
GDP, for selected years over the calendar-year period 2005-2080.32
32These estimated incurred expenditures are for benefit payments and administrative
expenses combined, unlike the values in table III.C9, which express only benefit
payments on a cash basis as a percentage of GDP.
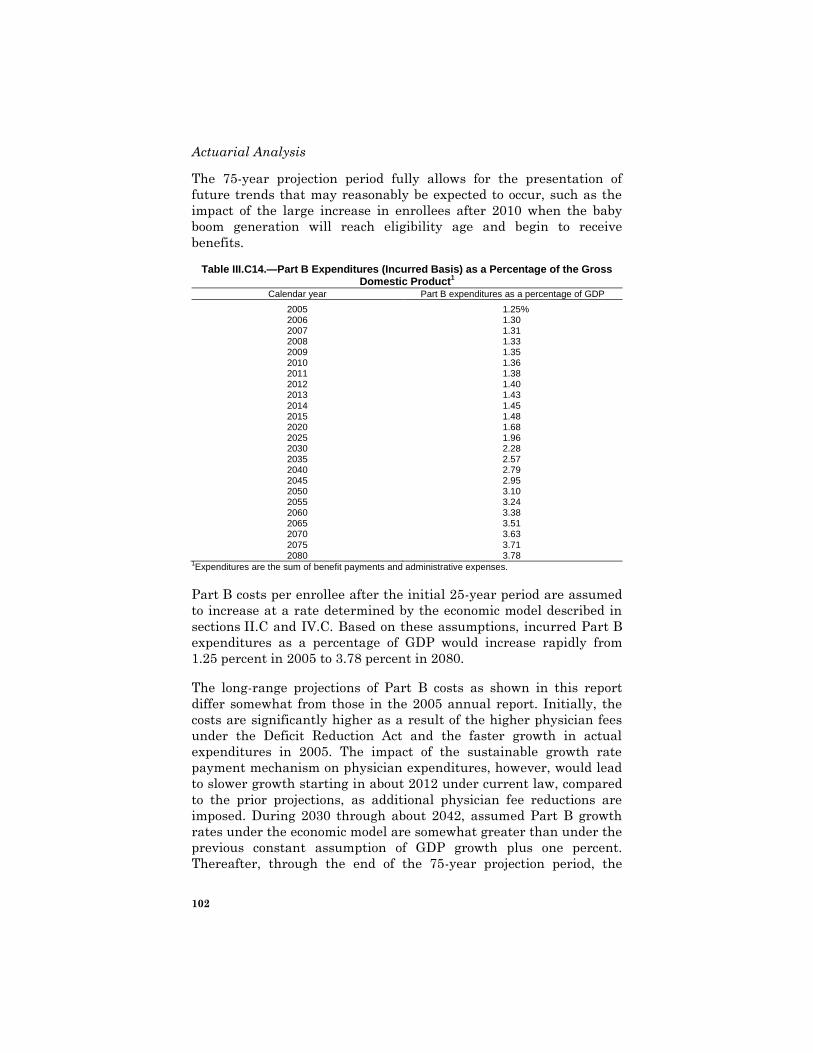
Actuarial Analysis
102
The 75-year projection period fully allows for the presentation of
future trends that may reasonably be expected to occur, such as the
impact of the large increase in enrollees after 2010 when the baby
boom generation will reach eligibility age and begin to receive
benefits.
Table III.C14.—Part B Expenditures (Incurred Basis) as a Percentage of the Gross Domestic Product
1
Calendar year Part B expenditures as a percentage of GDP
2005 1.25 % 2006 1.30 2007 1.31 2008 1.33 2009 1.35 2010 1.36 2011 1.38 2012 1.40 2013 1.43 2014 1.45 2015 1.48 2020 1.68 2025 1.96 2030 2.28 2035 2.57 2040 2.79 2045 2.95 2050 3.10 2055 3.24 2060 3.38 2065 3.51 2070 3.63 2075 3.71 2080 3.78
1Expenditures are the sum of benefit payments and administrative expenses.
Part B costs per enrollee after the initial 25-year period are assumed
to increase at a rate determined by the economic model described in
sections II.C and IV.C. Based on these assumptions, incurred Part B
expenditures as a percentage of GDP would increase rapidly from
1.25 percent in 2005 to 3.78 percent in 2080.
The long-range projections of Part B costs as shown in this report
differ somewhat from those in the 2005 annual report. Initially, the
costs are significantly higher as a result of the higher physician fees
under the Deficit Reduction Act and the faster growth in actual
expenditures in 2005. The impact of the sustainable growth rate
payment mechanism on physician expenditures, however, would lead
to slower growth starting in about 2012 under current law, compared
to the prior projections, as additional physician fee reductions are
imposed. During 2030 through about 2042, assumed Part B growth
rates under the economic model are somewhat greater than under the
previous constant assumption of GDP growth plus one percent.
Thereafter, through the end of the 75-year projection period, the

SMI Financial Status
103
growth assumptions are somewhat lower than before. At the end of
the period, the projected Part B cost as a percentage of the GDP is
significantly lower than estimated in last year‟s report.
This report focuses on the 75-year period from 2006 to 2080 for the
evaluation of the long-run financial status of Part B on an open-group
basis (i.e., including past, current, and future participants).
Table III.C15 shows that because of the automatic financing of
Part B, there is no unfunded obligation.
In section III.B of this report, an extended projection of HI revenues
and expenditures was presented, beyond the normal 75-year
projection period, to highlight the continuing financial imbalance over
an infinite horizon.
Tables III.C15 and III.C16 present corresponding estimates for
Part B that extend to the infinite horizon. The extension assumes no
change to current law, and the demographic and economic trends
used for the 75-year projection continue indefinitely except that
average Part B expenditures per beneficiary are assumed to increase
at the same rate as GDP per capita beginning in about 2080.
Table III.C15 shows an estimated present value of Part B
expenditures through the infinite horizon of $35.2 trillion, of which
$17.6 trillion would occur during the first 75 years. Because such
amounts, calculated over extremely long-time horizons, can be
difficult to interpret, they are also shown as percentages of the
present value of future GDP. So expressed, the corresponding figures
are 3.1 percent and 2.5 percent of GDP, respectively. The table also
indicates that approximately 25 percent of expenditures for each time
period would be financed through beneficiary premiums, with the
remaining 75 percent paid by general revenues, as mandated by
current law.

Actuarial Analysis
104
Table III.C15.—Unfunded Part B Obligations from Program Inception through the Infinite Horizon
[Present values as of January 1, 2006; dollar amounts in trillions]
Present value
As a percentage
of GDP
Unfunded obligations through the infinite horizon1 $0.0 0.0%
Expenditures 35.2 3.1% Income 35.2 3.1%
Beneficiary premiums 9.0 0.8% General revenue contributions 26.2 2.3%
Unfunded obligations from program inception through 20801 0.0 0.0%
Expenditures 17.6 2.5% Income 17.6 2.5%
Beneficiary premiums 4.5 0.6% General revenue contributions 13.1 1.9%
1Present value of future expenditures less income, reduced by the amount of trust fund assets at the
beginning of the period.
Notes: 1. The present values of GDP for 2006-2080 and for 2006 through the infinite horizon are $707.0 trillion and $1,120.2 trillion, respectively.
2. Totals do not necessarily equal the sums of rounded components.
Table III.C16 shows corresponding projections separately for current
versus future beneficiaries. As indicated, about 40 percent of the
total, infinite-horizon cost is associated with current beneficiaries,
with the remaining 60 percent attributable to beneficiaries becoming
eligible for Part B benefits after January 1, 2006.

SMI Financial Status
105
Table III.C16.—Unfunded Part B Obligations for Current and Future Program Participants through the Infinite Horizon
[Present values as of January 1, 2006; dollar amounts in trillions]
Present value
As a percentage
of GDP
Future expenditures less income for current participants ......................................... $0.2 0.0% Expenditures ......................................................................................................... 14.2 1.3% Income ................................................................................................................... 14.1 1.3%
Beneficiary premiums ........................................................................................ 3.6 0.3% General revenue contributions .......................................................................... 10.5 0.9%
Less current trust fund (income minus expenditures to date for past and current participants)................ 0.0 0.0%
Equals unfunded obligations for past and current participants1 ............................... 0.2 0.0%
Expenditures ......................................................................................................... 14.2 1.3% Income ................................................................................................................... 14.1 1.3%
Beneficiary premiums ........................................................................................ 3.6 0.3% General revenue contributions .......................................................................... 10.5 0.9%
Plus expenditures less income for future participants for the infinite horizon .......... -0.2 0.0% Expenditures ......................................................................................................... 21.0 1.9% Income ................................................................................................................... 21.1 1.9%
Beneficiary premiums ........................................................................................ 5.4 0.5% General revenue contributions .......................................................................... 15.7 1.4%
Equals unfunded obligations for all participants for the infinite future ...................... 0.0 0.0% Expenditures ......................................................................................................... 35.2 3.1% Income ................................................................................................................... 35.2 3.1%
Beneficiary premiums ........................................................................................ 9.0 0.8% General revenue contributions .......................................................................... 26.2 2.3%
1This concept is also referred to as the closed-group unfunded obligation.
Notes: 1. The estimated present value of GDP for 2006 through the infinite horizon is $1,120.2 trillion. 2. Totals do not necessarily equal the sums of rounded components.
3. Part D Account
The Medicare Modernization Act, enacted on December 8, 2003,
established within SMI two Part D accounts related to prescription
drug benefits: the Medicare Prescription Drug Account and the
Transitional Assistance Account. The Medicare Prescription Drug
Account will be used in conjunction with the broad, voluntary
prescription drug benefits that commenced in 2006. The Transitional
Assistance Account was used to provide transitional assistance
benefits, beginning in 2004 and extending through 2005, for certain
low-income beneficiaries prior to the start of the new prescription
drug benefit. Any assets remaining in the transitional account after
2006 will be credited to the Medicare Prescription Drug Account. For
simplicity, in this report both accounts are combined and referred to
as the “Part D account.”
The nature of the new Medicare prescription drug benefit is
significantly different from the usual HI and SMI Part B fee-for-
service benefits. In particular, beneficiaries obtain the drug benefit by

Actuarial Analysis
106
voluntarily purchasing insurance policies from private stand-alone
drug plans or through private Medicare Advantage health plans. The
premiums established by these plans are heavily subsidized by
Medicare. In addition, Medicare pays some or all of the remaining
beneficiary drug premiums and cost-sharing liabilities for low-income
beneficiaries. Medicare also pays special subsidies on behalf of
beneficiaries retaining primary drug coverage through qualifying
employer-sponsored retiree health plans. Collectively, the various
Medicare drug subsidies are financed primarily by general revenues.
In addition, a declining portion of the subsidy costs associated with
beneficiaries who also qualify for full Medicaid benefits are financed
through special payments from State governments. Beneficiaries may
have their drug insurance premiums withheld from their Social
Security benefits, if they wish, and then forwarded to the drug plans
on their behalf.
a. Financial Operations in Fiscal Year 2005
During fiscal year 2005, total expenditures were $1,195 million for
the Transitional Assistance Account. Revenue was provided on an as-
needed basis to cover these expenditures and therefore also amounted
to $1,195 million. As a result, total assets in this account remain at
$0.
b. 10-Year Actuarial Estimates (2006-2015)
Future operations of the Part D accounts are projected using the
Trustees‟ economic and demographic assumptions, as detailed in the
OASDI Trustees Report, as well as other assumptions unique to
Part D. Section IV.B2 presents an explanation of the effects of the
Trustees‟ intermediate assumptions, and of the other assumptions
unique to Part D, on the estimates in this report.
Generally, the income to the Medicare Prescription Drug Account will
include the beneficiary premiums described above and transfers from
the general fund of the Treasury that will be established annually to
match each year‟s anticipated incurred benefit costs and other
expenditures. The transfer from the Treasury will be based on the
calculated direct premium subsidy rate and the anticipated levels of
reinsurance payments, employer subsidies, low-income subsidies, net
risk-sharing payments, administrative expenses, and an amount
necessary to maintain an appropriate contingency margin (if any).
The beneficiary premiums and direct subsidy rate will be calculated
based on the national average bid amounts and will be defined prior
to the annual appropriation, with the average premium amounting to

SMI Financial Status
107
25.5 percent of the expected total plan costs for basic coverage. The
appropriation language adopted for fiscal year 2006 provides
resources for benefit payments under the Part D drug benefit
program, without further Congressional action, in the event that the
annual appropriation is insufficient. As a result of this authority,
which is expected to continue for future years, we do not anticipate
the need for a contingency margin.
Expenditures from the account will include the premiums withheld
from beneficiaries‟ Social Security or other Federal payments and
transferred to the private drug plans, the direct subsidy payments,
reinsurance payments, employer subsidy amounts, low-income
subsidy payments, risk-sharing payments, and administrative
expenses.
Table III.C17 shows the estimated operations of the Part D accounts under the intermediate assumptions on a calendar-year basis through 2015.

Actuarial Analysis
108
Table III.C17.—Operations of the Part D Account in the SMI Trust Fund (Cash Basis) during Calendar Years 2004-2015
[In billions]
Calendar year
Income Expenditures Account
Premium income
1
General revenue
2
Transfers from
States3
Interest and
other Total Payments to plans
4
Adminis-trative
expense Total Net
change
Balance at end
of year5
Historical data: 2004 — $0.4 — — $0.4 $0.4 — $0.4 — — 2005 — 1.1 — — 1.1 1.1 — 1.1 — —
Intermediate estimates: 2006 5.0 46.2 $7.0 $0.1 58.3 57.5 $0.7 58.3 — — 2007 7.5 52.5 7.5 0.1 67.7 67.0 0.7 67.7 — — 2008 10.5 59.8 8.1 0.1 78.4 77.7 0.7 78.4 — — 2009 12.7
6 65.6 8.7 0.1 87.2 86.5 0.7 87.2 — —
2010 11.9 6 72.2 9.4 0.1 93.6 92.9 0.7 93.6 — —
2011 14.4 79.5 10.1 0.1 104.1 103.4 0.7 104.1 — — 2012 16.0 88.0 10.9 0.2 115.0 114.4 0.7 115.0 — — 2013 17.7 97.4 11.9 0.2 127.1 126.4 0.7 127.1 — — 2014 19.5 107.7 12.8 0.2 140.2 139.5 0.7 140.2 — — 2015 21.5 119.2 13.9 0.2 154.8 154.0 0.8 154.8 — —
1Premiums include only amounts withheld from Social Security benefit checks or other Federal benefit
payments. 2Includes all government transfers, including amounts for the general subsidy, reinsurance, employer
drug subsidy, low-income subsidy, administrative expenses, risk sharing, and State expenses for making low-income eligibility determinations. Includes amounts for the transitional assistance benefits in 2004 and 2005. 3With the availability of Part D drug coverage and low-income subsidies in 2006, Medicaid is no longer
the primary payer for full-benefit dual eligibles. States are subject to a contribution requirement and must pay the Part D account in the SMI trust fund a portion of their estimated forgone drug costs for this population. Starting in 2006, States must pay 90 percent of the estimated costs, with this percentage phasing down over a 10-year period to 75 percent in 2015. 4Also includes subsidies to employer-sponsored retiree prescription drug plans, payments to States for
making low-income eligibility determinations, and Part D drug premiums collected from beneficiaries and transferred to Medicare Advantage plans and private drug plans. Includes amounts for the transitional assistance benefits in 2004 and 2005. 5See text concerning nature of general revenue appropriations process and implications for contingency
reserve assets. 6See footnote 2 of table III.A1.
Note: Totals do not necessarily equal the sums of rounded components.
In table III.C18, prescription drug payment amounts are considered
in the aggregate, on a per capita basis, and relative to the Gross
Domestic Product (GDP). Rates of growth are shown for the next
10 years, based on the intermediate set of assumptions.

SMI Financial Status
109
Table III.C18.—Growth in Part D Benefits (Cash Basis) through December 31, 2015
Calendar year Aggregate benefits
[billions] Percent change
Per capita benefits
Percent change
Part D benefits as a percentage of GDP
Historical data: 2004 $0.4 — $359 — 0.0 % 2005 1.1 — $594 — 0.0
Intermediate estimates: 2006 57.5 — 1,971 — 0.4 2007 67.0 16.4 % 1,970 −0.0 % 0.5 2008 77.7 16.0 2,119 7.5 0.5 2009
1 86.5 11.3 2,298 8.5 0.6
2010 1 92.9 7.4 2,424 5.5 0.6
2011 103.4 11.3 2,641 9.0 0.6 2012 114.4 10.6 2,841 7.6 0.6
2013 126.4 10.5 3,047 7.3 0.7 2014 139.5 10.4 3,272 7.4 0.7 2015 154.0 10.4 3,513 7.4 0.8 1See footnote 2 of table III.A1.
In addition to the variability in economic, demographic, and health
care usage and cost experience that underlies the cost projections
prepared for other parts of Medicare, the intermediate projections for
Part D have an added uncertainty in that they were prepared for a
new benefit, so there is no current experience upon which to base
conclusions. As such, there is a very substantial level of uncertainty
surrounding these cost projections. High and low cost estimates have
also been prepared using two alternative sets of assumptions that
reflect variation from the intermediate assumptions in both the
projection and the base cost calculation. The estimated operations of
the Part D account for all three alternatives are summarized in
table III.C19. The assumptions underlying the intermediate
estimates are presented in substantial detail in section IV.B2. The
assumptions used in preparing estimates under the low cost and high
cost alternatives are also summarized in that section.

Actuarial Analysis
110
Table III.C19.—Estimated Operations of the Part D Account in the SMI Trust Fund during Calendar Years 2005-2015, under Alternative Sets of Assumptions
[In billions]
Calendar year
Premiums from enrollees Other income
1 Total income
Total expenditures
Balance in account at end of year
Intermediate: 2005 — $1.1 $1.1 $1.1 — 2006 $5.0 53.3 58.3 58.3 — 2007 7.5 60.2 67.7 67.7 — 2008 10.5 68.0 78.4 78.4 — 2009 12.7
2 74.5 87.2 87.2 —
2010 11.9 2 81.7 93.6 93.6 —
2011 14.4 89.8 104.1 104.1 — 2012 16.0 99.1 115.0 115.0 — 2013 17.7 109.4 127.1 127.1 — 2014 19.5 120.7 140.2 140.2 — 2015 21.5 133.3 154.8 154.8 —
Low cost: 2005 — $1.1 $1.1 $1.1 — 2006 $3.4 44.8 48.2 48.2 — 2007 5.5 50.3 55.8 55.8 — 2008 7.6 55.9 63.6 63.6 — 2009 9.1
2 60.1 69.2 69.2 —
2010 8.4 2 64.6 73.0 73.0 —
2011 10.0 69.7 79.7 79.7 — 2012 10.9 75.4 86.3 86.3 — 2013 11.9 81.6 93.5 93.5 — 2014 12.9 88.2 101.1 101.1 — 2015 13.9 95.5 109.4 109.4 —
High cost: 2005 — $1.1 $1.1 $1.1 — 2006 $5.8 61.6 67.5 67.5 — 2007 9.4 71.3 80.7 80.7 — 2008 13.6 81.7 95.3 95.3 — 2009 17.0
2 91.5 108.5 108.5 —
2010 16.1 2 102.5 118.6 118.6 —
2011 20.0 115.1 135.0 135.0 — 2012 22.8 129.7 152.5 152.5 — 2013 25.7 146.1 171.7 171.7 — 2014 28.9 164.4 193.3 193.3 — 2015 32.5 185.2 217.6 217.6 —
1Other income contains Federal and State government contributions and interest.
2See footnote 2 of table III.A1.
Note: Totals do not necessarily equal the sums of rounded components.
The three sets of assumptions were selected in order to indicate the
general range in which the cost might reasonably be expected to fall.
The low and high cost alternatives provide for a wide range of
possible experience. Actual experience is likely to fall within the
range, but no assurance can be given that this will be the case,
especially since the Part D benefits are a new, voluntary program
with which there is no actual experience.
Part D expenditures are estimated to grow significantly faster than
GDP under the intermediate, low, and high cost assumptions.

SMI Financial Status
111
The alternative projections shown in table III.C19 illustrate two
important aspects of the financial operations of the Part D account:
• Despite the widely differing assumptions underlying the three
alternatives, the balance between Part D income and
expenditures remains relatively stable. Under the low cost
assumptions, for example, by 2015 both income and expenditures
would be around 25 percent lower than projected under the
intermediate assumptions. The corresponding amounts under the
high cost assumptions would be around 30 percent higher than
the intermediate estimates.
This result occurs because the premiums and general revenue
contributions underlying the Part D financing will be
reestablished annually. Thus, Part D income will automatically
track Part D expenditures fairly closely, regardless of the specific
economic and other conditions.
• As a result of the close matching of income and expenditures
described above, together with anticipated flexibility in the
appropriations of general revenues, the need for a contingency
reserve to handle unanticipated fluctuations is minimal. (The
next section describes this issue in more detail.)
Adequacy of Part D Financing Established for Calendar Year 2006
As noted previously, the Part D account in the SMI trust fund will be
in financial balance indefinitely, as a result of the basis for program
financing. Specifically, Part D expenditures are financed through the
premiums paid by enrollees, special State payments to Medicare, and
appropriations from the general fund of the Treasury. Moreover, the
appropriation language adopted for fiscal year 2006 for the Part D
account provides substantial flexibility in the amount of general
revenues available to the account. Although a specific appropriation
amount is referenced, based on estimates from the President‟s
Budget, the appropriations language also allows indefinite budget
authority for Part D in the event that the annual appropriation
amount is insufficient. Thus, further Congressional action would not
be required to cover a higher-than-expected level of Part D
expenditures in fiscal year 2006.33 Similar flexibility is anticipated for
future Part D appropriations.
33The indefinite authority applies to all Part D outlays other than Federal
administrative expenses.

Actuarial Analysis
112
This basis for appropriations has been used to date for the 2004-2005
transitional drug card subsidies. It has also been used for many years
in setting appropriations for Federal matching funds for the Medicaid
program.
As a consequence of this approach to appropriating Part D general
revenues, there is minimal need to maintain assets in the Part D
account for contingency purposes. As resources are needed day to day
to cover expenditures, general revenues will be appropriated to the
account in the necessary amount. The indefinite authority provision
will allow such appropriations to continue even if the specific annual
appropriated amount is exceeded. Consequently, no deficit would
occur in the Part D account, and no contingency fund would be
necessary to cover deficits.
As described in the section on the financial status of the Part B
account, an appropriate level of assets should be maintained to cover
the liability for claims that have been incurred but not yet reported or
paid. In the case of Part D, however, most such claims will be the
responsibility of the prescription drug plans rather than the Part D
program. Accordingly, the Part D account would generally not be at
risk for incurred-but-unreported claim amounts, and no asset reserve
would be necessary for this purpose.34
Another potential Part D liability would exist to the extent that
Part D reinsurance payments and employer subsidy payments would
be based on plan estimates. (These estimates are subject to actuarial
review by the Office of the Actuary at the Centers for Medicare &
Medicaid Services.) Actual costs, as subsequently determined, could
well differ from the estimates, thereby requiring payment
adjustments after the close of the year. The estimated Part D liability
for these differences would generally be zero, with underestimates
being as likely as overestimates. In addition, any settlements in favor
of the plans would be made by Medicare from the following year‟s
appropriated general revenues. Thus, creation of a reserve for
payment of such settlement amounts seems unnecessary.
34A potential exception to this principle would arise if one or more Federal “fall-back”
prescription drug plans are created. Fall-back plans would be established in regions
that did not have at least two prescription drug plans, and the Part D program would
be at risk for the drug benefit costs. In this instance, incurred-but-unreported claim
amounts would be the responsibility of the Part D program. The Part D estimates
shown in this report are based on the assumption that no fall-back plans will be
necessary, and no Part D account assets are included in the estimates for the purpose
of covering potential incurred-but-unreported claims from fall-back plans.

SMI Financial Status
113
For these reasons, the Board of Trustees has tentatively concluded
that maintenance of Part D account assets for contingency or liability
purposes is unnecessary. Accordingly, evaluation of the adequacy of
Part D assets is also unnecessary, and the Part D account is
considered to be in satisfactory financial condition for 2006 (and all
future years under current law) as a consequence of its basis for
financing.
To the extent that actual future account transactions and
appropriation measures differ from the current expectations, it may
be necessary to revise this conclusion.
c. 75-Year Actuarial Estimates (2006-2080)
In section III.C3b, the expected operations of the Part D accounts
over the next 10 years were presented. In this section, the long-range
expenditures of the accounts are examined under the intermediate
assumptions. Because of their automatic financing provisions, the
Part D accounts are expected to be adequately financed into the
indefinite future, so a long-range analysis using high cost and low
cost assumptions is not conducted.
Table III.C20 shows the estimated Part D incurred expenditures
under the intermediate assumptions expressed as a percentage of
GDP, for selected years over the calendar-year period 2006-2080.35
The 75-year projection period fully allows for the presentation of
future trends that may reasonably be expected to occur, such as the
impact of the large increase in enrollees after 2010 when the baby
boom generation will reach eligibility age and begin to receive
benefits.
35These estimated incurred expenditures are for benefit payments and administrative
expenses combined, unlike the values in table III.C18, which express only benefit
payments on a cash basis as a percentage of GDP.

Actuarial Analysis
114
Table III.C20.—Part D Expenditures (Incurred Basis) as a Percentage of the Gross Domestic Product
1
Calendar year Part D expenditures as a percentage of GDP
2006 0.42 %
2007 0.48 2008 0.53 2009 0.56 2010 0.58 2011 0.61 2012 0.64 2013 0.68 2014 0.72 2015 0.76 2020 0.98 2025 1.22
2030 1.43 2035 1.58 2040 1.70 2045 1.80 2050 1.89 2055 1.98 2060 2.07 2065 2.13 2070 2.20 2075 2.25 2080 2.30
1Expenditures are the sum of benefit payments and administrative expenses.
Increases in Part D costs per enrollee during the initial 25-year
period are assumed to decline gradually to the rate determined by the
economic model described in sections II.C and IV.C. Based on these
assumptions, incurred Part D expenditures as a percentage of GDP
would increase rapidly from 0.42 percent in 2006 to 2.31 percent in
2080. As actual experience becomes available in 2006 and later, both
the starting cost of the drug benefit and its growth over time could
prove significantly different from these projections.
This report focuses on the 75-year period from 2006 to 2080 for the
evaluation of the long-run financial status of Part D on an open-group
basis (i.e., including past, current, and future participants).
Table III.C21 shows that because of the automatic financing of
Part D, there is no unfunded obligation.
In section III.B of this report, an extended projection of HI revenues
and expenditures was presented, beyond the normal 75-year
projection period, to highlight the continuing financial imbalance over
an infinite horizon.
Tables III.C21 and III.C22 present corresponding estimates for
Part D that extend to the infinite horizon. The extension assumes no
change to current law, and the demographic and economic trends
used for the 75-year projection continue indefinitely except that

SMI Financial Status
115
average Part D expenditures per beneficiary are assumed to increase
at the same rate as GDP per capita beginning in about 2080.
Table III.C21 shows an estimated present value of Part D
expenditures through the infinite horizon of $21.1 trillion, of which
$10.4 trillion would occur during the first 75 years. Because such
amounts, calculated over extremely long time horizons, can be
difficult to interpret, they are also shown as percentages of the
present value of future GDP. So expressed, the corresponding figures
are 1.9 percent and 1.5 percent of GDP, respectively. The table also
indicates that, for each time period, approximately 14 percent of
expenditures would be financed through beneficiary premiums and
9 percent through State transfers, with the remaining 77 percent
paid by general revenues, as mandated by current law.
Table III.C21.—Unfunded Part D Obligations from Program Inception through the Infinite Horizon
[Present values as of January 1, 2006; dollar amounts in trillions]
Present value
As a percentage
of GDP
Unfunded obligations through the infinite horizon1 $0.0 0.0%
Expenditures 21.1 1.9% Income 21.1 1.9%
Beneficiary premiums 3.0 0.3% State transfers 1.9 0.2% General revenue contributions 16.2 1.4%
Unfunded obligations from program inception through 20801 0.0 0.0%
Expenditures 10.4 1.5% Income 10.4 1.5%
Beneficiary premiums 1.5 0.2% State transfers 1.0 0.1% General revenue contributions 8.0 1.1%
1Present value of future expenditures less income, reduced by the amount of trust fund assets at the
beginning of the period. 2Present value of future expenditures less income.
Notes: 1. The present values of GDP for 2006-2080 and for 2006 through the infinite horizon are $707.0 trillion and $1,120.2 trillion, respectively.
2. Totals do not necessarily equal the sums of rounded components.
Table III.C22 shows corresponding projections separately for current
versus future beneficiaries. As indicated, about 39 percent of the
total, infinite-horizon cost is associated with current beneficiaries,
with the remaining 61 percent attributable to beneficiaries becoming
eligible for Part D benefits after January 1, 2006.

Actuarial Analysis
116
Table III.C22.—Unfunded Part D Obligations for Current and Future Program Participants through the Infinite Horizon
[Present values as of January 1, 2006; dollar amounts in trillions]
Present value
As a percentage
of GDP
Future expenditures less income for current participants ......................................... $0.0 0.0% Expenditures ......................................................................................................... 8.2 0.7% Income ................................................................................................................... 8.2 0.7%
Beneficiary premiums ........................................................................................ 1.2 0.1% State transfers ................................................................................................... 0.8 0.1% General revenue contributions .......................................................................... 6.3 0.6%
Less current trust fund (income minus expenditures to date for past and current participants)................ 0.0 0.0%
Equals unfunded obligations for past and current participants1 0.0 0.0%
Expenditures ......................................................................................................... 8.2 0.7% Income ................................................................................................................... 8.2 0.7%
Beneficiary premiums ........................................................................................ 1.2 0.1% State transfers ................................................................................................... 0.8 0.1% General revenue contributions .......................................................................... 6.3 0.6%
Plus expenditures less income for future participants for the infinite horizon .......... 0.0 0.0% Expenditures ......................................................................................................... 12.8 1.1% Income ................................................................................................................... 12.8 1.1%
Beneficiary premiums ........................................................................................ 1.8 0.2% State transfers ................................................................................................... 1.2 0.1% General revenue contributions .......................................................................... 9.9 0.9%
Equals unfunded obligations for all participants for the infinite future ...................... 0.0 0.0% Expenditures ......................................................................................................... 21.1 1.9% Income ................................................................................................................... 21.1 1.9%
Beneficiary premiums ........................................................................................ 3.0 0.3% State transfers ................................................................................................... 1.9 0.2% General revenue contributions .......................................................................... 16.2 1.4%
1This concept is also referred to as the closed-group unfunded obligation.
Notes: 1. The estimated present value of GDP for 2006 through the infinite horizon is $1,120.2 trillion. 2. Totals do not necessarily equal the sums of rounded components.
The Part D cost estimates shown in this year‟s Trustees Report are
substantially lower than those in the 2005 report. The reduction
reflects the net impact of a number of changes. The most significant
of these are as follows:
• The actual increases in national per capita prescription drug
spending in 2004 and 2005 were substantially lower than expected.
At approximately 7 percent in each year, these increases represent
the first time in more than a decade that drug spending per person
rose at less than double-digit rates. As a result, Part D
expenditures are projected off of a lower starting point in 2006. In
addition, the assumed growth rates after 2006 were adjusted
downward somewhat to reflect the experience in 2004-2005.36
36The data for 2005 are preliminary.

SMI Financial Status
117
• In their actuarial bid submissions, Part D plans anticipated retail
price discounts, drug manufacturer rebates, and utilization
management savings totaling 27 percent (relative to full retail,
unmanaged costs). The projections shown in this report assume
this level of cost management savings in 2006 and later, whereas
the prior projections assumed a lower level initially, reaching
25 percent in 2011 and later.
• Preliminary data on Part D enrollment indicate that fewer
beneficiaries than expected have enrolled in stand-alone
prescription drug plans. Similarly, the number of low-income
beneficiaries applying for assistance with premiums and cost
sharing is lower than previously anticipated. (The numbers of dual
Medicare-Medicaid enrollees, Medicare Advantage enrollees, and
retirees with employer-sponsored drug coverage that qualifies for
the Medicare employer subsidy are all similar to prior estimates.)
The projections in this report reflect a lower initial and ultimate
rate of enrollment for the two categories of beneficiaries described
above.
In addition, the long-range Part D projections are based on the new
cost growth rate assumptions described previously for HI and SMI
Part B. More information on these assumptions is available in section
IV.C of this report. Section IV.B2 describes the data sources and
assumptions underlying the updated Part D estimates.
It is important to note that the Trustees‟ Part D projections show the
expected cost to the Medicare program and the income and
expenditure transactions of the Part D account in the SMI trust fund.
The net cost to Medicare, after accounting for premium income and
State payments to Medicare, is not the same as the net cost to the
Federal Government under the Medicare Modernization Act. In
particular, this legislation substantially reduced Federal Medicaid
outlays, thereby offsetting a portion of the increased cost to Medicare.
The reduction in Medicaid outlays is not reflected in the operations of
the Part D account, as shown in this report, since it is not a Medicare
financial transaction.
The present values of the projected revenue and cost components of
the 75-year, open-group financial obligations for HI, SMI, and OASDI
are summarized in appendix table V.E2. These estimates are shown
from both a trust fund perspective and a Federal Budget perspective.

118
IV. ACTUARIAL METHODOLOGY AND PRINCIPAL
ASSUMPTIONS FOR COST ESTIMATES FOR THE HOSPITAL
INSURANCE AND SUPPLEMENTARY MEDICAL INSURANCE
TRUST FUNDS
This section describes the basic methodology and assumptions used in
the estimates for the HI and SMI trust funds under the intermediate
assumptions. In addition, projections of HI and SMI costs under two
alternative sets of assumptions are presented.
The economic and demographic assumptions underlying the
projections of HI and SMI costs shown in this report are consistent
with those in the 2006 Annual Report of the Board of Trustees of the
Federal Old-Age and Survivors Insurance and Disability Insurance
Trust Funds. These assumptions are described in more detail in that
report.
A. HOSPITAL INSURANCE
1. Cost Projection Methodology
The principal steps involved in projecting the future HI costs are
(i) establishing the present cost of services provided to beneficiaries,
by type of service, to serve as a projection base; (ii) projecting
increases in HI payments for inpatient hospital services;
(iii) projecting increases in HI payments for skilled nursing, home
health, and hospice services covered; (iv) projecting increases in
payments to managed care plans; and (v) projecting increases in
administrative costs. The major emphasis is directed toward
expenditures for fee-for-service inpatient hospital services, which
accounted for approximately 68 percent of total benefits in 2005.
a. Projection Base
To establish a suitable base from which to project the future HI costs,
the incurred payments for services provided must be reconstructed
for the most recent period for which a reliable determination can be
made. Therefore, payments to providers must be attributed to dates
of service, rather than to payment dates; in addition, the
nonrecurring effects of any changes in regulations, legislation, or
administration, and of any items affecting only the timing and flow of
payments to providers, must be eliminated. As a result, the rates of
increase in the HI incurred costs differ from the increases in cash
expenditures shown in the tables in section III.B.
For those expenses still reimbursed on a reasonable-cost basis, the
costs for covered services are determined on the basis of provider cost

Hospital Insurance
119
reports. Due to the time required to obtain cost reports from
providers, to verify these reports, and to perform audits (where
appropriate), final settlements have lagged behind the original costs
by as much as several years for some providers. Additional
complications are posed by changes in legislation or regulation, or in
administrative or reimbursement policy, the effects of which cannot
always be determined precisely.
The process of allocating the various types of HI payments made to
the proper incurred period—using incomplete data and estimates of
the impact of administrative actions—presents difficult problems,
and the solutions to these problems can be only approximate. Under
the circumstances, the best that can be expected is that the actual HI
incurred cost for a recent period can be estimated within a few
percent. This process increases the projection error directly, by
incorporating any error in estimating the base year into all future
years.
b. Fee-for-Service Payments for Inpatient Hospital Costs
Almost all inpatient hospital services covered by HI are paid under a
prospective payment system. The law stipulates that the annual
increase in the payment rate for each admission be related to a
hospital input price index (also known as the hospital market basket),
which measures the increase in prices for goods and services
purchased by hospitals for use in providing care to hospital
inpatients. For fiscal year 2006, the prospective payment rates have
already been determined. For fiscal years 2007 and later, current
statute mandates that the annual increase in the payment rate per
admission equal the annual increase in the hospital input price index
for those hospitals submitting required quality measure data. For
this report, we assume all hospitals will submit these data.
Increases in aggregate payments for inpatient hospital care covered
under HI can be analyzed in five broad categories, all of which are
presented in table IV.A1:
(1) Labor factors—the increase in the hospital input price
index that is attributable to increases in hospital workers‟
hourly earnings (including fringe benefits);
(2) Non-labor factors—the increase in the hospital input price
index that is attributable to factors other than hospital
workers‟ hourly earnings, such as the costs of energy, food,
and supplies;

Actuarial Methodology
120
(3) Unit input intensity allowance—the amount added to or
subtracted from the input price index (generally as a result
of legislation) to yield the prospective payment update
factor;
(4) Volume of services—the increase in total output of units of
service (as measured by covered HI hospital admissions);
and
(5) Other sources—a residual category, reflecting all other
factors affecting hospital cost increases (such as intensity
increases).
Table IV.A1 shows the estimated historical values of these principal
components, as well as the projected trends used in the estimates.
Unless otherwise indicated, the following discussions apply to
projections under the intermediate assumptions.

Table IV.A1.—Components of Historical and Projected Increases in HI Inpatient Hospital Payments1
Calendar year
Labor Non-labor
Input price index
Unit input intensity
allowance2
Units of service
Other sources
HI inpatient hospital
payments
Average hourly
earnings
Hospital hourly
earnings differential
Hospital hourly
earnings CPI
Hospital price
differential
Non-labor hospital prices
HI enrollment
Managed care shift
effect Admission incidence
Historical data: 1996 5.1% -2.6% 2.4% 2.9% -1.2% 1.7% 2.1% -0.4% 1.4% -2.7% 1.8% 1.6% 3.9% 1997 4.0% -2.2% 1.7% 2.3% -1.1% 1.2% 1.5% -0.4% 1.1% -3.2% 2.9% -0.1% 1.6% 1998 5.8% -3.0% 2.6% 1.3% 1.8% 3.1% 2.8% -2.4% 1.0% -3.1% 0.3% 0.1% -1.3% 1999 4.9% -1.8% 3.0% 2.2% -0.5% 1.7% 2.5% -2.1% 0.8% -1.8% 1.2% 1.7% 2.2% 2000 6.6% -2.6% 3.8% 3.5% -0.5% 3.0% 3.5% -2.1% 1.3% 0.4% -0.1% -1.7% 1.3% 2001 4.2% 1.1% 5.3% 2.7% 0.0% 2.7% 4.2% -0.8% 1.0% 2.3% 1.5% 1.5% 10.1% 2002 1.9% 3.0% 5.0% 1.4% 0.3% 1.7% 3.7% -1.2% 1.0% 2.1% -0.1% 2.7% 8.4% 2003 3.3% 0.8% 4.1% 2.2% 1.6% 3.8% 4.0% -0.8% 1.7% 0.9% -0.2% -0.7% 4.9% 2004 4.8% -1.0% 3.8% 2.6% 1.8% 4.4% 4.1% -0.7% 1.7% 0.0% -0.6% 1.5% 6.2% 2005 4.3% -0.5% 3.8% 3.5% 1.2% 4.7% 4.2% -0.7% 1.4% -0.9% 0.3% 0.8% 5.0%
Intermediate estimates: 2006 4.5% -0.6% 3.9% 2.9% 1.2% 4.1% 4.0% -0.2% 1.6% -1.7% 0.1% -0.4% 3.4% 2007 4.5% 0.0% 4.5% 2.3% 1.0% 3.3% 4.0% 0.0% 1.7% -2.2% 0.0% 0.5% 4.1% 2008 4.3% 0.0% 4.3% 2.6% 0.8% 3.4% 3.9% 0.0% 2.0% -1.3% -0.2% 0.7% 5.1% 2009 4.4% 0.0% 4.4% 2.8% 0.6% 3.4% 4.0% 0.0% 2.1% -2.2% -0.1% 0.7% 4.4% 2010 4.4% 0.0% 4.4% 2.8% 0.4% 3.2% 3.9% 0.0% 2.0% -2.3% 0.0% 0.7% 4.3% 2011 4.2% 0.0% 4.2% 2.8% 0.2% 3.0% 3.7% 0.0% 2.3% -2.3% -0.1% 0.8% 4.4% 2012 4.1% 0.0% 4.1% 2.8% 0.0% 2.8% 3.6% 0.0% 3.0% -2.4% -0.3% 0.8% 4.6% 2013 4.0% 0.0% 4.0% 2.8% 0.0% 2.8% 3.5% 0.0% 3.1% -2.5% -0.3% 0.8% 4.6% 2014 4.0% 0.0% 4.0% 2.8% 0.0% 2.8% 3.5% 0.0% 2.9% -2.5% -0.2% 0.8% 4.6% 2015 4.0% 0.0% 4.0% 2.8% 0.0% 2.8% 3.5% 0.0% 2.9% -1.6% -0.2% 0.9% 5.6% 2020 3.9% 0.0% 3.9% 2.8% 0.0% 2.8% 3.5% 0.0% 3.0% 0.0% 0.1% 0.9% 7.7% 2025 3.9% 0.0% 3.9% 2.8% 0.0% 2.8% 3.5% 0.0% 2.7% 0.0% 0.5% 0.9% 7.8% 2030 3.9% 0.0% 3.9% 2.8% 0.0% 2.8% 3.5% 0.0% 1.8% 0.0% 1.1% 0.9% 7.4% 1Percent increase in year indicated over previous year, on an incurred basis.
2Reflects the allowances provided for in the prospective payment update factors.
Note: Historical and projected data reflect the hospital input price index, which was recalibrated to a 1992 base year in 1997.
121
Hosp
ital In
sura
nce

Actuarial Methodology
122
Increases in hospital workers‟ hourly earnings can be analyzed and
projected in terms of (i) the assumed increases in hourly earnings in
employment in the general economy, and (ii) the difference between
increases in hourly earnings in the general economy and the hospital
hourly earnings used in the hospital input price index. Since HI
began, the differential between hospital workers‟ hourly earnings and
hourly earnings in the general economy has fluctuated widely. This
differential has averaged about −0.9 percent since 1996. This
differential is assumed to quickly level off at zero and to remain there
for the rest of the projection period.
Non-labor cost increases can similarly be analyzed in terms of a
known, economy-wide price measure (the Consumer Price Index, or
CPI) and a differential between the CPI and hospital-specific prices.
This differential reflects price increases for non-labor goods and
services that are purchased by hospitals and that do not parallel
increases in the CPI. Although the price differential has fluctuated
erratically in the past, it has averaged about 0.3 percent during
1996-2005. Over the short term, the hospital price differential is
assumed to gradually decrease from recent levels, leveling off to zero
for the remainder of the projection period.
The final input price index is calculated as a weighted average of the
labor and non-labor factors described above. The weights reflect the
relative use of each factor by hospitals (currently about 60 percent
labor and 40 percent non-labor).
The unit input intensity allowance is generally a downward
adjustment provided for by law in the prospective payment update
factor; that is, the unit input intensity allowance is the amount
subtracted from the input price index to yield the update factor.37
Beginning in fiscal year 2004, the law provides that increases in
payments to prospective payment system hospitals for covered
admissions will equal the increase in the hospital input price index
for those hospitals that submit the required quality measure data.
For other hospitals, the increase will be slightly smaller. For this
report, we assume that all hospitals will submit these data. Thus, the
unit input intensity allowance, as indicated in table IV.A1, is
assumed to equal zero for most of the first 25-year projection period.
37It should be noted that the update factors are generally prescribed on a fiscal-year
basis, while table IV.A1 is on a calendar-year basis. Calculations have therefore been
performed to estimate the unit input intensity allowance on a calendar-year basis.

Hospital Insurance
123
Increases in payments for inpatient hospital services also reflect
increases in the number of inpatient hospital admissions covered
under HI. As shown in table IV.A1, increases in admissions are
attributable to increases in both HI fee-for-service enrollment and
admission incidence38 (admissions per beneficiary). The historical and
projected increases in enrollment reflect an increase in the population
aged 65 and over that is more rapid than in the total population of
the United States, as well as the coverage of certain disabled
beneficiaries and persons with end-stage renal disease. Increases in
enrollment are expected to continue, mirroring the ongoing
demographic shift into categories of the population that are eligible
for HI protection.
During the 1990s, the choice of more beneficiaries to enroll in
managed care plans was an offsetting effect, which is shown in the
managed care shift effect column of table IV.A1. In other words,
greater enrollment in managed care plans reduces the number of
beneficiaries with fee-for-service Medicare coverage and thereby
reduces hospital admissions paid through fee-for-service. This factor
reversed during 2000-2003, as significant numbers of beneficiaries
have left managed care plans. More recently, with the changes
introduced in the Medicare Modernization Act, more beneficiaries are
again enrolling in Medicare Advantage plans. The shift is expected to
continue through about 2015.
Since the beginning of the prospective payment system (PPS),
increases in inpatient hospital payments from “other sources” are
primarily due to three factors: (i) the changes in diagnosis-related
group (DRG) coding as hospitals continue to adjust to the PPS; (ii) the
trend toward treating less complicated (and thus less expensive)
cases in outpatient settings, resulting in an increase in the average
prospective payment per admission; and (iii) legislation affecting the
payment rates. The impact of several budget reconciliation acts,
sequesters as required by the Gramm-Rudman-Hollings Act, and
additional legislative effects are reflected in other sources, as
appropriate. The average complexity of hospital admissions (case
mix) is expected to increase by 1.0 percent annually in fiscal years
2006 through 2030—as a result of an assumed continuation of the
current trend toward treating less complicated cases in outpatient
settings, ongoing changes in DRG coding, and the overall impact of
38For 2010-2020, this factor is estimated to be negative, reflecting the influx of
beneficiaries aged 65 (and the resulting reduction in the average age of beneficiaries)
due to the retirement of the baby boom. By 2025, the aging of the baby boom is
expected to increase the incidence of admissions.

Actuarial Methodology
124
new technology. Additionally, part of the increase from other sources
can be attributed to the increase in payments for certain costs, not
included in the DRG payment, that are generally increasing at a rate
slower than the input price index. Other possible sources of changes
in payments include (i) a shift to more or less expensive admissions
due to changes in the demographic characteristics of the covered
population; (ii) changes in medical practice patterns; and
(iii) adjustments in the relative payment levels for various DRGs, or
addition/deletion of DRGs, in response to changes in technology.
The increases in the input price index (less any intensity allowance
specified in the law), units of service, and other sources are
compounded to calculate the total increase in payments for inpatient
hospital services. These overall increases are shown in the last
column of table IV.A1.
c. Fee-for-Service Payments for Skilled Nursing Facility,
Home Health Agency, and Hospice Services
Historical experience with the number of days of care covered in
skilled nursing facilities (SNFs) under HI has been characterized by
wide swings. This extremely volatile experience has resulted, in part,
from legislative and regulatory changes and from judicial decisions
affecting the scope of coverage. Most recently, at the start of the
prospective payment system (PPS) in 1998 and 1999, there were large
decreases in utilization. The intermediate projections reflect modest
increases in covered SNF days based on growth and aging of the
population.
Increases in the average HI cost per day39 in SNFs are caused
principally by increasing payroll costs for nurses and other required
skilled labor. From 1991 through 1996, large rates of increase in cost
per day occurred due to nursing home reform regulations. For 1997
and 1998, this increase was smaller than during the previous 6 years,
but still large by historical standards. Projected rates of increase in
cost per day are assumed to decline to a level slightly higher than
increases in general earnings throughout the projection period. For
1998 and later, adjustments are included to reflect the
implementation of the new PPS for SNFs, as required by the
Balanced Budget Act of 1997. Increases in reimbursement per day
also reflect implementation and expiration of special provisions from
39Cost is defined to be the total of HI reimbursement and beneficiary cost sharing.

Hospital Insurance
125
the Balanced Budget Refinement Act of 1999 and the Benefits
Improvement and Protection Act of 2000.
The resulting increases in fee-for-service expenditures for SNF
services are shown in table IV.A2.
Table IV.A2.—Relationship between Increases in HI Expenditures and Increases in Taxable Payroll
1
Calendar year
Inpatient hospital
2,3
Skilled nursing facility
3
Home health
agency3
Managed care
Weighted average
3,4
HI admin-istrative costs
3,5
HI expendi-tures
3,5
HI taxable payroll
Growth rate
differential6
Historical data:
1996 4.2% 21.5% 8.6% 45.3% 9.1% 3.0% 9.0% 5.7% 3.1% 1997 1.5% 16.0% -1.0% 39.9% 6.0% 26.5% 6.2% 7.6% -1.3% 1998 -1.3% -1.3% -44.1% 20.1% -3.9% 6.3% -3.8% 8.0% -11.0% 1999 2.1% -18.0% -39.0% 11.4% -1.1% 2.9% -1.1% 6.8% -7.4% 2000 1.3% 8.4% -29.1% 2.5% 0.9% 41.3% 1.6% 7.9% -5.9% 2001 10.4% 21.0% 46.3% -6.0% 9.9% -14.0% 9.4% 2.3% 7.0% 2002 8.4% 10.4% -4.7% -8.5% 6.1% 14.4% 6.2% 0.3% 5.9% 2003 4.9% 3.6% -12.0% 0.1% 4.3% -0.5% 4.2% 2.7% 1.5% 2004 6.0% 14.5% 9.6% 10.5% 8.1% 18.3% 8.3% 5.7% 2.4% 2005 5.0% 4.4% 10.2% 21.0% 7.6% -2.6% 7.4% 5.8% 1.5%
Intermediate estimates: 2006 3.4% 2.4% 6.7% 21.5% 6.5% 6.3% 6.4% 5.8% 0.6% 2007 4.0% 6.7% 6.6% 20.0% 7.2% 2.8% 7.1% 5.6% 1.5% 2008 5.1% 6.7% 7.8% 13.2% 6.9% 2.6% 6.9% 5.5% 1.3% 2009 4.3% 4.7% 6.1% 17.1% 7.1% 1.9% 7.0% 5.2% 1.7% 2010 4.3% 3.3% 4.9% 15.7% 6.8% 2.0% 6.7% 5.2% 1.5% 2011 4.3% 3.1% 4.2% 15.1% 6.9% 2.2% 6.8% 5.0% 1.7% 2012 4.6% 3.1% 4.3% 14.9% 7.1% 2.4% 7.1% 4.7% 2.3% 2013 4.6% 2.8% 4.3% 14.5% 7.2% 2.3% 7.1% 4.4% 2.7% 2014 4.5% 2.7% 4.2% 13.0% 6.9% 2.2% 6.9% 4.4% 2.4% 2015 5.5% 4.0% 5.3% 11.1% 7.2% 2.9% 7.1% 4.5% 2.5% 2020 7.7% 7.4% 7.9% 7.5% 7.6% 4.6% 7.6% 4.4% 3.1% 2025 7.9% 8.5% 8.6% 7.9% 7.9% 5.1% 7.9% 4.2% 3.5% 2030 7.5% 8.7% 8.5% 7.7% 7.7% 5.0% 7.7% 4.2% 3.3%
1Percent increase in year indicated over previous year.
2This column may differ slightly from the last column of table IV.A1, since table IV.A1 includes all
persons eligible for HI protection while this table excludes noninsured persons. 3Costs attributable to insured beneficiaries only, on an incurred basis. Benefits and administrative costs
for noninsured persons are expected to be financed through general revenue transfers and premium payments, rather than through payroll taxes. 4Includes costs for hospice care.
5Includes costs of Peer Review Organizations through 2001 and Quality Improvement Organizations
beginning in 2002. 6The ratio of the increase in HI costs to the increase in taxable payroll. This ratio is equivalent to the
percent increase in the ratio of HI expenditures to taxable payroll (the cost rate).
Until recently, HI experience with home health agency (HHA)
payments had shown a generally upward trend, frequently with
sharp increases in the number of visits from year to year. During
1989-1995, extremely large increases in the number of visits
occurred. Growth slowed dramatically in 1996 and 1997, in part as a
result of intensified efforts to identify fraudulent activities in this
area. The growth in the benefit was also heavily affected by the
enactment of the Balanced Budget Act of 1997, which introduced

Actuarial Methodology
126
interim per beneficiary cost limits, at levels resulting in substantially
lower aggregate payments. These cost limits were used until the
prospective payment system was implemented in October 2000. For
1998 through 2001, large decreases in utilization have been observed.
Data for 2002 and 2003 show a slight increase. For 2004 and 2005, a
slightly larger increase has been seen. For 2006 and later, these
increases are assumed to decrease, so more modest increases are
assumed for the rest of the projection period, based on growth and
aging of the population.
In addition, beginning in 1998, certain categories of HHA services
were transferred from HI to SMI, but with a portion of the cost of the
transferred services met through the HI trust fund during a 6-year
transitional period. At the start of the HHA prospective payment
system, the transferred services represented a little over one-half of
all HHA services. The HHA estimates shown in this report represent
the total cost to HI from (i) HI-covered HHA services, and (ii) the
transitional payments to the SMI trust fund for the applicable portion
of SMI HHA costs, as specified by the Balanced Budget Act of 1997.
Reimbursement per episode of care40 is assumed to increase at a
slightly higher rate than increases in general earnings, but
adjustments to reflect the limiting, by legislation, of HHA
reimbursement per episode are included where appropriate. In
particular, payments were set to be equivalent to a 15-percent
reduction in the prior interim cost limits, effective October 2002.
Reimbursement per episode also includes any change in the mix of
services being provided. During the first year the prospective
payment system was in effect, this mix of services was much higher
than anticipated. The resulting increases in fee-for-service
expenditures for HHA services are shown in table IV.A2.
HI covers certain hospice care for terminally ill beneficiaries. Hospice
payments are very small relative to total HI benefit payments, but
they have grown rapidly in most years. This growth rate slowed
dramatically in the mid-to-late 1990s but rebounded sharply in
1999 through 2005. Although detailed hospice data are scant at this
time, estimates for hospice benefit payment increases are based on
mandated daily payment rates and annual payment caps, and
assume a slow down in the growth in the number of covered days.
Increases in hospice payments are not shown separately in
table IV.A2 due to their extremely small contribution to the weighted
40Under the HHA prospective payment system, Medicare payments are made for each
episode of care, rather than for each individual home health visit.

Hospital Insurance
127
average increase for all HI types of service; they are, however,
included in the average.
d. Managed Care Costs
HI payments to private health plans have generally increased
significantly from the time that such plans began to participate in the
Medicare program in the early 1980s. Most of the increase in
expenditures has been associated with the increasing numbers of
beneficiaries who have enrolled in these plans. Decreases in such
enrollment occurred during 2001-2003, as a result of slow growth in
Medicare capitation rates under the Balanced Budget Act of 1997; as
plan costs grew at a faster rate than the capitation payments, most
plans had to reduce the supplemental benefits they could offer, and a
number of plans dropped out of the Medicare market. Plan
participation and enrollment growth have rebounded under the
Medicare Modernization Act, which raised capitation payments
starting in 2004 and which introduces a competitive bidding system
in 2006 and later. Significant increases in Medicare Advantage plan
enrollments are projected through 2015, with gradual increases
thereafter.
In its comprehensive review, the 2004 Medicare Technical Review
Panel agreed that the Board of Trustees‟ assumption regarding the
ultimate rate of beneficiary participation in Medicare Advantage
plans was in a reasonable range, but recommended that the period to
reach the ultimate participation rate be extended and that the
participation rate be assumed to increase in even increments from the
current level to the ultimate level. This recommendation is again
being followed in this year‟s report.
e. Administrative Expenses
Historically, the cost of administering the HI trust fund has remained
relatively small in comparison with benefit amounts. The ratio of
administrative expenses to benefit payments has generally fallen
within the range of 1 to 3 percent. The short-range projection of
administrative cost is based on estimates of workloads and approved
budgets for intermediaries and the Centers for Medicare & Medicaid
Services. In the long range, administrative cost increases are based
on assumed increases in workloads, primarily due to growth and
aging of the population, and on assumed unit cost increases of
slightly less than the increases in average hourly earnings that are
shown in table IV.A1. In addition, amounts are added to reflect the
costs of administering the new MMA requirements.

Actuarial Methodology
128
2. Financing Analysis Methodology
Because the HI trust fund is supported by payroll taxes, HI costs
must be compared on a year-by-year basis with the taxable payroll in
order to analyze costs and evaluate the financing. Since the vast
majority of total HI costs are related to insured beneficiaries, and
since general revenue appropriations and premium payments are
expected to support the uninsured segments, the remainder of this
section will focus on the financing for insured beneficiaries only.
a. Taxable Payroll
Taxable payroll increases occur as a result of increases in both
average covered earnings and the number of covered workers. The
taxable payroll projection used in this report is based on the same
economic assumptions used in the 2006 Annual Report of the Board
of Trustees of the Federal Old-Age and Survivors Insurance and
Disability Insurance Trust Funds. The projected increases in taxable
payroll for this report, under the intermediate assumptions, are
shown in table IV.A2.
b. Relationship between HI Costs and Taxable Payroll
The single most meaningful measure of cost increases, with reference
to the financing of the system, is the relationship between cost
increases and taxable payroll increases. If costs increase more rapidly
than taxable payroll, either income rates must be increased or costs
reduced (or some combination thereof) to finance the system in the
future. Table IV.A2 shows the projected increases in HI costs relative
to taxable payroll over the first 25-year projection period. These
relative increases fluctuate, reaching 1.5 percent per year in 2010,
and then increasing to a level of about 3.3 percent per year by 2030
for the intermediate assumption, as the baby boom population
becomes eligible for benefits.
The result of these relative growth rates is a steady increase in the
year-by-year ratios of HI expenditures to taxable payroll, as shown in
table IV.A3. Under the low cost alternative, increases in HI
expenditures follow a similar pattern relative to increases in taxable
payroll, but at a somewhat lower rate; the rate becomes slightly lower
than the rate for taxable payroll by 2010 but then increases, reaching
about 1.3 percent more per year than taxable payroll by 2030. The
high cost alternative follows a comparable pattern but at a somewhat
higher rate than under the intermediate assumptions, gradually
becoming about 3.3 percent more than taxable payroll by 2010 and

Hospital Insurance
129
then increasing to about 5.3 percent more than taxable payroll by
2030.
Table IV.A3.—Summary of HI Alternative Projections
Calendar year
Increases in aggregate HI inpatient hospital payments
1
Changes in the relationship between expenditures and payroll
1 Expenditures
as a percent of taxable payroll
3,4,5
Average hourly
earnings CPI Other
factors2 Total
3
HI expendi-tures
3,4,5
Taxable payroll
Ratio of expenditures
to payroll
Intermediate: 2006 4.5% 2.9% -0.4% 3.4% 6.4% 5.8% 0.6% 3.13% 2007 4.5% 2.3% 0.4% 4.1% 7.1% 5.6% 1.5% 3.18% 2008 4.3% 2.6% 1.4% 5.1% 6.9% 5.5% 1.3% 3.22% 2009 4.4% 2.8% 0.6% 4.4% 7.0% 5.2% 1.7% 3.27% 2010 4.4% 2.8% 0.6% 4.3% 6.7% 5.2% 1.5% 3.32% 2011 4.2% 2.8% 0.7% 4.4% 6.8% 5.0% 1.7% 3.38% 2012 4.1% 2.8% 1.0% 4.6% 7.1% 4.7% 2.3% 3.45% 2013 4.0% 2.8% 1.1% 4.6% 7.1% 4.4% 2.7% 3.55% 2014 4.0% 2.8% 1.0% 4.6% 6.9% 4.4% 2.4% 3.63% 2015 4.0% 2.8% 1.9% 5.6% 7.1% 4.5% 2.5% 3.72% 2020 3.9% 2.8% 4.0% 7.7% 7.6% 4.4% 3.1% 4.28% 2025 3.9% 2.8% 4.2% 7.8% 7.9% 4.2% 3.5% 5.06% 2030 3.9% 2.8% 3.8% 7.4% 7.7% 4.2% 3.3% 5.99%
Low cost: 2006 4.4% 2.7% -3.3% 0.3% 4.2% 6.0% -1.7% 3.06% 2007 4.1% 1.9% -1.3% 1.9% 5.0% 5.4% -0.3% 3.04% 2008 3.8% 1.8% -0.2% 2.8% 4.6% 5.2% -0.6% 3.03% 2009 3.8% 1.8% -1.0% 2.0% 4.6% 5.0% -0.3% 3.02% 2010 3.7% 1.8% -0.9% 2.0% 4.5% 4.8% -0.4% 3.01% 2011 3.6% 1.8% -0.7% 2.2% 4.6% 4.8% -0.2% 3.00% 2012 3.5% 1.8% -0.4% 2.5% 4.9% 4.6% 0.3% 3.01% 2013 3.4% 1.8% -0.2% 2.6% 5.1% 4.3% 0.7% 3.03% 2014 3.4% 1.8% -0.4% 2.4% 4.6% 4.2% 0.4% 3.04% 2015 3.4% 1.8% 0.3% 3.2% 4.7% 4.1% 0.6% 3.06% 2020 3.3% 1.8% 2.4% 5.2% 5.1% 4.0% 1.1% 3.20% 2025 3.3% 1.8% 2.5% 5.4% 5.5% 3.8% 1.6% 3.44% 2030 3.3% 1.8% 2.1% 5.0% 5.2% 3.9% 1.3% 3.69%
High cost: % 2006 3.2% 3.4% 2.9% 6.3% 8.5% 2.9% 5.4% 3.29% 2007 5.4% 2.7% 1.3% 5.7% 8.7% 5.5% 3.0% 3.39% 2008 4.5% 2.8% 3.2% 7.1% 8.9% 5.8% 2.9% 3.49% 2009 4.1% 4.4% 1.9% 6.2% 8.7% 4.2% 4.4% 3.64% 2010 7.4% 5.7% 1.3% 8.1% 10.5% 6.9% 3.3% 3.76% 2011 7.2% 5.5% 2.8% 9.5% 11.9% 8.8% 2.9% 3.87% 2012 5.4% 4.7% 3.2% 8.5% 11.0% 6.4% 4.4% 4.04% 2013 4.7% 3.9% 3.0% 7.5% 10.0% 5.0% 4.8% 4.23% 2014 4.6% 3.8% 2.8% 7.2% 9.6% 4.9% 4.4% 4.42% 2015 4.6% 3.8% 3.7% 8.2% 9.7% 5.0% 4.5% 4.62% 2020 4.6% 3.8% 5.7% 10.3% 10.2% 4.8% 5.1% 5.85% 2025 4.6% 3.8% 5.8% 10.4% 10.4% 4.6% 5.5% 7.63% 2030 4.6% 3.8% 5.4% 10.0% 10.2% 4.6% 5.3% 9.94%
1Percent increase for the year indicated over the previous year.
2Other factors include hospital hourly earnings, hospital price input intensity, unit input intensity
allowance, units of service as measured by admissions, and additional sources. 3On an incurred basis.
4Includes expenditures attributable to insured beneficiaries only.
5Includes hospital, SNF, HHA, managed care, and hospice expenditures; administrative costs; and costs
of Quality Improvement Organizations.

Actuarial Methodology
130
3. Projections under Alternative Assumptions
In almost every year since the trust fund was established, average HI
expenditures per beneficiary have increased substantially faster than
increases in average earnings and prices in the general economy.
Table IV.A2 shows the estimated past experience of HI from 1996 to
2005. As mentioned earlier, HI now makes most payments to
hospitals on a prospective basis. Payments to skilled nursing facilities
have been made prospectively since mid-1998, and home health
reimbursement became prospective in October 2000. The prospective
payment systems have made (and are expected to continue to make)
HI outlays potentially less vulnerable to excessive rates of growth in
the health care industry. However, there is still considerable
uncertainty in projecting HI expenditures—for inpatient hospital
services as well as for other types of covered services—due to the
uncertainty of the underlying economic assumptions and utilization
increases. Uncertainty in projecting HI expenditures also exists
because of the possibility that future legislation will affect unit
payment levels, particularly for inpatient hospital services. Although
current law is assumed throughout the estimates shown in this
report, legislation has been enacted affecting the inpatient PPS
payment levels to hospitals for each of the past 21 years, and future
legislation is probable.
In view of the uncertainty of future cost trends, projected HI costs
have been prepared under three alternative sets of assumptions. A
summary of the assumptions and results is shown in table IV.A3.
Increases in the economic factors (average hourly earnings and CPI)
for the three alternatives are consistent with those underlying the
OASDI report.
HI costs beyond the first 25-year projection period are based on the
assumption that average per beneficiary expenditures (excluding
demographic impacts) will increase at a rate determined by the
economic model described in sections II.C and IV.C. This rate is about
1.4 percent faster than the Gross Domestic Product (GDP) per capita
in 2030, slowing down to about the same rate as GDP per capita by
2080. HI expenditures, which were 3.1 percent of taxable payroll in
2005, will increase to 6.0 percent by 2030 and to 11.6 percent by 2080
under the intermediate assumptions. Hence, if all of the projection
assumptions are realized over time, the HI income rates provided in
current law (3.39 percent of taxable payroll) will be grossly
inadequate to support the HI cost.

Hospital Insurance
131
During the first 25-year projection period, the low cost and high cost
alternatives contain assumptions that result in HI costs increasing,
relative to taxable payroll increases, approximately 2 percentage
points less rapidly and 2 percentage points more rapidly, respectively,
than the results under the intermediate assumptions. Costs beyond
the first 25-year projection period assume that the 2-percentage-point
differential gradually decreases until 2055, when HI cost increases
relative to taxable payroll are approximately the same as under the
intermediate assumptions. Under the low cost alternative, HI
expenditures would be 3.7 percent of taxable payroll in 2030,
increasing to 5.5 percent of taxable payroll by 2080. Under the high
cost alternative, HI expenditures in 2030 would increase to
9.9 percent of taxable payroll, and to 24.7 percent of taxable payroll in
2080.
B. SUPPLEMENTARY MEDICAL INSURANCE
SMI consists of Part B and, beginning in 2004, Part D. The benefits
provided by each part are quite different in nature. The actuarial
methodologies used to produce the estimates for each part reflect
these differences and, accordingly, are presented in separate sections.
1. Part B
a. Cost Projection Methodology
Estimates under the intermediate assumptions are calculated
separately for each category of enrollee and for each type of service.
The estimates are prepared by establishing the allowed charges or
costs incurred per enrollee for a recent year (to serve as a projection
base) and then projecting these charges through the estimation
period. The per enrollee charges are then converted to reimbursement
amounts by subtracting the per enrollee values of the deductible and
coinsurance. Aggregate reimbursement amounts are calculated by
multiplying the per enrollee reimbursement amounts by the projected
enrollment. In order to estimate cash expenditures, an allowance is
made for the delay between receipt of, and payment for, the service.
(1) Projection Base
To establish a suitable base from which to project the future Part B
costs, the incurred payments for services provided must be
reconstructed for the most recent period for which a reliable
determination can be made. Therefore, payments to providers must

Actuarial Methodology
132
be attributed to dates of service, rather than to payment dates; in
addition, the nonrecurring effects of any changes in regulations,
legislation, or administration, and of any items affecting only the
timing and flow of payments to providers, must be eliminated. As a
result, the rates of increase in the Part B incurred cost differ from the
increases in cash expenditures.
(a) Carrier Services
Reimbursement amounts for physician services, durable medical
equipment (DME), laboratory tests performed in physician offices and
independent laboratories, and other services (such as physician-
administered drugs, free-standing ambulatory surgical center facility
services, ambulance, and supplies) are paid through organizations
acting for the Centers for Medicare & Medicaid Services (CMS).
These organizations, referred to as “carriers,” determine whether
billed services are covered under Part B and establish the allowed
charges for covered services. A record of the allowed charges, the
applicable deductible and coinsurance, and the amount reimbursed
after reduction for coinsurance and the deductible is transmitted to
CMS.
The data are tabulated on an incurred basis. As a check on the
validity of the projection base, incurred reimbursement amounts are
compared with cash expenditures reported by the carriers through an
independent reporting system.
(b) Intermediary Services
Reimbursement amounts for institutional services under Part B are
paid by the same “fiscal intermediaries” that pay for HI services.
Institutional care covered under Part B includes outpatient hospital
services, home health agency services, laboratory services performed
in hospital outpatient departments, and other services (such as renal
dialysis performed in free-standing dialysis facilities, services in
outpatient rehabilitation facilities, and services in rural health
clinics).
Currently, there are separate payment systems for almost all the
Part B institutional services. For these systems, the intermediaries
determine whether billed services are covered under Part B and
establish the allowed payment for covered services. A record of the
allowed payment, the applicable deductible and coinsurance, and the
amount reimbursed after reduction for coinsurance and the
deductible is transmitted to CMS.
Supplementary Medical Insurance
133
For those services still reimbursed on a reasonable-cost basis, the
costs for covered services are determined on the basis of provider cost
reports. Reimbursement for these services occurs in two stages. First,
bills are submitted to the intermediaries, and interim payments are
made on the basis of these bills. The second stage takes place at the
close of a provider‟s accounting period, when a cost report is
submitted and lump-sum payments or recoveries are made to correct
for the difference between interim payments and final settlement
amounts for providing covered services (net of coinsurance and
deductible amounts). Tabulations of the bills are prepared by date of
service, and the lump-sum settlements, which are reported only on a
cash basis, are adjusted (using approximations) to allocate them to
the time of service.
(c) Managed Care Services
Managed care plans with contracts to provide health services to
Medicare beneficiaries are reimbursed directly by CMS on either a
reasonable cost or capitation basis. Comprehensive data on such
direct reimbursements are available only on a cash basis. Certain
approximations must be made to allocate expenses to the period when
services were rendered.
(2) Fee-for-Service Payments for Aged Enrollees and Disabled
Enrollees without End-Stage Renal Disease
Disabled persons with end-stage renal disease (ESRD) have per
enrollee costs that are substantially higher and quite different in
nature from those of most other disabled persons. Hence, Part B costs
for them have been excluded from the analysis in this section and are
contained in a later section. Similarly, costs associated with
beneficiaries enrolled in managed care plans are discussed
separately.
(a) Carrier Services
i. Physician Services
Medicare payments for physician services are based on a fee schedule,
which reflects the relative level of resources required for each service.
The fee schedule amount is equal to the product of the procedure‟s
relative value, a conversion factor, and a geographic adjustment
factor. Payments are based on the lower of the actual charge and the
fee schedule amount. Increases in physician fees are based on growth

Actuarial Methodology
134
in the Medicare Economic Index (MEI),41 plus a performance
adjustment reflecting whether past growth in the volume and
intensity of services met specified targets under the sustainable
growth rate mechanism. Table IV.B1 shows the projected MEI
increases and performance adjustments for 2006 through 2015. The
physician fee updates shown through 2006 are actual values. The
modified update shown in column 4 reflects the growth in the MEI,
the performance adjustment, and legislative impacts, such as the
addition of preventive services.
41The MEI is a measure of inflation in physician practice costs and general wage levels.

Supplementary Medical Insurance
135
Table IV.B1.—Components of Increases in Total Allowed Charges per Fee-for-Service Enrollee for Carrier Services
[In percent]
Calendar year
Physician fee schedule
CPI DME Lab Other carrier
Increase due to price changes
Residual factors
Total increase
4 MEI MPA
1
Physician update
2
Modified update
3
Aged: 1996 2.0 −1.2 0.8
5 0.8 −0.1 0.7 2.9 6.0 −8.0 13.6
1997 2.0 −1.4 0.6 5
0.6 3.0 3.6 2.3 12.0 −5.2 14.9 1998 2.2 1.2 2.3
5 2.8 2.0 4.8 1.3 −2.1 −9.4 10.1
1999 2.3 0.0 2.3 2.6 1.3 3.9 2.2 5.0 −0.0 10.7 2000 2.4 3.0 5.5 5.9 3.6 9.6 3.5 10.2 7.6 14.3 2001 2.1 3.0 4.8 5.3 4.1 9.7 2.7 12.6 7.4 16.1 2002 2.6 −7.0 −4.8 −4.2 6.1 1.7 1.4 12.8 7.0 17.0 2003 3.0
6 −1.1
6 1.7
6 1.4 4.5 6.0 2.2 13.9 6.9 16.3
2004 2.9 −1.4 1.5 3.8 6.1 10.1 2.6 −0.1 7.8 7.9 2005 3.1 −1.6 1.5 2.1 7.2 9.5 3.5 2.9 10.1 5.9
2006 2.8 −2.6 0.2 0.2 5.8 5.9 2.9 −0.2 6.4 13.2 2007 2.5 −7.0 −4.7 −6.6 7.4 0.3 2.3 1.6 5.9 11.8 2008 2.3 −7.0 −4.9 −4.7 6.3 1.3 2.6 4.2 5.1 11.4 2009 2.2 −7.0 −5.0 −4.7 6.0 1.0 2.8 −1.2 7.0 10.9 2010 2.3 −7.0 −4.9 −4.7 3.6 −1.2 2.8 4.4 6.7 10.2 2011 2.1 −7.0 −5.0 −5.0 3.2 −1.9 2.8 5.3 6.2 9.8 2012 2.2 −7.0 −5.0 −4.9 3.1 −1.9 2.8 5.8 6.1 9.1 2013 2.0 −7.0 −5.1 −5.0 3.2 −2.0 2.8 5.8 6.2 8.5 2014 2.2 −7.0 −5.0 −5.0 3.2 −1.9 2.8 5.8 6.2 7.9 2015 2.2 −7.0 −5.0 −5.0 3.2 −1.9 2.8 5.9 6.2 7.2
Disabled (excluding ESRD): 1996 2.0 −1.2 0.8
5 0.8 −1.1 −0.3 2.9 5.0 0.0 8.9
1997 2.0 −1.4 0.6 5
0.6 1.8 2.4 2.3 14.8 −4.2 8.2 1998 2.2 1.2 2.3
5 2.8 2.1 4.9 1.3 2.8 −5.8 11.0
1999 2.3 0.0 2.3 2.6 0.9 3.5 2.2 2.6 3.1 11.2 2000 2.4 3.0 5.5 5.9 5.9 12.1 3.5 9.3 3.6 17.4 2001 2.1 3.0 4.8 5.3 3.9 9.5 2.7 14.5 7.9 16.8 2002 2.6 −7.0 −4.8 −4.2 7.3 2.8 1.4 19.8 10.5 20.8 2003 3.0
6 −1.1
6 1.7
6 1.4 4.6 6.1 2.2 14.9 5.7 24.0
2004 2.9 −1.4 1.5 3.8 6.1 10.1 2.6 0.6 9.5 14.0 2005 3.1 −1.6 1.5 2.1 7.6 9.9 3.5 4.6 11.1 15.6
2006 2.8 −2.6 0.2 0.2 5.7 5.9 2.9 −0.3 6.2 11.6 2007 2.5 −7.0 −4.7 −6.6 7.3 0.3 2.3 1.5 5.7 10.0 2008 2.3 −7.0 −4.9 −4.7 6.3 1.3 2.6 4.1 4.9 9.9 2009 2.2 −7.0 −5.0 −4.7 5.9 1.0 2.8 −1.2 6.8 9.5 2010 2.3 −7.0 −4.9 −4.7 3.6 −1.2 2.8 4.4 6.6 8.8 2011 2.1 −7.0 −5.0 −5.0 3.2 −1.9 2.8 5.2 6.1 8.7 2012 2.2 −7.0 −5.0 −4.9 3.1 −1.9 2.8 5.8 6.0 8.2 2013 2.0 −7.0 −5.1 −5.0 3.2 −2.0 2.8 5.8 6.1 7.8 2014 2.2 −7.0 −5.0 −5.0 3.2 −1.9 2.8 5.8 6.1 7.4 2015 2.2 −7.0 −5.0 −5.0 3.2 −1.9 2.8 5.8 6.1 6.9
1Medicare performance adjustment.
2Reflects the growth in the MEI, the performance adjustment, and legislation that impacts the physician
fee schedule update. The legislative impacts are −2.3 percent in 1994, −2.1 percent in 1995, −1.1 percent in 1998, and −0.2 percent in 2001-2003. For 2004 and 2005, the Medicare Modernization Act established a minimum update of 1.5 percent. For 2006, the Deficit Reduction Act froze the physician fee schedule conversion factor. The conversion factor freeze, together with refinements to the relative value units, results in an update of 0.2 percent for 2006. 3Reflects the growth in the MEI, the performance adjustment, and all legislation affecting physician
services—for example, the addition of new preventative services enacted in 1997 and 2000. The legislative impacts would include those listed in footnote 2. 4Equals combined increases in allowed fees and residual factors.
5For this year there were separate updates for surgery, primary care, and other physician services. This
value is the weighted average of these updates. 6The physician payment price changes for 2003 occurred on March 1, 2003.

Actuarial Methodology
136
The projected physician fee schedule expenditures should be
considered unrealistically low due to the current-law structure of
physician payment updates under the sustainable growth rate system
(SGR). The SGR requires that future physician payment increases be
adjusted for past actual physician spending relative to a target
spending level. The system would have led to significant reductions in
physician fee schedule rates for 2003, 2004, 2005, and 2006. To avoid
these reductions, the Consolidated Appropriation Resolution
established a 1.7-percent update beginning in March 2003, the
Medicare Modernization Act established minimum updates of
1.5 percent for 2004 and 2005, and the Deficit Reduction Act
established a 0.2-percent update for 2006.42 However, the target
spending level was not adjusted, and, therefore, the cumulative
actual physician expenditures are nearly certain to continue to exceed
the SGR targets for many years. This situation causes projected
physician updates to be about −5 percent for at least 9 consecutive
years, under current law, beginning in 2007. The result would be a
cumulative reduction in the payment rates for physician services of
about 37 percent by 2015. In contrast, the MEI is expected to increase
by about 22 percent over the same time frame. More than 9 years of
significant reductions in physician payments per service are very
unlikely to occur before legislative changes intervene. (As noted,
Congress has overridden the scheduled negative update for each of
the past 4 years.) However, these payment reductions are required
under the current-law SGR system and are included in the physician
fee schedule projections shown in this report.
Per capita physician charges also have changed each year as a result
of a number of other factors besides fee increases, including more
physician visits and related services per enrollee, the aging of the
Medicare population, greater use of specialists and more expensive
techniques, and certain administrative actions. The fifth column of
table IV.B1 shows the increases in charges per enrollee resulting
from these residual factors. Because the measurement of increased
allowed charges per service is subject to error, this error is included
implicitly under residual causes.
Based on the increases in table IV.B1, table IV.B2 shows the
estimates of the average incurred reimbursement for carrier services
per fee-for-service enrollee.
42The Deficit Reduction Act froze the conversion factor for 2006. Changes in relative
value units (RVUs), which increased the average RVU by about 0.2 percent, result in a
physician fee schedule update of 0.2 percent for 2006.

Supplementary Medical Insurance
137
Table IV.B2.—Incurred Reimbursement Amounts per Fee-for-Service Enrollee for Carrier Services
Calendar year
Fee-for-service enrollment [millions]
Physician fee schedule DME Lab Other carrier
Aged: 1996 27.824 $999.37 $116.19 $79.45 $156.29 1997 27.059 1,037.51 130.34 75.23 179.68 1998 26.289 1,089.33 127.41 68.20 198.14 1999 26.003 1,134.08 133.74 68.35 219.30 2000 26.163 1,248.46 147.52 73.29 250.62 2001 26.959 1,373.57 166.49 78.73 291.31 2002 27.686 1,397.82 188.05 84.24 340.67 2003 28.232 1,485.16 214.25 89.85 396.53 2004 28.433 1,641.78 213.64 97.01 427.11 2005 28.342 1,798.59 219.56 106.97 451.10
2006 28.033 1,899.09 219.86 114.05 507.88 2007 27.657 1,896.94 223.01 120.76 568.03 2008 27.664 1,923.19 232.51 126.89 633.87 2009 27.370 1,943.27 229.67 135.70 703.67 2010 27.033 1,915.37 239.91 144.85 775.88 2011 26.786 1,874.67 252.69 153.86 852.34 2012 26.763 1,834.46 267.49 163.24 930.55 2013 26.789 1,792.00 283.06 173.35 1,010.33 2014 26.717 1,752.27 299.67 184.09 1,090.32 2015 26.962 1,714.36 317.44 195.47 1,169.64
Disabled (excluding ESRD): 1996 3.760 838.67 154.61 66.76 138.52 1997 3.812 860.87 177.90 63.98 149.83 1998 3.886 903.74 182.74 60.23 166.52 1999 3.989 936.88 187.30 62.06 184.79 2000 4.137 1,055.95 204.68 64.38 216.55 2001 4.355 1,159.99 234.67 69.44 251.95 2002 4.563 1,195.53 281.74 76.65 303.51 2003 4.847 1,274.77 323.81 80.97 376.73 2004 5.084 1,412.28 325.42 88.71 429.95 2005 5.255 1,555.53 341.82 98.83 497.28
2006 5.374 1,632.63 344.43 105.71 563.24 2007 5.445 1,630.28 349.34 111.70 619.67 2008 5.541 1,652.16 363.95 117.19 681.45 2009 5.622 1,668.81 359.41 125.15 746.47 2010 5.695 1,644.50 375.24 133.41 812.70 2011 5.734 1,608.83 394.88 141.52 883.63 2012 5.755 1,573.77 417.70 149.97 956.71 2013 5.778 1,537.26 441.87 159.08 1,032.01 2014 5.799 1,502.97 467.59 168.75 1,108.32 2015 5.848 1,469.57 494.84 179.02 1,184.78
ii. DME, Laboratory, and Other Carrier Services
As with physician services, over time unique fee schedules or
reimbursement mechanisms have been established for virtually all
other non-physician carrier services. Table IV.B1 shows the increases
in the allowed charges per fee-for-service enrollee for DME,
laboratory services, and other carrier services. Based on the increases
in table IV.B1, table IV.B2 shows the corresponding estimates of the
average incurred reimbursement for these services per fee-for-service
enrollee. The fee schedules for each of these expenditure categories

Actuarial Methodology
138
are updated by increases in the CPI, together with applicable
legislated limits on payment updates. In addition, per capita charges
for these expenditure categories have grown as a result of a number
of other factors, including increased number of services provided, the
aging of the Medicare population, more expensive services, and
certain administrative actions. This growth is projected based on
recent past trends in growth per enrollee.
(b) Intermediary Services
Over the years, legislation has been enacted to establish new
payment systems for virtually all Part B intermediary services. A fee
schedule was established for tests performed in laboratories in
hospital outpatient departments. The Balanced Budget Act of 1997
(BBA) implemented a prospective payment system (PPS), which
began August 1, 2000, for services performed in the outpatient
department of a hospital. It also implemented a PPS for home health
agency services, which began October 1, 2000.
The historical and projected increases in charges and costs per fee-
for-service enrollee for intermediary services are shown in
table IV.B3.

Supplementary Medical Insurance
139
Table IV.B3.—Components of Increases in Recognized Charges and Costs per Fee-for-Service Enrollee for Intermediary Services
[In percent]
Calendar year Outpatient hospital Home health
agency1 Outpatient lab Other intermediary
Aged: 1996 8.8 7.9 5.9 17.8 1997 7.4 1.6 8.7 11.9 1998 −1.5 2,990.3
2,3 4.1 −4.0
1999 9.5 −1.4 2,3
12.6 −21.0 2000 −0.8 14.5
3 5.3 19.7
2001 12.5 −51.0 3 0.7 14.4
2002 −1.4 3.2 3 13.5 20.7
2003 5.3 4.6 3 7.8 3.8
2004 11.2 14.6 7.6 15.8 2005 10.6 10.3 9.8 17.2
2006 11.6 7.6 6.8 16.1 2007 10.9 7.8 3.9 −2.6 2008 10.1 7.6 5.4 5.9 2009 9.0 7.0 6.8 5.7 2010 8.7 5.9 6.6 5.6 2011 7.2 5.0 6.1 5.4 2012 6.9 4.3 6.0 5.2 2013 6.9 4.1 6.1 5.3 2014 6.8 4.3 6.1 5.3 2015 6.9 4.3 6.1 5.1
Disabled (excluding ESRD): 1996 7.6 — −12.0 25.9 1997 6.1 — 5.7 18.5 1998 −3.5 —
2,3 0.8 −1.3
1999 8.8 −1.5 2,3
14.3 −12.9 2000 5.5 14.0
3 13.2 74.4
2001 13.2 −44.2 3 6.6 0.9
2002 4.0 4.8 3 13.8 17.0
2003 4.9 5.2 3 6.2 −3.2
2004 12.8 14.7 9.9 2.5 2005 13.4 9.6 10.7 14.9
2006 11.5 7.7 6.8 15.0 2007 10.9 8.1 3.9 −3.2 2008 10.0 8.3 5.4 5.7 2009 9.0 7.6 6.8 5.7 2010 8.7 6.4 6.6 5.8 2011 7.1 5.7 6.1 5.7 2012 6.8 5.4 6.0 5.6 2013 6.9 5.3 6.1 5.7 2014 6.8 5.3 6.1 5.7 2015 6.8 5.1 6.1 5.7
1From July 1, 1981 to December 31, 1997, home health agency (HHA) services were almost exclusively
provided by Part A. However, for those Part B enrollees not entitled to Part A, the coverage of these services was provided by Part B. During that time, since all Part B disabled enrollees were entitled to Part A, their coverage of these services was provided by Part A. 2Effective January 1, 1998, the coverage of a majority of HHA services for those individuals entitled to
Part A and enrolled in Part B was transferred from Part A to Part B. As a result, as of January 1, 1998, there was a large increase in Part B expenditures for these services for the aged enrollees, and Part B coverage for these services resumed for disabled enrollees. 3Does not reflect the impact of adjustment for monies transferred from the Part A trust fund for HHA
costs, as provided for by the Balanced Budget Act of 1997.
Based on the increases in table IV.B3, table IV.B4 shows the
estimates of the incurred reimbursement for the various intermediary
services per fee-for-service enrollee. Each of these expenditure

Actuarial Methodology
140
categories is projected on the basis of recent past trends in growth per
enrollee, together with applicable legislated limits on payment
updates.
Table IV.B4.—Incurred Reimbursement Amounts per Fee-for-Service Enrollee for Intermediary Services
Calendar year
Fee-for-service enrollment [millions]
Outpatient hospital
Home health agency Outpatient lab
Other intermediary
Aged: 1996 27.824 281.29 8.75 42.92 140.47 1997 27.059 296.75 8.89 46.64 155.93 1998 26.289 277.23 274.78
1 48.54 146.04
1999 26.003 292.92 270.85 1 54.68 120.60
2000 26.163 297.41 310.16 1 57.56 146.73
2001 26.959 396.89 151.98 1 57.94 168.24
2002 27.686 396.04 156.79 1 65.75 206.26
2003 28.232 444.07 164.08 1 70.85 211.22
2004 28.433 510.24 187.99 76.22 242.94 2005 28.342 576.74 207.36 83.71 282.58
2006 28.033 670.16 223.06 89.43 335.72 2007 27.657 752.74 240.37 92.93 326.50 2008 27.664 837.90 258.52 97.97 345.79 2009 27.370 923.39 276.49 104.66 365.76 2010 27.033 1,013.80 292.81 111.60 386.39 2011 26.786 1,096.29 307.49 118.42 407.13 2012 26.763 1,181.55 320.80 125.54 428.32 2013 26.789 1,274.07 333.83 133.20 450.84 2014 26.717 1,372.17 348.32 141.33 474.56 2015 26.962 1,477.77 363.23 149.98 499.07
Disabled (excluding ESRD): 1996 3.760 303.70 — 50.33 138.24 1997 3.812 316.04 — 53.18 160.50 1998 3.886 289.89 182.05
1 53.62 154.51
1999 3.989 304.92 179.26 1 61.28 140.41
2000 4.137 332.59 204.34 1 69.38 253.28
2001 4.355 449.55 114.01 1 73.98 260.15
2002 4.563 470.31 119.43 1 84.18 309.58
2003 4.847 519.10 125.67 1 89.38 295.93
2004 5.084 601.39 144.12 98.21 300.95 2005 5.255 688.77 157.94 108.75 342.13
2006 5.374 767.48 170.08 116.14 402.52 2007 5.445 863.16 183.93 120.62 389.10 2008 5.541 962.47 199.13 127.12 411.42 2009 5.622 1,062.37 214.31 135.76 435.00 2010 5.695 1,167.87 228.12 144.71 460.20 2011 5.734 1,264.10 241.02 153.50 486.38 2012 5.755 1,363.72 254.11 162.67 513.58 2013 5.778 1,472.04 267.57 172.55 542.81 2014 5.799 1,586.88 281.72 183.04 573.72 2015 5.848 1,710.33 296.11 194.18 606.59
1See footnote 3 of table IV.B3.
As indicated in table IV.B4, expenditures for outpatient hospital
services are expected to increase significantly due to provisions in the
BBA, the Balanced Budget Refinement Act of 1999, and the Benefits
Improvement and Protection Act of 2000 that reduce beneficiaries‟
coinsurance payments but maintain the same total payment to the

Supplementary Medical Insurance
141
hospital. The result is that Medicare pays a larger portion of the total
outpatient hospital costs.
(3) Fee-for-Service Payments for Persons with End-Stage Renal
Disease
Most persons with ESRD are eligible to enroll for Part B coverage.
For analytical purposes, enrollees with ESRD who are also eligible as
Disability Insurance beneficiaries are included in this section because
their per enrollee costs are both higher and different in nature from
those of most other disabled persons. Specifically, most of the Part B
reimbursements for these persons are for kidney transplants and
renal dialysis.
The estimates under the intermediate assumptions reflect the unique
payment mechanism through which ESRD services are reimbursed
under Medicare. Also, the estimates assume a continued increase in
enrollment. The historical and projected enrollment and costs for
Part B benefits are shown in table IV.B5.
Table IV.B5.—Enrollment and Incurred Reimbursement for End-Stage Renal Disease
Calendar year
Average enrollment [thousands] Reimbursement [millions]
Disabled ESRD ESRD only Disabled ESRD ESRD only
1996 77 76 1,400 1,412 1997 82 78 1,478 1,443 1998 87 79 1,377 1,279 1999 92 81 1,500 1,296 2000 96 83 1,559 630 2001 101 86 1,854 770 2002 105 90 2,091 925 2003 110 93 2,413 939 2004 113 93 2,923 1,004 2005 115 95 3,269 1,087
2006 117 97 3,717 1,242 2007 118 99 3,716 1,251 2008 120 100 3,950 1,328 2009 122 101 4,184 1,404 2010 124 102 4,413 1,475 2011 125 103 4,614 1,540 2012 127 104 4,824 1,604 2013 129 104 5,062 1,670 2014 131 105 5,314 1,739 2015 133 105 5,601 1,809
(4) Managed Care Costs
Part B experience with managed care payments has generally shown
a strong upward trend. However, in recent years, there has been a
slowdown in the number of Medicare beneficiaries choosing to enroll
in managed care plans—and, in 2001, 2002, and 2003, an overall
reduction in this number. In 2004 and 2005, the number of Medicare
enrollees who selected a managed care plan to provide their Medicare

Actuarial Methodology
142
benefits increased. Capitated plans currently account for
approximately 95 percent of all Part B managed care enrollees. For
capitated plans, per capita payment amounts have grown, following
the same trend as fee-for-service per capita cost growth, based on the
formula in the law to calculate capitation amounts. The projection of
future per capita amounts follows the requirements of the MMA and
the BBA in regard to the Medicare Advantage capitation amounts,
which increase at rates based on the per capita growth for all of
Medicare and, beginning in 2006, on the amounts bid by Medicare
Advantage plans. Table IV.B6 shows the estimated number of Part B
beneficiaries enrolled in a managed care plan and the aggregate
incurred reimbursements associated with those enrollees.
Table IV.B6.—Enrollment and Incurred Reimbursement for Managed Care
Calendar year Average enrollment
[millions] Percentage of total
enrollment Reimbursement [millions]
1996 4.368 10.3 $8,800 1997 5.414 13.1 10,746 1998 6.416 15.8 15,839 1999 6.857 16.9 17,653 2000 6.856 16.9 18,620 2001 6.166 15.1 17,565 2002 5.538 13.3 17,517 2003 5.302 12.2 17,234 2004 5.375 12.1 19,490 2005 5.794 13.0 23,067
2006 6.515 14.4 28,034 2007 7.416 16.4 32,437 2008 8.054 18.4 36,986 2009 9.046 20.4 43,403 2010 10.064 22.4 50,055 2011 11.142 24.4 57,315 2012 12.346 26.4 65,750 2013 13.640 28.4 75,263 2014 14.969 30.4 85,642 2015 15.996 31.7 94,880
A substantial increase in Medicare Advantage enrollment is projected
in 2006 as the provisions of the MMA give higher payments to
Medicare Advantage plans. The higher payments provide incentives
for expansion of coverage areas and for the provision of additional
benefits to plan enrollees. In addition, preferred provider plan
demonstrations were conducted from 2003 through 2005 that
increased total managed care enrollment for those years. In its
comprehensive review, the 2004 Medicare Technical Review Panel
agreed that the Board of Trustees‟ assumption regarding the ultimate
rate of beneficiary participation is in a reasonable range, but
recommended that the period to reach the ultimate beneficiary
participation rate be extended and that the beneficiary participation
rate be assumed to increase in even increments from the current level

Supplementary Medical Insurance
143
to the ultimate level. This recommendation is again being followed in
this report.
(5) Administrative Expenses
The ratio of administrative expenses to benefit payments has declined
to about 2 percent in recent years and is projected to continue to
decline in future years. Projections of administrative costs are based
on estimates of changes in average annual wages.
b. Summary of Aggregate Reimbursement Amounts on a
Cash Basis under the Intermediate Assumptions
Table IV.B7 shows aggregate historical and projected reimbursement
amounts on a cash basis under the intermediate assumptions, by type
of service. The difference between reimbursement amounts on a cash
versus incurred basis results from the lag between the time of service
and the time of payment. This lag has been gradually decreasing.

Table IV.B7.—Aggregate Reimbursement Amounts on a Cash Basis [In millions]
Calendar year
Carrier Intermediary
Total FFS Managed
care Total Part B
Physician fee schedule DME Lab Other Total Hospital Lab
Home health agency Other Total
Historical data: 1996 31,631 3,825 2,550 5,059 43,065 8,614 1,355 241 5,749 15,960 59,025 9,558 68,584 1997 31,898 4,236 2,385 5,586 44,105 9,358 1,503 239 6,575 17,674 61,779 10,962 72,740 1998 32,449 4,037 2,087 5,940 44,514 8,712 1,541 6,169
1 6,381 22,804
1 67,318
1 15,338 82,656
1
1999 33,354 4,279 2,078 6,451 46,163 8,790 1,680 6,792 1 5,773 23,036
1 69,199
1 17,702 86,901
1
2000 36,963 4,718 2,226 7,408 51,315 8,435 1,770 9,169 1 6,208 25,582
1 76,897
1 18,358 95,256
1
2001 42,034 5,439 2,436 8,904 58,813 12,768 1,937 4,512 1 7,120 26,336
1 85,149
1 17,560 102,709
1
2002 44,824 6,529 2,788 10,873 65,014 13,557 2,233 5,039 1 8,703 29,531
1 94,545
1 17,497 112,042
1
2003 48,329 7,534 2,981 12,931 71,775 15,287 2,478 5,106 1 9,684 32,555
1 104,331
1 17,250 121,581
1
2004 54,079 7,757 3,306 14,172 79,314 17,418 2,731 5,865 10,851 36,865 116,179 18,691 134,870 2005 57,779 8,018 3,544 15,175 84,516 20,556 3,017 6,618 12,243 42,433 126,949 22,117 149,066
Intermediate estimates: 2006 62,371 8,095 3,875 17,267 91,608 22,928 3,185 7,063 14,493 47,668 139,277 30,571 169,848 2007 62,179 8,164 4,071 19,138 93,551 25,656 3,292 7,541 14,287 50,776 144,327 32,798 177,125 2008 63,033 8,512 4,288 21,351 97,185 28,668 3,476 8,121 14,969 55,234 152,419 37,500 189,919 2009 63,378 8,434 4,554 23,562 99,929 31,490 3,694 8,653 15,756 59,592 159,521 43,935 203,456 2010 62,153 8,700 4,825 25,759 101,438 34,354 3,914 9,111 16,524 63,904 165,342 50,636 215,978 2011 60,443 9,103 5,093 28,067 102,706 36,980 4,131 9,522 17,280 67,912 170,618 57,989 228,607 2012 59,103 9,628 5,401 30,603 104,735 39,866 4,378 9,949 18,127 72,321 177,057 66,508 243,564 2013 57,861 10,210 5,746 33,286 107,104 43,084 4,655 10,389 19,071 77,199 184,303 76,091 260,394 2014 56,499 10,799 6,095 35,884 109,276 46,368 4,935 10,837 20,018 82,159 191,435 86,557 277,992 2015 55,617 11,513 6,512 38,730 112,372 50,292 5,273 11,373 21,139 88,077 200,449 95,399 295,848
1See footnote 3 of table IV.B3.
144
Actu
aria
l Meth
od
olo
gy

Supplementary Medical Insurance
145
c. Projections under Alternative Assumptions
Part B cash expenditures for the low cost and high cost alternatives
were developed by modifying the growth rates estimated under the
intermediate assumptions. Beginning in the middle of calendar year
2005, the low cost and high cost incurred benefits for the following
4 quarters reflect some variation relative to the intermediate
assumptions. Thereafter, the low cost and high cost alternatives
contain assumptions that result in incurred benefits increasing,
relative to the Gross Domestic Product (GDP), 2 percent less rapidly
and 2 percent more rapidly, respectively, than the results under the
intermediate assumptions. Administrative expenses under the low
cost and the high cost alternatives are projected on the basis of their
respective wage series growth. Based on the above methodology, cash
expenditures as a percentage of GDP were calculated for all three
sets of assumptions and are displayed in table IV.B8.
Table IV.B8.—Part B Cash Expenditures as a Percentage of the Gross Domestic Product for Calendar Years 2005-2015
1
Calendar year Intermediate assumptions
Alternatives
Low cost High cost
2005 1.21 1.21 1.22 2006 1.31 1.28 1.37 2007 1.30 1.25 1.39 2008 1.32 1.24 1.44 2009 1.34 1.24 1.49 2010 1.36 1.23 1.54 2011 1.37 1.21 1.58 2012 1.39 1.21 1.64 2013 1.42 1.21 1.71 2014 1.45 1.21 1.78 2015 1.48 1.21 1.85
1Expenditures are the sum of benefit payments and administrative expenses.
2. Part D
The voluntary prescription drug benefit, which started on
January 1, 2006, presents challenges for projecting its costs. Except
for limited specific drugs, Medicare has no historical experience in
covering outpatient prescription drugs—and many provisions of the
reimbursement mechanism are without precedent. Data on Part D
plan bid submissions for 2006 are now available, as is actual Part D
enrollment in the first 2 months of 2006. These new data sources
have been used for the Part D projections shown in this report.
a. Participation Rates
All individuals enrolled in Medicare Part A or Part B are eligible to
enroll in the voluntary prescription drug benefit. However,

Actuarial Methodology
146
individuals for whom Medicare is the secondary payer are not
assumed to enroll in Part D.
(1) Employer-Sponsored Plans
There are several options for employer-sponsored plans to benefit
from the Part D program. One option is the retiree drug subsidy, in
which Medicare will subsidize qualifying employer-sponsored plans a
portion of their qualifying retiree drug expenses, which are
determined without regard to plan reimbursements. About 21 percent
of beneficiaries enrolled in Part D are assumed to be covered by this
subsidy in 2006, with this proportion grading down to about 9 percent
in 2015.
Another option is for an employer-sponsored plan to either wrap
around an existing Part D plan or become a prescription drug plan
itself. The subsidies for these types of arrangements will be
calculated in the same way as for other Part D plans. It is expected
that such plans will offer additional benefits beyond the standard
Part D benefit package, resulting in lower Part D reinsurance
payments. About 5 percent of beneficiaries enrolled in Part D are
assumed to be covered by these employer-sponsored plans in 2006,
grading up to about 10 percent in 2015.
Yet another option is for an employer to drop its drug coverage for its
retirees. It is expected that most of those retirees losing their
employer drug coverage will sign up for the Part D coverage.
Approximately 4 percent of beneficiaries enrolled in Part D coverage
in 2006, grading up to about 5 percent in 2015, are assumed to have
had employer coverage originally.
(2) Low-Income Subsidy
Qualifying low-income beneficiaries can receive additional Part D
subsidies to help finance premium and cost-sharing payments.
Subsidies are estimated for beneficiaries who apply for this assistance
and meet the income and asset requirements. (Beneficiaries qualified
for both Medicare and Medicaid will be automatically enrolled in
plans with premiums below the low-income premium benchmarks
within their regions.) The estimated number of low income enrollees
is about 30 percent of the total beneficiaries enrolled in Part D from
2006 to 2015.

Supplementary Medical Insurance
147
(3) Other Part D Beneficiaries
Medicare beneficiaries who are not qualified for the low-income
subsidy and who are not covered by employer plans can choose to
enroll in any plan they wish. Once enrolled, they will pay for
premiums and any applicable deductible, coinsurance, and/or
copayment. It is assumed that about 65 percent of such individuals
will enroll in Part D by May 15, 2006 (the end of the initial open
enrollment period), grading up to about 80 percent in 2008 and
thereafter. Table IV.B9 provides a summary of the estimated average
enrollment in Part D, by category.
Table IV.B9.—Part D Enrollment [In millions]
Calendar year
Employer subsidy
1
Low-income subsidy
All others Total
Medicaid full dual eligible
Other, with full subsidy
Other, with partial
subsidy Total
Intermediate estimates: 2006 6.5 6.3 2.3 0.4 9.0 13.7 29.2 2007 6.0 6.4 3.2 0.5 10.1 17.9 34.0 2008 5.5 6.6 3.8 0.6 11.0 20.3 36.7 2009 5.1 6.7 3.8 0.7 11.2 21.4 37.6 2010 4.6 6.8 3.9 0.7 11.4 22.3 38.3 2011 4.3 7.0 4.0 0.7 11.7 23.2 39.2 2012 4.0 7.2 4.1 0.7 12.0 24.2 40.3 2013 4.1 7.4 4.2 0.7 12.4 25.0 41.5 2014 4.1 7.6 4.4 0.7 12.8 25.8 42.6 2015 4.2 7.9 4.5 0.8 13.1 26.6 43.8
1Excludes Federal government retirees covered by either the Federal Employees Health Benefit
Program or the Tricare for Life program. Such programs qualify for the Medicare employer subsidy, but the subsidy will not be paid since it would amount to the Federal government subsidizing itself.
b. Cost Projection Methodology
(1) Projection Base
(a) Drug Benefit Payments
The 2002 Medicare Current Beneficiary Survey (MCBS) provides the
base data for the projection of Part D expenses. The MCBS is a
survey of about 12,000 beneficiaries that collects data on person-
specific health care utilization, expenses, and sources of payment,
including prescription drugs. The MCBS drug expenses were adjusted
to correct for survey misreporting. Due to the nature of drug
administration in the institutional setting, the MCBS cannot
determine drug expenses for institutionalized beneficiaries; hence,
drug expenses for this group were imputed. The data were
standardized to a full-retail cost level by removing the estimated
effects of rebates and discounts.

Actuarial Methodology
148
The adjusted 2002 MCBS drug costs were updated to 2006 through
2015 by the past and projected increases in per capita drug expenses
from the National Health Expenditure Accounts. These growth rates
are shown in table IV.B10. Since insurance coverage influences the
spending level for covered services and drugs (that is, beneficiaries
with increased insurance coverage for drugs would tend to increase
their drug expenses), the MCBS drug expenses were adjusted to
reflect differences in drug coverage between the Part D benefit and
the existing coverage reported in the MCBS.
Table IV.B10 displays the components of the increases in Part D
expenditures. Prescription drug plans are expected to negotiate
significant retail price discounts and manufacturer rebates, and to
manage drug utilization. In addition, these plans incur
administrative costs for plan operation. Since drug expenses grow
faster than administrative costs, the administrative expenses as a
percentage of benefit and costs slowly decrease over time.
Table IV.B10.—Key Factors for Part D Expenditure Estimates
Calendar year Annual per capita
drug cost increase1
Cost management and discounts
Manufacturer rebates
Plan administrative expenses
Intermediate estimates: 2006 7.1 % 21.0 % 6.0 % 12.5 % 2007 7.2 21.0 6.0 11.8 2008 7.3 21.0 6.0 11.9 2009 7.4 21.0 6.0 11.6 2010 7.5 21.0 6.0 11.5 2011 7.5 21.0 6.0 11.3 2012 7.6 21.0 6.0 11.1 2013 7.7 21.0 6.0 10.9 2014 7.7 21.0 6.0 10.7 2015 7.7 21.0 6.0 10.4
1The per capita drug increase is based on the underlying growth rate used for the National Health
Expenditure (NHE) Projections. The final NHE prescription drug projections published February 22, 2006 reflects this underlying growth rate adjusted for the impact of beneficiaries joining a Part D plan.
(b) Drug Benefit Categories
Projected drug expenses are allocated to the beneficiary premium,
direct subsidy, and reinsurance subsidy by the benefit formula
specifications (deductible, coinsurance, initial benefit limit, and
catastrophic threshold) for beneficiaries in prescription drug plans
and Medicare Advantage drug plans. Low-income beneficiaries
receive additional subsidies to help finance premium and cost-sharing
payments. Subsidies are estimated for beneficiaries who meet the
income and asset requirements.
The statute specifies that the base beneficiary premium is equal to
25.5 percent of the sum of the national average premium bid and the
estimated catastrophic reinsurance. The actual premium is greater,

Supplementary Medical Insurance
149
dollar for dollar, for plans with bids above the national average and
lower for plans with lower bids. The estimated average premium
amount is 25.5 percent of the estimated average standard benefits.
(2) 2006 Drug Bid Data
The estimation of drug benefit payments, as described above using
the MCBS data and the NHE projection factors, was supplemented by
actual data from the actuarial bid submissions of Part D plans for
2006. These data represent the plans‟ expectations of costs for
pharmacy expenses (including discount, rebates, and utilization
management savings) and administrative costs (including gain/loss
margins).
(a) Cost Management
Prescription drug plans are expected to negotiate retail price
discounts and manufacturer rebates, and to manage drug utilization.
Based on the information from the plan bids, it is now assumed that
plans will achieve an average of 21 percent savings from retail
discounts and utilization management, and 6 percent from rebates.
(b) Administrative Expenses
For 2006, the plans‟ expected administrative costs and projected
profit margins are used. Administrative costs are projected forward
with wage increases and reduced by 1 percent in each of the first
3 years to account for the phasing-out of start-up costs. The plan
gains are projected using the per capita benefit trend.
(c) Plan Benefits
In addition, bid information on Part D direct subsidy payments and
reinsurance payments has been incorporated into the baseline. These
amounts were incorporated into a model that uses a consumption
elasticity function to reflect the beneficiaries‟ preference to enroll in
lower-premium plans. The direct subsidy amounts were very
consistent with the updated MCBS estimates, but the bid data on
expected reinsurance payments were significantly higher than
estimated, raising the estimated cost for such payments.
Beneficiaries qualifying for the Part D low-income subsidy are
assumed to enroll (or be auto-enrolled) in plans that have premiums
at or below the low-income premium benchmark amount.

Actuarial Methodology
150
The average premium rate paid by beneficiaries who are not qualified
for the low-income subsidy was also estimated using the consumption
elasticity model. Based on this model, the average monthly premium
paid in 2006 is estimated to be roughly $25, compared to the average
plan premium of $32 in the absence of the preference to enroll in
lower-premium plans. This factor does not affect net Medicare costs
in 2006, but the projected costs for later years reflect the impact of
beneficiary choice of plans on the national weighted average bid,
which determines Medicare‟s cost for the direct premium subsidy.
(d) Risk Sharing
Net risk corridor payments, which previously were assumed to be
zero, were modeled based on each plan‟s expected cost in 2006
relative to the average, reflecting estimated differences in plan
efficiency levels. The modeled differences in plans‟ actual versus
estimated costs were applied to the risk corridor formulas to
determine the net risk corridor payments. The net cost or savings are
assumed to be reduced in 2007 and assumed to be zero in 2008 and
beyond as plans gain experience with the Part D program.
(e) Per Capita Reimbursements
Table IV.B11 shows estimated enrollments and per capita
reimbursements for beneficiaries in private prescription drug plans,
low-income beneficiaries, and beneficiaries in employer-sponsored
plans.
Table IV.B11.—Incurred Reimbursement Amounts per Enrollee for Part D Expenditures
Calendar year
Private plans
Employer plans All beneficiaries Low-income
Enrollment (millions)
Direct subsidy Reinsurance
Enrollment (millions)
Low-income subsidy
Enrollment (millions)
Employer subsidy
Intermediate estimates: 2006 24.9 $737.12 $436.94 9.0 $1,808.16 6.5 $573.81 2007 28.0 766.14 480.17 10.1 1,922.06 6.0 615.04 2008 31.2 818.94 484.82 11.0 2,044.45 5.5 659.82 2009 32.5 875.31 514.26 11.2 2,191.13 5.1 708.55 2010 33.7 936.38 549.90 11.4 2,350.90 4.6 761.58 2011 34.9 1,002.30 588.06 11.7 2,521.09 4.3 818.65 2012 36.3 1,072.87 628.05 12.0 2,704.02 4.0 880.45 2013 37.4 1,149.60 674.70 12.4 2,902.87 4.1 947.79 2014 38.5 1,232.84 724.10 12.8 3,116.50 4.1 1,020.55 2015 39.7 1,322.42 777.02 13.1 3,345.50 4.2 1,098.90

Supplementary Medical Insurance
151
c. Summary of Aggregate Reimbursement Amounts on a
Cash Basis under the Intermediate Assumptions
Table IV.B12 shows aggregate projected reimbursements to plans and
employers by type of payment. Since payments would be made as
incurred, cash and incurred are about the same.
Table IV.B12.—Aggregate Reimbursement Amounts on a Cash Basis for Part D [In billions]
Calendar year Premiums
Direct subsidy Reinsurance
Low-income subsidy
Employer subsidy
Risk sharing Total
Intermediate estimates:
2006 $5.0 $20.2 $12.0 $17.6 $2.8 — $57.5 2007 7.5 21.8 13.6 19.7 3.7 $0.7 67.0 2008 10.3 25.8 15.3 22.5 3.6 0.1 77.7 2009 11.5 28.7 16.9 24.7 3.6 — 85.4 2010 14.0 31.9 18.7 27.1 3.5 — 94.0 2011 13.0 35.3 20.7 29.7 3.5 — 103.4 2012 15.8 39.3 23.0 32.8 3.5 — 114.3 2013 17.5 43.4 25.5 36.2 3.8 — 126.3 2014 19.3 47.9 28.1 40.0 4.1 — 139.5 2015 21.3 52.9 31.1 44.2 4.5 — 154.0
d. Projections under Alternative Assumptions
Part D expenditures for the low cost and high cost alternatives were
developed by modifying the base (2006) estimates and the growth
rates estimated under the intermediate assumptions. The base (2006)
per capita estimates increased by about 9 percent under the high cost
scenario and decreased by about 9 percent under the low cost
scenario. For years after 2006, the growth assumptions decreased
2 percentage points per year under the low cost scenario and
increased 2 percentage points per year under the high cost scenario.
The 2006 base modifications include the following:
• ±5 percent for how well the MCBS-based projections, coupled
with the 2006 plan bids, represent Medicare beneficiaries‟ drug
expenses in 2006. The high cost scenario increases the spending
by 5 percent, and the low cost scenario decreases the spending by
5 percent.
• ±2 percent for the average retail discount that drug plans
negotiate. The high cost scenario decreases the average discount
by 2 percent, and the low cost scenario increases the average
discount by 2 percent.
• ±2 percent for the average manufacturer rebate that drug plans
negotiate. The high cost scenario decreases the average rebate by

Actuarial Methodology
152
2 percent, and the low cost scenario increases the average rebate
by 2 percent.
For the projections beyond 2006, the drug per capita increase from
the NHE projections is increased by 2 percent for the high cost
scenario and decreased by 2 percent for the low cost scenario. In
addition, assumptions regarding employer-sponsored plan
participation, participation in the low-income subsidies, and the
participation rate for individuals who do not qualify for the low-
income subsidy or receive coverage through an employer-sponsored
retiree plan vary in the alternative scenarios. Table IV.B13 compares
these varying assumptions.
Table IV.B13.—Part D Assumptions under Alternative Scenarios for Calendar Years 2006-2015
Calendar year Intermediate assumptions
Alternatives
Low cost High cost
Percentage of beneficiaries enrolled in subsidized employer-sponsored plans 2006 15.7 18.0 13.5 2007 14.3 16.8 11.8 2008 12.8 15.7 10.2 2009 11.7 14.5 8.6 2010 10.4 11.9 7.7 2011 9.4 11.2 6.7 2012 8.5 11.3 4.1 2013 8.4 11.1 4.0 2014 8.3 10.9 4.0 2015 8.2 10.8 3.9
Low-income participation as a percentage of low-income eligible beneficiaries
2006 62.2 58.7 65.9 2007 68.8 64.5 73.3 2008 73.1 69.1 78.1 2009 73.1 69.2 78.2 2010 73.3 69.3 78.3 2011 73.4 69.4 78.4 2012 73.3 69.3 78.3 2013 73.3 69.3 78.3 2014 73.3 69.3 78.3 2015 73.3 69.3 78.3
Percentage of non-employer, non-low-income beneficiaries enrolled 2006 55.2
1 40.2 70.2
2007 72.5 57.5 85.0 2008 80.0 65.0 90.0 2009 80.0 65.0 90.0 2010 80.0 65.0 90.0 2011 80.0 65.0 90.0 2012 80.0 65.0 90.0 2013 80.0 65.0 90.0 2014 80.0 65.0 90.0 2015 80.0 65.0 90.0
1The initial enrollment period runs through May 15, 2006 at which time 65 percent of the non-employer,
non-low-income beneficiaries are projected to have enrolled in Part D. The figure on the table reflects the average percentage enrolled for 2006.

Supplementary Medical Insurance
153
Table IV.B14 compares expenditures under intermediate, low, and
high cost alternatives as a percentage of the Gross Domestic Product.
Table IV.B14.—Part D Cash Expenditures as a Percentage of the Gross Domestic Product for Calendar Years 2005-2015
1
Calendar year Intermediate assumptions
Alternatives
Low cost High cost
2005 0.01 0.01 0.01 2006 0.44 0.36 0.53 2007 0.49 0.40 0.60 2008 0.54 0.44 0.67 2009 0.56 0.45 0.72 2010 0.59 0.46 0.76 2011 0.61 0.48 0.78 2012 0.65 0.49 0.83 2013 0.69 0.51 0.89 2014 0.72 0.53 0.95 2015 0.76 0.55 1.01
1Expenditures are the sum of benefit payments and administrative expenses.
C. LONG-RANGE MEDICARE COST GROWTH ASSUMPTIONS
The prior two sections have described the detailed assumptions and
methodology underlying the projected expenditures for HI and SMI
(Parts B and D) during 2006 through 2015. These projections are
made for individual categories of Medicare-covered services, such as
inpatient hospital care and physicians‟ services.
As the projection horizon lengthens, it becomes increasingly difficult
to anticipate changes in the delivery of health care, the development
of new medical technologies, and other factors that will affect future
health care cost increases. Thus, for the long range, Medicare
projections after the first 10 years are made in aggregate for each of
HI, SMI Part B, and SMI Part D, rather than preparing for each
individual category of service. Moreover, starting with the 25th year of
the projection, all Medicare expenditures are assumed to increase at a
common rate (before demographic impacts), in recognition of the
uncertainty described above and the small likelihood that one
category of expense could continue to grow indefinitely at
significantly faster rates of growth than those for other services.
Based on a recommendation by the 2000 Medicare Technical Review
Panel, the increase in average expenditures per beneficiary for the
25th through 75th years of the projection has been assumed to equal
the growth in per capita GDP plus 1 percentage point, prior to
demographic effects. For the infinite-horizon projections, the Trustees
have assumed the same growth rate as per capita GDP for the 76th
and later years (again, prior to demographic impacts).

Actuarial Methodology
154
For this year‟s report, the Board of Trustees has adopted a refinement
of these long-range growth assumptions. The refinement provides a
smoother and more realistic transition from current Medicare cost
growth rates, which have been significantly above the level of GDP
growth, to the ultimate assumed level of GDP plus zero percent for
the indefinite future. The year-by-year growth patterns are based on
a stylized economic model that makes assumptions about
(i) continuing improvements in medical technology, (ii) the extent to
which new medical technology either increases health care costs or
reduces them, and (iii) society‟s relative preference for improved
health versus consumption of other goods and services. The model is
based on a computable general equilibrium (CGE) methodology and
uses a single agent to represent demand for medical care at the
national level. The model does not directly project Medicare spending.
Consistent with past Trustees Report assumptions, however, the new
projection assumes that overall health care spending per capita and
Medicare spending per beneficiary grow at the same rate after the
25th year of the projection.
Due to data limitations, this economic model can not be used to
independently project long-range health cost growth rates. For use as
a refinement to the existing growth assumptions, rather than as a
replacement, the intermediate growth assumption generated by the
economic model is determined in such a way that the average rate of
cost growth in the long range is consistent with the prior “GDP plus
1 percent” assumption over the first 75 years. Specifically, the model
parameters are selected (i) to reproduce the past (1977) and projected
(2015) levels of total U.S. health expenditures as a share of GDP, (ii)
to be within the reasonable range of existing research studies on
income and price elasticities, and (iii) to result in the same 75-year HI
actuarial balance as calculated under the “GDP plus 1 percent”
assumption.
With this latter constraint, the assumed per-beneficiary growth rate
from the economic model for all Medicare services in 2030 is about
1.4 percentage points above the level of GDP growth for that year.
This differential gradually declines to about 0.75 percent in 2050 and
to less than 0.2 percent in 2080. Compared to the assumptions used
in the prior several reports, the new growth assumption is initially
higher but subsequently lower than the constant “GDP plus
1 percent” assumption. For the infinite horizon, the assumed growth
rate of GDP plus zero percent is essentially unchanged. Following
prior practice, in between the 10th and 25th years of the projection the
growth rates are assumed to grade smoothly into the long-range
growth rates from the economic model.
Long-Range Assumptions
155
The new cost growth assumptions thus follow a smoother path over
the next 75 years than did the prior assumptions. Under the new
assumptions, projected HI and SMI costs are initially somewhat
higher than they would have been with the prior assumption, but
later in the projection period they are lower. For example, the HI cost
in 2030 is estimated to be 5.99 percent of taxable payroll. If the “GDP
plus 1 percent” assumption had been used, the corresponding
estimate would be 5.81 percent. In 2080, however, the new cost rate
of 11.59 percent is significantly lower than the 13.28-percent rate
under the prior assumption. As noted, the 75-year actuarial balance
is the same under either set of assumptions. Similar patterns of
difference result for the SMI Part B and Part D projections.
The theory behind this model is that should medical technology
continue to increase rapidly, and expensively, in the future, then
eventually society would be unwilling and unable to devote a steadily
increasing share of its income to obtaining better health. Such
unwillingness could be expressed in a number of ways consistent with
current law, such as private and public health plans‟ refusal to adopt
expensive new technologies that offer only marginal health
improvement over existing techniques or inability on the part of
individuals to afford health insurance premiums or cost-sharing
payments.
The economic model implicitly reflects such constraints in a general
way but does not attempt to explicitly model the actual mechanisms
by which cost growth would be slowed. Because the model is tied
through the actuarial balance calculation to the underlying “GDP
plus 1 percent” assumption for the first 75 years, it effectively
assumes a similar degree of cost constraint that has been assumed as
part of the prior assumption.43
As recommended by both the 2000 and 2004 Medicare Technical
Review Panels, the Trustees and their staffs are continuing to pursue
research into these issues, with the goal of developing an economic
model that will directly estimate long-range health cost growth rates.
The economic model introduced in this report offers a useful,
although limited, step in this direction.
43The rationale for the “GDP plus 1 percent” assumption is described in the report of
the 2000 Medicare Technical Review Panel, available at
http://www.cms.hhs.gov/ReportsTrustFunds/downloads/TechnicalPanelReport2000.pdf.
Further discussion of this assumption is included in the 2004 Medicare Technical
Review Panel‟s report, at http://www.aspe.hhs.gov/health/medpanel/.

156
V. APPENDICES
A. MEDICARE AMENDMENTS SINCE THE 2005 REPORT
Since the 2005 annual report was transmitted to Congress on
March 23, 2005, one law has been enacted that has a significant effect
on the Medicare trust funds.
The Deficit Reduction Act of 2005 (Public Law 109-171, enacted on
February 8, 2006) included a number of provisions affecting the HI
and SMI programs. The more important provisions, from an actuarial
standpoint, are described in the following paragraphs. Certain
provisions with a relatively minor financial impact on the HI and SMI
programs, but which are important from a policy perspective, are
described as well.
Provisions Affecting both HI and SMI
• The home health payment update for 2006 is set at 0 percent. For
2007 and subsequent years, the annual payment update for home
health agencies is adjusted as follows: home health agencies that
report quality measures to the Secretary will receive the full
market basket, and home health agencies that do not report quality
measures will receive the market basket minus 2 percentage
points. The Secretary is required to establish procedures for
publicizing the measures submitted by home health agencies. By
June 1, 2007, the Medicare Payment Advisory Commission
(MedPAC) must submit a report with recommendations on a
detailed structure of value-based payment adjustments for home
health services. For episodes and visits beginning on or after
January 1, 2006 and before January 1, 2007, the 5-percent add-on
is reinstituted for home health services furnished to beneficiaries
residing in rural areas.
• For claims submitted on or after January 1, 2006, the period of
time between the date on which a paper claim is received and the
date on which it may be paid is extended by 2 days (from 27 to
29 days).
• All Part A and Part B payments to providers that would have been
made during the period beginning on September 22, 2006 and
ending on September 30, 2006 must be paid on the first business
day of October 2006. No interest or late penalty will apply.
• Beginning in 2007, a single risk ratebook is established for monthly
capitation rates related to payment of Medicare Advantage (MA)
plans. In addition, the phase-out schedule of the budget neutrality
Medicare Amendments
157
adjustment is codified, from 2007 through 2010, and the allowed
adjustments to be made to the budget neutrality calculation are
identified.
Provisions Affecting HI Only
• The current Medicare Dependent Hospital Program is extended for
5 years (from 2006 to 2011). For hospitals in this program,
enhanced payment is provided for the amount by which their target
amounts exceed the prospective payment system rate. In addition,
such hospitals are permitted to use 2002 as the base year for
payment purposes and are exempt from the cap on Medicare DSH
payments.
• For cost reporting periods beginning on or after October 1, 2005,
the payment amount for Medicare-allowable skilled nursing facility
(SNF) bad debt is reduced from 100 percent to 70 percent, except
for the bad debt attributable to beneficiaries eligible for both
Medicare and Medicaid.
• The phase-in of the classification criteria for inpatient
rehabilitation facilities under the Medicare program is modified.
For cost reporting periods beginning during the 12-month period
beginning on July 1, 2006, the compliance threshold is 60 percent
(formerly 65 percent); for cost reporting periods beginning during
the 12-month period beginning on July 1, 2007, the compliance
threshold is 65 percent (formerly 75 percent); and for cost reporting
periods beginning on or after July 1, 2008, the compliance
threshold is 75 percent.
Provisions Affecting SMI Only
• For capped rental DME items furnished on or after January 1, 2006, the period of payment is revised from 15 months to 13 months. After 13 months, the beneficiary owns the capped rental DME item, and Medicare pays for reasonable and necessary maintenance and servicing of the item. For beneficiaries starting to rent oxygen equipment on or after January 1, 2006, a new 36-month rental period is provided. For beneficiaries who began renting the equipment prior to January 1, 2006, the 36-month rental period begins on January 1, 2006. After the 36th month, the beneficiary owns the oxygen equipment, and Medicare is required to pay for reasonable and necessary maintenance and servicing on the equipment. After the beneficiary owns oxygen tanks, cylinders, or portable equipment, Medicare continues to pay for oxygen contents.

Appendices
158
• Effective January 1, 2007, payment under the physician fee schedule for performing certain imaging services is limited to the payment amount determined under the outpatient prospective payment system. The payment rate for interpretation of the image is not affected. Reductions in payments for multiple imaging procedures (including 2006 reductions) are exempted from budget neutrality requirements.
• Payments for services provided in ambulatory surgical centers prior to the implementation of the revised payment system (which is to begin no later than January 1, 2008) are limited to the fee schedule amount determined under the outpatient prospective payment system, effective January 1, 2007.
• For services under the physician fee schedule, the conversion factor is frozen for 2006, resulting in a 0.2-percent update to the physician fee schedule in 2006.44 The legislated update for 2006 shall not be considered a change in law or regulation for purposes of the sustainable growth rate system. By March 1, 2007, MedPAC is required to submit a report to Congress on mechanisms that could replace the SGR.
• A portion of the hold harmless protection that ensures that rural hospitals with fewer than 100 beds do not receive less under the outpatient prospective payment system (OPPS) than they would have received under the reasonable cost payment system is extended through 2008, effective January 1, 2006. Payments will be 95 percent of the difference between the OPPS amount and the reasonable cost amount in 2006, 90 percent in 2007, and 85 percent in 2008.
• The amount of the composite rate component of payment for dialysis services furnished on or after January 1, 2006 is increased by 1.6 percent.
• Exceptions to the financial limits on therapy services are allowed for those services furnished in 2006 that are determined to be medically necessary. In addition, beginning July 1, 2006, clinically appropriate code edits, including edits for clinically illogical combinations of procedures codes and other edits to control and eliminate improper payments, are required for therapy services.
• The phase-in of the income-related Part B premium is shortened
from 5 years to 3 years, beginning January 1, 2007.
44Changes in relative value units (RVUs), which increased the average RVU by about
0.2 percent in 2006, result in a physician fee schedule update of 0.2 percent.

Per Beneficiary Cost
159
B. AVERAGE MEDICARE EXPENDITURES PER
BENEFICIARY
Table V.B1 shows historical average per beneficiary expenditures for
HI and SMI, as well as projected costs for calendar years 2006
through 2015 under the intermediate assumptions.
For both HI and SMI Part B, costs increased very rapidly in the early
years when Medicare was still a new program and as a result of the
rapid inflation of the 1970s and early 1980s. In addition, the cost-
based reimbursement mechanisms in place provided relatively little
incentive for efficiency in the provision of health care. Growth in
average HI expenditures moderated dramatically following the
introduction of the inpatient hospital prospective payment system in
fiscal year 1984 but accelerated again in the late 1980s and early
1990s due to rapid growth in skilled nursing and home health
expenditures. During this same period, SMI Part B average costs
generally continued to increase at relatively fast rates but slowed
somewhat in the early 1990s with the implementation of physician
fee reform legislation.
Expenditure growth moderated again during the late 1990s due to
the effects of further legislation, including the Balanced Budget Act of
1997 (BBA), and efforts to control fraud and abuse. In addition,
historically low levels of general and medical inflation helped reduce
Medicare payment updates. HI per beneficiary costs actually
decreased in 1998, 1999, and 2000, in part because of such BBA
mandates as a reduction in payment updates to providers and a shift
in home health benefits from HI to SMI Part B, and because of a
decline in utilization of services.

Appendices
160
Table V.B1.—HI and SMI Average per Beneficiary Costs
Calendar year
Average per beneficiary costs Average percent change1
HI
SMI
Total HI
SMI
Total Part B Part D Part B Part D
Historical data: 1970 $255 $101 — $356 13.4 % 14.8 % — 13.8 % 1975 462 180 — 642 12.6 12.2 — 12.5 1980 895 390 — 1,285 14.1 16.7 — 14.9 1985 1,554 768 — 2,322 11.7 14.5 — 12.6 1990 1,963 1,304 — 3,267 4.8 11.2 — 7.1 1995 3,130 1,823 — 4,953 9.8 6.9 — 8.7 1996 3,412 1,900 — 5,312 9.0 4.2 — 7.2 1997 3,616 1,996 — 5,612 6.0 5.1 — 5.7 1998 3,483 2,071 — 5,554 −3.7 3.7 — −1.0 1999 3,322 2,180 — 5,502 −4.6 5.3 — −0.9 2000 3,272 2,381 — 5,653 −1.5 9.2 — 2.7 2001 3,559 2,646 — 6,205 8.8 11.1 — 9.8 2002 3,743 2,922 — 6,664 5.2 10.4 — 7.4 2003 3,733 3,209 — 6,943 −0.2 9.8 — 4.2 2004 4,043 3,452 — 7,496 8.3 7.6 — 8.0 2005 4,284 3,768 — 8,052 6.0 9.2 — 7.4
Intermediate estimates: 2006 4,618 4,235 $1,832 10,685 7.8 12.4 — 32.7 2007 4,785 4,351 1,969 11,106 3.6 2.8 7.5 % 3.9 2008 5,018 4,585 2,118 11,721 4.9 5.4 7.5 5.5 2009 5,271 4,818 2,269 12,357 5.0 5.1 7.1 5.4 2010 5,525 5,021 2,451 12,997 4.8 4.2 8.0 5.2 2011 5,775 5,209 2,640 13,623 4.5 3.7 7.7 4.8 2012 6,009 5,401 2,840 14,250 4.1 3.7 7.6 4.6 2013 6,252 5,607 3,046 14,906 4.0 3.8 7.3 4.6 2014 6,515 5,825 3,271 15,612 4.2 3.9 7.4 4.7 2015 6,761 6,032 3,512 16,305 3.8 3.6 7.4 4.4
1Percent changes for 1970 represent the average annual increases from 1967 (the first full year of trust
fund operations) through 1970. Similarly, percent changes shown for 1975, 1980, 1985, 1990, and 1995 represent the average annual increase over the 5-year period ending in the indicated year.
On average, annual increases in per beneficiary costs have been
greater for SMI Part B than for HI during the previous 3 decades—by
approximately 1.0 percent, 4.7 percent, and 1.0 percent per year in
the 1970s, 1980s, and 1990s, respectively. This trend continued
through 2003, in part due to the shift of certain home health services
from HI to SMI Part B, which was completed in 2003. For 2006, the
projected SMI Part B increase is higher than the HI increase as a
result of the legislated change in the physician update. For the period
2007-2015, the projected SMI Part B increases are substantially
understated as a result of the current-law physician updates. Under
the Sustainable Growth Rate system (SGR), physician payment
updates are projected to be about −5 percent for at least 9 consecutive
years, 2007-2015. Legislation to prevent or ameliorate such an
outcome is highly likely. Note that the large growth in the 1970s and
1980s is not expected to recur for either HI or SMI Part B, due to
more moderate inflation rates and the conversion of Medicare‟s
remaining cost-based reimbursement mechanisms to prospective

Per Beneficiary Cost
161
payment systems as part of the Balanced Budget Act of 1997, and due
to the physician updates under the SGR.
Although SMI Part D coverage began in 2004, the most significant
provisions dealing with prescription drugs did not start until 2006.
For the purposes of this discussion, only the per beneficiary
expenditures for prescription drugs will be included. As table V.B1
indicates, average annual increases in per beneficiary costs for Part D
are expected to be between 2 to 4 percent greater than for HI or SMI
Part B for the period 2008-2015. With the inclusion of the Part D
costs in the Medicare total, total Medicare per beneficiary cost growth
is expected to be around 0.5 percent higher over the 2006-2015 period
than it otherwise would be.
Appendices
162
C. MEDICARE COST SHARING AND PREMIUM AMOUNTS
HI beneficiaries who use covered services may be subject to
deductible and coinsurance requirements. A beneficiary is responsible
for an inpatient hospital deductible amount, which is deducted from
the amount payable by the HI trust fund to the hospital, for inpatient
hospital services furnished in a spell of illness. When a beneficiary
receives such services for more than 60 days during a spell of illness,
he or she is responsible for a coinsurance amount equal to one-fourth
of the inpatient hospital deductible for each of days 61-90 in the
hospital. After 90 days in a spell of illness, each individual has
60 lifetime reserve days of coverage, for which the coinsurance
amount is equal to one-half of the inpatient hospital deductible. A
beneficiary is responsible for a coinsurance amount equal to one-
eighth of the inpatient hospital deductible for each of days 21-100 of
skilled nursing facility services furnished during a spell of illness.
Most persons aged 65 and older and many disabled individuals under
age 65 are insured for HI benefits without payment of any premium.
The Social Security Act provides that certain aged and disabled
persons who are not insured may voluntarily enroll, subject to the
payment of a monthly premium. In addition, since 1994, voluntary
enrollees may qualify for a reduced premium if they have at least
30 quarters of covered employment.
Table V.C1 shows the historical levels of the HI deductible,
coinsurance amounts, and premiums, as well as projected values for
future years based on the intermediate set of assumptions used in
estimating the operations of the trust funds. Certain anomalies in
these values resulted from specific trust fund features in particular
years (for example, the effect of the Medicare Catastrophic Coverage
Act of 1988 on 1989 values). The values listed in the table for future
years are estimates, and the actual amounts are likely to be
somewhat different as experience emerges.

Cost Sharing and Premiums
163
Table V.C1.—HI Cost Sharing and Premium Amounts
Year Inpatient hospital
deductible1
Inpatient coinsurance1
SNF coinsurance days
1
Monthly premium
Days 61-90 Lifetime
reserve days Standard2 Reduced
1
Historical data: 1967 $40 $10 — $5.00 — — 1968 40 10 $20 5.00 — — 1969 44 11 22 5.50 — — 1970 52 13 26 6.50 — — 1971 60 15 30 7.50 — — 1972 68 17 34 8.50 — — 1973 72 18 36 9.00 $33 — 1974 84 21 42 10.50 36 — 1975 92 23 46 11.50 40 — 1976 104 26 52 13.00 45 — 1977 124 31 62 15.50 54 — 1978 144 36 72 18.00 63 — 1979 160 40 80 20.00 69 — 1980 180 45 90 22.50 78 — 1981 204 51 102 25.50 89 — 1982 260 65 130 32.50 113 — 1983 304 76 152 38.00 113 — 1984 356 89 178 44.50 155 — 1985 400 100 200 50.00 174 — 1986 492 123 246 61.50 214 — 1987 520 130 260 65.00 226 — 1988 540 135 270 67.50 234 — 1989
3 560 — — 25.50 156 —
1990 592 148 296 74.00 175 — 1991 628 157 314 78.50 177 — 1992 652 163 326 81.50 192 — 1993 676 169 338 84.50 221 — 1994 696 174 348 87.00 245 $184 1995 716 179 358 89.50 261 183 1996 736 184 368 92.00 289 188 1997 760 190 380 95.00 311 187 1998 764 191 382 95.50 309 170 1999 768 192 384 96.00 309 170 2000 776 194 388 97.00 301 166 2001 792 198 396 99.00 300 165 2002 812 203 406 101.50 319 175 2003 840 210 420 105.00 316 174 2004 876 219 438 109.50 343 189 2005 912 228 456 114.00 375 206 2006 952 238 476 119.00 393 216
Intermediate estimates: 2007 $1,000 $250 $500 $125.00 $413 $227 2008 1,052 263 526 131.50 433 238 2009 1,104 276 552 138.00 454 250 2010 1,160 290 580 145.00 475 261 2011 1,216 304 608 152.00 495 272 2012 1,272 318 636 159.00 514 283 2013 1,332 333 666 166.50 534 294 2014 1,392 348 696 174.00 554 305 2015 1,456 364 728 182.00 576 317 1Amounts shown are effective for calendar years.
2Amounts shown for 1967-1982 are for the 12-month periods ending June 30; amounts shown for 1983
are for the period July 1, 1982 through December 31, 1983; amounts shown for 1984 and later are for calendar years. 3Anomalies in the 1989 values are due to the Medicare Catastrophic Coverage Act of 1988. Most of the
provisions of the Act were repealed the following year.

Appendices
164
The Federal Register notice announcing the HI deductible and
coinsurance amounts for 2006 included an estimate of the aggregate
cost to HI beneficiaries for the changes in the deductible and
coinsurance amounts from 2005 to 2006. At the time the notice was
published, it was estimated that in 2006 there will be 8.70 million
inpatient deductibles paid at $952 each, 2.23 million inpatient days
subject to coinsurance at $238 per day (for hospital days 61 through
90), 1.04 million lifetime reserve days subject to coinsurance at
$476 per day, and 31.92 million extended care days subject to
coinsurance at $119 per day. Similarly, it was estimated that in 2005
there would be 8.91 million deductibles paid at $912 each,
2.28 million days subject to coinsurance at $228 per day (for hospital
days 61 through 90), 1.06 million lifetime reserve days subject to
coinsurance at $456 per day, and 32.84 million extended care days
subject to coinsurance at $114 per day. Therefore, the total increase
in cost to beneficiaries was estimated to be $230 million, due to (i) the
increase in the inpatient deductible and coinsurance amounts, and
(ii) the change in the number of deductibles and daily coinsurance
amounts paid.
Table V.C2 displays the SMI cost-sharing and premium amounts for
Parts B and D. The projected values for future years are based on the
intermediate set of assumptions used in estimating the operations of
the Part B and Part D accounts. As a result, these values are
estimates, and the actual amounts are likely to be somewhat different
as experience emerges. In particular, the Part B premium for
2007-2009 shows very little growth, and the Part B deductible for
2007-2009 is projected to remain the same for all 3 years. This
leveling out is a result of the current-law physician payment system
combined with the large increase required for the 2006 financing in
order to take a step toward restoring the Part B account assets. Note
that the current-law physician payment updates and the resultant
current-law Part B financing rates are very unlikely to occur before
legislative changes intervene, as legislation has overridden the
scheduled negative updates for 2003-2006.

Cost Sharing and Premiums
165
Table V.C2.—SMI Cost Sharing and Premium Amounts
Calendar year
Part B Part D
Monthly premium
1
Annual deductible
2
Base beneficiary premium Deductible
Initial benefit limit
Catastrophic threshold
1967 $3.00 $50 — — — — 1968 4.00 50 — — — — 1969 4.00 50 — — — — 1970 4.00 50 — — — — 1971 5.30 50 — — — — 1972 5.60 50 — — — — 1973 5.80 60 — — — — 1974 6.30
3 60 — — — —
1975 6.70 60 — — — — 1976 6.70 60 — — — — 1977 7.20 60 — — — — 1978 7.70 60 — — — — 1979 8.20 60 — — — — 1980 8.70 60 — — — — 1981 9.60 60 — — — — 1982 11.00 75 — — — — 1983 12.20 75 — — — — 1984 14.60 75 — — — — 1985 15.50 75 — — — — 1986 15.50 75 — — — — 1987 17.90 75 — — — — 1988 24.80 75 — — — — 1989
4 31.90 75 — — — —
1990 28.60 75 — — — — 1991 29.90 100 — — — — 1992 31.80 100 — — — — 1993 36.60 100 — — — — 1994 41.10 100 — — — — 1995 46.10 100 — — — — 1996 42.50 100 — — — — 1997 43.80 100 — — — — 1998 43.80 100 — — — — 1999 45.50 100 — — — — 2000 45.50 100 — — — — 2001 50.00 100 — — — — 2002 54.00 100 — — — — 2003 58.70 100 — — — — 2004 66.60 100 — — — — 2005 78.20 110 — — — — 2006 88.50 124 $32.20 $250 $2,250 $3,600
Intermediate estimates: 2007 98.20 138 35.86 265 2,400 3,850 2008 98.20 138 37.19 285 2,580 4,150 2009 98.30 138 39.64 310 2,770 4,450 2010 102.20 143 42.39 330 2,980 4,750 2011 105.90 148 45.36 355 3,200 5,100 2012 109.80 153 48.52 380 3,440 5,500 2013 113.90 159 52.04 410 3,700 5,900 2014 117.80 165 55.82 445 3,990 6,400 2015 122.40 171 59.88 475 4,290 6,850 1Amounts shown for 1967-1982 are for the 12-month periods ending June 30; amounts shown for 1983
are for the period July 1, 1982 through December 31, 1983; amounts shown for 1984 and later are for calendar years. 2Prior to the Medicare Modernization Act (MMA), the Part B deductible was fixed by statute and had only
occasionally been adjusted. The MMA raised the deductible to $110 in 2005 and specified that it be indexed by average per-beneficiary Part B expenditures thereafter. 3In accordance with limitations on the costs of health care imposed under Phase III of the Economic
Stabilization program, the standard premium rates for July and August 1973 were set at $5.80 and $6.10, respectively. Effective September 1973, the rate increased to $6.30.

Appendices
166
4Anomalies in the 1989 values are due to the Medicare Catastrophic Coverage Act of 1988. Most of the
provisions of the Act were repealed the following year.
The Part B monthly premiums displayed in table V.C2 are the
standard premium rates paid by most Part B enrollees. However,
there are three provisions that alter the premium rate for certain
Part B enrollees. First, there is a premium surcharge for those
beneficiaries who enroll after their initial enrollment period. Second,
beginning in 2007, there is a higher “income-related” premium for
those individuals whose modified adjusted gross income exceeds a
specified threshold. Those individuals exceeding the threshold will
pay premiums covering 35, 50, 65, or 80 percent of the average
program cost for aged beneficiaries, depending on their income level,
compared to the standard premium covering 25 percent. In 2007 the
threshold will be $80,000 for an individual tax return and $160,000
for a joint return. The thresholds will be indexed to inflation in
subsequent years. These higher income-related premiums will be
phased in over the 3-year period 2007-2009. Finally, the “hold-
harmless” provision lowers the premium rate for certain individuals
who have their premiums deducted from their Social Security checks.
On an individual basis, this provision limits the dollar increase in the
Part B premium to the dollar increase in the individual‟s Social
Security check. As a result, the person affected pays a lower Part B
premium, and the net amount of the individual‟s Social Security
check does not decrease despite the greater increase in the premium.
Most services under Part B are subject to an annual deductible and
coinsurance. The annual deductible has been set in statute through
2005. Thereafter, it will increase with the increase in the Part B aged
actuarial rate to approximate the growth in per capita Part B
expenditures. After meeting the deductible, the beneficiary pays an
amount equal to the product of the coinsurance percentage and the
remaining allowed charges. The coinsurance percentage is 20 percent
except for outpatient psychiatric services, which have a 50-percent
coinsurance, and most services currently reimbursed under the
outpatient hospital prospective payment system (OPPS). Under the
OPPS, the coinsurance percentage varies by service but currently
falls in the range of 20-50 percent. The OPPS coinsurance
percentages will gradually decrease over time until they reach
20 percent for each OPPS service. For those services not subject to
either the deductible or coinsurance (clinical lab tests, home health
agency services, and some preventive care services), the beneficiary
pays nothing.

Cost Sharing and Premiums
167
The Part D average premiums displayed in table V.C2 are the
estimated base beneficiary premiums. For 2006, the base beneficiary
premium was calculated by giving each plan bid an equal weight. The
actual premium a beneficiary pays will vary according to the plan in
which the beneficiary is enrolled. Some will pay lower premiums than
those displayed in table V.C2, and others will pay more. The average
premium rate that beneficiaries will pay in 2006 is estimated to be
roughly $25. After 2006, the base beneficiary premium will be
calculated as a weighted average of the plan bids using the actual
enrollment from the prior year as the weight. It is estimated that the
average premium rate beneficiaries will pay in 2007 is $32. For 2008
and beyond, the weights are expected to stabilize, therefore, the
estimated average premium rate paid is equal to the base beneficiary
premium.
As with Part B, there is a late enrollment penalty for those
beneficiaries enrolling after their initial enrollment period.
Furthermore, there are premium and cost-sharing subsidies for those
beneficiaries with incomes less than 150 percent of the Federal
poverty level and with assets in 2006 less than $10,000 for an
individual and $20,000 for a couple. The asset figures will be indexed
in subsequent years by the CPI.
Under standard Part D coverage, there is an initial deductible. After
meeting the deductible, the beneficiary pays 25 percent of the
remaining costs up to the initial benefit limit. Beyond this limit, the
beneficiary pays all the drug costs until his or her total out-of-pocket
expenditures reach the catastrophic threshold. (Included in this total
are the deductible and coinsurance payments for expenses up to the
initial benefit limit.) Thereafter, the beneficiary pays the greater of
(i) 5 percent of the drug cost, or (ii) $2 for generic or preferred
multiple-source drugs or $5 for preferred single-source drugs. The
latter copayment amounts are indexed annually by per enrollee
Part D average costs. Beneficiaries qualifying for the Part D
low-income subsidy pay substantially reduced premium and
cost-sharing amounts. Many Part D plans offer alternative coverage
that differs from the standard coverage described above. In fact, the
majority of beneficiaries were not enrolled in the standard benefit
design, but rather have enrolled in plans with low or no deductibles,
flat payments for covered drugs, and in some cases, partial coverage
in the coverage gap.

Appendices
168
D. SUPPLEMENTARY ASSESSMENT OF UNCERTAINTY
IN PART B COST PROJECTIONS
This appendix presents an additional way to help assess the
uncertainty of Part B cost projections. It is intended to supplement
the traditional methods of examining such uncertainty and to
illustrate the potential value of stochastic techniques. The analysis
offered here uses statistical methods to help quantify the range and
likelihood of future Part B costs and trust fund assets and should be
viewed as a tentative application of stochastic techniques to the
Part B financial projections, subject to refinement over time as more
data become available.
1. Background
Financial projections, including those for Medicare, are necessarily
uncertain because the future is unknown. Medicare projections
depend on numerous assumptions, as outlined in sections II.D and
IV.B.1 of this report. Variations between actual future cost factors
(for example, growth in the utilization of medical services) and the
corresponding assumptions will almost always cause future costs to
vary from the estimate.
Uncertainty in Medicare costs is traditionally illustrated by using
three alternative sets of assumptions (intermediate, high cost, and
low cost). The high cost alternative assumes a faster growth rate in
Part B expenditures in every year. Similarly, the low cost alternative
assumes slower growth rates in all years. These growth differentials
are set deterministically, to illustrate the impact on Part B costs of
sustained faster or slower growth that could reasonably be expected
to occur. Using the traditional methodology alone, it is not possible to
quantify the probability of either outcome or the likelihood of a future
result outside of the range defined by the high cost and low cost
alternatives.
From time to time, expert panels of actuaries and economists convene
to review the assumptions and methodology underlying the Medicare
and Social Security Trustees Reports. Several of the past expert
panels have recommended consideration of alternative analytical
techniques to supplement the current methodology for assessing the
uncertainty in cost projections and to add insight into the potential
range of future variation. The 1991 Advisory Council Technical Panel
on Social Security recommended the “development of methods to
quantify the uncertainty of short- and long-range forecasts, both for
particular assumptions and projections.” Similarly, the 1994-95

Supplementary Assessment of Uncertainty
169
Advisory Council Technical Panel recommended that “stochastic
analysis should be used to examine more explicitly the probabilities of
alternative projections.” The 1999 Social Security Advisory Board
Technical Panel agreed, stating that they “follow previous panels in
strongly recommending efforts toward stochastic modeling or similar
techniques that are better able to capture the interrelationships
among assumptions.” They added, “what we seek is a method of
displaying to policy makers and the public just how uncertain is some
average cost outcome or date of exhaustion of the Trust Funds, and
what are the probabilities that events will be close to or far away
from that result.” In their review of the Trustees Reports, the 2000
Medicare Technical Review Panel recommended the continued use of
stochastic methods for Medicare and noted that “although stochastic
modeling is complicated, it can result in enhanced insight into the
uncertainty associated with health care cost projections.”
The projections shown in this appendix represent the application of
such techniques to the short-range Part B cost projections.
2. Methodology
For health care cost projections, the most critical assumption is
generally the rate of increase in average per beneficiary medical
costs.45 In the past there have been wide variations in such growth
rates for Part B. The statistical methods employed here (also referred
to as “stochastic” projection techniques) measure past variation in per
beneficiary growth rates relative to the average and assume that
similar variation will occur in the future, relative to the intermediate
growth rate assumptions for the short-range projection period.
Past variations in benefit expenditure growth rates are examined
separately by service type (for example, physician, hospital, and home
health) and by eligibility category (aged, disabled, or end-stage renal
disease), using data from the first quarter of 1991 through the third
quarter of 2005. For each future year, these variations are combined
statistically to develop a measure of variation in total Part B benefit
expenditures per beneficiary.46 Individual 10-year projection scenarios
45Such cost increases reflect changes in (i) the prices of specific medical services, (ii) the
utilization of services, and (iii) the average complexity or “intensity” of services. 46For this calculation, variation in each service category is weighted by the expected
level of benefit expenditures per beneficiary for that category for the year. The
calculation also reflects the “covariances” among the different categories—for example,
the probability that a faster-than-average increase in physician expenditures would be
associated with an above-average increase in spending for diagnostic laboratory tests,
outpatient hospital procedures, and other services.

Appendices
170
are generated by randomly selecting each year‟s per beneficiary
Part B cost increase from a frequency distribution of increases based
on past variation and the intermediate growth rate assumption for
the given year.47 Two thousand short-range scenarios are generated
and benefit expenditures are projected for each individual scenario. A
distribution of the resulting cost projections is calculated and used to
assess the possible variation in future expenditure levels and trust
fund operations.
The stochastic approach provides several potential benefits to
supplement the traditional projections. This method provides an
estimated probability of occurrence for various possible outcomes,
rather than just an illustrative outcome. For example, the likelihood
that Part B expenditures would exceed a specified level within
10 years can be estimated using stochastic techniques. Similarly, the
likelihood of an abrupt decline in assets in the Part B account of the
SMI trust fund can be evaluated using these techniques, as
illustrated in section V.D3 of this appendix.
The projections shown in this appendix should be considered only as
an attempt to augment the traditional projections that are made for
Part B. The method presented, like any projection model, is only a
tool; it can provide useful—but limited—information regarding an
unknowable future. Stochastic techniques can improve our
understanding of possible future developments but cannot
“guarantee” any specific outcome. In particular:
• The stochastic techniques used here rely heavily on past
experience. The future may differ from the past in fundamental
ways that generally cannot be anticipated or reflected in a
statistical model. For example, most of the past experience
underlying the statistical model is drawn from years that precede
implementation of the Part B outpatient hospital prospective
payment system (which started in August 2000). The range of
future variation in outpatient hospital expenditures (and total
Part B costs) may therefore differ from what is reflected in the
model. A similar and potentially much more serious limitation is
that available past experience does not include a catastrophe such
as a bird flu pandemic. The stochastic forecast, consequently, does
not reflect such a possibility.
47These future increases are assumed to be normally distributed, based on the
near-normality of past increases about their average.

Supplementary Assessment of Uncertainty
171
• Actual Part B payment operations are very complex. The
stochastic model used is a simplification of real-world
relationships and may not be sufficiently sophisticated to match
future behavior. Many possible models could be used; the one
employed here may not be the best model possible (if there indeed
is a unique “best” model).
• The model is based on the underlying data. A limited number of
years of data are available, and the data can be subject to
problems, such as measurement errors or inconsistent definitions
over time. Any such problems would, of course, affect the model.
• Potential variations in costs due to factors other than growth in
per beneficiary expenditures are not considered. For example,
longer life expectancies or variations in net immigration could
affect the total number of Part B beneficiaries and therefore total
expenditures.
• Finally, the methodology described here models future
expenditure uncertainty on the assumption that the intermediate
assumptions produce the most likely future year-by-year cost
increases. Actual future growth rates could, on average, differ
from these assumptions.
For these reasons, the stochastic projections shown in this appendix
should be viewed cautiously and used with awareness of their
limitations.48 Many refinements to the methodology are possible. For
example, the assumed average future cost increases could be allowed
to differ from the increases of the intermediate assumptions. Also,
separate cost increases could be generated by type of service rather
than in aggregate. Other factors, such as the demographic
assumptions, could be allowed to vary rather than just the per
beneficiary Part B cost increases.
3. Results
The shaded region in figure V.D1 illustrates the range within which
future Part B benefit expenditures are estimated to occur 95 percent
of the time, based on the stochastic projections. In other words, actual
future expenditures in a given year would be expected to exceed the
48Many of these limitations also apply to the traditional projection methods used in the
annual Trustees Report and, indeed, to virtually any estimation technique. Different
methods have different relative advantages and disadvantages. Use of multiple
techniques has the potential to improve our overall understanding of possible future
developments.

Appendices
172
upper bound only 2.5 percent of the time or to fall below the lower
bound 2.5 percent of the time.49
Figure V.D1.—95-Percent Projection Interval for Part B Incurred Benefits [In billions]
$0
$50
$100
$150
$200
$250
$300
$350
$400
$450
2004 2005 2006 2007 2008 2009 2010 2011 2012 2013 2014 2015
Calendar year
Incurred
benefits
95-percent projection interval
(shaded area)
High cost
Low cost
Intermediate
For comparison, the benefit levels projected under the intermediate,
high cost, and low cost alternatives are also shown in figure V.D1.
With both projection methodologies, the range of benefits widens as
the projections move further into the future, reflecting increasing
uncertainty. The high cost alternative is initially well below the
upper bound for the 95-percent stochastic projection interval but
passes the upper bound by 2012 and stays above it through the
remainder of the 10-year projection period. In contrast, the low cost
alternative exceeds the lower bound for the 95-percent interval
initially and nearly reaches the boundary by 2015. The intermediate
estimate is similar to the 50th percentile of the stochastic
distribution, as one would anticipate because the stochastic analysis
is tied to the intermediate assumptions as the expected case.
The levels of Part B benefits corresponding to various percentiles
from the stochastic benefit distribution are shown in table V.D1. The
percentiles represent the estimated probabilities that actual future
Part B expenditures in a given year would be less than or equal to the
expenditure amount shown. For example, the stochastic projections
49These estimated probabilities apply to a given projection year and not to all years
simultaneously. Based on the stochastic model, the probability of costs exceeding the
upper 95-percent limit in all 10 years would be substantially smaller than 2.5 percent.

Supplementary Assessment of Uncertainty
173
suggest a 5-percent probability that expenditures would be
$241.5 billion or less in 2015. Similarly, there is an estimated
50-50 probability that expenditures in 2015 would be lower—or
higher—than the 50th-percentile projection of $295.9 billion (also
known as the median projection).
Table V.D1.—Estimated Incurred Part B Benefit Expenditures, by Percentile of Projection Distribution
[In billions]
Calendar year
Percentiles
2.5 5.0 50.0 95.0 97.5
2005 $148.9 $149.5 $152.9 $156.3 $157.1 2006 157.2 158.8 168.9 179.2 180.9 2007 159.3 161.8 177.1 192.6 196.2 2008 166.6 170.1 190.2 211.4 216.4 2009 174.5 178.2 203.2 230.2 234.8 2010 182.5 186.9 215.0 248.3 254.5 2011 190.5 195.1 228.1 266.1 275.0 2012 199.5 205.1 243.4 287.0 295.0 2013 209.0 216.1 260.2 311.3 319.8 2014 221.3 229.5 277.6 334.5 345.0 2015 231.8 241.5 295.9 361.5 374.3
Note: Intermediate estimates are similar to the 50th-percentile benefits. See section IV.B for specific
expenditure projections under the intermediate assumptions.
Table V.D2 presents the stochastic percentiles that correspond to the
traditional intermediate, high, and low cost projections. For example,
based on the stochastic model, the estimated probability that Part B
expenditures in 2007 would be less than the low cost projection is
23.5 percent. Similarly, the estimated probability that costs would be
at or below the high cost projection in 2010 is 91.1 percent.
As noted before, these probabilities are estimated, based on the
statistical methods described in the previous section, and are subject
to the various limitations inherent in such methods. Accordingly, the
estimates provide a reasonable guide to possible outcomes but could
be invalidated by unanticipated changes.
Table V.D2.—Percentiles of Part B Benefit Expenditure Distribution Corresponding to Low, Intermediate, and High Cost Estimates
Calendar year Low cost Intermediate High cost
2005 50.9 % 50.9 % 50.9 % 2006 30.4 49.4 70.2 2007 23.5 51.0 77.8 2008 18.3 50.8 84.2 2009 14.3 51.9 83.8 2010 11.6 52.4 91.1 2011 8.5 51.7 96.6 2012 7.0 50.7 98.2 2013 6.1 50.6 98.5 2014 4.3 50.3 98.7 2015 4.0 50.9 98.9
The comparison of projection results in figure V.D1 and table V.D2
indicates that the lower range of the 95-percent stochastic projection

Appendices
174
is initially lower than the level of the low cost alternatives. Toward
the end of the 10-year projection period, however, the levels are
comparable. Similarly, the upper range of the 95-percent stochastic
projection is initially higher than the level of the high cost
alternatives. Toward the end of the 10-year projection period,
however, the level of the high cost alternative is higher than the
upper range of the 95-percent stochastic projection. This result
illustrates the different natures of the two projection methodologies.
The high and low cost alternatives assume expenditure increases of
roughly 2 percent higher or lower, respectively, than the intermediate
assumption in every year .50 In con trast , Par t B growth rates under the
stochastic projection can vary randomly by as much as 8 percentage
points higher or lower than the intermediate assumption for a specific
year. Thus, the stochastic projections suggest that the uncertainty of
future Part B expenditures is somewhat greater over the next few
years than illustrated by the traditional alternative projections. Over
longer periods, however, the probability diminishes that Part B costs
would increase 2 percent faster (or slower) than the intermediate
assumption in every year. The stochastic model estimates that, by the
end of the 10-year period, the likelihood of costs exceeding the high
cost projection is small (1.1 percent) and that the probability of falling
below the low cost alternative is also small (4.0 percent).
The statistical methodology described in this appendix can also be
used to help assess the adequacy of financing and assets for the
Part B account of the SMI trust fund. As noted elsewhere in this
report, Part B is considered to be automatically in financial balance
because premium and general revenue financing levels are
reestablished annually to match expected expenditures for the
following year. Thus, in contrast to OASDI and HI, where financing
can be changed only through legislation, Part B should always be
adequately financed so long as premiums and general revenue levels
are accurately set and an adequate trust fund balance is maintained.
In this regard, the stochastic methods used in this appendix can help
determine if an unexpected major change in Part B expenditure levels
is likely and whether such a change could jeopardize asset adequacy
prior to the next premium determination. This assessment can be
used to evaluate the sufficiency of existing procedures for setting
premiums and the adequacy of traditional trust fund reserve targets.
The assets of the Part B account of the SMI trust fund should be
sufficient at any time to cover the costs of covered services that have
50A more detailed description of the high and low cost assumptions is given in
section IV.B.

Supplementary Assessment of Uncertainty
175
been performed but not yet reimbursed (referred to as “incurred but
unpaid” claims). In addition, assets should be sufficient to prevent
account depletion in the event of unexpectedly high expenditures. The
adequacy of the Part B account of the SMI trust fund for these
purposes is generally measured by comparing the account‟s assets
minus liabilities (for the incurred but unpaid claims) with
expenditures for the following year, as described in more detail in
section III.C2. Premium rates and matching general fund transfers
are set each year based on estimates of the following 2 years‟
expenditures.51 The sensitivity of the asset reserve ratio to above- or
below- average expenditure growth over the 2 years can be evaluated
using the stochastic projections.
The estimated financial status of the Part B account of the SMI trust
fund, based on the stochastic projections, is shown in figure V.D2.
This graph displays the 95-percent projection interval for the ratio of
trust fund assets less liabilities at the end of a year to the following
year‟s expenditures. The results show a reasonable range of surplus
values over the 10-year period, reflecting the annual redetermination
of Part B premiums and general revenue financing. If expenditure
levels begin to drift away from expectations, financing is adjusted for
the following year, thereby minimizing the degree to which fund
assets would depart from desired levels. The figure also illustrates (i)
the past decline in the reserve ratio attributable primarily to several
years of legislation increasing Part B costs after the financing had
been determined for the year, and (ii) the intentional movement from
the existing financial status toward the desired reserve level of
approximately 15 to 20 percent of the following year‟s expenditures.
Figure V.D2 also indicates the current, very low level of assets less
liabilities. Adverse experience or further legislation to increase
physician payments could only be financed by further large increases
in the Part B premium and general revenue transfers—assets are
currently at too low a level to cover deficits for other than a very short
period.
The stochastic projections shown in figure V.D2 suggest that the
target reserve level and annual redetermination of Part B financing
should be sufficient to prevent the assets of the Part B account of the
SMI trust fund from falling below acceptable levels. The lower bound
of the 95-percent range remains in the vicinity of 10 percent after
51Expenditures in the following year determine the level of assets and liabilities at the
end of that year; expenditures in the second year are used in the denominator of the
trust fund reserve ratio and thus affect the level of this ratio.

Appendices
176
2006. Thus, with a target fund ratio of 15 to 20 percent, faster-than-
expected expenditure growth appears unlikely to result in actual
levels below 10 percent. The supplementary assessment of
uncertainty, based on the statistical approach shown in this
appendix, supports the existing standards for ensuring fund solvency.
Figure V.D2.—95-Percent Projection Interval for Financing Status of Part B Account of SMI Trust Fund
0%
5%
10%
15%
20%
25%
30%
35%
40%
45%
50%
55%
60%
65%
70%
2003 2004 2005 2006 2007 2008 2009 2010 2011 2012 2013 2014 2015
Calendar year
Tru
stfu
nd
surp
lus
as
aperc
entof
nextyear's
expenditure
s
Intermediate
95-percent projection interval
(shaded area)
As noted previously, Part B financing is set for a future year based on
projections of benefit expenditures. For example, the monthly
premium and corresponding general fund transfers for 2006 were set
in 2005 based on projections of benefit expenditures for 2006 and
2007. In practice, however, the actual benefit levels are likely to differ
from those expected when the financing is determined. Although a
specific reserve asset level is anticipated, the subsequent actual level
will invariably differ. Figure V.D3 shows an estimated frequency
distribution for such disparities, to assess their magnitude and
likelihood. The estimation error for a given year is defined as the net
surplus ratio at the end of the year, based on the stochastic
projection, minus the expected surplus ratio at the time that
financing is established. The frequency distribution shows the
probabilities of various differences from the expected trust fund
status.
The stochastic analysis suggests that, on average, 95 percent of the
estimation errors would be expected to fall between about −9 percent
and 11 percent. The largest adverse differences generated by the
stochastic projections were in the vicinity of −14 percent. These

Supplementary Assessment of Uncertainty
177
results are also consistent with the traditional reserve level target of
15 to 20 percent. They further indicate that the expected reserve ratio
of 8.5 percent (at the end of 2006) is not adequate. There is an
estimated 2.5-percent probability that the experience in 2006 could
cause the ratio to go below zero. In this instance, benefits could still
be paid on a cash basis, but the Part B account would be technically
insolvent, with liabilities in excess of assets.
Figure V.D3.—Frequency Distribution of Estimation Errors for Part B Account of SMI Trust Fund Surplus Ratio (Stochastic “Actual” minus Estimated Surplus as a
Percentage of Next Year’s Expenditures)
0.0%
0.2%
0.4%
0.6%
0.8%
1.0%
1.2%
1.4%
1.6%
1.8%
2.0%
-15% -12% -9% -6% -3% 0% 3% 6% 9% 12% 15%
Estimation error (as a percentage of next year's expenditures)
Pro
bability
95-percent projection interval
(shaded area)
4. Summary
The stochastic approach presented in this appendix is intended to
supplement the traditional projection methods used to evaluate the
financial status of the Part B account of the SMI trust fund. The
approach can help quantify the uncertainty of future Part B cost
projections but is subject to further refinement. The results suggest
that the range of variation defined by the traditional high and low
cost alternatives is initially somewhat narrower than the range
determined by the tentative application of stochastic modeling but
about the same at the end of the 10-year projection period. The
projections support the view that future Part B costs could vary
substantially from the intermediate projection, due to variations in
future annual cost increases. The statistical analysis also reinforces
the conclusions that the current methods of establishing Part B

Appendices
178
premiums and general revenue financing should prevent depletion of
the trust fund, even under conditions of sustained adverse cost
experience, and that the current level of Part B assets must be
increased to a more adequate level.

Trust Funds and Federal Budget
179
E. MEDICARE AND SOCIAL SECURITY TRUST FUNDS AND
THE FEDERAL BUDGET
The financial operations of Medicare and Social Security can be
viewed in the context of the programs‟ trust funds or in the context of
the overall Federal Budget. The financial status of the trust funds
differs fundamentally from the impact of these programs on the
budget, and the relationship between these two perspectives is often
misunderstood. Each perspective is appropriate and important for its
intended purpose; this appendix attempts to clarify their roles and
relationship.
By law, the annual reports of the Medicare and Social Security
Boards of Trustees to Congress focus on the financial status of the
programs‟ trust funds—that is, whether these funds have sufficient
revenues and assets to enable the payment of benefits and
administrative expenses. This “trust fund perspective” is important,
because the existence of trust fund assets provides the statutory
authority to make such payments without the need for an
appropriation from Congress. Medicare and Social Security benefits
can be paid only if the relevant trust fund has sufficient income or
assets.
The trust fund perspective does not encompass the interrelationship
between the Medicare and Social Security trust funds and the overall
Federal Budget. The budget is a comprehensive display of all Federal
activities, whether financed through trust funds or from the general
fund of the Treasury. This broader focus may appropriately be termed
the “budget perspective” or “government-wide perspective” and is
officially presented in the Budget of the United States Government
and in the Financial Report of the United States Government.
The majority of Medicare and Social Security costs are financed
through payroll taxes, income taxes on Social Security benefits, and
Medicare premiums. In addition to these “earmarked” receipts from
workers, employers, and beneficiaries, Medicare and Social Security
rely on Federal general fund revenues for some of their financing
(principally for the SMI trust fund), and the trust funds are credited
with interest payments on their accumulated assets as well. The
financial status of a trust fund appropriately considers all sources of
financing provided under current law for that fund, including the
availability of trust fund assets that can be used to meet program
expenditures. From the budget perspective, however, general fund
transfers and interest payments to the trust funds, and asset

Appendices
180
redemptions, represent a draw on other Federal resources for which
there is no earmarked source of revenue from the public.
In the past, general fund and interest payments for Medicare and
Social Security were relatively small. These amounts have increased
substantially over the last 2 decades, however, and the expected rapid
future growth of Medicare and Social Security will make their
interaction with the Federal Budget increasingly important. As the
difference between earmarked and total trust fund revenues grows,
the financial operations of Social Security and Medicare can appear
markedly different depending on which of the two perspectives is
used.52
Illustration with Actual Data for 2005
The trust fund and budget perspectives can be illustrated with actual
data on Federal financial operations for fiscal year 2005, as shown in
table V.E1. The first three columns show revenues and expenditures
for HI, SMI, and OASDI, respectively, and the fourth column is the
sum of these three columns. The fifth column shows total revenues
and expenditures for all other government programs (including the
general fund account of the Treasury), and the final column is the
sum of the “Combined” and “Other Government” columns. Earmarked
revenues from the public are shown separately from revenues from
other government accounts (general revenue transfers and interest
credits). Note that the transfers and interest credits received by the
trust funds appear in total as negative entries under the “Other
Government” column and are thus offsetting when summed for the
total budget in the final column. These two intragovernmental
transactions are key to the differences between the two perspectives.
52A more complete treatment of this topic can be found in the 2005 Financial Report of
the United States Government at www.fms.treas.gov/fr/ and in a Treasury report
entitled “Social Security and Medicare Trust Funds and the Federal Budget: An
Expanded Exposition,” available at www.treas.gov/offices/economic-
policy/social_security.html. Additional information is available in a Health Care
Financing Review article entitled “Medicare Financial Status, Budget Impact, and
Sustainability: Which Concept is Which?”, available at
www.cms.hhs.gov/HealthCareFinancingReview/02_2005_Edition.asp.

Trust Funds and Federal Budget
181
Table V.E1.—Annual Revenues and Expenditures for Medicare and Social Security Trust Funds and the Total Federal Budget, Fiscal Year 2005
(In billions)
Revenue and expenditures categories
Trust funds Other government Total
1 HI SMI OASDI Combined
Revenues from public: Payroll and benefit taxes $177.7 — $604.9 $782.7 — $782.7 Premiums 3.6 35.9 — 39.5 — 39.5 Other taxes and fees — — — — $1,331.8 1,331.8
Total 181.3 35.9 604.9 822.2 1,331.8 2,154.0
Total expenditures to public2 184.1 152.7 523.3 860.2 1,612.8 2,473.0
Net Results for Budget Perspective -2.8 -116.8 81.6 -38.0 -281.0 -319.0
Revenues from other government accounts: Transfers 0.5 114.0 0.0 114.5 -114.5 0.0 Interest credits 15.1 2.6 91.8 109.5 -109.5 0.0
Total 15.6 116.6 91.8 224.0 -224.0 0.0
Net Results for Trust Fund Perspective 12.8 -0.2 173.5 186.0 n/a n/a 1This column is the sum of the preceding two columns and shows data for the total Federal Budget. The
figure $319.0 billion was the total Federal Budget deficit for fiscal year 2005. 2The OASDI figure includes $3.9 billion transferred to the Railroad Retirement Board.
Notes: 1. For comparison, HI taxable payroll, OASDI taxable payroll, and GDP were $5,897 billion, $4,754 billion, and $12,485 billion, respectively, in 2005.
2. Totals do not necessarily equal the sums of rounded components.
3. “n/a” indicates not applicable.
The trust fund perspective reflects both categories of revenues for
each trust fund. For HI, revenues from the public plus
transfers/credits from other government accounts exceeded total
expenditures by $12.8 billion in 2005, as shown at the bottom of the
first column.53 For the SMI trust fund, the statutory revenues from
beneficiary premiums, general revenue transfers, and interest
earnings collectively fell short of expenditures by $0.2 billion,
requiring asset redemptions of that amount to enable the payment of
full SMI benefits and other costs in 2005. Note that both the general
revenue transfers from other government accounts and the asset
redemptions are appropriately viewed as financial resources from the
trust fund perspective, since they are available under current law to
53Surpluses of revenues from the public over expenditures to the public are invested in
special Treasury securities and thereby represent a loan from the trust funds to the
general fund of the Federal Government. These loans reduce the amount that the
general fund has to borrow from the public to finance a deficit (or likewise increase the
amount of debt paid off if there is a surplus). Interest is credited to the trust funds
while the securities are being held. Trust fund securities can be redeemed at any time
if needed to help meet program expenditures. Thus, the accumulation of fund assets
creates budget commitments for future years when interest earnings and asset
redemptions are used to meet expenditures.

Appendices
182
help meet trust fund outlays. For OASDI, total trust fund revenues
from all sources (including $91.8 billion in interest payments)
exceeded total expenditures by $173.5 billion.
From the government-wide or budget perspective, only earmarked
revenues received from the public—taxes on payroll and benefits,
plus premiums—and expenditures made to the public are important
for the final balance. For HI, the difference between such revenues
($181.3 billion) and total expenditures made to the public
($184.1 billion) was $2.8 billion in 2005, indicating that HI had a
small, negative effect on the overall budget in 2005. For SMI,
beneficiary premiums are the only source of revenues from the public
and represent only about 25 percent of total expenditures. The
remaining $116.8 billion in 2005 outlays represented a substantial
net draw on the Federal Budget in that year.54 For OASDI, the
difference between revenues from the public ($604.9 billion) and total
expenditures was $81.6 billion, indicating that OASDI had a large,
positive effect on the overall budget last year.
Thus, from the trust fund perspective, HI and OASDI had significant
annual surpluses and SMI had a small annual deficit in 2005. From
the budget perspective, OASDI made a positive contribution to the
Federal Budget, though by an amount smaller than the respective
trust fund surplus, and HI and SMI both had a net draw on the
budget. HI, SMI, and OASDI collectively had a large trust fund
surplus of $186.0 billion in fiscal year 2005, but a significant net draw
of $38.0 billion on the budget.
It is important to recognize that each viewpoint is appropriate for its
intended purpose but that one perspective cannot be used to answer
questions related to the other. In the case of SMI, under current-law
financing the trust fund will always be in balance and there will
always be a net draw on the Federal Budget. In the case of HI, trust
fund surpluses in a given year may occur with either a positive or
negative direct impact on the budget for that year. Conversely, a
positive or negative budget impact from HI offers minimal insight
into whether its trust fund has sufficient total revenues and assets to
permit payment of benefits.
The next section illustrates the magnitude of the long-range
difference between projected expenditures and revenues for Medicare
54Three types of trust fund transactions comprised this total budget obligation:
$114.0 billion was drawn in the form of general revenue transfers, $2.6 billion in
interest payments, and the remaining $0.2 billion in asset redemptions.

Trust Funds and Federal Budget
183
and Social Security, under both the trust fund and budget
perspectives.
Future Obligations of the Trust Funds and the Budget
Table V.E2 collects from the Medicare and OASDI Trustees Reports
the present values of projected future revenues and expenditures over
the next 75 years under current law. For HI and OASDI, tax
revenues from the public are projected to fall short of statutory
expenditures by $11.3 trillion and $6.4 trillion, respectively, in
present value terms.55
55Interest income is not a factor in this table, as dollar amounts are in present value
terms.

Appendices
184
Table V.E2.—Present Values of Projected Revenue and Cost Components of 75-Year Open-Group Obligations for HI, SMI, and OASDI
(In trillions, as of January 1, 2006)
Revenue and expenditure categories HI SMI OASDI Combined
Revenues from public: Payroll and benefit taxes $10.6 — $32.1 $42.8 Premiums 0.0 $5.9 — 5.9 Other taxes and fees
1 — 1.0 — 1.0
Total 10.6 6.9 32.1 49.7
Total expenditures to public 21.9 28.0 38.6 88.5
Net Results for Budget Perspective -11.3 -21.1 -6.4 -38.9
Revenues from other government accounts: Transfers 0.0 21.1 0.0 21.1 Interest credits n/a n/a n/a n/a
Total 0.0 21.1 0.0 21.1
Trust fund assets on January 1, 2006 0.3 0.0 1.9 2.2
Net Results for Trust Fund Perspective -11.0 0.0 -4.6 -15.6 1Includes Part D State transfers.
2Less than $50 billion.
Notes: 1. For comparison, HI taxable payroll, OASDI taxable payroll, and GDP were $322.1 trillion, $244.7 trillion, and $697.0 trillion, respectively, over the next 75 years.
2. Totals do not necessarily equal the sums of rounded components. 3. “n/a” indicates not applicable.
From the budget perspective, these are the additional amounts that
would be needed in order to pay HI and OASDI benefits and other
costs at the level scheduled under current law over the next 75 years.
From the trust fund perspective, the amounts needed are smaller by
the value of the accumulated assets in the respective trust funds—
$0.3 trillion for HI and $1.9 trillion for OASDI—that could be drawn
down to cover a part of the projected shortfall in tax revenues. Two
points about this comparison are important to note:
• Other than asset redemptions and interest payments, no
provision exists under current law to address the projected HI
and OASDI financial imbalances. Once assets are exhausted,
expenditures cannot be made except to the extent covered by
ongoing tax receipts. In this extreme—and politically unlikely—
situation, further transfers from the general fund would require
new legislation.
• Accordingly, from a trust fund perspective, the long-range HI and
OASDI deficits reflect the net imbalance after trust fund assets
have been redeemed. From a government-wide perspective, the
deficits represent the cost of redeeming those assets plus the

Trust Funds and Federal Budget
185
additional legislative authorization that would be required to
fully satisfy future scheduled benefit payments.56
The situation for SMI is somewhat different. SMI expenditures for
Part B and Part D are projected to exceed premium revenues by
$21.2 trillion. General fund transfers of this amount will be needed to
keep the SMI trust fund solvent for the next 75 years, and these
transfers represent a formal budget requirement under current law.
From the trust fund perspective, the present value of projected total
premiums and general revenues equals the present value of future
expenditures.
From the 75-year budget perspective, the present value of the
additional resources that would be needed to meet projected
expenditures, at current-law levels for the three programs combined,
is $38.9 trillion.57 To put this very large figure in perspective, it would
represent 5.5 percent of the present value of projected GDP over the
same period ($707 trillion). The components of the $38.9-trillion total
are as follows:
56In practice, the long-range HI and OASDI deficits could be addressed by reducing
expenditures, increasing payroll or other earmarked tax revenues, implementing a
general revenue subsidy, or some combination of such measures. For Medicare, in
particular, legislation has frequently been enacted to slow the growth of expenditures. 57As noted previously, the long-range HI and OASDI financial imbalances could instead
be partially addressed by expenditure reductions, thereby reducing the need for
additional revenues. Similarly, SMI expenditure reductions would reduce the need for
general fund transfers.

Appendices
186
Unfunded HI and OASDI obligations
(trust fund perspective)58 .................................. $17.7 trillion (2.5% of GDP)
HI and OASDI asset redemptions .................... $2.2 trillion (0.3% of GDP)
SMI Part B and Part D general
revenue financing .............................................. $21.2 trillion (3.0% of GDP)
These resource needs would be in addition to the payroll taxes,
benefit taxes, and premium payments scheduled under current law.
As noted, the asset redemptions and SMI general revenue transfers
represent formal budget commitments under current law, but no
provision exists for covering the HI and OASDI trust fund deficits
once assets are exhausted.
58Additional revenues and/or expenditure reductions totaling $17.7 trillion, together
with asset redemptions, would cover the projected financial imbalance but would leave
the HI and OASDI trust funds exhausted at the end of the 75-year period. The
long-range actuarial deficit for HI and OASDI includes a cost factor to allow for a
normal level of fund assets. See section III.B3 in this report, and section IV.B4 in the
OASDI Trustees Report, for the numerical relationship between the actuarial deficit
and the “unfunded obligations” of each program.

Fiscal Year Operations and Projections
187
F. FISCAL YEAR HISTORICAL DATA AND PROJECTIONS
THROUGH 2015
Tables V.F1, V.F2, V.F3, V.F4, and V.F5 present estimates of the
fiscal year operations of total Medicare, the HI trust fund, the SMI
trust fund, the Part B account in the SMI trust fund, and the Part D
account in the SMI trust fund, respectively. These tables correspond
to the calendar-year trust fund operation tables shown in section III.
Table V.F1.—Total Medicare Income, Expenditures, and Trust Fund Assets during Fiscal Years 1970-2015
[In billions]
Fiscal year Total income Total expenditures Net change in
assets Assets at end of
year
Historical data: 1970 $7.5 $7.1 $0.3 $2.7 1975 16.9 14.8 2.1 11.3 1980 35.7 35.0 0.7 19.0 1985 75.5 71.4 4.1 31.9 1990 125.7 109.7 16.0 110.2 1995 173.0 180.1 −7.1 143.4 1996 203.2 194.3 8.9 152.3 1997 209.4 210.4 −1.0 151.3 1998 220.2 213.4 6.7 158.0 1999 238.3 212.0 26.3 184.3 2000 248.9 219.3 29.6 214.0 2001 266.3 241.2 25.2 239.2 2002 285.5 256.9 28.6 267.8 2003 286.0 277.8 8.2 275.9 2004 307.6 301.5 6.1 282.1 2005 349.4 336.9 12.5 294.6
Intermediate estimates: 2006 426.3 389.6 36.7 331.4 2007 474.4 459.3
1 15.1 346.4
2008 508.6 487.8 20.8 367.3 2009 534.5 525.2 9.2 376.5 2010 566.3 562.5 3.8 380.3 2011 605.3 615.3 −10.0 370.3 2012 637.0 631.5 5.5 375.8 2013 681.0 694.4 −13.4 362.4 2014 722.6 745.6 −23.0 339.4 2015 766.9 800.8 −34.0 305.5
1See footnote 1 of table III.A1.

Table V.F2.—Operations of the HI Trust Fund during Fiscal Years 1970-2015 [In billions]
Fiscal year
1
Income Expenditures Trust fund
Payroll taxes
Income from
taxation of benefits
Railroad Retirement
account transfers
Reimburse- ment for
uninsured persons
Premiums from
voluntary enrollees
Payments for military
wage credits
Interest and
other2,3
Total Benefit
payments3,4
Adminis-trative
expenses5 Total
Net change
Balance at end of year
Historical data: 1970 $4.8 — $0.1 $0.6 — $0.0 $0.1 $5.6 $4.8 $0.1 $5.0 $0.7 $2.7 1975 11.3 — 0.1 0.5 $0.0 0.0 0.6 12.6 10.4 0.3 10.6 2.0 9.9 1980 23.2 — 0.2 0.7 0.0 0.1 1.1 25.4 23.8 0.5 24.3 1.1 14.5 1985 46.5 — 0.4 0.8 0.0 0.1 3.2 50.9 47.8 0.8 48.7 4.1
6 21.3
1990 70.7 — 0.4 0.4 0.1 0.1 7.9 79.6 65.9 0.8 66.7 12.9 95.6 1995 98.1 $3.9 0.4 0.5 1.0 0.1 11.0 114.8 113.6 1.3 114.9 −0.0 129.5 1996 106.9 4.1 0.4 0.4 1.1 −2.3
7 10.5 121.1 124.1 1.2 125.3 −4.2 125.3
1997 112.7 3.6 0.4 0.5 1.3 0.1 10.0 128.5 136.2 8 1.7 137.8 −9.3 116.1
1998 121.9 5.1 0.4 0.0 1.3 0.1 9.4 138.2 135.5 8 1.7 137.1 1.1 117.1
1999 134.4 6.6 0.4 0.7 1.4 0.1 9.5 153.0 129.5 8 2.0 131.4 21.6 138.7
2000 137.7 8.8 0.5 0.5 1.4 0.0 10.8 159.7 127.9 8 2.4 130.3 29.4 168.1
2001 151.9 4.9 0.5 0.5 1.4 −1.2 9 13.0 171.0 139.4
8 2.4 141.7 29.3 197.4
2002 151.6 10.9 0.4 0.4 1.5 0.0 14.9 179.8 145.6 8 2.5 148.0 31.7 229.1
2003 149.8 8.3 0.4 0.4 1.6 0.0 15.2 175.8 151.3 8 2.5 153.8 22.0 251.1
2004 153.4 8.6 0.4 0.4 1.8 0.2 16.0 180.8 164.1 2.9 167.0 13.8 264.9 2005 169.0 8.8 0.4 0.3 2.3 0.0 16.2 196.9 181.3 2.9 184.1 12.8 277.7
Intermediate estimates: 2006 179.1 10.1 0.5 0.4 2.5 0.0 15.6 208.2 185.8 3.2 189.0 19.3 297.0 2007 185.6 11.2 0.5 0.5 2.7 0.0 15.9 216.3 208.0 3.2 212.4 4.0 300.9 2008 197.5 13.3 0.5 0.2 2.9 0.0 16.0 230.4 219.0 3.3 222.3 8.1 309.1 2009 207.5 14.6 0.5 0.3 3.1 0.0 16.3 242.3 234.6 3.4 238.0 4.3 313.3 2010 219.3 15.2 0.5 0.3 3.3 0.0 16.4 255.0 250.9 3.4 254.4 0.6 314.0 2011 231.0 17.4 0.5 0.3 3.5 0.0 16.3 269.0 273.8 3.5 277.3 -8.3 305.7 2012 241.3 20.0 0.5 0.3 3.7 0.0 15.9 281.8 281.4 3.6 284.9 -3.1 302.6 2013 252.0 22.4 0.5 0.3 4.0 0.0 15.2 294.4 307.7 3.7 311.4 -17.0 285.5 2014 262.5 24.7 0.6 0.3 4.2 0.0 13.9 306.1 329.2 3.7 333.0 -26.9 258.6
2015 273.5 26.7 0.6 0.3 4.4 0.0 12.0 317.5 352.2 3.8 356.1 -38.5 220.1
188
Ap
pen
dices

1Fiscal years 1970 and 1975 consist of the 12 months ending on June 30 of each year; fiscal years 1980 and later consist of the 12 months ending on
September 30 of each year. 2Other income includes recoveries of amounts reimbursed from the trust fund that are not obligations of the trust fund, receipts from the fraud and abuse
control program, and a small amount of miscellaneous income. 3See footnote 2 of table III.B4.
4Includes costs of Peer Review Organizations from 1983 through 2001 (beginning with the implementation of the prospective payment system on
October 1, 1983) and costs of Quality Improvement Organizations beginning in 2002. 5Includes costs of experiments and demonstration projects. Beginning in 1997, includes fraud and abuse control expenses, as provided for by Public
Law 104-191. 6Includes repayment of loan principal, from the OASI trust fund, of $1.8 billion.
7Includes the lump-sum general revenue adjustment of −$2.4 billion, as provided for by section 151 of Public Law 98-21.
8For 1998 to 2003, includes monies transferred to the SMI trust fund for home health agency costs, as provided for by Public Law 105-33.
9Includes the lump-sum general revenue adjustment of −$1.2 billion, as provided for by section 151 of Public Law 98-21.
10See footnote 11 of table III.B4.
Note: Totals do not necessarily equal the sums of rounded components.
189
FY
Op
eratio
ns a
nd
Pro
jection
s

Appendices
190
Table V.F3.—Operations of the SMI Trust Fund (Cash Basis) during Fiscal Years 1970-2015
[In billions]
Income Expenditures Trust fund
Premium income
General revenue
2
Transfers from
States
Interest and
other3,4
Total Benefit
payments4,5
Adminis-trative
expense Total Net
change
Balance at end
of year6
Historical data: 1970 $0.9 $0.9 — $0.0 $1.9 $2.0 $0.2 $2.2 −$0.3 $0.1 1975 1.9 2.3 — 0.1 4.3 3.8 0.4 4.2 0.2 1.4 1980 2.9 6.9 — 0.4 10.3 10.1 0.6 10.7 −0.5 4.5 1985 5.5 17.9 — 1.2 24.6 21.8 0.9 22.7 1.8 10.6 1990 11.5
7 33.2 — 1.4
7 46.1
7 41.5 1.5
7 43.0
7 3.1
7 14.5
7
1995 19.2 37.0 — 1.9 58.2 63.5 1.7 65.2 −7.0 13.9 1996 18.9 61.7 — 1.4 82.0 67.2 1.8 68.9 13.1 27.0 1997 19.1 59.5 — 2.2 80.8 71.1 1.4 72.6 8.3 35.2 1998 19.4 59.9 — 2.6 82.0 74.8
8 1.4 76.3 5.7 40.9
1999 20.2 62.2 — 2.9 85.3 79.0 8 1.5 80.5 4.8 45.6
2000 20.5 65.6 — 3.2 89.2 87.2 8 1.8 89.0 0.2 45.9
2001 22.3 69.8 — 3.2 95.3 97.5 8 2.0 99.5 −4.1 41.8
2002 24.4 78.3 — 3.0 105.7 107.0 8 1.8 108.8 −3.1 38.7
2003 26.8 80.9 — 2.5 110.2 121.7 8 2.4 124.1 −13.9 24.8
2004 30.3 94.5 — 1.7 126.6 131.5 2.8 134.3 −7.7 17.1 2005 35.9 115.2 — 1.4 152.5 149.8 2.9 152.7 −0.2 16.9
Intermediate estimates: 2006 45.3 166.4 $4.7 1.6 218.1 197.1 3.5 200.6 17.5 34.4 2007 54.4 194.1 7.4 2.2 258.1 242.8 3.4 247.0
9 11.1 45.5
2008 59.9 207.4 7.9 3.0 278.2 262.0 3.5 265.5 12.7 58.2 2009 63.2 217.0 8.5 3.6 292.2 283.6 3.6 287.3 4.9 63.1 2010 67.2 231.1 9.1 3.9 311.3 304.4 3.7 308.2 3.2 66.3 2011 71.7 250.6 9.9 4.1 336.3 334.1 3.9 338.0 −1.7 64.6 2012 76.9 263.3 10.7 4.3 355.2 342.5 4.0 346.5 8.7 73.3 2013 82.7 287.9 11.6 4.5 386.7 378.9 4.2 383.0 3.7 76.9 2014 88.7 310.6 12.5 4.7 416.5 408.3 4.3 412.6 3.9 80.8 2015 95.3 335.6 13.6 4.9 449.4 440.3 4.5 444.8 4.6 85.4
1Fiscal years 1970 and 1975 consist of the 12 months ending on June 30 of each year; fiscal years 1980
and later consist of the 12 months ending on September 30 of each year. 2Includes Part B general fund matching payments, Part D subsidy costs, and certain interest-adjustment
items. 3Other income includes recoveries of amounts reimbursed from the trust fund that are not obligations of
the trust fund and other miscellaneous income. 4See footnote 2 of table III.B4.
5See footnote 5 of table III.C1.
6The financial status of SMI depends on both the assets and the liabilities of the trust fund (see
table III.C12). 7Includes the impact of the Medicare Catastrophic Coverage Act of 1988 (Public Law 100-360).
8Benefit payments less monies transferred from the HI trust fund for home health agency costs, as
provided for by the Balanced Budget Act of 1997. 9See footnote 9 of table III.C1.
Note: Totals do not necessarily equal the sums of rounded components.

Fiscal Year Operations and Projections
191
Table V.F4.—Operations of the Part B Account in the SMI Trust Fund (Cash Basis) during Fiscal Years 1970-2015
[In billions]
Fiscal year
1
Income Expenditures Account
Premium income
General revenue
2
Interest and
other3,4
Total Benefit
payments4,5
Adminis-trative
expense Total Net
change
Balance at end of year
6
Historical data: 1970 $0.9 $0.9 $0.0 $1.9 $2.0 $0.2 $2.2 −$0.3 $0.1 1975 1.9 2.3 0.1 4.3 3.8 0.4 4.2 0.2 1.4 1980 2.9 6.9 0.4 10.3 10.1 0.6 10.7 −0.5 4.5 1985 5.5 17.9 1.2 24.6 21.8 0.9 22.7 1.8 10.6 1990 11.5
7 33.2 1.4
7 46.1
7 41.5 1.5
7 43.0
7 3.1
7 14.5
7
1995 19.2 37.0 1.9 58.2 63.5 1.7 65.2 −7.0 13.9 1996 18.9 61.7 1.4 82.0 67.2 1.8 68.9 13.1 27.0 1997 19.1 59.5 2.2 80.8 71.1 1.4 72.6 8.3 35.2 1998 19.4 59.9 2.6 82.0 74.8
8 1.4 76.3 5.7 40.9
1999 20.2 62.2 2.9 85.3 79.0 8 1.5 80.5 4.8 45.6
2000 20.5 65.6 3.2 89.2 87.2 8 1.8 89.0 0.2 45.9
2001 22.3 69.8 3.2 95.3 97.5 8 2.0 99.5 −4.1 41.8
2002 24.4 78.3 3.0 105.7 107.0 8 1.8 108.8 −3.1 38.7
2003 26.8 80.9 2.5 110.2 121.7 8 2.4 124.1 −13.9 24.8
2004 30.3 94.5 1.7 126.6 131.5 2.8 134.3 −7.7 17.1 2005 35.9 114.0 1.4 151.3 148.6 2.9 151.5 −0.2 16.9
Intermediate estimates: 2006 41.6 134.1 1.6 177.3 157.0 2.7 159.8 17.5 34.4 2007 47.5 144.0 2.1 193.7 179.1 2.7 182.6
9 11.1 45.5
2008 50.2 149.7 2.8 202.7 187.2 2.8 190.0 12.7 58.2 2009 51.8 153.3 3.4 208.6 200.7 2.9 203.7 4.9 63.1 2010 54.5 161.1 3.8 219.4 213.2 3.1 216.3 3.2 66.3 2011 57.7 170.5 4.0 232.1 230.6 3.2 233.8 −1.7 64.6 2012 61.3 181.3 4.2 246.8 234.8 3.3 238.2 8.7 73.3 2013 65.5 193.6 4.4 263.4 256.3 3.5 259.8 3.7 76.9 2014 69.7 206.2 4.5 280.4 272.9 3.6 276.5 3.9 80.8 2015 74.3 220.1 4.7 299.1 290.8 3.7 294.6 4.6 85.4
1Fiscal years 1970 and 1975 consist of the 12 months ending on June 30 of each year; fiscal years 1980
and later consist of the 12 months ending on September 30 of each year. 2General fund matching payments, plus certain interest-adjustment items.
3Other income includes recoveries of amounts reimbursed from the trust fund that are not obligations of
the trust fund and other miscellaneous income. 4See footnote 2 of table III.B4.
5See footnote 5 of table III.C1.
6The financial status of Part B depends on both the assets and the liabilities of the trust fund (see
table III.C12). 7Includes the impact of the Medicare Catastrophic Coverage Act of 1988 (Public Law 100-360).
8Benefit payments less monies transferred from the HI trust fund for home health agency costs, as
provided for by the Balanced Budget Act of 1997. 9See footnote 9 of table III.C1.
Note: Totals do not necessarily equal the sums of rounded components.

Appendices
192
Table V.F5.—Operations of the Part D Account in the SMI Trust Fund (Cash Basis) during Fiscal Years 2005-2015
[In billions]
Fiscal year
Income Expenditures Account
Premium income
General revenue
1
Transfers from
States2
Interest and
other Total Payments to plans
3
Adminis-trative
expense Total Net
change
Balance at end of
year
Historical data: 2004 — $0.2 — — $0.2 $0.2 — $0.2 — — 2005 — 1.2 — — 1.2 1.2 — 1.2 — —
Intermediate estimates: 2006 $3.7 32.3 $4.7 $0.1 40.8 40.1 $0.8 40.8 — — 2007 6.9 50.0 7.4 0.1 64.4 63.7 0.7 64.4 — — 2008 9.7 57.7 7.9 0.1 75.5 74.8 0.7 75.5 — — 2009 11.4 63.6 8.5 0.1 83.6 82.9 0.7 83.6 — — 2010 12.6 70.0 9.1 0.1 91.9 91.2 0.7 91.9 — — 2011 14.0 80.2 9.9 0.1 104.2 103.5 0.7 104.2 — — 2012 15.6 82.0 10.7 0.2 108.4 107.7 0.7 108.4 — — 2013 17.2 94.3 11.6 0.2 123.3 122.6 0.7 123.3 — — 2014 19.0 104.4 12.5 0.2 136.1 135.4 0.7 136.1 — — 2015 21.0 115.5 13.6 0.2 150.2 149.5 0.7 150.2 — —
1Includes all government transfers including amounts for the general subsidy, reinsurance, employer
drug subsidy, low-income subsidy, administrative expenses, risk sharing, and State expenses for making low-income eligibility determinations. Includes amounts for the Transitional Assistance program of $0.2, $1.1, and $0.1 billion in 2004-2006, respectively. 2See footnote 3 of table III.C18.
3Includes subsidies to employer retiree prescription drug plans, payments to States for making low-
income eligibility determinations, and Part D drug premiums collected from beneficiaries and transferred to Medicare Advantage plans and private drug plans. Includes amounts for the Transitional Assistance program of $0.2, $1.1, and $0.1 billion in 2004-2006, respectively.
Note: Totals do not necessarily equal the sums of rounded components.
Table V.F6 shows the total assets of the HI trust fund and their
distribution at the end of fiscal years 2004 and 2005. The assets at
the end of fiscal year 2005 totaled $277,723 million: $277,268 million
in the form of U.S. Government obligations and an undisbursed
balance of $455 million.

Fiscal Year Operations and Projections
193
Table V.F6.—Assets of the HI Trust Fund, by Type, at the End of Fiscal Years 2004 and 2005
1
September 30, 2004 September 30, 2005
Investments in public-debt obligations sold only to the trust funds (special issues): Certificates of indebtedness:
4.125-percent, 2005....................................... $3,333,580,000.00 —— 4.125-percent, 2006....................................... —— $2,257,231,000.00
Bonds: 3.500-percent, 2006....................................... 1,491,940,000.00 —— 3.500-percent, 2007-2018 ............................. 33,429,148,000.00 33,429,148,000.00 4.125-percent, 2007-2020 ............................. —— 31,649,141,000.00 4.625-percent, 2006....................................... 977,467,000.00 —— 4.625-percent, 2007-2019 ............................. 29,547,583,000.00 29,547,583,000.00 5.250-percent, 2006....................................... 2,028,430,000.00 —— 5.250-percent, 2007-2017 ............................. 35,455,537,000.00 35,455,537,000.00
5.625-percent, 2005....................................... 807,732,000.00 —— 5.625-percent, 2006....................................... 2,537,725,000.00 945,225,000.00 5.625-percent, 2007-2016 ............................. 36,159,654,000.00 36,159,654,000.00 5.875-percent, 2011-2012 ............................. 8,754,457,000.00 8,754,457,000.00 6.000-percent, 2012-2014 ............................. 20,598,023,000.00 20,598,023,000.00 6.250-percent, 2005....................................... 363,198,000.00 —— 6.250-percent, 2006-2008 ............................. 9,274,521,000.00 9,274,521,000.00 6.500-percent, 2005....................................... 2,009,145,000.00 —— 6.500-percent, 2006-2015 ............................. 37,843,878,000.00 37,843,878,000.00 6.875-percent, 2011....................................... 2,166,172,000.00 2,166,172,000.00 7.000-percent, 2011....................................... 3,368,466,000.00 3,368,466,000.00 7.250-percent, 2005....................................... 225,129,000.00 —— 7.250-percent, 2006-2009 ............................. 9,448,645,000.00 9,448,645,000.00 7.375-percent, 2005....................................... 867,961,000.00 —— 7.375-percent, 2006-2007 ............................. 9,052,890,000.00 9,052,890,000.00 8.125-percent, 2005....................................... 901,273,000.00 —— 8.125-percent, 2006....................................... 7,316,968,000.00 7,316,968,000.00
8.750-percent, 2005....................................... 10.375-percent, 2000 6,415,695,000.00 ——
Total investments .................................................... $264,375,217,000.00 $277,267,539,000.00
Undisbursed balance2 ............................................. 567,991,583.31 455,146,827.07
Total assets ............................................................. $264,943,208,583.31 $277,722,685,827.07 1Certificates of indebtedness and bonds are carried at par value, which is the same as book value.
The effective annual rate of interest earned by the assets of the HI
trust fund during the 12 months ending on December 31, 2005 was
5.6 percent. Interest on special issues is paid semiannually on
June 30 and December 31. The interest rate on public-debt
obligations issued for purchase by the trust fund in June 2005 was
4.125 percent, payable semiannually.
Table V.F7 shows a comparison of the total assets of the Part B
account and their distribution at the end of fiscal years 2004 and
2005. At the end of 2005, assets totaled $16,885 million:
$17,204 million in the form of U.S. Government obligations and an
undisbursed balance of −$319 million.

Appendices
194
Table V.F7.—Assets of the Part B Account in the SMI Trust Fund, by Type, at the End of Fiscal Years 2004 and 2005
1
September 30, 2004 September 30, 2005
Investments in public-debt obligations sold only to the trust funds (special issues): Bonds:
4.125-percent, 2008-2009 ............................. —— 4,054,589,000.00 5.250-percent, 2016....................................... 297,753,000.00 297,753,000.00 5.625-percent, 2016....................................... 1,822,107,000.00 1,822,107,000.00 5.875-percent, 2011-2012 ............................. 598,234,000.00 —— 5.875-percent, 2013....................................... 2,526,588,000.00 2,526,588,000.00 6.000-percent, 2011-2012 ............................. 940,518,000.00 —— 6.000-percent, 2013-2014 ............................. 3,462,146,000.00 3,462,146,000.00 6.500-percent, 2011-2012 ............................. 72,578,000.00 —— 6.500-percent, 2013-2015 ............................. 3,110,670,000.00 3,110,670,000.00 6.875-percent, 2011....................................... 567,610,000.00 ——
6.875-percent, 2012....................................... 2,227,470,000.00 1,929,853,000.00 7.000-percent, 2010-2011 ............................. 1,813,410,000.00 ——
Total investments .................................................... $17,439,084,000.00 $17,203,706,000.00
Undisbursed balance2 ............................................. −324,729,751.96 −319,202,063.95
Total assets ............................................................. $17,114,354,248.04 $16,884,503,936.05 1Certificates of indebtedness and bonds are carried at par value, which is the same as book value.
2Negative figures represent an extension of credit against securities to be redeemed within the following
few days.
The effective annual rate of interest earned by the assets of the
Part B account for the 12 months ending on December 31, 2005 was
5.0 percent. Interest on special issues is paid semiannually on
June 30 and December 31. The interest rate on special issues
purchased by the account in June 2005 was 4.125 percent, payable
semiannually.

Glossary
195
G. GLOSSARY
Actuarial balance. The difference between the summarized income
rate and the summarized cost rate over a given valuation period.
Actuarial deficit. A negative actuarial balance.
Actuarial rates. One-half of the Part B expected monthly cost for
each aged enrollee (for the aged actuarial rate) and one-half of the
expected monthly cost for each disabled enrollee (for the disabled
actuarial rate) for the duration the rate is in effect.
Actuarial status. A measure of the adequacy of the financing as
determined by the difference between assets and liabilities at the end
of the periods for which financing was established.
Administrative expenses. Expenses incurred by the Department of
Health and Human Services and the Department of the Treasury in
administering HI and SMI and the provisions of the Internal Revenue
Code relating to the collection of contributions. Such administrative
expenses, which are paid from the HI and SMI trust funds, include
expenditures for contractors to determine costs of, and make
payments to, providers, as well as salaries and expenses of the
Centers for Medicare & Medicaid Services.
Aged enrollee. An individual, aged 65 or over, who is enrolled in HI
or SMI.
Allowed charge. Individual charge determined by a carrier for a
covered Part B medical service or supply.
Annual out-of-pocket threshold. The amount of out-of-pocket
expenses that must be paid before significantly reduced beneficiary
cost sharing is effective. Amounts paid by a third-party insurer are
not included in testing this threshold, but amounts paid by State or
Federal assistance programs are included.
Assets. Treasury notes and bonds guaranteed by the Federal
Government, and cash held by the trust funds for investment
purposes.
Assumptions. Values relating to future trends in certain key factors
that affect the balance in the trust funds. Demographic assumptions
include fertility, mortality, net immigration, marriage, divorce,
retirement patterns, disability incidence and termination rates, and

Appendices
196
changes in the labor force. Economic assumptions include
unemployment, average earnings, inflation, interest rates, and
productivity. Three sets of economic assumptions are presented in the
Trustees Report:
(1) The low cost alternative, with relatively rapid economic
growth, low inflation, and favorable (from the standpoint
of program financing) demographic conditions;
(2) The intermediate assumptions, which represent the
Trustees‟ best estimates of likely future economic and
demographic conditions; and
(3) The high cost alternative, with slow economic growth, more
rapid inflation, and financially disadvantageous
demographic conditions.
See also “Hospital assumptions.”
Average market yield. A computation that is made on all
marketable interest-bearing obligations of the United States. It is
computed on the basis of market quotations as of the end of the
calendar month immediately preceding the date of such issue.
Baby boom. The period from the end of World War II through the
mid-1960s marked by unusually high birth rates.
Base estimate. The updated estimate of the most recent historical
year.
Beneficiary. A person enrolled in HI or SMI. See also “Aged
enrollee” and “Disabled enrollee.”
Benefit payments. The amounts disbursed for covered services after
the deductible and coinsurance amounts have been deducted.
Benefit period. An alternate name for “spell of illness.”
Board of Trustees. A Board established by the Social Security Act
to oversee the financial operations of the Federal Hospital Insurance
Trust Fund and the Federal Supplementary Medical Insurance Trust
Fund. The Board is composed of six members, four of whom serve
automatically by virtue of their positions in the Federal Government:
the Secretary of the Treasury, who is the Managing Trustee; the
Secretary of Labor; the Secretary of Health and Human Services; and
the Commissioner of Social Security. The other two members, John L.
Palmer and Thomas R. Saving, are public representatives initially
appointed by the President on October 28, 2000, and reappointed on
April 18, 2006. The Administrator of the Centers for Medicare &

Glossary
197
Medicaid Services (CMS) serves as Secretary of the Board of
Trustees.
Bond. A certificate of ownership of a specified portion of a debt due
by the Federal Government to holders, bearing a fixed rate of
interest.
Callable. Subject to redemption upon notice, as is a bond.
Carrier. A private or public organization under contract to CMS to
administer the Part B benefits under Medicare. Also referred to as
“contractors,” these organizations determine coverage and benefit
amounts payable and make payments to physicians, suppliers, and
beneficiaries.
Case mix index. A relative weight that captures the average
complexity of certain Medicare services.
Cash basis. The costs of the service when payment was made rather
than when the service was performed.
Certificate of indebtedness. A short-term certificate of ownership
(12 months or less) of a specified portion of a debt due by the Federal
Government to individual holders, bearing a fixed rate of interest.
Closed-group population. Includes all persons currently
participating in the program as either taxpayers or beneficiaries, or
both. See also “Open-group population.”
Coinsurance. Portion of the costs for covered services paid by the
beneficiary after meeting the annual deductible. See also “Hospital
coinsurance” and “SNF coinsurance.”
Consumer Price Index (CPI). A measure of the average change in
prices over time in a fixed group of goods and services. In this report,
all references to the CPI relate to the CPI for Urban Wage Earners
and Clerical Workers (CPI-W).
Contingency. Funds included in the SMI trust fund to serve as a
cushion in case actual expenditures are higher than those projected
at the time financing was established. Since the financing is set
prospectively, actual experience may be different from the estimates
used in setting the financing.
Contingency margin. An amount included in the actuarial rates to
provide for changes in the contingency level in the SMI trust fund.

Appendices
198
Positive margins increase the contingency level, and negative
margins decrease it.
Contribution base. See “Maximum tax base.”
Contributions. See “Payroll taxes.”
Cost rate. The ratio of HI cost (or outgo or expenditures) on an
incurred basis during a given year to the taxable payroll for the year.
In this context, the outgo is defined to exclude benefit payments and
administrative costs for those uninsured persons for whom payments
are reimbursed from the general fund of the Treasury, and for
voluntary enrollees, who pay a premium to be enrolled.
Covered earnings. Earnings in employment covered by HI.
Covered employment. All employment and self-employment
creditable for Social Security purposes. Almost every kind of
employment and self-employment is covered under HI. In a few
employment situations—for example, religious orders under a vow of
poverty, foreign affiliates of American employers, or State and local
governments—overage must be elected by the employer. However,
effective July 1991, coverage is mandatory for State and local
employees who are not participating in a public employee retirement
system. All new State and local employees have been covered since
April 1986. In a few situations—or instance, ministers or self-
employed members of certain religious groups—workers can opt out
of coverage. Covered employment for HI includes all Federal
employees (whereas covered employment for OASDI includes some,
but not all, Federal employees).
Covered Part D drugs. Prescription drugs covered under the
Medicaid program plus insulin-related supplies and smoking
cessation agents. Drugs covered in Parts A and B of Medicare will
continue to be covered there, rather than in Part D.
Covered services. Services for which HI or SMI pays, as defined
and limited by statute. Covered HI services are provided by hospitals
(inpatient care), skilled nursing facilities, home health agencies, and
hospices. Covered SMI Part B services include most physician
services, care in outpatient departments of hospitals, diagnostic tests,
durable medical equipment, ambulance services, and other health
services that are not covered by HI. See “Covered Part D drugs” for
SMI Part D.

Glossary
199
Covered worker. A person who has earnings creditable for Social
Security purposes on the basis of services for wages in covered
employment and/or on the basis of income from covered self-
employment. The number of HI covered workers is slightly larger
than the number of OASDI covered workers because of different
coverage status for Federal employment. See “Covered employment.”
Creditable prescription drug coverage. Prescription drug
coverage that meets or exceeds the actuarial value of Part D coverage
provided through a group health plan or otherwise.
Dedicated financing sources. The sum of HI payroll taxes, HI
share of income taxes on Social Security benefits, Part D state
transfers, and beneficiary premiums. This amount is used in the test
of excess general revenue Medicare funding.
Deductible. The annual amount payable by the beneficiary for
covered services before Medicare makes reimbursement. See also
“Inpatient hospital deductible.”
Deemed wage credit. See “Non-contributory or deemed wage
credits.”
Demographic assumptions. See „„Assumptions.”
Diagnosis-related groups (DRGs). A classification system that
groups patients according to diagnosis, type of treatment, age, and
other relevant criteria. Under the inpatient hospital prospective
payment system, hospitals are paid a set fee for treating patients in a
single DRG category, regardless of the actual cost of care for the
individual.
Direct subsidy. The amount paid to the prescription drug plans
representing the difference between the plan‟s risk-adjusted bid and
the beneficiary premium for basic coverage.
Disability. For Social Security purposes, the inability to engage in
substantial gainful activity by reason of any medically determinable
physical or mental impairment that can be expected to result in death
or to last for a continuous period of not less than 12 months. Special
rules apply for workers aged 55 or older whose disability is based on
blindness. The law generally requires that a person be disabled
continuously for 5 months before he or she can qualify for a disabled-
worker cash benefit. An additional 24 months is necessary to qualify
for benefits under Medicare.

Appendices
200
Disability Insurance (DI). See “Old-Age, Survivors, and Disability
Insurance (OASDI).”
Disabled enrollee. An individual under age 65 who has been
entitled to disability benefits under Title II of the Social Security Act
or the Railroad Retirement system for at least 2 years and who is
enrolled in HI or SMI.
DRG Coding. The DRG categories used by hospitals on discharge
billing. See also “Diagnosis-related groups (DRGs).”
Durable medical equipment (DME). Items such as iron lungs,
oxygen tents, hospital beds, wheelchairs, and seat lift mechanisms
that are used in the patient‟s home and are either purchased or
rented.
Earnings. Unless otherwise qualified, all wages from employment
and net earnings from self-employment, whether or not taxable or
covered.
Economic assumptions. See “Assumptions.”
Economic stabilization program. A legislative program during the
early 1970s that limited price increases.
Employer subsidy. The amount paid to the sponsors of qualifying
employment-based retiree prescription drug plans. This amount
subsidizes a portion of actual drug expenditures between specified
coverage limits and is determined without regard to actual employer
plan payments.
End-stage renal disease (ESRD). Permanent kidney failure.
Extended care services. In the context of this report, an alternate
name for “skilled nursing facility services.”
Fallback prescription drug plan. Prescription drug coverage
provided by plans bearing no risk. One fallback plan will be approved
in regions that do not have a choice of at least two at-risk plans.
Federal Insurance Contributions Act (FICA). Provision
authorizing taxes on the wages of employed persons to provide for
OASDI and HI. The tax is paid in equal amounts by covered workers
and their employers.

Glossary
201
Financial interchange. Provisions of the Railroad Retirement Act
providing for transfers between the trust funds and the Social
Security Equivalent Benefit Account of the Railroad Retirement
program in order to place each trust fund in the same position as if
railroad employment had always been covered under Social Security.
Fiscal year. The accounting year of the U.S. Government. Since
1976, each fiscal year has begun October 1 of the prior calendar year
and ended the following September 30. For example, fiscal year 2006
began October 1, 2005 and will end September 30, 2006.
Fixed capital assets. The net worth of facilities and other resources.
Frequency distribution. An exhaustive list of possible outcomes for
a variable, and the associated probability of each outcome. The sum of
the probabilities of all possible outcomes from a frequency
distribution is 100 percent.
General fund of the Treasury. Funds held by the U.S. Treasury,
other than revenue collected for a specific trust fund (such as HI or
SMI) and maintained in a separate account for that purpose. The
majority of this fund is derived from individual and business income
taxes.
General revenue. Income to the HI and SMI trust funds from the
general fund of the Treasury. Only a very small percentage of total HI
trust fund income each year is attributable to general revenue.
Gramm-Rudman-Hollings Act. The Balanced Budget and
Emergency Deficit Control Act of 1985.
Gross Domestic Product (GDP). The total dollar value of all goods
and services produced in a year in the United States, regardless of
who supplies the labor or property.
High cost alternative. See “Assumptions.”
Home health agency (HHA). A public agency or private
organization that is primarily engaged in providing the following
services in the home: skilled nursing services, other therapeutic
services (such as physical, occupational, or speech therapy), and home
health aide services.

Appendices
202
Hospice. A provider of care for the terminally ill; delivered services
generally include home health care, nursing care, physician services,
medical supplies, and short-term inpatient hospital care.
Hospital assumptions. These include differentials between hospital
labor and non-labor indices compared with general economy labor and
non-labor indices; rates of admission incidence; the trend toward
treating less complicated cases in outpatient settings; and continued
improvement in DRG coding.
Hospital coinsurance. For the 61st through 90th day of
hospitalization in a benefit period, a daily amount for which the
beneficiary is responsible, equal to one-fourth of the inpatient
hospital deductible; for lifetime reserve days, a daily amount for
which the beneficiary is responsible, equal to one-half of the inpatient
hospital deductible (see “Lifetime reserve days”).
Hospital input price index. An alternate name for “hospital
market basket.”
Hospital Insurance (HI). The Medicare trust fund that covers
specified inpatient hospital services, posthospital skilled nursing
care, home health services, and hospice care for aged and disabled
individuals who meet the eligibility requirements. Also known as
Medicare Part A.
Hospital market basket. The cost of the mix of goods and services
(including personnel costs but excluding nonoperating costs)
comprising routine, ancillary, and special care unit inpatient hospital
services.
Income rate. The ratio of income from tax revenues on an incurred
basis (payroll tax contributions and income from the taxation of
OASDI benefits) to the HI taxable payroll for the year.
Incurred basis. The costs based on when the service was performed
rather than when the payment was made.
Independent laboratory. A free-standing clinical laboratory
meeting conditions for participation in the Medicare program and
billing through a carrier.
Initial coverage limit. The amount up to which the coinsurance
applies under the standard prescription drug benefit.

Glossary
203
Inpatient hospital deductible. An amount of money that is
deducted from the amount payable by Medicare Part A for inpatient
hospital services furnished to a beneficiary during a spell of illness.
Inpatient hospital services. These services include bed and board,
nursing services, diagnostic or therapeutic services, and medical or
surgical services.
Interest. A payment for the use of money during a specified period.
Interfund borrowing. The borrowing of assets by a trust fund
(OASI, DI, HI, or SMI) from another of the trust funds when one of
the funds is in danger of exhaustion. Interfund borrowing was
authorized only during 1982-1987.
Intermediary. A private or public organization that is under
contract to CMS to determine costs of, and make payments to,
providers for HI and certain SMI Part B services.
Intermediate assumptions. See “Assumptions.”
Late enrollment penalty. Additional beneficiary premium amounts
for those who either do not enroll in Part D at the first opportunity or
fail to maintain other creditable coverage for more than 63 days.
Lifetime reserve days. Under HI, each beneficiary has 60 lifetime
reserve days that he or she may opt to use when regular inpatient
hospital benefits are exhausted. The beneficiary pays one-half of the
inpatient hospital deductible for each lifetime reserve day used.
Long range. The next 75 years.
Low cost alternative. See “Assumptions.”
Low-income beneficiaries. Individuals meeting income and assets
tests who are eligible for prescription drug coverage subsidies to help
finance premiums and out-of-pocket payments.
Managed care. Includes Health Maintenance Organizations
(HMOs), Competitive Medical Plans (CMPs), and other plans that
provide health services on a prepayment basis, which is based on
either cost or risk, depending on the type of contract the plans have
with Medicare. See also “Medicare Advantage.”
Market basket. See “Hospital market basket.”

Appendices
204
Maximum tax base. Annual dollar amount above which earnings in
employment covered under HI are not taxable. Beginning in 1994, the
maximum tax base was eliminated under HI.
Maximum taxable amount of annual earnings. See “Maximum
tax base.”
Medicare. A nationwide, federally administered health insurance
program authorized in 1965 to cover the cost of hospitalization,
medical care, and some related services for most people over age 65.
In 1972, coverage was extended to people receiving Social Security
Disability Insurance payments for 2 years and to people with end-
stage renal disease. In 2006, prescription drug coverage was added as
well. Medicare consists of two separate but coordinated trust funds:
Hospital Insurance (HI, or Part A) and Supplementary Medical
Insurance (SMI). The SMI trust fund is composed of three separate
accounts: the Part B account, the Part D account, and the
Transitional Assistance Account. Almost all persons who are aged 65
and over or disabled and who are entitled to HI are eligible to enroll
in Part B and Part D on a voluntary basis by paying monthly
premiums. Health insurance protection is available to Medicare
beneficiaries without regard to income.
Medicare Advantage (formerly called Medicare+Choice). An
expanded set of options, established by the Medicare Modernization
Act, for the delivery of health care under Medicare. Most Medicare
beneficiaries can choose to receive benefits through the original fee-
for-service program or through one of the following Medicare
Advantage plans: (i) coordinated care plans (such as health
maintenance organizations, provider sponsored organizations, and
preferred provider organizations); (ii) Medical Savings Account
(MSA)/High Deductible plans (through a demonstration available to
up to 390,000 beneficiaries); or (iii) private fee-for-service plans.
Medicare Advantage Prescription Drug Plan (MA-PDP).
Prescription drug coverage provided by Medicare Advantage plans.
Medicare Economic Index (MEI). An index often used in the
calculation of the increases in the prevailing charge levels that help
to determine allowed charges for physician services. In 1992 and
later, this index is considered in connection with the update factor for
the physician fee schedule.
Medicare Payment Advisory Commission (MedPAC). A
commission established by Congress in the Balanced Budget Act of
Glossary
205
1997 to replace the Prospective Payment Assessment Commission
and the Physician Payment Review Commission. MedPAC is directed
to provide the Congress with advice and recommendations on policies
affecting the Medicare program.
Medicare Prescription Drug Account. The separate account
within the SMI trust fund to manage revenues and expenditures of
the Part D drug benefit.
Military service wage credits. Credits recognizing that military
personnel receive other cash payments and wages in kind (such as
food and shelter) in addition to their basic pay. Noncontributory wage
credits of $160 were provided for each month of active military
service from September 16, 1940 through December 31, 1956. For
years after 1956, the basic pay of military personnel is covered under
the Social Security program on a contributory basis. In addition to
contributory credits for basic pay, noncontributory wage credits of
$300 were granted for each calendar quarter in which a person
received pay for military service from January 1957 through
December 1977. Deemed wage credits of $100 were granted for each
$300 of military wages, up to a maximum of $1,200 per calendar year,
from January 1978 through December 2001. See also “Quinquennial
military service determinations and adjustments.”
National average monthly bid. The weighted average of all drug
bids including all of the bids from PDPs and the drug portion of bids
from MA-PDPs.
Noncontributory or deemed wage credits. Wages and wages in
kind that were not subject to the HI tax but are deemed as having
been. Deemed wage credits exist for the purposes of (i) determining
HI eligibility for individuals who might not be eligible for HI coverage
without payment of a premium were it not for the deemed wage
credits; and (ii) calculating reimbursement due the HI trust fund
from the general fund of the Treasury. The first purpose applies in
the case of providing coverage to persons during the transitional
periods when HI began and when it was expanded to cover Federal
employees; both purposes apply in the cases of military service wage
credits and deemed wage credits granted for the internment of
persons of Japanese ancestry during World War II.
Old-Age, Survivors, and Disability Insurance (OASDI). The
Social Security programs that pay for (i) monthly cash benefits to
retired-worker (old-age) beneficiaries, their spouses and children, and
survivors of deceased insured workers (OASI); and (ii) monthly cash

Appendices
206
benefits to disabled-worker beneficiaries and their spouses and
children, and for providing rehabilitation services to the disabled
(DI).
Open-group population. Includes all persons who will ever
participate in the program as either taxpayers or beneficiaries, or
both. See also “Closed-group population.”
Outpatient hospital. Part of the hospital providing services covered
by SMI Part B, including services in an emergency room or outpatient
clinic, ambulatory surgical procedures, medical supplies such as
splints, laboratory tests billed by the hospital, etc.
Part A. The Medicare Hospital Insurance trust fund.
Part A premium. A monthly premium paid by or on behalf of
individuals who wish for and are entitled to voluntary enrollment in
Medicare HI. These individuals are those who are aged 65 and older,
are uninsured for social security or railroad retirement, and do not
otherwise meet the requirements for entitlement to Part A. Disabled
individuals who have exhausted other entitlement are also qualified.
These individuals are those not now entitled but who have been
entitled under section 226(b) of the Act, who continue to have the
disabling impairment upon which their entitlement was based, and
whose entitlement ended solely because the individuals had earnings
that exceeded the substantial gainful activity amount (as defined in
section 223(d)(4) of the Act).
Part B. The account within the Medicare Supplementary Medical
Insurance trust fund that pays for a portion of the costs of physicians‟
services, outpatient hospital services, and other related medical and
health services for voluntarily enrolled aged and disabled individuals.
Part B premium. Monthly premium paid by those individuals who
have voluntarily enrolled in Part B.
Part C. See “Medicare Advantage.”
Part D. The account within the Medicare Supplementary Medical
Insurance trust fund that pays private plans to provide prescription
drug coverage.
Participating hospitals. Those hospitals that participate in the
Medicare program.

Glossary
207
Pay-as-you-go financing. A financing scheme in which taxes are
scheduled to produce just as much income as required to pay current
benefits, with trust fund assets built up only to the extent needed to
prevent exhaustion of the fund by random fluctuations.
Payroll taxes. Taxes levied on the gross wages of workers.
PDP regions. Regional areas that are fully serviced by prescription
drug plans.
Peer Review Organization (PRO). A group of practicing
physicians and other health care professionals paid by the Federal
Government to review the care given to Medicare patients. Starting
in 2002, these organizations are called Quality Improvement
Organizations.
Percentile. A number that corresponds to one of the equal divisions
of the range of a variable in a given sample and that characterizes a
value of the variable as not exceeded by a specified percentage of all
the values in the sample. For example, a score higher than 97 percent
of those attained is said to be in the 97th percentile.
Prescription Drug Plans (PDPs). Stand-alone prescription drug
plans offered to beneficiaries in traditional fee-for-service Medicare
and to beneficiaries in Medicare Advantage plans that do not offer a
prescription drug benefit.
Present value. The present value of a future stream of payments is
the lump-sum amount that, if invested today, together with interest
earnings would be just enough to meet each of the payments as it fell
due. At the time of the last payment, the invested fund would be
exactly zero.
Projection error. Degree of variation between estimated and actual
amounts.
Prospective payment system (PPS). A method of reimbursement
in which Medicare payment is made based on a predetermined, fixed
amount. The payment amount for a particular service is derived
based on the classification system of that service (for example, DRGs
for inpatient hospital services).
Provider. Any organization, institution, or individual who provides
health care services to Medicare beneficiaries. Hospitals (inpatient
services), skilled nursing facilities, home health agencies, and

Appendices
208
hospices are the providers of services covered under Medicare Part A.
Physicians, ambulatory surgical centers, and outpatient clinics are
some of the providers of services covered under Medicare Part B.
Quality Improvement Organization (QIO). See “Peer Review
Organization.”
Quinquennial military service determination and
adjustments. Prior to the Social Security Amendments of 1983,
quinquennial determinations (that is, estimates made once every
5 years) were made of the costs arising from the granting of deemed
wage credits for military service prior to 1957; annual
reimbursements were made from the general fund of the Treasury to
the HI trust fund for these costs. The Social Security Amendments of
1983 provided for (i) a lump-sum transfer in 1983 for (a) the costs
arising from the pre-1957 wage credits, and (b) amounts equivalent to
the HI taxes that would have been paid on the deemed wage credits
for military service for 1966 through 1983, inclusive, if such credits
had been counted as covered earnings; (ii) quinquennial adjustments
to the pre-1957 portion of the 1983 lump-sum transfer; (iii) general
fund transfers equivalent to HI taxes on military deemed wage
credits for 1984 and later, to be credited to the fund on July 1 of each
year; and (iv) adjustments as deemed necessary to any previously
transferred amounts representing HI taxes on military deemed wage
credits.
Railroad Retirement. A Federal insurance program similar to
Social Security designed for workers in the railroad industry. The
provisions of the Railroad Retirement Act provide for a system of
coordination and financial interchange between the Railroad
Retirement program and the Social Security program.
Real-wage differential. The difference between the percentage
increases, before rounding, in (i) the average annual wage in covered
employment, and (ii) the average annual CPI.
Reasonable-cost basis. The calculation to determine the reasonable
cost incurred by individual providers when furnishing covered
services to beneficiaries. The reasonable cost is based on the actual
cost of providing such services, including direct and indirect costs of
providers, and excluding any costs that are unnecessary in the
efficient delivery of services covered by a health insurance program.

Glossary
209
Reinsurance subsidy. Payments to the prescription drug plans in
the amount of 80 percent of drug expenses that exceed the annual
out-of-pocket threshold.
Residual factors. Factors other than price, including volume of
services, intensity of services, and age/sex changes.
Risk corridor. Triggers that are set to protect prescription drug
plans from unexpected losses and that allow the government to share
in unexpected gains.
Self-employment. Operation of a trade or business by an individual
or by a partnership in which an individual is a member.
Self-Employment Contributions Act (SECA). Provision
authorizing taxes on the net income of most self-employed persons to
provide for OASDI and HI.
Sequester. The reduction of funds to be used for benefits or
administrative costs from a Federal account, based on the
requirements specified in the Gramm-Rudman-Hollings Act.
Short range. The next 10 years.
Skilled nursing facility (SNF). An institution that is primarily
engaged in providing skilled nursing care and related services for
residents who require medical or nursing care, or that is engaged in
the rehabilitation of injured, disabled, or sick persons.
SNF coinsurance. For the 21st through 100th day of extended care
services in a benefit period, a daily amount for which the beneficiary
is responsible, equal to one-eighth of the inpatient hospital
deductible.
Social Security Act. Public Law 74-271, enacted on
August 14, 1935, with subsequent amendments. The Social Security
Act consists of 20 titles, four of which have been repealed. The HI and
SMI trust funds are authorized by Title XVIII of the Social Security
Act.
Special public-debt obligation. Securities of the U.S. Government
issued exclusively to the OASI, DI, HI, and SMI trust funds and other
Federal trust funds. Sections 1817(c) and 1841(a) of the Social
Security Act provide that the public-debt obligations issued for
purchase by the HI and SMI trust funds, respectively, shall have

Appendices
210
maturities fixed with due regard for the needs of the funds. The usual
practice in the past has been to spread the holdings of special issues,
as of every June 30, so that the amounts maturing in each of the next
15 years are approximately equal. Special public-debt obligations are
redeemable at par at any time.
Spell of illness. A period of consecutive days, beginning with the
first day on which a beneficiary is furnished inpatient hospital or
extended care services, and ending with the close of the first period of
60 consecutive days thereafter in which the beneficiary is in neither a
hospital nor a skilled nursing facility.
Standard prescription drug coverage. Prescription drug coverage
that includes a deductible, coinsurance up to an initial coverage limit,
and protection against high out-of-pocket expenditures by having
reduced coinsurance provisions for individuals exceeding the out-of-
pocket threshold.
Stochastic model. An analysis involving a random variable. For
example, a stochastic model may include a frequency distribution for
one assumption. From the frequency distribution, possible outcomes
for the assumption are selected randomly for use in an illustration.
Summarized cost rate. The ratio of the present value of
expenditures to the present value of the taxable payroll for the years
in a given period. In this context, the expenditures are on an incurred
basis and exclude costs for those uninsured persons for whom
payments are reimbursed from the general fund of the Treasury, and
for voluntary enrollees, who pay a premium in order to be enrolled.
The summarized cost rate includes the cost of reaching and
maintaining a “target” trust fund level, known as a contingency fund
ratio. Because a trust fund level of about 1 year‟s expenditures is
considered to be an adequate reserve for unforeseen contingencies,
the targeted contingency fund ratio used in determining summarized
cost rates is 100 percent of annual expenditures. Accordingly, the
summarized cost rate is equal to the ratio of (i) the sum of the present
value of the outgo during the period, plus the present value of the
targeted ending trust fund level, plus the beginning trust fund level,
to (ii) the present value of the taxable payroll during the period.
Summarized income rate. The ratio of (i) the present value of the
tax revenues incurred during a given period (from both payroll taxes
and taxation of OASDI benefits), to (ii) the present value of the
taxable payroll for the years in the period.

Glossary
211
Supplementary Medical Insurance (SMI). The Medicare trust
fund composed of the Part B account, the Part D account, and the
Transitional Assistance Account. The Part B account pays for a
portion of the costs of physicians‟ services, outpatient hospital
services, and other related medical and health services for voluntarily
enrolled aged and disabled individuals. The Part D account pays
private plans to provide prescription drug coverage, beginning in
2006. The Transitional Assistance Account paid for transitional
assistance under the prescription drug card program in 2004 and
2005.
Supplemental prescription drug coverage. Coverage in excess of
the standard prescription drug coverage.
Sustainable growth rate. A system for establishing goals for the
rate of growth in expenditures for physicians‟ services.
Tax rate. The percentage of taxable earnings, up to the maximum
tax base, that is paid for the HI tax. Currently, the percentages are
1.45 for employees and employers, each. The self-employed pay
2.9 percent.
Taxable earnings. Taxable wages and/or self-employment income
under the prevailing annual maximum taxable limit.
Taxable payroll. A weighted average of taxable wages and taxable
self-employment income. When multiplied by the combined employee-
employer tax rate, it yields the total amount of taxes incurred by
employees, employers, and the self-employed for work during the
period.
Taxable self-employment income. Net earnings from self-
employment—generally above $400 and below the annual maximum
taxable amount for a calendar or other taxable year—less any taxable
wages in the same taxable year.
Taxable wages. Wages paid for services rendered in covered
employment up to the annual maximum taxable amount.
Taxation of benefits. Beginning in 1994, up to 85 percent of an
individual‟s or a couple‟s OASDI benefits is potentially subject to
Federal income taxation under certain circumstances. The revenue
derived from taxation of benefits in excess of 50 percent, up to
85 percent, is allocated to the HI trust fund.

Appendices
212
Taxes. See “Payroll taxes.”
Term insurance. A type of insurance that is in force for a specified
period of time.
Test of Long-Range Close Actuarial Balance. Summarized
income rates and cost rates are calculated for each of 66 valuation
periods within the full 75-year long-range projection period under the
intermediate assumptions. The first of these periods consists of the
next 10 years. Each succeeding period becomes longer by 1 year,
culminating with the period consisting of the next 75 years. The long-
range test is met if, for each of the 66 time periods, the actuarial
balance is not less than zero or is negative by, at most, a specified
percentage of the summarized cost rate for the same time period. The
percentage allowed for a negative actuarial balance is 5 percent for
the full 75-year period and is reduced uniformly for shorter periods,
approaching zero as the duration of the time periods approaches the
first 10 years. The criterion for meeting the test is less stringent for
the longer periods in recognition of the greater uncertainty associated
with estimates for more distant years. This test is applied to HI trust
fund projections made under the intermediate assumptions.
Test of Short-Range Financial Adequacy. The conditions
required to meet this test are as follows: (i) If the trust fund ratio for
a fund exceeds 100 percent at the beginning of the projection period,
then it must be projected to remain at or above 100 percent
throughout the 10-year projection period; (ii) alternatively, if the fund
ratio is initially less than 100 percent, it must be projected to reach a
level of at least 100 percent within 5 years (and not be depleted at
any time during this period), and then remain at or above 100 percent
throughout the rest of the 10-year period. This test is applied to HI
trust fund projections made under the intermediate assumptions.
Transitional assistance. An interim benefit for 2004 and 2005 that
provides up to $600 per year to assist low-income beneficiaries who
have no drug insurance coverage with prescription drug purchases.
This benefit also pays the enrollment fee in the Medicare Prescription
Drug Discount Card program.
Transitional Assistance Account. The separate account within the
SMI trust fund to manage revenues and expenditures for the
transitional assistance drug benefit in 2004 and 2005.
Trust fund. Separate accounts in the U. S. Treasury, mandated by
Congress, whose assets may be used only for a specified purpose. For

Glossary
213
the HI and SMI trust funds, monies not withdrawn for current
benefit payments and administrative expenses are invested in
interest-bearing Federal securities, as required by law; the interest
earned is also deposited in the trust funds.
Trust fund ratio. A short-range measure of the adequacy of the HI
and SMI trust fund level; defined as the assets at the beginning of the
year expressed as a percentage of the outgo during the year.
Unit input intensity allowance. The amount added to, or
subtracted from, the hospital input price index to yield the
prospective payment system update factor.
Valuation period. A period of years that is considered as a unit for
purposes of calculating the status of a trust fund.
Voluntary enrollees. Certain individuals, aged 65 or older or
disabled, who are not otherwise entitled to Medicare and who opt to
obtain coverage under Part A by paying a monthly premium.
Year of exhaustion. The first year in which a trust fund is unable to
pay benefits when due because the assets of the fund are exhausted.

List of tables
214
TABLES
II.B1.— Medicare Data for Calendar Year 2005 ................................. 5
II.C1.— Ultimate Assumptions ............................................................ 7
II.E1.— Estimated Operations of the HI Trust Fund under
Intermediate Assumptions, Calendar Years 2005-2015 ..... 15
II.F1.— Estimated Operations of the SMI Trust Fund under
Intermediate Assumptions, Calendar Years 2005-2015 ..... 22
III.A1.— Total Medicare Income, Expenditures, and Trust Fund
Assets during Calendar Years 1970-2015 ........................... 30
III.A2.— Hl and SMI Incurred Expenditures as a Percentage of
the Gross Domestic Product ................................................. 33
III.A3.— Medicare Enrollment ............................................................ 34
III.A4.— Medicare Sources of Income and Expenditures as a
Percentage of the Gross Domestic Product.......................... 35
III.A5.— Comparative Growth Rates of Medicare, Private Health
Insurance, and National Health Expenditures ................... 38
III.B1.— Statement of Operations of the HI Trust Fund during
Fiscal Year 2005 .................................................................... 41
III.B2.— Tax Rates and Maximum Tax Bases ................................... 42
III.B3.— Comparison of Actual and Estimated Operations of the
HI Trust Fund, Fiscal Year 2005 ......................................... 45
III.B4.— Operations of the HI Trust Fund during Calendar Years
1970-2015 ............................................................................... 48
III.B5.— Estimated Operations of the HI Trust Fund during
Calendar Years 2005-2015, under Alternative Sets of
Assumptions .......................................................................... 51
III.B6.— Ratio of Assets at the Beginning of the Year to
Expenditures during the Year for the HI Trust Fund ........ 52
III.B7.— HI Cost and Income Rates .................................................... 55
III.B8.— HI Actuarial Balances under Three Sets of Assumptions .. 60
III.B9.— Components of 75-Year HI Actuarial Balance under
Intermediate Assumptions (2006-2080) .............................. 61
III.B10.— Unfunded HI Obligations from Program Inception
through the Infinite Horizon ................................................ 64
III.B11.— Unfunded HI Obligations for Current and Future
Program Participants through the Infinite Horizon ........... 65
III.B12.— Change in the 75-Year Actuarial Balance since the
2005 Report............................................................................ 69
III.B13.— Estimated HI Income Rates, Cost Rates, and Actuarial
Balances, Based on Intermediate Estimates with
Various Real-Wage Assumptions ......................................... 70

List of Tables
215
III.B14.— Estimated HI Income Rates, Cost Rates, and Actuarial
Balances, Based on Intermediate Estimates with
Various CPI-Increase Assumptions ..................................... 71
III.B15.— Estimated HI Income Rates, Cost Rates, and Actuarial
Balances, Based on Intermediate Estimates with
Various Real-Interest Assumptions ..................................... 72
III.B16.— Estimated HI Income Rates, Cost Rates, and Actuarial
Balances, Based on Intermediate Estimates with
Various Health Care Cost Growth Rate Assumptions ....... 74
III.C1.— Operations of the SMI Trust Fund (Cash Basis) during
Calendar Years 1970−2015 .................................................. 76
III.C2.— SMI Expenditures (Incurred Basis) as a Percentage of
the Gross Domestic Product ................................................. 77
III.C3.— Average Annual Rates of Growth in SMI and the
Economy ................................................................................. 78
III.C4.— SMI General Revenues as a Percentage of Personal and
Corporate Federal Income Taxes ......................................... 81
III.C5.— Statement of Operations of the Part B Account in the
SMI Trust Fund during Fiscal Year 2005 ........................... 82
III.C6.— Standard Part B Monthly Premium Rates, Actuarial
Rates, and Premium Rates as a Percentage of Part B
Cost ........................................................................................ 84
III.C7.— Comparison of Actual and Estimated Operations of the
Part B Account in the SMI Trust Fund, Fiscal Year
2005 ........................................................................................ 87
III.C8.— Operations of the Part B Account in the SMI Trust
Fund (Cash Basis) during Calendar Years 1970−2015 ...... 89
III.C9.— Growth in Part B Benefits (Cash Basis) through
December 31, 2015 ................................................................ 92
III.C10.— Estimated Operations of the Part B Account in the SMI
Trust Fund during Calendar Years 2005-2015, under
Alternative Sets of Assumptions .......................................... 94
III.C11.— Estimated Part B Income and Expenditures (Incurred
Basis) for Financing Periods through
December 31, 2006 ................................................................ 97
III.C12.— Summary of Estimated Part B Assets and Liabilities as
of the End of the Financing Period, for Periods through
December 31, 2006 ................................................................ 98
III.C13.— Actuarial Status of the Part B Account in the SMI
Trust Fund under Three Cost Sensitivity Scenarios for
Financing Periods through December 31, 2006 ................ 100
III.C14.— Part B Expenditures (Incurred Basis) as a Percentage
of the Gross Domestic Product ........................................... 102

List of tables
216
III.C15.— Unfunded Part B Obligations from Program Inception
through the Infinite Horizon .............................................. 104
III.C16.— Unfunded Part B Obligations for Current and Future
Program Participants through the Infinite Horizon ......... 105
III.C17.— Operations of the Part D Account in the SMI Trust
Fund (Cash Basis) during Calendar Years 2004-2015 ..... 108
III.C18.— Growth in Part D Benefits (Cash Basis) through
December 31, 2015 .............................................................. 109
III.C19.— Estimated Operations of the Part D Account in the SMI
Trust Fund during Calendar Years 2005-2015, under
Alternative Sets of Assumptions ........................................ 110
III.C20.— Part D Expenditures (Incurred Basis) as a Percentage
of the Gross Domestic Product ........................................... 114
III.C21.— Unfunded Part D Obligations from Program Inception
through the Infinite Horizon .............................................. 115
III.C22.— Unfunded Part D Obligations for Current and Future
Program Participants through the Infinite Horizon ......... 116
IV.A1.— Components of Historical and Projected Increases in HI
Inpatient Hospital Payments ............................................. 121
IV.A2.— Relationship between Increases in HI Expenditures and
Increases in Taxable Payroll .............................................. 125
IV.A3.— Summary of HI Alternative Projections ............................ 129
IV.B1.— Components of Increases in Total Allowed Charges per
Fee-for-Service Enrollee for Carrier Services.................... 135
IV.B2.— Incurred Reimbursement Amounts per Fee-for-Service
Enrollee for Carrier Services .............................................. 137
IV.B3.— Components of Increases in Recognized Charges and
Costs per Fee-for-Service Enrollee for Intermediary
Services ................................................................................ 139
IV.B4.— Incurred Reimbursement Amounts per Fee-for-Service
Enrollee for Intermediary Services .................................... 140
IV.B5.— Enrollment and Incurred Reimbursement for End-Stage
Renal Disease ...................................................................... 141
IV.B6.— Enrollment and Incurred Reimbursement for Managed
Care ...................................................................................... 142
IV.B7.— Aggregate Reimbursement Amounts on a Cash Basis ..... 144
IV.B8.— Part B Cash Expenditures as a Percentage of the Gross
Domestic Product for Calendar Years 2005-2015 ............. 145
IV.B9.— Part D Enrollment .............................................................. 147
IV.B10.— Key Factors for Part D Expenditures Estimates .............. 148
IV.B11.— Incurred Reimbursement Amounts per Enrollee for
Part D Expenditures ........................................................... 150
IV.B12.— Aggregate Reimbursements on a Cash Basis for Part D .. 151

List of Tables
217
IV.B13.— Part D Assumptions under Alternative Scenarios for
Calendar Years 2006-2015 ................................................. 152
IV.B14.— Part D Cash Expenditures as a Percentage of the Gross
Domestic Product for Calendar Years 2005-2015 ............. 153
V.B1.— HI and SMI Average per Beneficiary Costs ...................... 160
V.C1.— HI Cost Sharing and Premium Amounts .......................... 163
V.C2.— SMI Cost Sharing and Premium Amounts ........................ 165
V.D1.— Estimated Incurred Part B Benefit Expenditures, by
Percentile of Projection Distribution ................................. 173
V.D2.— Percentiles of Part B Benefit Expenditure Distribution
Corresponding to Low, Intermediate, and High Cost
Estimates ............................................................................. 173
V.E1.— Annual Revenues and Expenditures for Medicare and
Social Security Trust Funds and the Total Federal
Budget, Fiscal Year 2005 .................................................... 181
V.E2.— Present Values of Projected Revenue and Cost
Components of 75-Year Open-Group Obligations for HI,
SMI, and OASDI ................................................................. 184
V.F1.— Total Medicare Income, Expenditures, and Trust Fund
Assets during Fiscal Years 1970-2015 ............................... 187
V.F2.— Operations of the HI Trust Fund during Fiscal Years
1970-2015 ............................................................................. 188
V.F3.— Operations of the SMI Trust Fund (Cash Basis) during
Fiscal Years 1970-2015 ....................................................... 190
V.F4.— Operations of the Part B Account in the SMI Trust
Fund (Cash Basis) during Fiscal Years 1970-2015 ........... 191
V.F5.— Operations of the Part D Account in the SMI Trust
Fund (Cash Basis) during Fiscal Years 2005-2015 ........... 192
V.F6.— Assets of the HI Trust Fund, by Type, at the End of
Fiscal Years 2004 and 2005 ................................................ 193
V.F7.— Assets of the Part B Account in the SMI Trust Fund, by
Type, at the End of Fiscal Years 2004 and 2005 ............... 194

List of Figures
218
FIGURES
II.D1.— Medicare Expenditures as a Percentage of the Gross
Domestic Product .................................................................. 11 II.D2.— Medicare Sources of Non-Interest Income and
Expenditures as a Percentage of the Gross Domestic
Product ................................................................................... 12 II.E1.— Long-Range HI Income and Cost as a Percentage of
Taxable Payroll, Intermediate Assumptions ....................... 17 II.E2.— HI Trust Fund Balance at Beginning of Year as a
Percentage of Annual Expenditures .................................... 19 II.F1.— SMI Expenditures and Premiums as a Percentage of the
Gross Domestic Product ........................................................ 25 III.A1.— Projected Difference between Total Medicare Outlays
and Dedicated Financing Sources, as a Percentage of
Total Outlays ......................................................................... 36 III.B1.— HI Expenditures and Income ............................................... 47 III.B2.— HI Trust Fund Balance at Beginning of Year as a
Percentage of Annual Expenditures .................................... 53 III.B3.— Estimated HI Cost and Income Rates as a Percentage of
Taxable Payroll ..................................................................... 56 III.B4.— Workers per HI Beneficiary .................................................. 58 III.B5.— Present Value of Cumulative HI Taxes Less
Expenditures through Year Shown, Evaluated under
Current Law Tax Rates and Legislated Expenditures ....... 62 III.B6.— Comparison of HI Cost and Income Rate Projections:
Current versus Prior Year‟s Reports ................................... 66 III.C1.— Comparison of Average Monthly SMI Benefits,
Premiums, and Cost-Sharing to the Average Monthly
Social Security Benefit .......................................................... 80 III.C2.— Part B Aged and Disabled Monthly Per Capita Income ..... 85 III.C3.— Premium Income as a Percentage of Part B
Expenditures ......................................................................... 91 III.C4.— Actuarial Status of the SMI Trust Fund through
Calendar Year 2005 ............................................................ 101 V.D1.— 95-Percent Projection Interval for Part B Incurred
Benefits ................................................................................ 172 V.D2.— 95-Percent Projection Interval for Financing Status of
Part B Account of SMI Trust Fund .................................... 176 V.D3.— Frequency Distribution of Estimation Errors for Part B
Account of SMI Trust Fund Surplus Ratio ........................ 177

Statement of Actuarial Opinion
219
STATEMENT OF ACTUARIAL OPINION
It is my opinion that (1) the techniques and methodology used herein to evaluate the financial status of the Federal Hospital Insurance Trust Fund and the Federal Supplementary Medical Insurance Trust Fund are based upon sound principles of actuarial practice and are generally accepted within the actuarial profession; and (2) the principal assumptions used and the resulting actuarial estimates are, individually and in the aggregate, reasonable for the purpose of evaluating the financial status of the trust funds under current law, taking into consideration the past experience and future expectations for the population, the economy, and the program.
In past reports, and again this year, the Board of Trustees has emphasized the strong likelihood that actual Part B expenditures will exceed the projections under current law, due to further legislative action to avoid substantial reductions in the Medicare physician fee schedule. While the Part B projections in this report are reasonable in their portrayal of future costs under current law, they are not reasonable as an indication of actual future costs. Current law would require physician fee reductions totaling an estimated 37 percent over the next 9 years—an implausible result.
The Trustees have also noted the uncertainty associated with the cost of the new Medicare prescription drug benefit. The availability of the 2006 bid submissions by the private plans offering this coverage, together with preliminary data on beneficiary enrollment, has helped narrow the range of uncertainty. Nonetheless, this range remains substantial, as illustrated by the Part D projections under alternative assumptions. The projection uncertainty should continue to decline over the next few years as actual expenditure data under this new program become available.
A refinement to the long-range health cost growth assumption is presented in this year‟s report. Growth rates are assumed to initially exceed the traditional “GDP plus 1 percent” assumption but subsequently to decline below this level, resulting in a more intuitive pattern of change for this factor. This change represents a useful, though limited, step toward the goal of establishing this critical assumption through an economic modeling process.
Richard S. Foster
Fellow, Society of Actuaries
Member, American Academy of Actuaries
Chief Actuary, Centers for Medicare & Medicaid Services