2006 report card for employment and training programs...
TRANSCRIPT
2006 REPORT CARD FOR EMPLOYMENT AND TRAINING PROGRAMS:
COVERING PROGRAMS JULY 1, 2001-JUNE 30, 2005
The Connecticut Employment and Training Commission July 2006
2006 REPORT CARD FOR EMPLOYMENT AND TRAINING PROGRAMS
i
ACKNOWLEDGEMENTS
We wish to thank the various state agencies whose program information is presented in this report. Without their cooperation the information could never have been compiled. Special thanks goes to the Connecticut Department of Labor’s Office of Performance Management and Office of Research for their help in collecting and compiling the information. We also wish to thank the Implementation Committee of the Connecticut Employment and Training Commission and staff for their efforts in guiding and reviewing the production of this report. Wallace Barnes, Chairman Connecticut Employment and Training Commission John Brancato Workforce Allliance Joseph Carbone The Workplace Ajit Gobalakrishnan SDE Sonya Googins CT Legislature-CETC Lorna Joseph DOL Val Lewis DHE-CETC Kevin Loveland DSS Michael Meotti CT United Way Lew Miller CETC William Moore COSTA-CETC Win Oppel Admerica-CETC Rebecca Thomas Uconn Lyle Wray CRCOG
Lewis A. Miller Chair, Performance Accountability Workgroup Performance Accountability Workgroup Members: Staff: Alice Carrier, Office for Workforce Competitiveness Barry A. Goff, The Charter Oak Group, LLC Ronald W. Schack, The Charter Oak Group, LLC
2006 REPORT CARD FOR EMPLOYMENT AND TRAINING PROGRAMS
ii
Table of Contents ACKNOWLEDGEMENTS................................................................................................. i
Overview......................................................................................................................... 3 Jobs First Employment Services (JFES): Jobs First..................................................... 15 Trade Adjustment Assistance (TAA) / North American Free Trade Agreement - Transitional Adjustment Assistance (NAFTA-TAA)................................................... 19 Wagner-Peyser.............................................................................................................. 23 WIA Title IB – Adults and Dislocated Workers........................................................... 27 WIA Title IB – Youth ................................................................................................... 35 Charter Oak State College ............................................................................................ 39 Connecticut Community College System..................................................................... 43 Connecticut State University System............................................................................ 47 University of Connecticut: College of Continuing Studies ......................................... 55 University of Connecticut Undergraduate and Graduate.............................................. 58 Adult Education ............................................................................................................ 65
APPENDIX A................................................................................................................... 71 Guide to Reading the Report......................................................................................... 71
2006 REPORT CARD FOR EMPLOYMENT AND TRAINING PROGRAMS
3
Overview Introduction
Section 31-3bb of the Connecticut General Statutes (CGS) requires the Connecticut Employment and Training Commission (CETC) to report on the results of all employment and training programs in their annual inventory in regard to employment outcomes. The first report was issued in December 1998. The current report is the sixth since 1998.
The following factors provide necessary context for reading the reports on each of the programs providing employment and training services:
Connecticut’s workforce at the time of this report is 1.6 million The unemployment rate is 4.6 percent There are 55,675 annual openings in public and private non-farm employment The State’s workforce system has provided approximately 212,000
individuals with services lasting from a few weeks to several years in PY2005 The State’s workforce system as represented in this report has exited and
returned to the workforce approximately 48,000 workers1 This report presents information on 10 programs. The various aspects of employment status are reported for those who completed services during PY2000 to PY2004 in these programs:
Jobs first Employment Services (JFES) Trade Adjustment Assistance Wagner-Peyser WIA Title IB – Adult, Dislocated Workers and Youth Charter Oak State College Connecticut Community College System Connecticut State University System University of Connecticut: College of Continuing Studies University of Connecticut Undergraduate and Graduate Adult Education
These 10 programs can be further organized into three groupings: 1) Short term training and employment services programs, 2) post-secondary programs, and 3) adult education programs that address the needs for adults to improve basic skill. The CETC Annual Plan There are several ways in which this report intersects with and supports the CETC 2005 Annual Plan. First, a major goal within the plan is to “Enhance performance measurement and results accountability.” This report is a part of that performance accountability strategy.
1 The number of individuals who entered employment from the programs discussed in this report.
2006 REPORT CARD FOR EMPLOYMENT AND TRAINING PROGRAMS
4
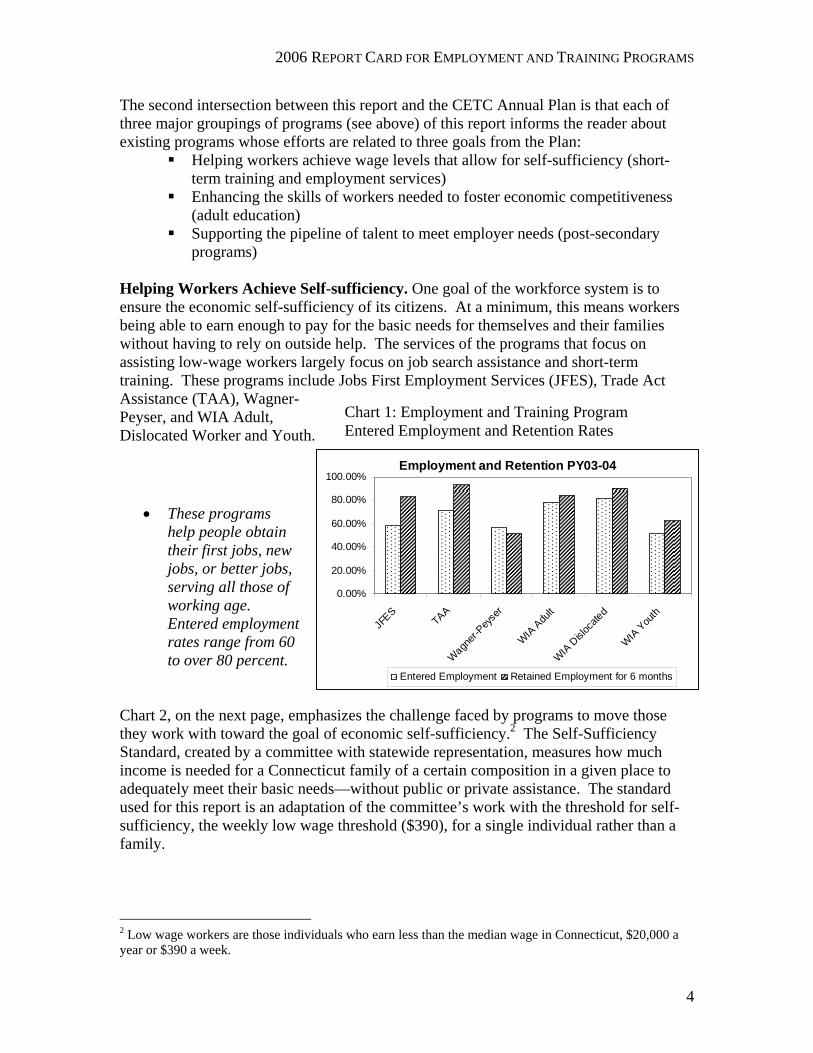
Chart 1: Employment and Training Program Entered Employment and Retention Rates
The second intersection between this report and the CETC Annual Plan is that each of three major groupings of programs (see above) of this report informs the reader about existing programs whose efforts are related to three goals from the Plan:
Helping workers achieve wage levels that allow for self-sufficiency (short-term training and employment services)
Enhancing the skills of workers needed to foster economic competitiveness (adult education)
Supporting the pipeline of talent to meet employer needs (post-secondary programs)
Helping Workers Achieve Self-sufficiency. One goal of the workforce system is to ensure the economic self-sufficiency of its citizens. At a minimum, this means workers being able to earn enough to pay for the basic needs for themselves and their families without having to rely on outside help. The services of the programs that focus on assisting low-wage workers largely focus on job search assistance and short-term training. These programs include Jobs First Employment Services (JFES), Trade Act Assistance (TAA), Wagner-Peyser, and WIA Adult, Dislocated Worker and Youth.
• These programs help people obtain their first jobs, new jobs, or better jobs, serving all those of working age. Entered employment rates range from 60 to over 80 percent.
Chart 2, on the next page, emphasizes the challenge faced by programs to move those they work with toward the goal of economic self-sufficiency.2 The Self-Sufficiency Standard, created by a committee with statewide representation, measures how much income is needed for a Connecticut family of a certain composition in a given place to adequately meet their basic needs—without public or private assistance. The standard used for this report is an adaptation of the committee’s work with the threshold for self-sufficiency, the weekly low wage threshold ($390), for a single individual rather than a family. 2 Low wage workers are those individuals who earn less than the median wage in Connecticut, $20,000 a year or $390 a week.
Employment and Retention PY03-04
0.00%
20.00%
40.00%
60.00%
80.00%
100.00%
JFES
TAA
Wagner-
Peyse
r
WIA Adu
lt
WIA D
isloca
ted
WIA You
th
Entered Employment Retained Employment for 6 months
2006 REPORT CARD FOR EMPLOYMENT AND TRAINING PROGRAMS
5
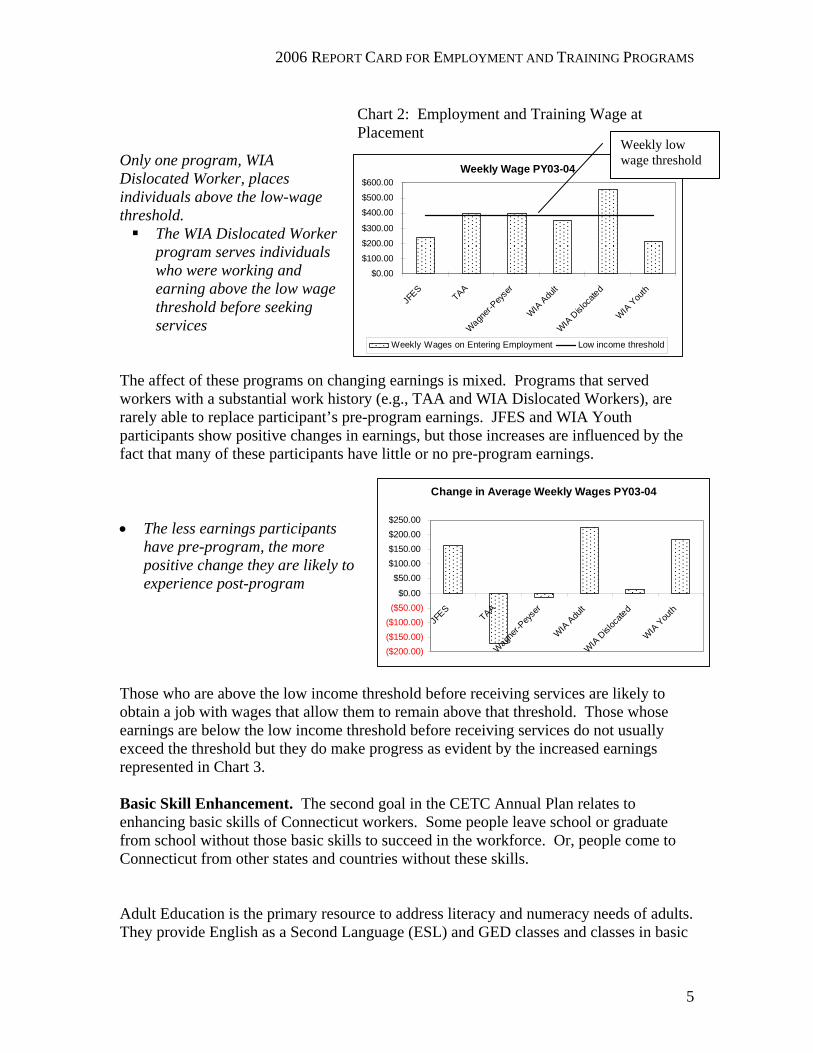
Chart 2: Employment and Training Wage at Placement
Chart 3: Employment and Training Wage Change
Only one program, WIA Dislocated Worker, places individuals above the low-wage threshold.
The WIA Dislocated Worker program serves individuals who were working and earning above the low wage threshold before seeking services
The affect of these programs on changing earnings is mixed. Programs that served workers with a substantial work history (e.g., TAA and WIA Dislocated Workers), are rarely able to replace participant’s pre-program earnings. JFES and WIA Youth participants show positive changes in earnings, but those increases are influenced by the fact that many of these participants have little or no pre-program earnings. • The less earnings participants
have pre-program, the more positive change they are likely to experience post-program
Those who are above the low income threshold before receiving services are likely to obtain a job with wages that allow them to remain above that threshold. Those whose earnings are below the low income threshold before receiving services do not usually exceed the threshold but they do make progress as evident by the increased earnings represented in Chart 3. Basic Skill Enhancement. The second goal in the CETC Annual Plan relates to enhancing basic skills of Connecticut workers. Some people leave school or graduate from school without those basic skills to succeed in the workforce. Or, people come to Connecticut from other states and countries without these skills. Adult Education is the primary resource to address literacy and numeracy needs of adults. They provide English as a Second Language (ESL) and GED classes and classes in basic
Weekly Wage PY03-04
$0.00
$100.00
$200.00
$300.00
$400.00
$500.00
$600.00
JFES
TAA
Wagner-
Peyse
r
WIA Adu
lt
WIA D
isloca
ted
WIA You
th
Weekly Wages on Entering Employment Low income threshold
Weekly low wage threshold
Change in Average Weekly Wages PY03-04
($200.00)($150.00)($100.00)($50.00)
$0.00
$50.00$100.00$150.00$200.00$250.00
JFES
TAA
Wagner-
Peyse
r
WIA Adu
lt
WIA D
isloca
ted
WIA You
th

2006 REPORT CARD FOR EMPLOYMENT AND TRAINING PROGRAMS
6
Chart 5: Adult Education Participants Weekly Wages at Placement
Chart 4: Adult Education Participants Employment and Retention
literacy and numeracy. Last year they served 32,000 adults and exited over 16,000. While the program addresses skills deficits with ESL, GED, and basic skills training, the program reports its results for those who come with employment as an explicit goal and for those who participate for other reasons (e.g., reading to children, personal development).
• While the employment
enhancement group is employed more than the education enhancement group, it is clear both groups can experience similar employment benefits from basic skill gains.
• Retention is around 80 percent
for both groups. Chart 4, below, further confirms the adult education yields similar benefits to all Adult Education participants regardless of their stated goals. There is only a slight difference in the average weekly wage after program completion.
• Wages are similar for the two groups.
• Although wages increased
substantially from pre to post program, they do not reach the low income threshold post-program.
Employment and 6 Month Retention
0.00%10.00%20.00%30.00%40.00%50.00%60.00%70.00%80.00%90.00%
PY01-02 PY02-03 PY03-04
Entered Employment: Employability Retention: EmployabilityEntered Employment: Skill Development Retention: Skill Development
Weekly Wage at Placement
$0.00
$100.00
$200.00
$300.00
$400.00
$500.00
PY01-02 PY02-03 PY03-04
Weekly Wages: Employability EnhancementWeekly Wages: Skill Enhancement
2006 REPORT CARD FOR EMPLOYMENT AND TRAINING PROGRAMS
7
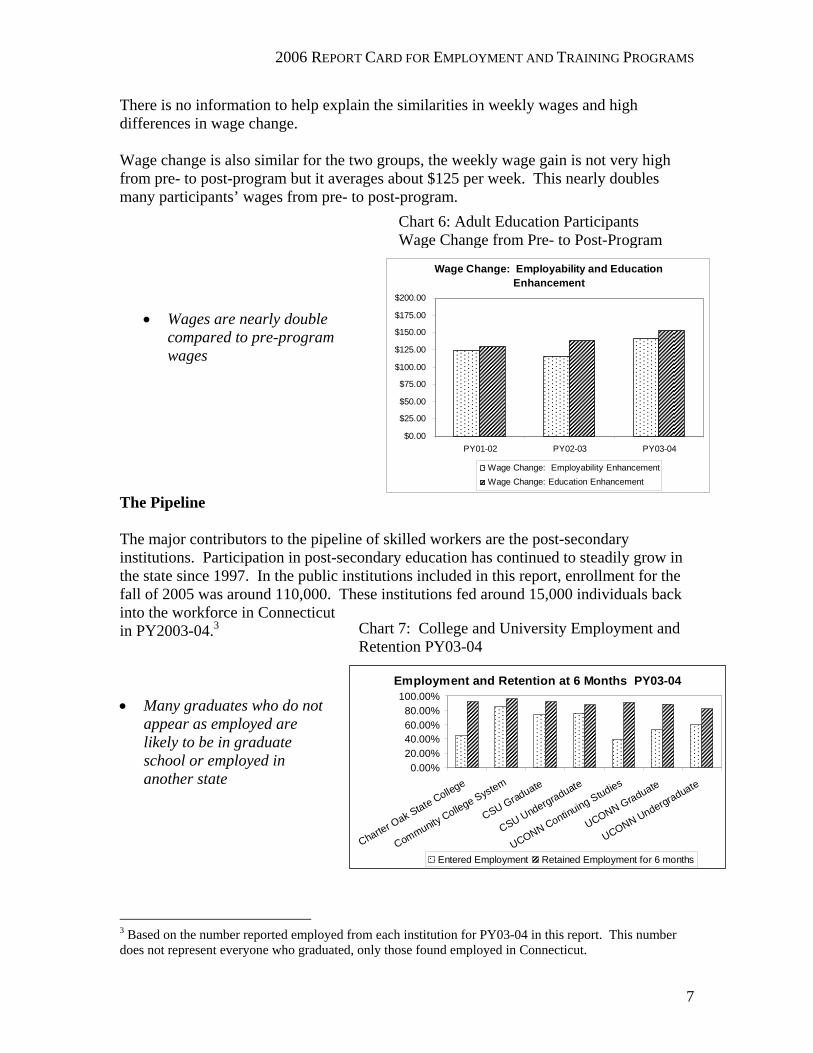
There is no information to help explain the similarities in weekly wages and high differences in wage change. Wage change is also similar for the two groups, the weekly wage gain is not very high from pre- to post-program but it averages about $125 per week. This nearly doubles many participants’ wages from pre- to post-program.
• Wages are nearly double compared to pre-program wages
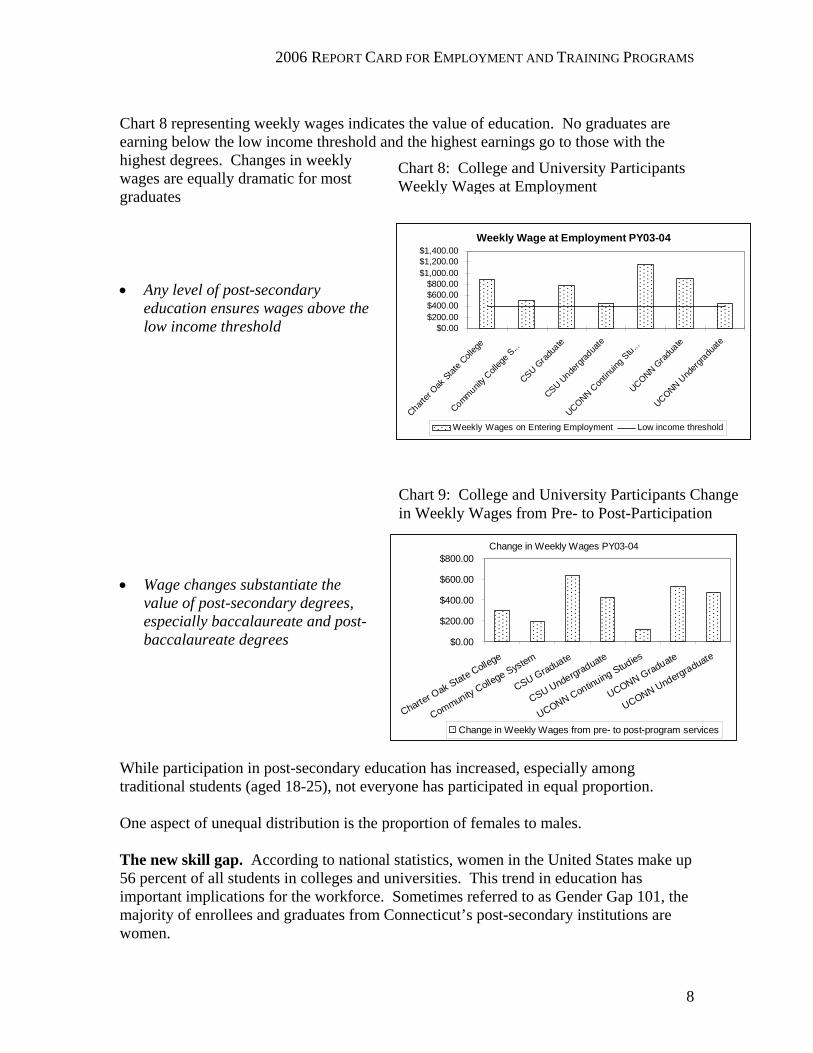
The Pipeline The major contributors to the pipeline of skilled workers are the post-secondary institutions. Participation in post-secondary education has continued to steadily grow in the state since 1997. In the public institutions included in this report, enrollment for the fall of 2005 was around 110,000. These institutions fed around 15,000 individuals back into the workforce in Connecticut in PY2003-04.3 • Many graduates who do not
appear as employed are likely to be in graduate school or employed in another state
3 Based on the number reported employed from each institution for PY03-04 in this report. This number does not represent everyone who graduated, only those found employed in Connecticut.
Wage Change: Employability and Education Enhancement
$0.00
$25.00
$50.00
$75.00
$100.00
$125.00
$150.00
$175.00
$200.00
PY01-02 PY02-03 PY03-04
Wage Change: Employability EnhancementWage Change: Education Enhancement
Chart 6: Adult Education Participants Wage Change from Pre- to Post-Program
Employment and Retention at 6 Months PY03-04
0.00%20.00%40.00%60.00%80.00%
100.00%
Charter Oak State College
Community College System
CSU Graduate
CSU Undergraduate
UCONN Continuing Studies
UCONN Graduate
UCONN Undergraduate
Entered Employment Retained Employment for 6 months
Chart 7: College and University Employment and Retention PY03-04
2006 REPORT CARD FOR EMPLOYMENT AND TRAINING PROGRAMS
8
Chart 8: College and University Participants Weekly Wages at Employment
Chart 8 representing weekly wages indicates the value of education. No graduates are earning below the low income threshold and the highest earnings go to those with the highest degrees. Changes in weekly wages are equally dramatic for most graduates • Any level of post-secondary
education ensures wages above the low income threshold
• Wage changes substantiate the
value of post-secondary degrees, especially baccalaureate and post-baccalaureate degrees
While participation in post-secondary education has increased, especially among traditional students (aged 18-25), not everyone has participated in equal proportion. One aspect of unequal distribution is the proportion of females to males. The new skill gap. According to national statistics, women in the United States make up 56 percent of all students in colleges and universities. This trend in education has important implications for the workforce. Sometimes referred to as Gender Gap 101, the majority of enrollees and graduates from Connecticut’s post-secondary institutions are women.
Weekly Wage at Employment PY03-04
$0.00$200.00$400.00$600.00$800.00
$1,000.00$1,200.00$1,400.00
Charter
Oak Stat
e Coll
ege
Community C
olleg
e S...
CSU Grad
uate
CSU Unde
rgrad
uate
UCONN Con
tinuin
g Stu...
UCONN Grad
uate
UCONN Und
ergradu
ate
Weekly Wages on Entering Employment Low income threshold
Change in Weekly Wages PY03-04
$0.00
$200.00
$400.00
$600.00
$800.00
Charter Oak State College
Community College System
CSU Graduate
CSU Undergraduate
UCONN Continuing Studies
UCONN Graduate
UCONN Undergraduate
Change in Weekly Wages from pre- to post-program services
Chart 9: College and University Participants Change in Weekly Wages from Pre- to Post-Participation
2006 REPORT CARD FOR EMPLOYMENT AND TRAINING PROGRAMS
9
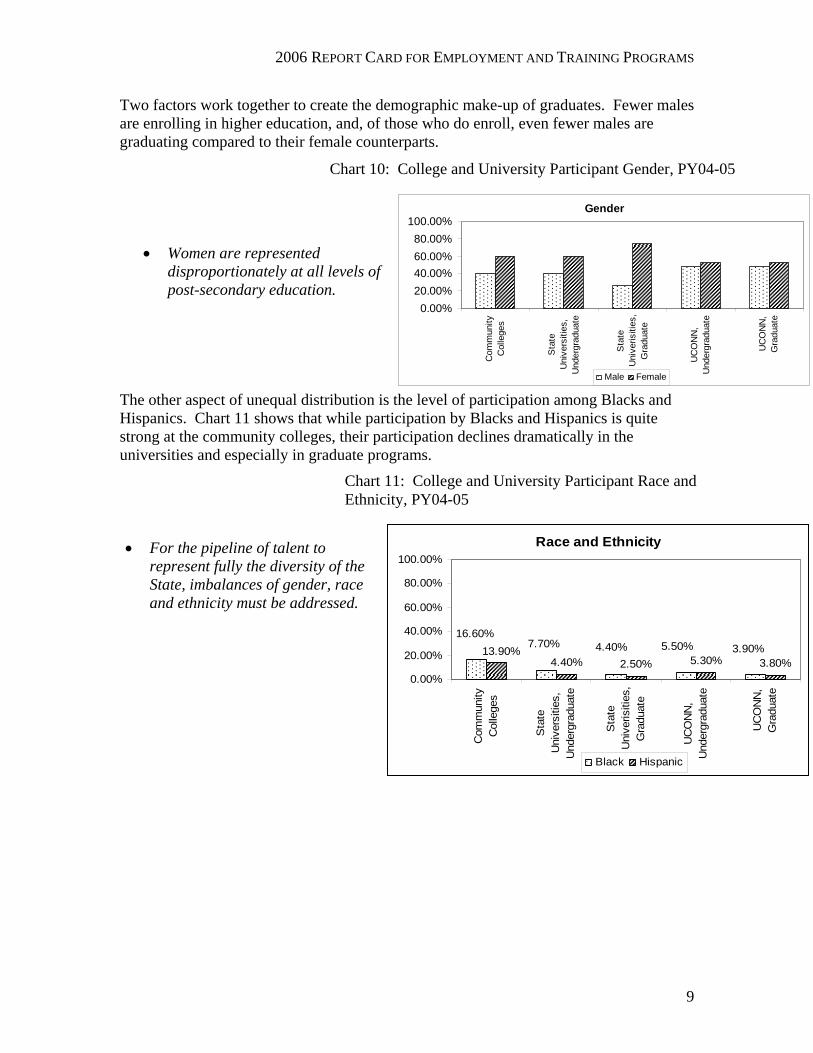
Two factors work together to create the demographic make-up of graduates. Fewer males are enrolling in higher education, and, of those who do enroll, even fewer males are graduating compared to their female counterparts.
• Women are represented disproportionately at all levels of post-secondary education.
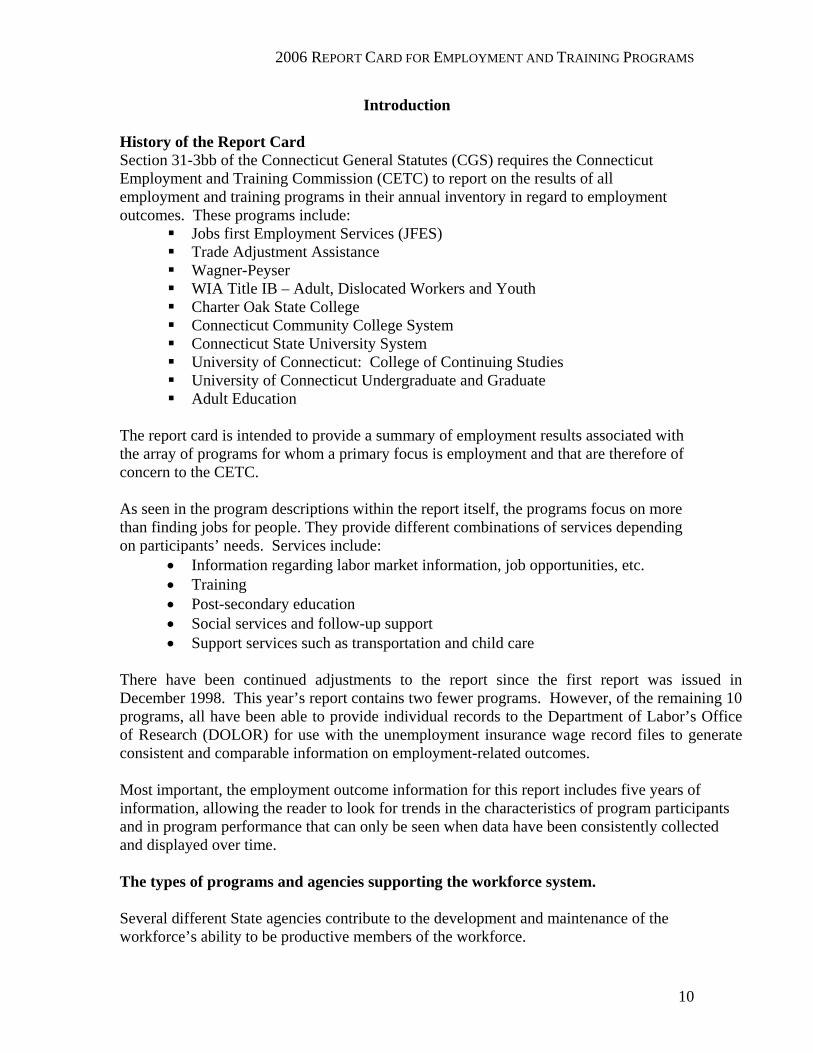
The other aspect of unequal distribution is the level of participation among Blacks and Hispanics. Chart 11 shows that while participation by Blacks and Hispanics is quite strong at the community colleges, their participation declines dramatically in the universities and especially in graduate programs. • For the pipeline of talent to
represent fully the diversity of the State, imbalances of gender, race and ethnicity must be addressed.
Race and Ethnicity
4.40% 2.50% 5.30% 3.80%3.90%5.50%4.40%7.70%
16.60%13.90%
0.00%
20.00%
40.00%
60.00%
80.00%
100.00%
Com
mun
ityC
olle
ges
Sta
teU
nive
rsiti
es,
Und
ergr
adua
te
Sta
teU
nive
risiti
es,
Gra
duat
e
UC
ON
N,
Und
ergr
adua
te
UC
ON
N,
Gra
duat
eBlack Hispanic
Gender
0.00%20.00%40.00%60.00%80.00%
100.00%
Com
mun
ityC
olle
ges
Sta
teU
nive
rsiti
es,
Und
ergr
adua
te
Sta
teU
nive
risiti
es,
Gra
duat
e
UC
ON
N,
Und
ergr
adua
te
UC
ON
N,
Gra
duat
e
Male Female
Chart 10: College and University Participant Gender, PY04-05
Chart 11: College and University Participant Race and Ethnicity, PY04-05
2006 REPORT CARD FOR EMPLOYMENT AND TRAINING PROGRAMS
10
Introduction History of the Report Card Section 31-3bb of the Connecticut General Statutes (CGS) requires the Connecticut Employment and Training Commission (CETC) to report on the results of all employment and training programs in their annual inventory in regard to employment outcomes. These programs include:
Jobs first Employment Services (JFES) Trade Adjustment Assistance Wagner-Peyser WIA Title IB – Adult, Dislocated Workers and Youth Charter Oak State College Connecticut Community College System Connecticut State University System University of Connecticut: College of Continuing Studies University of Connecticut Undergraduate and Graduate Adult Education
The report card is intended to provide a summary of employment results associated with the array of programs for whom a primary focus is employment and that are therefore of concern to the CETC. As seen in the program descriptions within the report itself, the programs focus on more than finding jobs for people. They provide different combinations of services depending on participants’ needs. Services include:
• Information regarding labor market information, job opportunities, etc. • Training • Post-secondary education • Social services and follow-up support • Support services such as transportation and child care
There have been continued adjustments to the report since the first report was issued in December 1998. This year’s report contains two fewer programs. However, of the remaining 10 programs, all have been able to provide individual records to the Department of Labor’s Office of Research (DOLOR) for use with the unemployment insurance wage record files to generate consistent and comparable information on employment-related outcomes. Most important, the employment outcome information for this report includes five years of information, allowing the reader to look for trends in the characteristics of program participants and in program performance that can only be seen when data have been consistently collected and displayed over time. The types of programs and agencies supporting the workforce system. Several different State agencies contribute to the development and maintenance of the workforce’s ability to be productive members of the workforce.
2006 REPORT CARD FOR EMPLOYMENT AND TRAINING PROGRAMS
11
• The Connecticut Department of Labor (CTDOL) provides direct services, administers, and contracts for services in regard to different employment focused programs (JFES, TAA, Wagner-Peyser, WIA Title IB)
• The public post-secondary schools provide training and education programs that provide the skills and knowledge to increase the employability of those first entering, re-entering, and returning to the workforce. The state-funded post-secondary providers included are: o Charter Oak State College, a virtual college giving credit for prior learning
and new knowledge toward the acquisition of an undergraduate degree o The Community Colleges through its system of 12 schools o The State University system with its 4 campuses o The University of Connecticut through its main campus at Storrs and
branches in Avery Point, Stamford, Torrington, Waterbury, and West Hartford
• The State Department of Education through its adult education programs delivered in towns and cities throughout the state
The report for each program or institution presents information on budget and services (wherever available), the demographics of the people served, and the results for five outcomes:
• Entered employment • Retention of employment for 6 months • Weekly wage at placement • Change in weekly wage from pre- to post-program participation
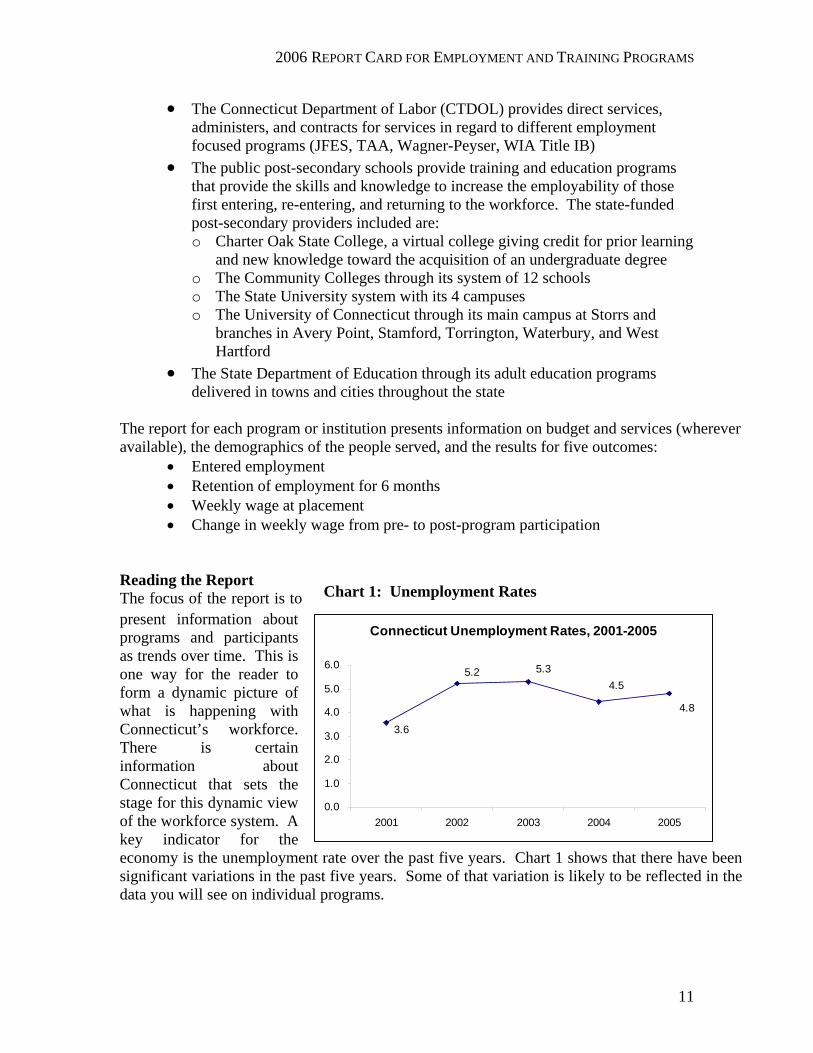
Reading the Report The focus of the report is to present information about programs and participants as trends over time. This is one way for the reader to form a dynamic picture of what is happening with Connecticut’s workforce. There is certain information about Connecticut that sets the stage for this dynamic view of the workforce system. A key indicator for the economy is the unemployment rate over the past five years. Chart 1 shows that there have been significant variations in the past five years. Some of that variation is likely to be reflected in the data you will see on individual programs.
Connecticut Unemployment Rates, 2001-2005
3.6
4.8
4.55.35.2
0.0
1.0
2.0
3.0
4.0
5.0
6.0
2001 2002 2003 2004 2005
Chart 1: Unemployment Rates
2006 REPORT CARD FOR EMPLOYMENT AND TRAINING PROGRAMS
12
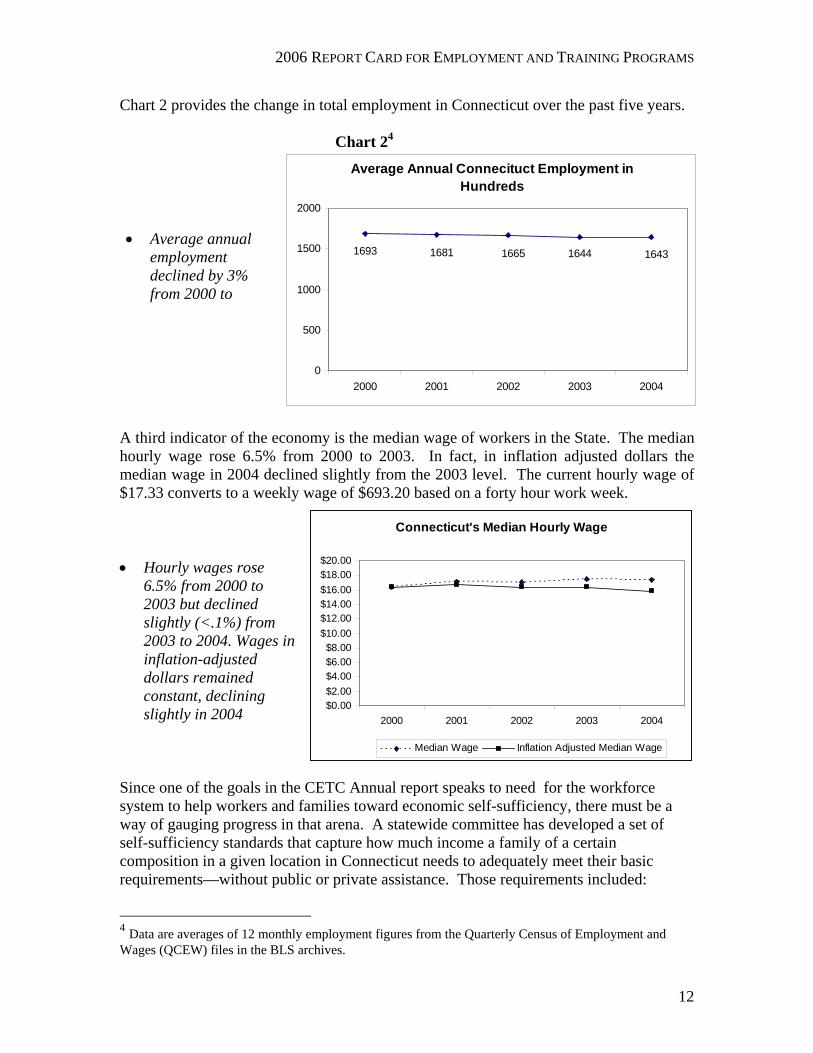
Chart 2 provides the change in total employment in Connecticut over the past five years.
Chart 24 Average Annual Connecituct Employment in
Hundreds
16431644166516811693
0
500
1000
1500
2000
2000 2001 2002 2003 2004
A third indicator of the economy is the median wage of workers in the State. The median hourly wage rose 6.5% from 2000 to 2003. In fact, in inflation adjusted dollars the median wage in 2004 declined slightly from the 2003 level. The current hourly wage of $17.33 converts to a weekly wage of $693.20 based on a forty hour work week. • Hourly wages rose
6.5% from 2000 to 2003 but declined slightly (<.1%) from 2003 to 2004. Wages in inflation-adjusted dollars remained constant, declining slightly in 2004
Since one of the goals in the CETC Annual report speaks to need for the workforce system to help workers and families toward economic self-sufficiency, there must be a way of gauging progress in that arena. A statewide committee has developed a set of self-sufficiency standards that capture how much income a family of a certain composition in a given location in Connecticut needs to adequately meet their basic requirements—without public or private assistance. Those requirements included:
4 Data are averages of 12 monthly employment figures from the Quarterly Census of Employment and Wages (QCEW) files in the BLS archives.
• Average annual employment declined by 3% from 2000 to
Connecticut's Median Hourly Wage
$0.00$2.00$4.00$6.00$8.00
$10.00$12.00$14.00$16.00$18.00$20.00
2000 2001 2002 2003 2004
Median Wage Inflation Adjusted Median Wage
2006 REPORT CARD FOR EMPLOYMENT AND TRAINING PROGRAMS
13
housing, food, healthcare, miscellaneous (e.g., clothes), transportation, and related taxes. The committee created a baseline standard for a family of three (one adult, one pre-school child and one school-age child) for five different workforce areas and nine cities. For a relevant standard for this report, we cut in half the statewide standard for a family of three to create a self-sufficiency or low income threshold for a single person. This low income threshold is $390 a week or approximately $20,000 per year. Throughout the report, the starting wage for program exiters is presented in the context of this low income threshold.
The Report Organization The report is organized into several parts.
1. After the table of contents and executive summary, there is an introductory section.
2. The information for each program begins with a summary sheet that provides wherever available budget information for the most current full year and the number of individuals served. This allows the reader to see the scope of each program. The summary sheet also presents key demographic information about participants as well as key outcomes.
3. Each summary sheet is followed by detailed information in tables and narrative for each program.
4. Appendices contain details of the definitions of the measures and additional details on some of the programs.
The report is organized into three program categories. • Connecticut Department of Labor’s employment and training programs • Post-secondary education programs • Adult Education programs
The four programs in first category are administered or provided by the Connecticut Department of Labor (CTDOL). The CTDOL programs focus on short-term training and job search services that lead directly toward placement into the workforce. Programs in the second category are post-secondary educational programs associated with five different state institutions: Charter Oak State College, the Community College System, the State University System, and two different parts of the University of Connecticut: The School of Continuing Education and the Undergraduate and Graduate Schools. While they all have placement in the workforce as one outcome, the first focus is on the education and training of individuals. While most are preparing for the workforce, some participate in post-secondary education for personal enrichment or other reasons unrelated to the world of work. The third category involves a single program, Adult Education (AE), delivered throughout the state through the local boards of education. The local adult education programs provide basic skills training for those with deficiencies in math, reading, and writing, as well as GED preparation, and for those where English is a second language and who need to gain better proficiency in English. The focus of their services is determined by the participant. Some of those utilizing AE services do so for personal

2006 REPORT CARD FOR EMPLOYMENT AND TRAINING PROGRAMS
14
reasons, the enhancing of their basic skills, and some for improving their opportunities in the workforce, the enhancement of employability skills.
2006 REPORT CARD FOR EMPLOYMENT AND TRAINING PROGRAMS
15
Jobs First Employment Services (JFES): Jobs First
SUMMARY
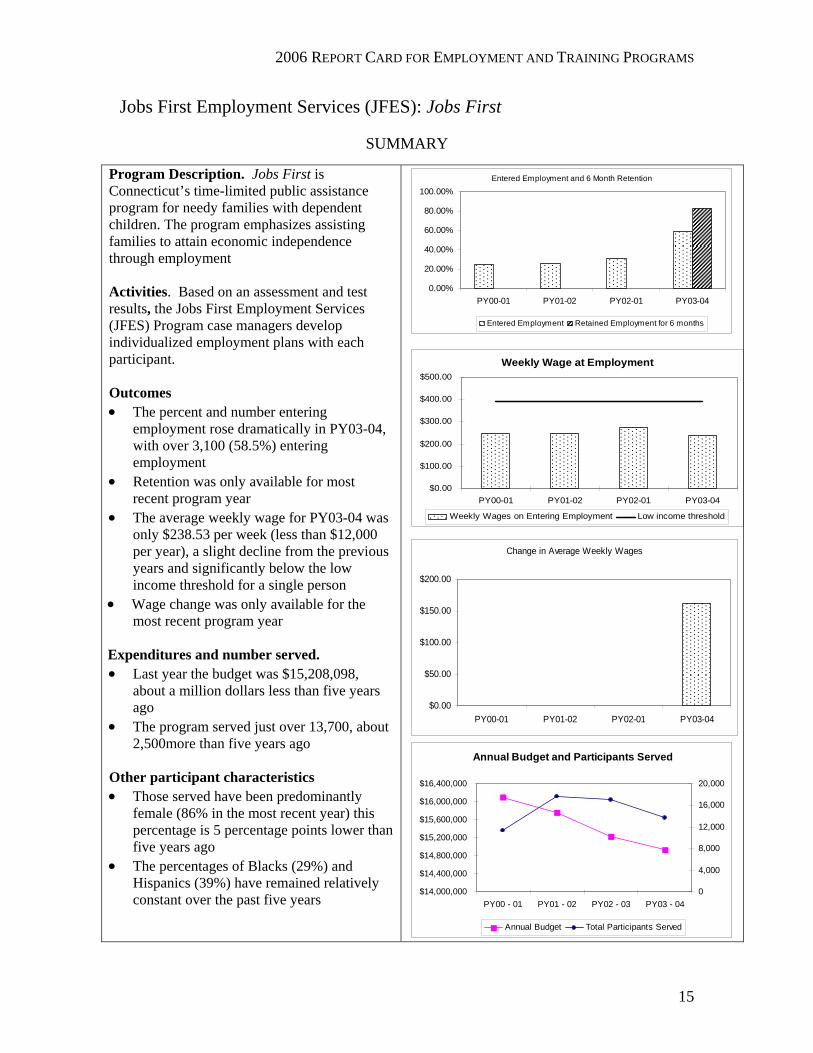
Program Description. Jobs First is Connecticut’s time-limited public assistance program for needy families with dependent children. The program emphasizes assisting families to attain economic independence through employment Activities. Based on an assessment and test results, the Jobs First Employment Services (JFES) Program case managers develop individualized employment plans with each participant. Outcomes • The percent and number entering
employment rose dramatically in PY03-04, with over 3,100 (58.5%) entering employment
• Retention was only available for most recent program year
• The average weekly wage for PY03-04 was only $238.53 per week (less than $12,000 per year), a slight decline from the previous years and significantly below the low income threshold for a single person
• Wage change was only available for the most recent program year
Expenditures and number served. • Last year the budget was $15,208,098,
about a million dollars less than five years ago
• The program served just over 13,700, about 2,500more than five years ago
Other participant characteristics • Those served have been predominantly
female (86% in the most recent year) this percentage is 5 percentage points lower than five years ago
• The percentages of Blacks (29%) and Hispanics (39%) have remained relatively constant over the past five years
Entered Employment and 6 Month Retention
0.00%
20.00%
40.00%
60.00%
80.00%
100.00%
PY00-01 PY01-02 PY02-01 PY03-04
Entered Employment Retained Employment for 6 months
Weekly Wage at Employment
$0.00
$100.00
$200.00
$300.00
$400.00
$500.00
PY00-01 PY01-02 PY02-01 PY03-04
Weekly Wages on Entering Employment Low income threshold
Change in Average Weekly Wages
$0.00
$50.00
$100.00
$150.00
$200.00
PY00-01 PY01-02 PY02-01 PY03-04
Annual Budget and Participants Served
$14,000,000
$14,400,000
$14,800,000
$15,200,000
$15,600,000
$16,000,000
$16,400,000
PY00 - 01 PY01 - 02 PY02 - 03 PY03 - 040
4,000
8,000
12,000
16,000
20,000
Annual Budget Total Participants Served
2006 REPORT CARD FOR EMPLOYMENT AND TRAINING PROGRAMS
16
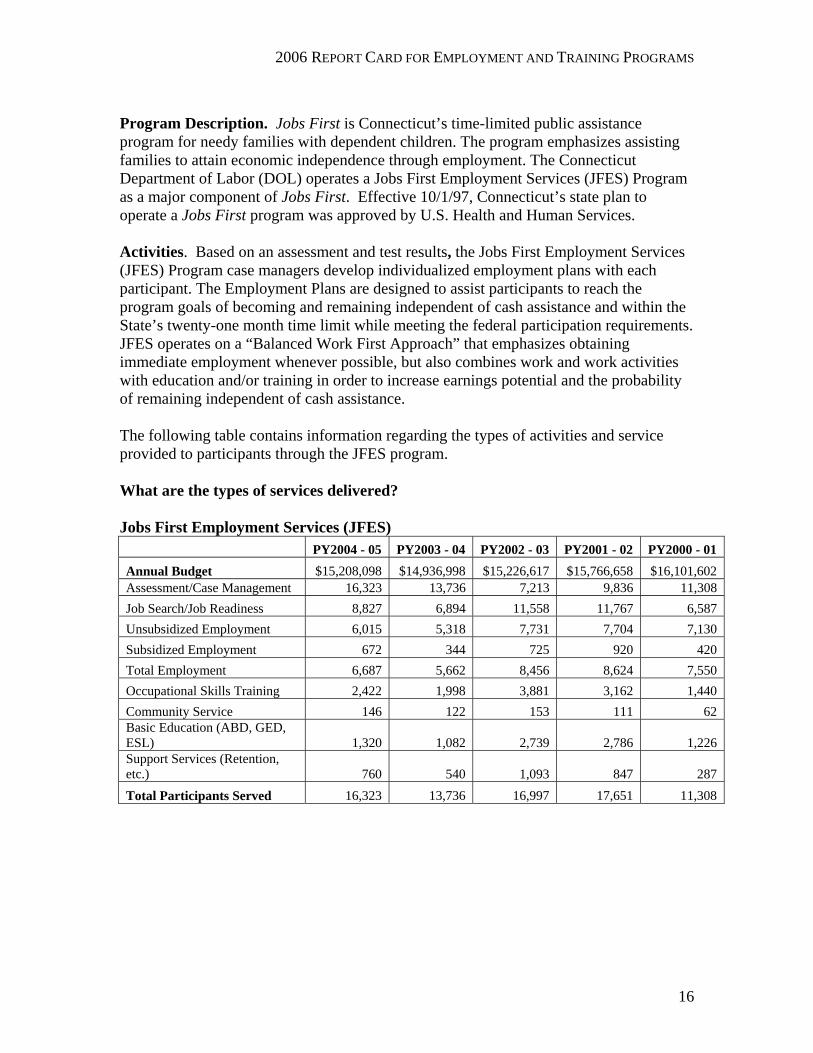
Program Description. Jobs First is Connecticut’s time-limited public assistance program for needy families with dependent children. The program emphasizes assisting families to attain economic independence through employment. The Connecticut Department of Labor (DOL) operates a Jobs First Employment Services (JFES) Program as a major component of Jobs First. Effective 10/1/97, Connecticut’s state plan to operate a Jobs First program was approved by U.S. Health and Human Services. Activities. Based on an assessment and test results, the Jobs First Employment Services (JFES) Program case managers develop individualized employment plans with each participant. The Employment Plans are designed to assist participants to reach the program goals of becoming and remaining independent of cash assistance and within the State’s twenty-one month time limit while meeting the federal participation requirements. JFES operates on a “Balanced Work First Approach” that emphasizes obtaining immediate employment whenever possible, but also combines work and work activities with education and/or training in order to increase earnings potential and the probability of remaining independent of cash assistance. The following table contains information regarding the types of activities and service provided to participants through the JFES program.
What are the types of services delivered? Jobs First Employment Services (JFES) PY2004 - 05 PY2003 - 04 PY2002 - 03 PY2001 - 02 PY2000 - 01 Annual Budget $15,208,098 $14,936,998 $15,226,617 $15,766,658 $16,101,602 Assessment/Case Management 16,323 13,736 7,213 9,836 11,308 Job Search/Job Readiness 8,827 6,894 11,558 11,767 6,587 Unsubsidized Employment 6,015 5,318 7,731 7,704 7,130 Subsidized Employment 672 344 725 920 420 Total Employment 6,687 5,662 8,456 8,624 7,550 Occupational Skills Training 2,422 1,998 3,881 3,162 1,440 Community Service 146 122 153 111 62 Basic Education (ABD, GED, ESL) 1,320 1,082 2,739 2,786 1,226 Support Services (Retention, etc.) 760 540 1,093 847 287 Total Participants Served 16,323 13,736 16,997 17,651 11,308
2006 REPORT CARD FOR EMPLOYMENT AND TRAINING PROGRAMS
17
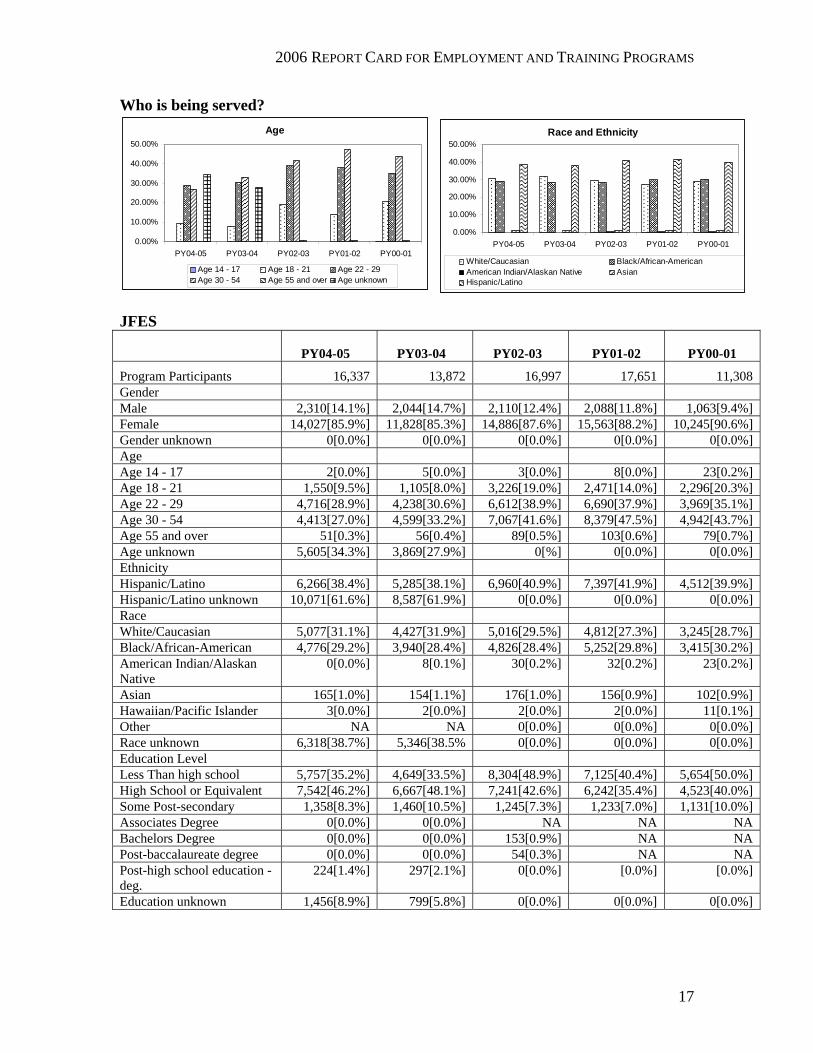
Who is being served?
JFES
PY04-05 PY03-04 PY02-03 PY01-02 PY00-01
Program Participants 16,337 13,872 16,997 17,651 11,308 Gender Male 2,310[14.1%] 2,044[14.7%] 2,110[12.4%] 2,088[11.8%] 1,063[9.4%] Female 14,027[85.9%] 11,828[85.3%] 14,886[87.6%] 15,563[88.2%] 10,245[90.6%] Gender unknown 0[0.0%] 0[0.0%] 0[0.0%] 0[0.0%] 0[0.0%] Age Age 14 - 17 2[0.0%] 5[0.0%] 3[0.0%] 8[0.0%] 23[0.2%] Age 18 - 21 1,550[9.5%] 1,105[8.0%] 3,226[19.0%] 2,471[14.0%] 2,296[20.3%] Age 22 - 29 4,716[28.9%] 4,238[30.6%] 6,612[38.9%] 6,690[37.9%] 3,969[35.1%] Age 30 - 54 4,413[27.0%] 4,599[33.2%] 7,067[41.6%] 8,379[47.5%] 4,942[43.7%] Age 55 and over 51[0.3%] 56[0.4%] 89[0.5%] 103[0.6%] 79[0.7%] Age unknown 5,605[34.3%] 3,869[27.9%] 0[%] 0[0.0%] 0[0.0%] Ethnicity Hispanic/Latino 6,266[38.4%] 5,285[38.1%] 6,960[40.9%] 7,397[41.9%] 4,512[39.9%] Hispanic/Latino unknown 10,071[61.6%] 8,587[61.9%] 0[0.0%] 0[0.0%] 0[0.0%] Race White/Caucasian 5,077[31.1%] 4,427[31.9%] 5,016[29.5%] 4,812[27.3%] 3,245[28.7%] Black/African-American 4,776[29.2%] 3,940[28.4%] 4,826[28.4%] 5,252[29.8%] 3,415[30.2%] American Indian/Alaskan Native
0[0.0%] 8[0.1%] 30[0.2%] 32[0.2%] 23[0.2%]
Asian 165[1.0%] 154[1.1%] 176[1.0%] 156[0.9%] 102[0.9%] Hawaiian/Pacific Islander 3[0.0%] 2[0.0%] 2[0.0%] 2[0.0%] 11[0.1%] Other NA NA 0[0.0%] 0[0.0%] 0[0.0%] Race unknown 6,318[38.7%] 5,346[38.5% 0[0.0%] 0[0.0%] 0[0.0%] Education Level Less Than high school 5,757[35.2%] 4,649[33.5%] 8,304[48.9%] 7,125[40.4%] 5,654[50.0%] High School or Equivalent 7,542[46.2%] 6,667[48.1%] 7,241[42.6%] 6,242[35.4%] 4,523[40.0%] Some Post-secondary 1,358[8.3%] 1,460[10.5%] 1,245[7.3%] 1,233[7.0%] 1,131[10.0%] Associates Degree 0[0.0%] 0[0.0%] NA NA NA Bachelors Degree 0[0.0%] 0[0.0%] 153[0.9%] NA NA Post-baccalaureate degree 0[0.0%] 0[0.0%] 54[0.3%] NA NA Post-high school education - deg.
224[1.4%] 297[2.1%] 0[0.0%] [0.0%] [0.0%]
Education unknown 1,456[8.9%] 799[5.8%] 0[0.0%] 0[0.0%] 0[0.0%]
Age
0.00%
10.00%
20.00%
30.00%
40.00%
50.00%
PY04-05 PY03-04 PY02-03 PY01-02 PY00-01
Age 14 - 17 Age 18 - 21 Age 22 - 29Age 30 - 54 Age 55 and over Age unknown
Race and Ethnicity
0.00%
10.00%
20.00%
30.00%
40.00%
50.00%
PY04-05 PY03-04 PY02-03 PY01-02 PY00-01
White/Caucasian Black/African-AmericanAmerican Indian/Alaskan Native AsianHispanic/Latino

2006 REPORT CARD FOR EMPLOYMENT AND TRAINING PROGRAMS
18
What are the results? The following table contains information on the results of the JFES program. These terms are used to describe results across programs. The first item on the list “Total Completers/Exits” does not apply to the JFES program since participants leave JFES for a number of reasons unrelated to the efforts of the JFES program. JFES participants more often exit the JFES program due to ineligibility for Temporary Family Assistance (TFA) regardless of their participation in the JFES program. Another reason for many participants to exit the JFES program is that they become exempt from participation due to illness, incapacity, family problems, drug or alcohol problems and domestic violence. Additionally, JFES participants may repeatedly exit and return to the JFES program during the same fiscal year. Therefore reporting the numbers of exits of the JFES program during the program year would not be indicative of the results of the program. With the implementation of the new CTWorks Business System (CTWBS) in 2003, JFES will gain the capability of reporting on data on two of the following items: “Retained Employment for 6 months” and Changes in Weekly Wages from Pre-to Post Program.” It is now possible by cross matching the data in CTWBS with the DOL wage records. DOL has identified the criteria and specification necessary to develop an automated report of this data. This information is presented for the most recent year available (PY03-04). What are the results? JFES
Results PY04-05 PY03-04 PY02-01 PY01-02 PY00-01 Total Program Exiters 10,034 5,427 NA NA NACompleted JFES Services/Activities
10,034[100.0%] 5,427[100.0%] 8,363[49.2%] 8,804[49.9%] 8,481[48.0%]
Entered Employment * 3,176[58.5%] 5,225[30.7%] 4,516[25.6%] 4,435[25.1%]Retained Employment for 6 months
* 2,640[83.1%] NA NA NA
Weekly Wages on Entering Employment
* $238.53 $274.00 $249.00 $245.00
Change in Average Weekly Wages
* $161.94 NA NA NA
Note: Many JFES participants combine work and work related activity. Their average starting hourly wage is well over $8.50.

2006 REPORT CARD FOR EMPLOYMENT AND TRAINING PROGRAMS
19
Trade Adjustment Assistance (TAA) / North American Free Trade Agreement - Transitional Adjustment Assistance (NAFTA-TAA)
SUMMARY
Program Description: The Trade Act of 1974 provides assistance to workers whose employment is adversely affected by increased imports or shifts of production to foreign countries. Services: TAA/NAFTA includes a variety of benefits and reemployment services to help unemployed workers prepare for and obtain suitable employment. Workers may be eligible for training, a relocation allowance, and other reemployment services. For other services see the detailed explanation in the report. Outcomes • Entered employment averaged about 50%,
relatively low compared to other programs; it improved to 72% in PY03-04
• Retention has remained consistently high in the past four years
• Weekly wages only exceeded the $390 self-sufficiency threshold in two of the past four years.
• Wages post-program were significantly lower than those earned pre-program
Expenditures and number served • Expenditures have increased except for
PY003-04 with PY2005 expenditures at just under $3,000,000
• The program served 443 workers last year, an increase of 93 over PY02-03
Other participant characteristics • 57% (253) women and 43% (190) men • Most participants are between 22 and 54;
23.5% are 55 and over • The percentage of Hispanic/Latino
(participants was 17 percentage points higher than in the past program year
Employment and 6 Month Retention
56.7%46.8%
55.2%
71.1%
95.90% 95.40% 93.00% 93.50%
0%
20%
40%
60%
80%
100%
PY00-01 PY01-02 PY02-03 PY03-04
Entered Employment Retained Employment for 6 months
Weekly Wage at Employment
$0.00
$100.00
$200.00
$300.00
$400.00
$500.00
PY00-01 PY01-02 PY02-03 PY03-04
Weekly Wages on Entering Employment Low income threshold
Change in Weekly Wages from Pre- to Post-program Services
($250.00)
($200.00)
($150.00)
($100.00)
($50.00)
$0.00PY00-01 PY01-02 PY02-03 PY03-04
Expenditures and Number Served
443
349
442
278342
$0$500,000
$1,000,000$1,500,000$2,000,000$2,500,000$3,000,000$3,500,000
PY04-05PY03-04PY02-03PY01-02PY00-010
150
300
450
600
Annual Expenditures Total Participants
2006 REPORT CARD FOR EMPLOYMENT AND TRAINING PROGRAMS
20
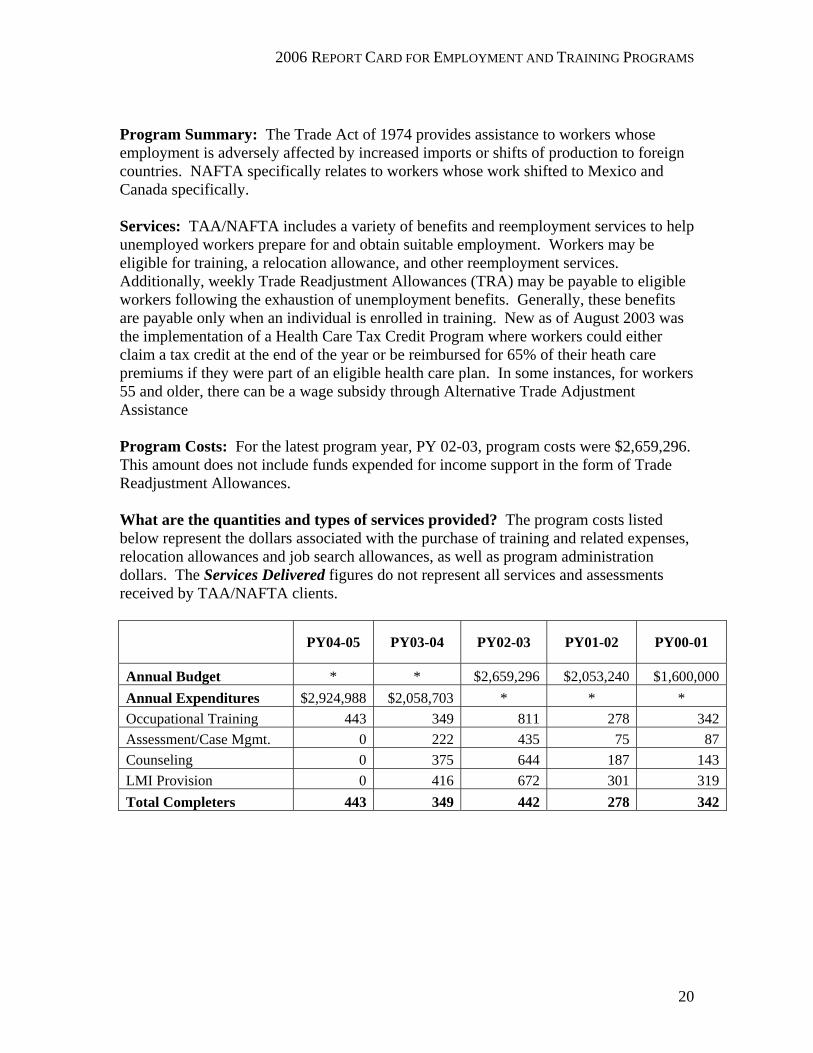
Program Summary: The Trade Act of 1974 provides assistance to workers whose employment is adversely affected by increased imports or shifts of production to foreign countries. NAFTA specifically relates to workers whose work shifted to Mexico and Canada specifically. Services: TAA/NAFTA includes a variety of benefits and reemployment services to help unemployed workers prepare for and obtain suitable employment. Workers may be eligible for training, a relocation allowance, and other reemployment services. Additionally, weekly Trade Readjustment Allowances (TRA) may be payable to eligible workers following the exhaustion of unemployment benefits. Generally, these benefits are payable only when an individual is enrolled in training. New as of August 2003 was the implementation of a Health Care Tax Credit Program where workers could either claim a tax credit at the end of the year or be reimbursed for 65% of their heath care premiums if they were part of an eligible health care plan. In some instances, for workers 55 and older, there can be a wage subsidy through Alternative Trade Adjustment Assistance Program Costs: For the latest program year, PY 02-03, program costs were $2,659,296. This amount does not include funds expended for income support in the form of Trade Readjustment Allowances. What are the quantities and types of services provided? The program costs listed below represent the dollars associated with the purchase of training and related expenses, relocation allowances and job search allowances, as well as program administration dollars. The Services Delivered figures do not represent all services and assessments received by TAA/NAFTA clients.
PY04-05 PY03-04 PY02-03 PY01-02 PY00-01
Annual Budget * * $2,659,296 $2,053,240 $1,600,000Annual Expenditures $2,924,988 $2,058,703 * * * Occupational Training 443 349 811 278 342Assessment/Case Mgmt. 0 222 435 75 87Counseling 0 375 644 187 143LMI Provision 0 416 672 301 319Total Completers 443 349 442 278 342
2006 REPORT CARD FOR EMPLOYMENT AND TRAINING PROGRAMS
21
Who is being served?
TAA/NAFTA
PY04-05 PY03-04 PY02-03 PY01-02 PY00-01
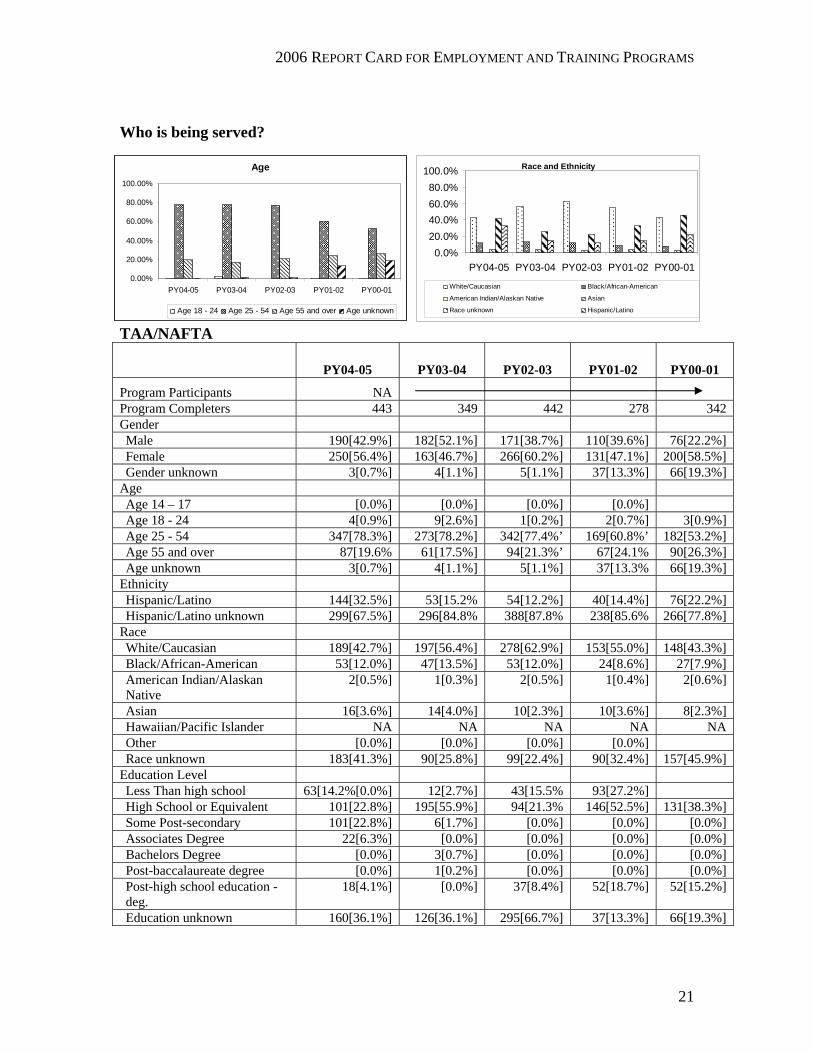
Program Participants NA Program Completers 443 349 442 278 342 Gender Male 190[42.9%] 182[52.1%] 171[38.7%] 110[39.6%] 76[22.2%] Female 250[56.4%] 163[46.7%] 266[60.2%] 131[47.1%] 200[58.5%] Gender unknown 3[0.7%] 4[1.1%] 5[1.1%] 37[13.3%] 66[19.3%]
Age Age 14 – 17 [0.0%] [0.0%] [0.0%] [0.0%] Age 18 - 24 4[0.9%] 9[2.6%] 1[0.2%] 2[0.7%] 3[0.9%] Age 25 - 54 347[78.3%] 273[78.2%] 342[77.4%’ 169[60.8%’ 182[53.2%] Age 55 and over 87[19.6% 61[17.5%] 94[21.3%’ 67[24.1% 90[26.3%] Age unknown 3[0.7%] 4[1.1%] 5[1.1%] 37[13.3% 66[19.3%]
Ethnicity Hispanic/Latino 144[32.5%] 53[15.2% 54[12.2%] 40[14.4%] 76[22.2%] Hispanic/Latino unknown 299[67.5%] 296[84.8% 388[87.8% 238[85.6% 266[77.8%]
Race White/Caucasian 189[42.7%] 197[56.4%] 278[62.9%] 153[55.0%] 148[43.3%] Black/African-American 53[12.0%] 47[13.5%] 53[12.0%] 24[8.6%] 27[7.9%] American Indian/Alaskan Native
2[0.5%] 1[0.3%] 2[0.5%] 1[0.4%] 2[0.6%]
Asian 16[3.6%] 14[4.0%] 10[2.3%] 10[3.6%] 8[2.3%] Hawaiian/Pacific Islander NA NA NA NA NA Other [0.0%] [0.0%] [0.0%] [0.0%] Race unknown 183[41.3%] 90[25.8%] 99[22.4%] 90[32.4%] 157[45.9%]
Education Level Less Than high school 63[14.2%[0.0%] 12[2.7%] 43[15.5% 93[27.2%] High School or Equivalent 101[22.8%] 195[55.9%] 94[21.3% 146[52.5%] 131[38.3%] Some Post-secondary 101[22.8%] 6[1.7%] [0.0%] [0.0%] [0.0%] Associates Degree 22[6.3%] [0.0%] [0.0%] [0.0%] [0.0%] Bachelors Degree [0.0%] 3[0.7%] [0.0%] [0.0%] [0.0%] Post-baccalaureate degree [0.0%] 1[0.2%] [0.0%] [0.0%] [0.0%] Post-high school education - deg.
18[4.1%] [0.0%] 37[8.4%] 52[18.7%] 52[15.2%]
Education unknown 160[36.1%] 126[36.1%] 295[66.7%] 37[13.3%] 66[19.3%]
Race and Ethnicity
0.0%20.0%40.0%60.0%80.0%
100.0%
PY04-05 PY03-04 PY02-03 PY01-02 PY00-01
White/Caucasian Black/African-American
American Indian/Alaskan Native Asian
Race unknown Hispanic/Latino
Age
0.00%
20.00%
40.00%
60.00%
80.00%
100.00%
PY04-05 PY03-04 PY02-03 PY01-02 PY00-01
Age 18 - 24 Age 25 - 54 Age 55 and over Age unknown
2006 REPORT CARD FOR EMPLOYMENT AND TRAINING PROGRAMS
22
What are the results?
TAA/NAFTA
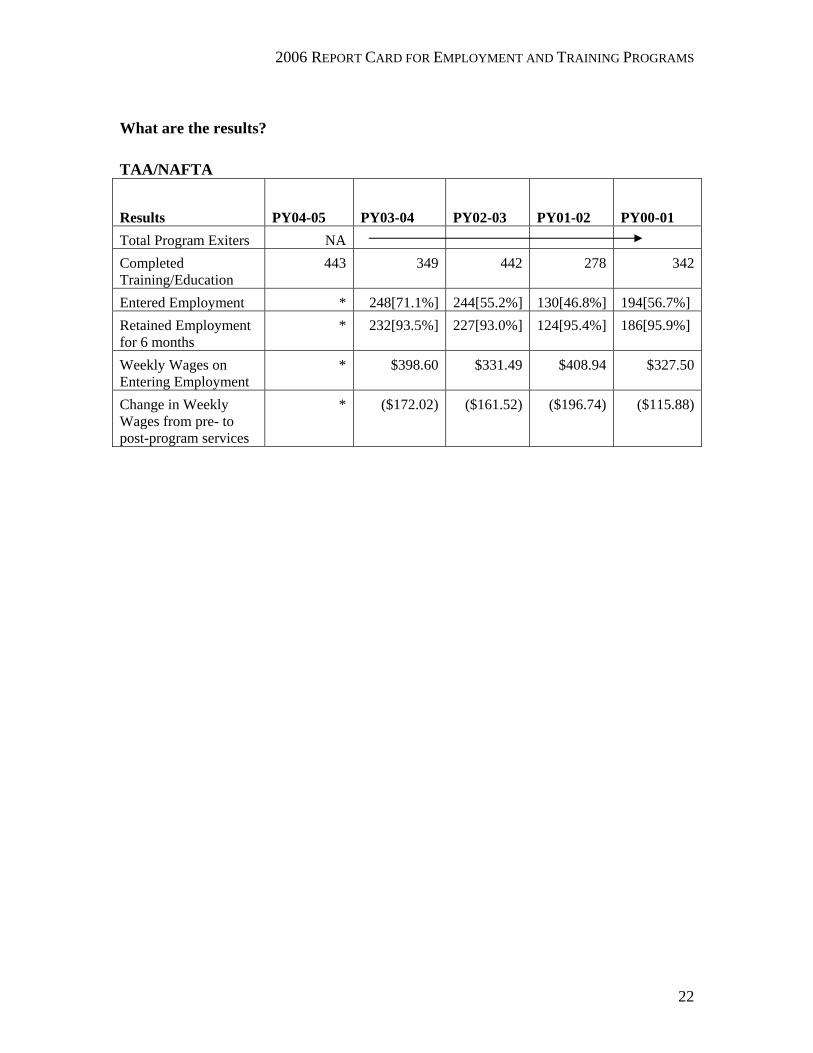
Results PY04-05 PY03-04 PY02-03 PY01-02 PY00-01 Total Program Exiters NA Completed Training/Education
443 349 442 278 342
Entered Employment * 248[71.1%] 244[55.2%] 130[46.8%] 194[56.7%] Retained Employment for 6 months
* 232[93.5%] 227[93.0%] 124[95.4%] 186[95.9%]
Weekly Wages on Entering Employment
* $398.60 $331.49 $408.94 $327.50
Change in Weekly Wages from pre- to post-program services
* ($172.02) ($161.52) ($196.74) ($115.88)
2006 REPORT CARD FOR EMPLOYMENT AND TRAINING PROGRAMS
23
Wagner-Peyser
SUMMARY
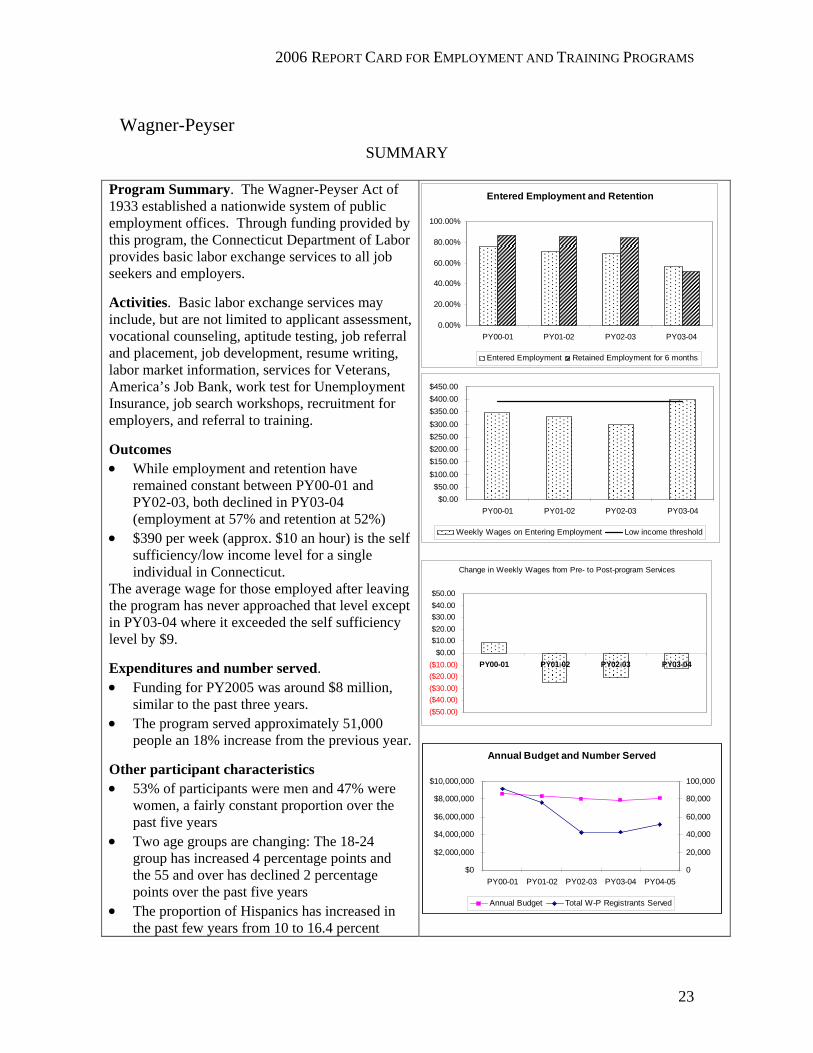
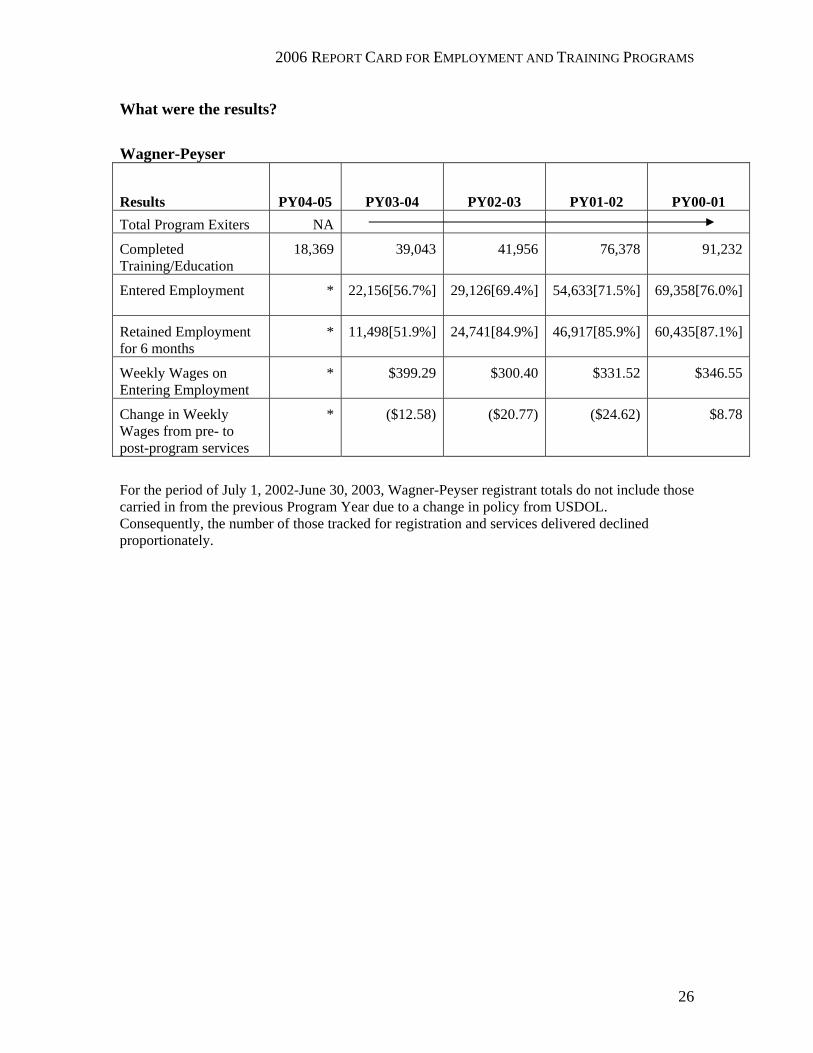
Program Summary. The Wagner-Peyser Act of 1933 established a nationwide system of public employment offices. Through funding provided by this program, the Connecticut Department of Labor provides basic labor exchange services to all job seekers and employers. Activities. Basic labor exchange services may include, but are not limited to applicant assessment, vocational counseling, aptitude testing, job referral and placement, job development, resume writing, labor market information, services for Veterans, America’s Job Bank, work test for Unemployment Insurance, job search workshops, recruitment for employers, and referral to training. Outcomes • While employment and retention have
remained constant between PY00-01 and PY02-03, both declined in PY03-04 (employment at 57% and retention at 52%)
• $390 per week (approx. $10 an hour) is the self sufficiency/low income level for a single individual in Connecticut.
The average wage for those employed after leaving the program has never approached that level except in PY03-04 where it exceeded the self sufficiency level by $9. Expenditures and number served. • Funding for PY2005 was around $8 million,
similar to the past three years. • The program served approximately 51,000
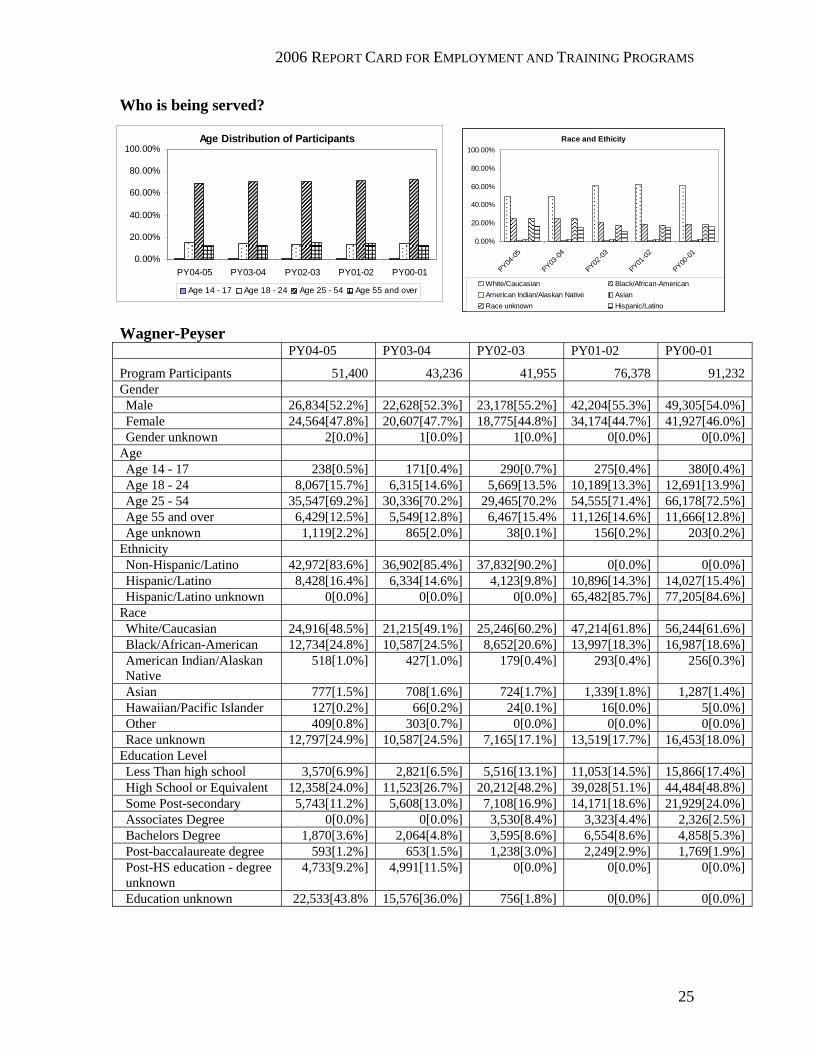
people an 18% increase from the previous year. Other participant characteristics • 53% of participants were men and 47% were
women, a fairly constant proportion over the past five years
• Two age groups are changing: The 18-24 group has increased 4 percentage points and the 55 and over has declined 2 percentage points over the past five years
• The proportion of Hispanics has increased in the past few years from 10 to 16.4 percent
Entered Employment and Retention
0.00%
20.00%
40.00%
60.00%
80.00%
100.00%
PY00-01 PY01-02 PY02-03 PY03-04
Entered Employment Retained Employment for 6 months
$0.00$50.00
$100.00$150.00$200.00$250.00$300.00$350.00$400.00$450.00
PY00-01 PY01-02 PY02-03 PY03-04
Weekly Wages on Entering Employment Low income threshold
Change in Weekly Wages from Pre- to Post-program Services
($50.00)($40.00)($30.00)($20.00)($10.00)
$0.00$10.00$20.00$30.00$40.00$50.00
PY00-01 PY01-02 PY02-03 PY03-04
Annual Budget and Number Served
$0
$2,000,000
$4,000,000
$6,000,000
$8,000,000
$10,000,000
PY00-01 PY01-02 PY02-03 PY03-04 PY04-050
20,000
40,000
60,000
80,000
100,000
Annual Budget Total W-P Registrants Served
2006 REPORT CARD FOR EMPLOYMENT AND TRAINING PROGRAMS
24
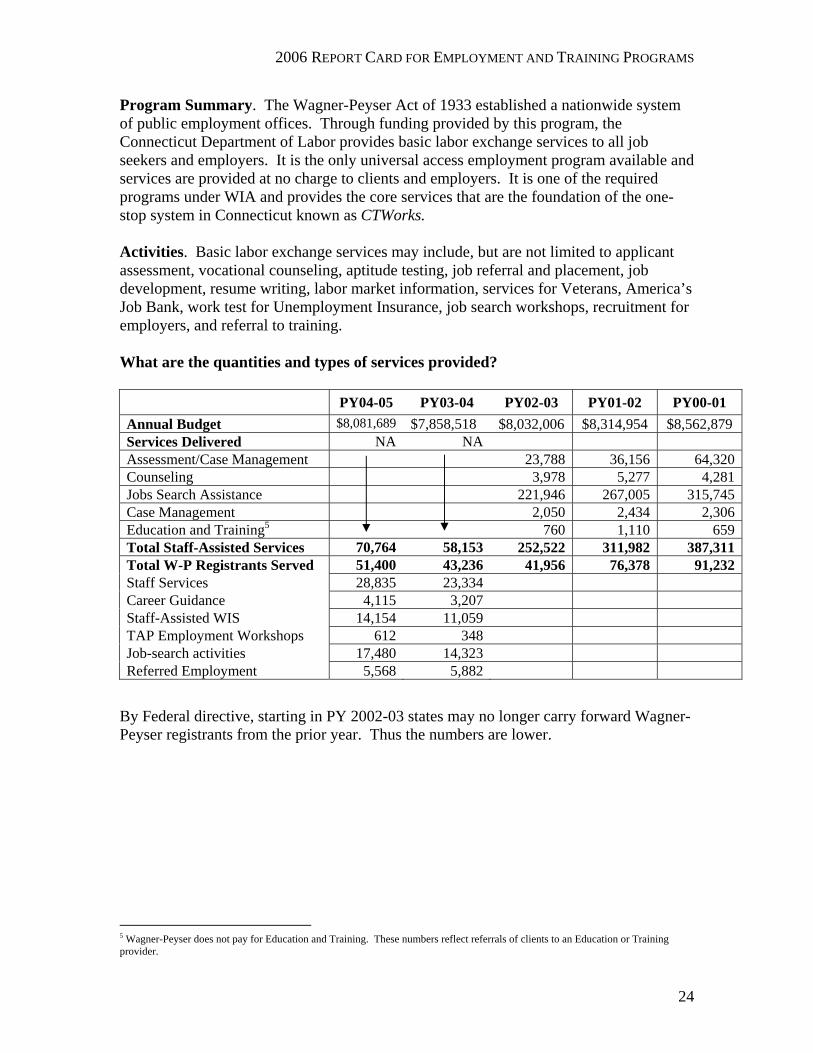
Program Summary. The Wagner-Peyser Act of 1933 established a nationwide system of public employment offices. Through funding provided by this program, the Connecticut Department of Labor provides basic labor exchange services to all job seekers and employers. It is the only universal access employment program available and services are provided at no charge to clients and employers. It is one of the required programs under WIA and provides the core services that are the foundation of the one-stop system in Connecticut known as CTWorks. Activities. Basic labor exchange services may include, but are not limited to applicant assessment, vocational counseling, aptitude testing, job referral and placement, job development, resume writing, labor market information, services for Veterans, America’s Job Bank, work test for Unemployment Insurance, job search workshops, recruitment for employers, and referral to training. What are the quantities and types of services provided?
PY04-05 PY03-04 PY02-03 PY01-02 PY00-01 Annual Budget $8,081,689 $7,858,518 $8,032,006 $8,314,954 $8,562,879 Services Delivered NA NA Assessment/Case Management 23,788 36,156 64,320 Counseling 3,978 5,277 4,281 Jobs Search Assistance 221,946 267,005 315,745 Case Management 2,050 2,434 2,306 Education and Training5 760 1,110 659 Total Staff-Assisted Services 70,764 58,153 252,522 311,982 387,311 Total W-P Registrants Served 51,400 43,236 41,956 76,378 91,232 Staff Services 28,835 23,334 Career Guidance 4,115 3,207 Staff-Assisted WIS 14,154 11,059 TAP Employment Workshops 612 348 Job-search activities 17,480 14,323 Referred Employment 5,568 5,882
By Federal directive, starting in PY 2002-03 states may no longer carry forward Wagner-Peyser registrants from the prior year. Thus the numbers are lower.
5 Wagner-Peyser does not pay for Education and Training. These numbers reflect referrals of clients to an Education or Training provider.
2006 REPORT CARD FOR EMPLOYMENT AND TRAINING PROGRAMS
25
Who is being served?
Wagner-Peyser PY04-05 PY03-04 PY02-03 PY01-02 PY00-01
Program Participants 51,400 43,236 41,955 76,378 91,232 Gender Male 26,834[52.2%] 22,628[52.3%] 23,178[55.2%] 42,204[55.3%] 49,305[54.0%] Female 24,564[47.8%] 20,607[47.7%] 18,775[44.8%] 34,174[44.7%] 41,927[46.0%] Gender unknown 2[0.0%] 1[0.0%] 1[0.0%] 0[0.0%] 0[0.0%]
Age Age 14 - 17 238[0.5%] 171[0.4%] 290[0.7%] 275[0.4%] 380[0.4%] Age 18 - 24 8,067[15.7%] 6,315[14.6%] 5,669[13.5% 10,189[13.3%] 12,691[13.9%] Age 25 - 54 35,547[69.2%] 30,336[70.2%] 29,465[70.2% 54,555[71.4%] 66,178[72.5%] Age 55 and over 6,429[12.5%] 5,549[12.8%] 6,467[15.4% 11,126[14.6%] 11,666[12.8%] Age unknown 1,119[2.2%] 865[2.0%] 38[0.1%] 156[0.2%] 203[0.2%]
Ethnicity Non-Hispanic/Latino 42,972[83.6%] 36,902[85.4%] 37,832[90.2%] 0[0.0%] 0[0.0%] Hispanic/Latino 8,428[16.4%] 6,334[14.6%] 4,123[9.8%] 10,896[14.3%] 14,027[15.4%] Hispanic/Latino unknown 0[0.0%] 0[0.0%] 0[0.0%] 65,482[85.7%] 77,205[84.6%]
Race White/Caucasian 24,916[48.5%] 21,215[49.1%] 25,246[60.2%] 47,214[61.8%] 56,244[61.6%] Black/African-American 12,734[24.8%] 10,587[24.5%] 8,652[20.6%] 13,997[18.3%] 16,987[18.6%] American Indian/Alaskan Native
518[1.0%] 427[1.0%] 179[0.4%] 293[0.4%] 256[0.3%]
Asian 777[1.5%] 708[1.6%] 724[1.7%] 1,339[1.8%] 1,287[1.4%] Hawaiian/Pacific Islander 127[0.2%] 66[0.2%] 24[0.1%] 16[0.0%] 5[0.0%] Other 409[0.8%] 303[0.7%] 0[0.0%] 0[0.0%] 0[0.0%] Race unknown 12,797[24.9%] 10,587[24.5%] 7,165[17.1%] 13,519[17.7%] 16,453[18.0%]
Education Level Less Than high school 3,570[6.9%] 2,821[6.5%] 5,516[13.1%] 11,053[14.5%] 15,866[17.4%] High School or Equivalent 12,358[24.0%] 11,523[26.7%] 20,212[48.2%] 39,028[51.1%] 44,484[48.8%] Some Post-secondary 5,743[11.2%] 5,608[13.0%] 7,108[16.9%] 14,171[18.6%] 21,929[24.0%] Associates Degree 0[0.0%] 0[0.0%] 3,530[8.4%] 3,323[4.4%] 2,326[2.5%] Bachelors Degree 1,870[3.6%] 2,064[4.8%] 3,595[8.6%] 6,554[8.6%] 4,858[5.3%] Post-baccalaureate degree 593[1.2%] 653[1.5%] 1,238[3.0%] 2,249[2.9%] 1,769[1.9%] Post-HS education - degree unknown
4,733[9.2%] 4,991[11.5%] 0[0.0%] 0[0.0%] 0[0.0%]
Education unknown 22,533[43.8% 15,576[36.0%] 756[1.8%] 0[0.0%] 0[0.0%]
Age Distribution of Participants
0.00%
20.00%
40.00%
60.00%
80.00%
100.00%
PY04-05 PY03-04 PY02-03 PY01-02 PY00-01
Age 14 - 17 Age 18 - 24 Age 25 - 54 Age 55 and over
Race and Ethicity
0.00%
20.00%
40.00%
60.00%
80.00%
100.00%
PY04-05
PY03-04
PY02-03
PY01-02
PY00-01
White/Caucasian Black/African-AmericanAmerican Indian/Alaskan Native AsianRace unknown Hispanic/Latino
2006 REPORT CARD FOR EMPLOYMENT AND TRAINING PROGRAMS
26
What were the results? Wagner-Peyser
Results PY04-05 PY03-04 PY02-03 PY01-02 PY00-01 Total Program Exiters NA
Completed Training/Education
18,369 39,043 41,956 76,378 91,232
Entered Employment
* 22,156[56.7%] 29,126[69.4%] 54,633[71.5%] 69,358[76.0%]
Retained Employment for 6 months
* 11,498[51.9%] 24,741[84.9%] 46,917[85.9%] 60,435[87.1%]
Weekly Wages on Entering Employment
* $399.29 $300.40 $331.52 $346.55
Change in Weekly Wages from pre- to post-program services
* ($12.58) ($20.77) ($24.62) $8.78
For the period of July 1, 2002-June 30, 2003, Wagner-Peyser registrant totals do not include those carried in from the previous Program Year due to a change in policy from USDOL. Consequently, the number of those tracked for registration and services delivered declined proportionately.
2006 REPORT CARD FOR EMPLOYMENT AND TRAINING PROGRAMS
27
WIA Title IB – Adults and Dislocated Workers
SUMMARY: Adult
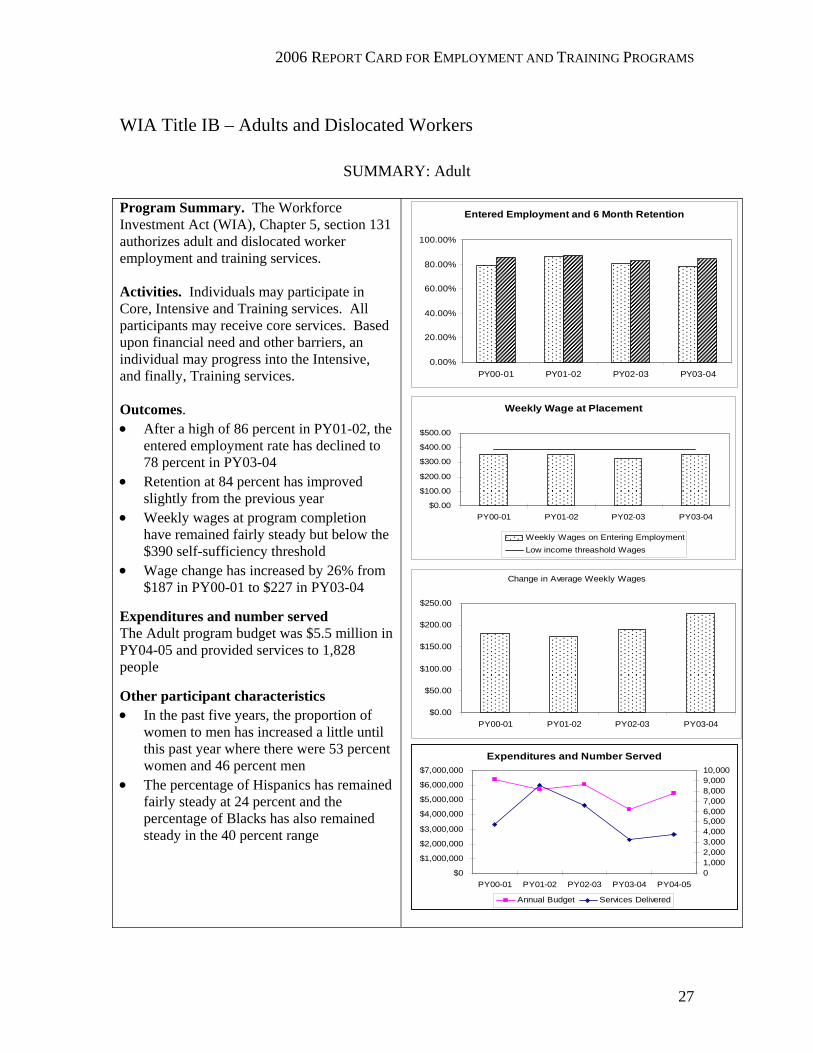
Program Summary. The Workforce Investment Act (WIA), Chapter 5, section 131 authorizes adult and dislocated worker employment and training services. Activities. Individuals may participate in Core, Intensive and Training services. All participants may receive core services. Based upon financial need and other barriers, an individual may progress into the Intensive, and finally, Training services. Outcomes. • After a high of 86 percent in PY01-02, the
entered employment rate has declined to 78 percent in PY03-04
• Retention at 84 percent has improved slightly from the previous year
• Weekly wages at program completion have remained fairly steady but below the $390 self-sufficiency threshold
• Wage change has increased by 26% from $187 in PY00-01 to $227 in PY03-04
Expenditures and number served The Adult program budget was $5.5 million in PY04-05 and provided services to 1,828 people Other participant characteristics • In the past five years, the proportion of
women to men has increased a little until this past year where there were 53 percent women and 46 percent men
• The percentage of Hispanics has remained fairly steady at 24 percent and the percentage of Blacks has also remained steady in the 40 percent range
Entered Employment and 6 Month Retention
0.00%
20.00%
40.00%
60.00%
80.00%
100.00%
PY00-01 PY01-02 PY02-03 PY03-04
Weekly Wage at Placement
$0.00
$100.00
$200.00
$300.00
$400.00
$500.00
PY00-01 PY01-02 PY02-03 PY03-04
Weekly Wages on Entering EmploymentLow income threashold Wages
Change in Average Weekly Wages
$0.00
$50.00
$100.00
$150.00
$200.00
$250.00
PY00-01 PY01-02 PY02-03 PY03-04
Expenditures and Number Served
$0
$1,000,000
$2,000,000
$3,000,000
$4,000,000
$5,000,000
$6,000,000
$7,000,000
PY00-01 PY01-02 PY02-03 PY03-04 PY04-0501,0002,0003,0004,0005,0006,0007,0008,0009,00010,000
Annual Budget Services Delivered
2006 REPORT CARD FOR EMPLOYMENT AND TRAINING PROGRAMS
28
SUMMARY: Dislocated Workers
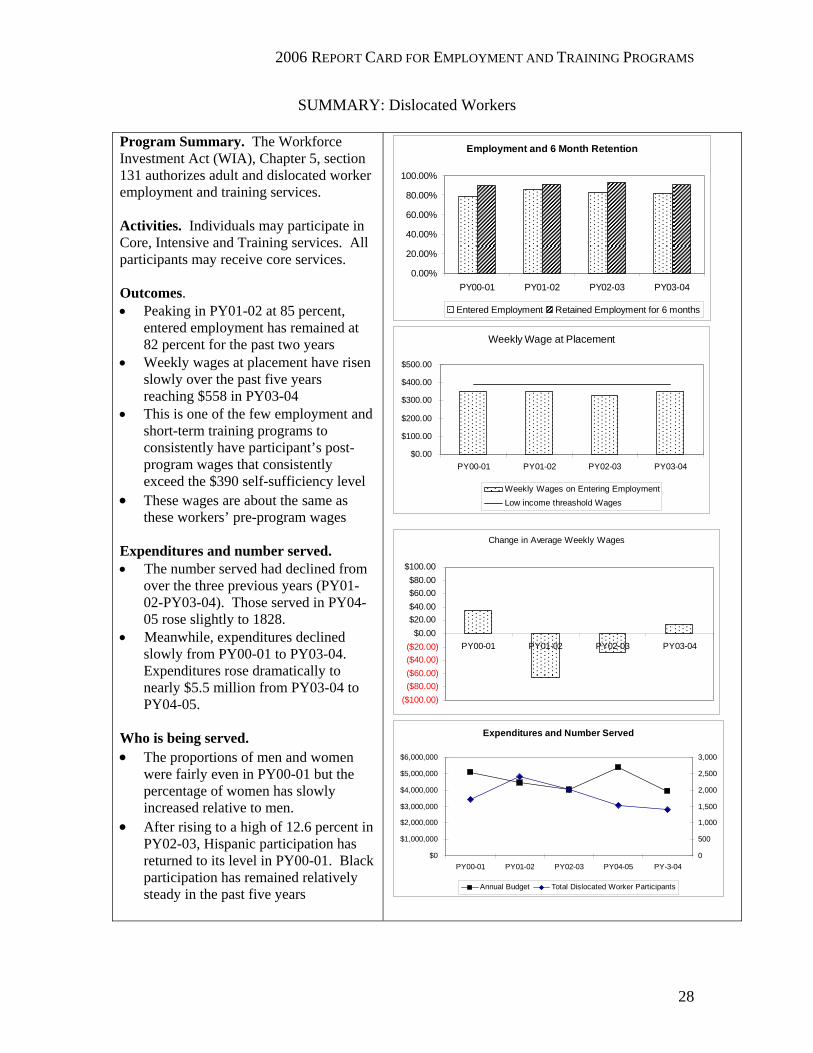
Program Summary. The Workforce Investment Act (WIA), Chapter 5, section 131 authorizes adult and dislocated worker employment and training services. Activities. Individuals may participate in Core, Intensive and Training services. All participants may receive core services. Outcomes. • Peaking in PY01-02 at 85 percent,
entered employment has remained at 82 percent for the past two years
• Weekly wages at placement have risen slowly over the past five years reaching $558 in PY03-04
• This is one of the few employment and short-term training programs to consistently have participant’s post-program wages that consistently exceed the $390 self-sufficiency level
• These wages are about the same as these workers’ pre-program wages
Expenditures and number served. • The number served had declined from
over the three previous years (PY01-02-PY03-04). Those served in PY04-05 rose slightly to 1828.
• Meanwhile, expenditures declined slowly from PY00-01 to PY03-04. Expenditures rose dramatically to nearly $5.5 million from PY03-04 to PY04-05.
Who is being served. • The proportions of men and women
were fairly even in PY00-01 but the percentage of women has slowly increased relative to men.
• After rising to a high of 12.6 percent in PY02-03, Hispanic participation has returned to its level in PY00-01. Black participation has remained relatively steady in the past five years
Employment and 6 Month Retention
0.00%
20.00%
40.00%
60.00%
80.00%
100.00%
PY00-01 PY01-02 PY02-03 PY03-04
Entered Employment Retained Employment for 6 months
Weekly Wage at Placement
$0.00
$100.00
$200.00
$300.00
$400.00
$500.00
PY00-01 PY01-02 PY02-03 PY03-04
Weekly Wages on Entering EmploymentLow income threashold Wages
Change in Average Weekly Wages
($100.00)($80.00)($60.00)($40.00)($20.00)
$0.00$20.00$40.00$60.00$80.00
$100.00
PY00-01 PY01-02 PY02-03 PY03-04
Expenditures and Number Served
$0
$1,000,000
$2,000,000
$3,000,000
$4,000,000
$5,000,000
$6,000,000
PY00-01 PY01-02 PY02-03 PY04-05 PY-3-040
500
1,000
1,500
2,000
2,500
3,000
Annual Budget Total Dislocated Worker Participants
2006 REPORT CARD FOR EMPLOYMENT AND TRAINING PROGRAMS
29
Introduction: There are three funding streams to the state and local areas: adults, dislocated workers and youth. Eighty-five percent (85%) of adult and youth funds are allocated to local areas with the remainder (15% Governor’s Reserve) reserved for state administration and other statewide activities. Sixty percent (60%) of dislocated worker funds are allocated to the Workforce Investment Boards (WIBs) to provide employment and training services with fifteen percent (15% Governor’s Reserve) reserved for state administration and other statewide activities and twenty-five percent (25%) reserved for rapid response activities. Pursuant to the Workforce Investment Act (WIA) (effective July 1, 1998), the Governor designated the CTDOL:
1. the administrative financial agency for WIA 2. the labor market information/statewide employment statistics agency for WIA 3. the agency to administer the statewide list of providers/ approved programs for
employment and training services under WIA, and 4. the agency charged with Performance Measurement requirements under WIA.
The report begins with adult and dislocated services and is followed by the report on youth services. WIA Title IB – Adults and Dislocated Workers Program Summary. The Workforce Investment Act (WIA), Chapter 5, section 131 authorizes adult and dislocated worker employment and training services. This legislation is meant to streamline services within the One-Stop environment (CT Works), to empower individuals to make choices about their training through individual training accounts (ITAs), and to provide universal access to self-services. The system is intended to be customer-focused, and to help individuals access the tools they need to manage their careers. Activities. Individuals may participate in Core, Intensive and Training services. All participants may receive core services. Core Services for both Adults and Dislocated Workers include:
• Job Search Assistance • Career Counseling • Job Referrals • Job Development • Workshops and Job Clubs
Based upon financial need and other barriers, an individual may progress into the Intensive, and finally, Training services. Intensive Services for both Adults and Dislocated Workers include:
• Assessment • Developing and Individual Employment Plan
2006 REPORT CARD FOR EMPLOYMENT AND TRAINING PROGRAMS
30
• Group Counseling • Individual Counseling and Career Planning • Case Management • Short Term Pre-Vocational Services • Out of Area Job Search Assistance • Literacy Act Services • Relocation Assistance • Internships • Work Experience Programs
All of these services are available within the CT Works and can be interchanged with other co-located partner program services according to an individual’s needs. Once the need for training services has been determined, an individual may be given an Individual Training Account (ITA), which they may use to pay for training of their choice. This training program must be chosen from a Statewide Eligible Training Program (Provider) List. Training Services for both Adults and Dislocated Workers include:
• Occupational Skills Training • On-the-Job Training • Private Sector Training Programs • Skill Upgrading and Retraining • Entrepreneurial Training • Adult Education, basic skills and/or literacy in combination with any other
training • Customized Training • Co-Op
2006 REPORT CARD FOR EMPLOYMENT AND TRAINING PROGRAMS
31
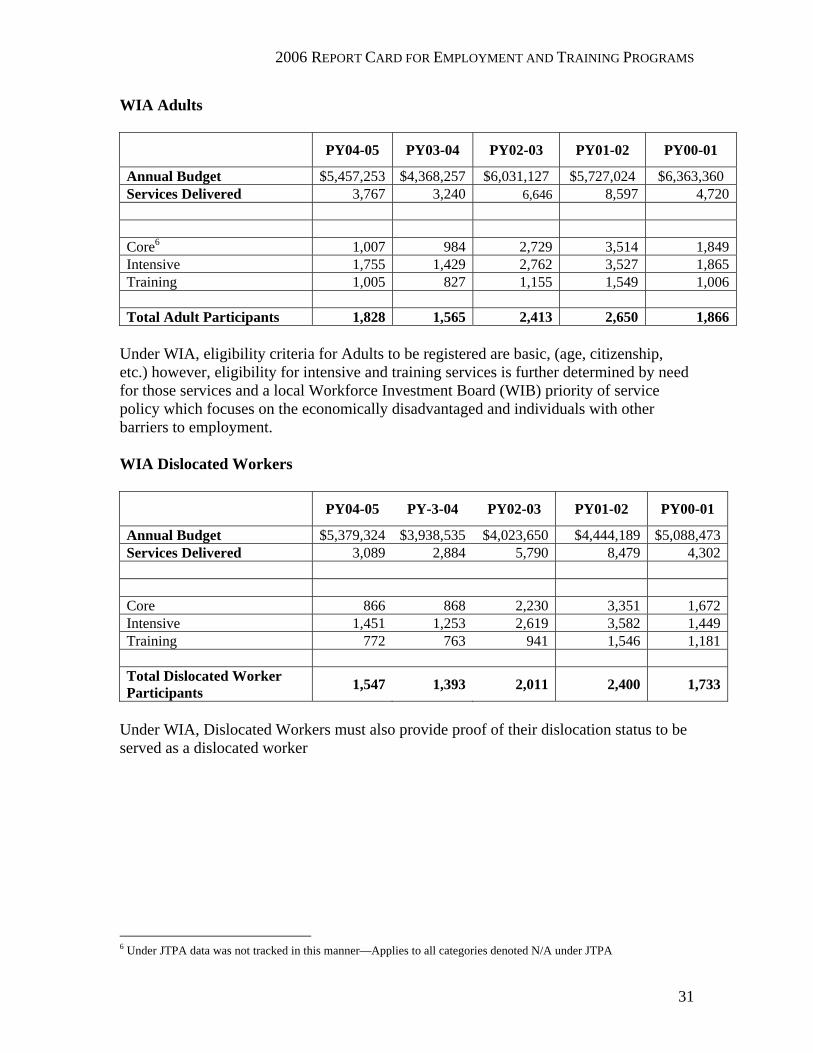
WIA Adults
PY04-05 PY03-04 PY02-03 PY01-02 PY00-01
Annual Budget $5,457,253 $4,368,257 $6,031,127 $5,727,024 $6,363,360 Services Delivered 3,767 3,240 6,646 8,597 4,720 Core6 1,007 984 2,729 3,514 1,849 Intensive 1,755 1,429 2,762 3,527 1,865 Training 1,005 827 1,155 1,549 1,006 Total Adult Participants 1,828 1,565 2,413 2,650 1,866
Under WIA, eligibility criteria for Adults to be registered are basic, (age, citizenship, etc.) however, eligibility for intensive and training services is further determined by need for those services and a local Workforce Investment Board (WIB) priority of service policy which focuses on the economically disadvantaged and individuals with other barriers to employment. WIA Dislocated Workers
PY04-05 PY-3-04 PY02-03 PY01-02 PY00-01
Annual Budget $5,379,324 $3,938,535 $4,023,650 $4,444,189 $5,088,473Services Delivered 3,089 2,884 5,790 8,479 4,302 Core 866 868 2,230 3,351 1,672 Intensive 1,451 1,253 2,619 3,582 1,449 Training 772 763 941 1,546 1,181 Total Dislocated Worker Participants 1,547 1,393 2,011 2,400 1,733
Under WIA, Dislocated Workers must also provide proof of their dislocation status to be served as a dislocated worker
6 Under JTPA data was not tracked in this manner—Applies to all categories denoted N/A under JTPA
2006 REPORT CARD FOR EMPLOYMENT AND TRAINING PROGRAMS
32
Who is being served? Race and Ethnicity
0.00%10.00%20.00%30.00%40.00%50.00%60.00%
PY04-05 PY03-04 PY02-03 PY01-02 PY00-01
White/Caucasian Black/African-AmericanAmerican Indian/Alaskan Native AsianHawaiian/Pacific Islander Race unknownHispanic/Latino
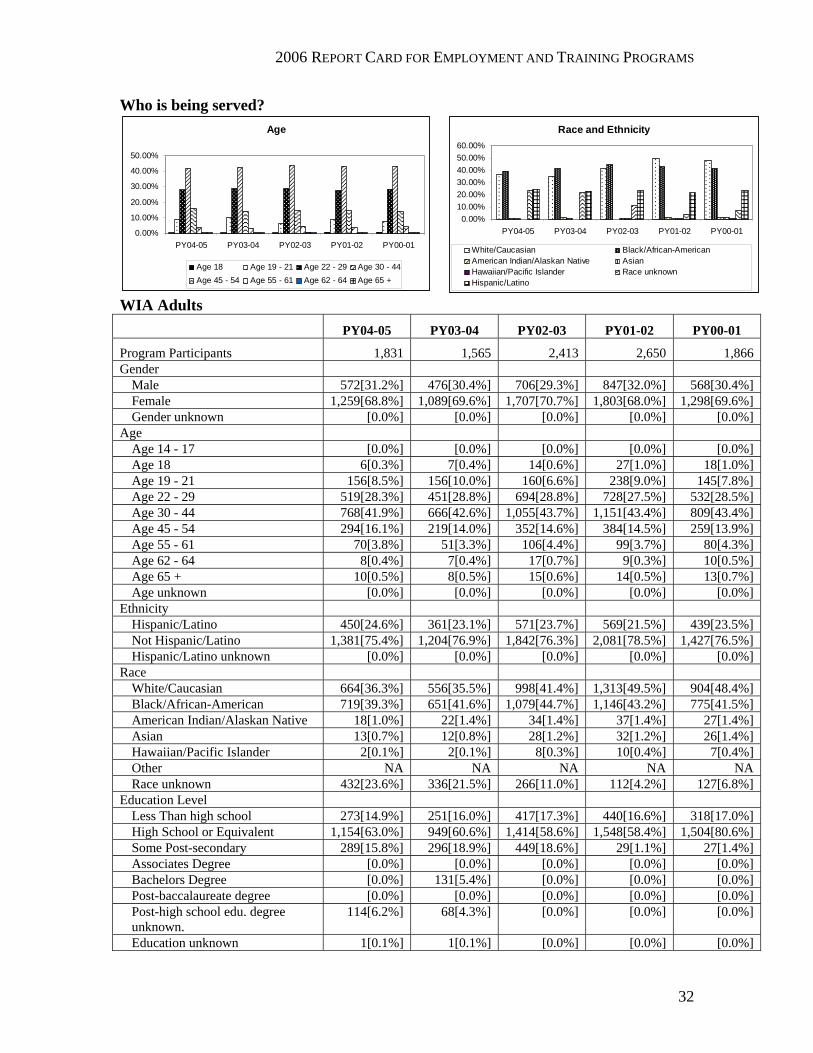
WIA Adults PY04-05 PY03-04 PY02-03 PY01-02 PY00-01
Program Participants 1,831 1,565 2,413 2,650 1,866 Gender
Male 572[31.2%] 476[30.4%] 706[29.3%] 847[32.0%] 568[30.4%] Female 1,259[68.8%] 1,089[69.6%] 1,707[70.7%] 1,803[68.0%] 1,298[69.6%] Gender unknown [0.0%] [0.0%] [0.0%] [0.0%] [0.0%]
Age Age 14 - 17 [0.0%] [0.0%] [0.0%] [0.0%] [0.0%] Age 18 6[0.3%] 7[0.4%] 14[0.6%] 27[1.0%] 18[1.0%] Age 19 - 21 156[8.5%] 156[10.0%] 160[6.6%] 238[9.0%] 145[7.8%] Age 22 - 29 519[28.3%] 451[28.8%] 694[28.8%] 728[27.5%] 532[28.5%] Age 30 - 44 768[41.9%] 666[42.6%] 1,055[43.7%] 1,151[43.4%] 809[43.4%] Age 45 - 54 294[16.1%] 219[14.0%] 352[14.6%] 384[14.5%] 259[13.9%] Age 55 - 61 70[3.8%] 51[3.3%] 106[4.4%] 99[3.7%] 80[4.3%] Age 62 - 64 8[0.4%] 7[0.4%] 17[0.7%] 9[0.3%] 10[0.5%] Age 65 + 10[0.5%] 8[0.5%] 15[0.6%] 14[0.5%] 13[0.7%] Age unknown [0.0%] [0.0%] [0.0%] [0.0%] [0.0%]
Ethnicity Hispanic/Latino 450[24.6%] 361[23.1%] 571[23.7%] 569[21.5%] 439[23.5%] Not Hispanic/Latino 1,381[75.4%] 1,204[76.9%] 1,842[76.3%] 2,081[78.5%] 1,427[76.5%] Hispanic/Latino unknown [0.0%] [0.0%] [0.0%] [0.0%] [0.0%]
Race White/Caucasian 664[36.3%] 556[35.5%] 998[41.4%] 1,313[49.5%] 904[48.4%] Black/African-American 719[39.3%] 651[41.6%] 1,079[44.7%] 1,146[43.2%] 775[41.5%] American Indian/Alaskan Native 18[1.0%] 22[1.4%] 34[1.4%] 37[1.4%] 27[1.4%] Asian 13[0.7%] 12[0.8%] 28[1.2%] 32[1.2%] 26[1.4%] Hawaiian/Pacific Islander 2[0.1%] 2[0.1%] 8[0.3%] 10[0.4%] 7[0.4%] Other NA NA NA NA NA Race unknown 432[23.6%] 336[21.5%] 266[11.0%] 112[4.2%] 127[6.8%]
Education Level Less Than high school 273[14.9%] 251[16.0%] 417[17.3%] 440[16.6%] 318[17.0%] High School or Equivalent 1,154[63.0%] 949[60.6%] 1,414[58.6%] 1,548[58.4%] 1,504[80.6%] Some Post-secondary 289[15.8%] 296[18.9%] 449[18.6%] 29[1.1%] 27[1.4%] Associates Degree [0.0%] [0.0%] [0.0%] [0.0%] [0.0%] Bachelors Degree [0.0%] 131[5.4%] [0.0%] [0.0%] [0.0%] Post-baccalaureate degree [0.0%] [0.0%] [0.0%] [0.0%] [0.0%] Post-high school edu. degree unknown.
114[6.2%] 68[4.3%] [0.0%] [0.0%] [0.0%]
Education unknown 1[0.1%] 1[0.1%] [0.0%] [0.0%] [0.0%]
Age
0.00%
10.00%
20.00%
30.00%
40.00%
50.00%
PY04-05 PY03-04 PY02-03 PY01-02 PY00-01
Age 18 Age 19 - 21 Age 22 - 29 Age 30 - 44Age 45 - 54 Age 55 - 61 Age 62 - 64 Age 65 +
2006 REPORT CARD FOR EMPLOYMENT AND TRAINING PROGRAMS
33
Who is being served?
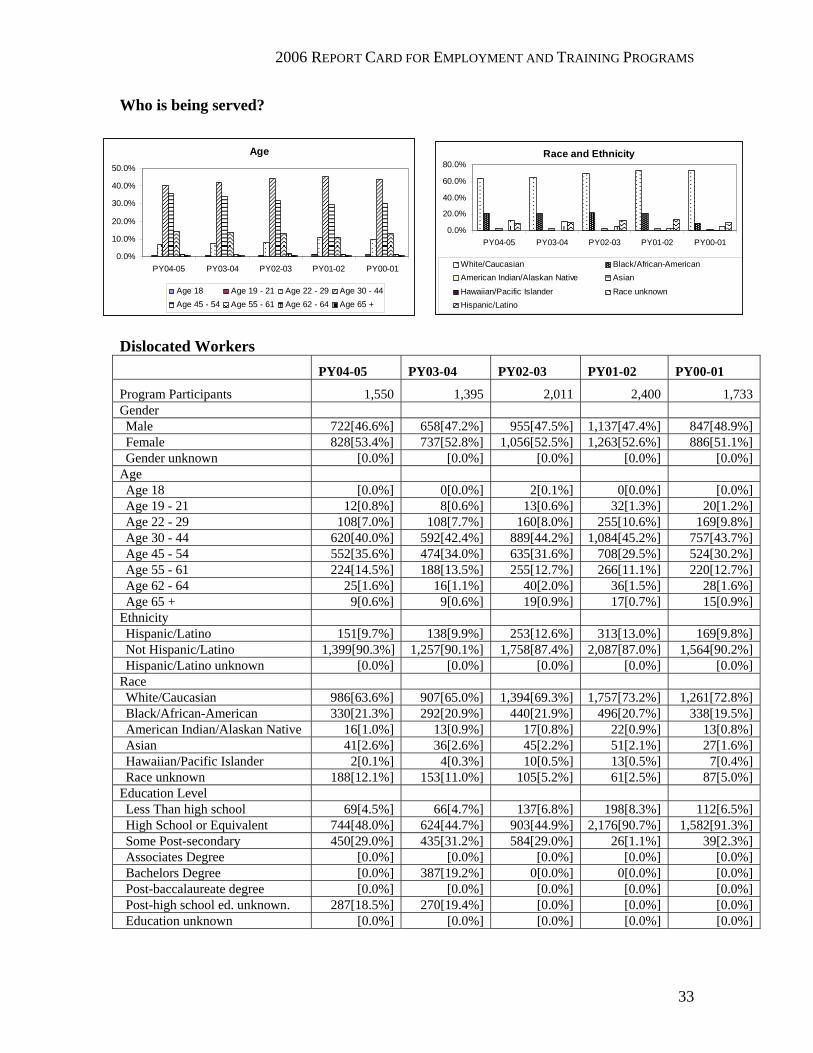
Dislocated Workers PY04-05 PY03-04 PY02-03 PY01-02 PY00-01
Program Participants 1,550 1,395 2,011 2,400 1,733 Gender Male 722[46.6%] 658[47.2%] 955[47.5%] 1,137[47.4%] 847[48.9%] Female 828[53.4%] 737[52.8%] 1,056[52.5%] 1,263[52.6%] 886[51.1%] Gender unknown [0.0%] [0.0%] [0.0%] [0.0%] [0.0%]
Age Age 18 [0.0%] 0[0.0%] 2[0.1%] 0[0.0%] [0.0%] Age 19 - 21 12[0.8%] 8[0.6%] 13[0.6%] 32[1.3%] 20[1.2%] Age 22 - 29 108[7.0%] 108[7.7%] 160[8.0%] 255[10.6%] 169[9.8%] Age 30 - 44 620[40.0%] 592[42.4%] 889[44.2%] 1,084[45.2%] 757[43.7%] Age 45 - 54 552[35.6%] 474[34.0%] 635[31.6%] 708[29.5%] 524[30.2%] Age 55 - 61 224[14.5%] 188[13.5%] 255[12.7%] 266[11.1%] 220[12.7%] Age 62 - 64 25[1.6%] 16[1.1%] 40[2.0%] 36[1.5%] 28[1.6%] Age 65 + 9[0.6%] 9[0.6%] 19[0.9%] 17[0.7%] 15[0.9%]
Ethnicity Hispanic/Latino 151[9.7%] 138[9.9%] 253[12.6%] 313[13.0%] 169[9.8%] Not Hispanic/Latino 1,399[90.3%] 1,257[90.1%] 1,758[87.4%] 2,087[87.0%] 1,564[90.2%] Hispanic/Latino unknown [0.0%] [0.0%] [0.0%] [0.0%] [0.0%]
Race White/Caucasian 986[63.6%] 907[65.0%] 1,394[69.3%] 1,757[73.2%] 1,261[72.8%] Black/African-American 330[21.3%] 292[20.9%] 440[21.9%] 496[20.7%] 338[19.5%] American Indian/Alaskan Native 16[1.0%] 13[0.9%] 17[0.8%] 22[0.9%] 13[0.8%] Asian 41[2.6%] 36[2.6%] 45[2.2%] 51[2.1%] 27[1.6%] Hawaiian/Pacific Islander 2[0.1%] 4[0.3%] 10[0.5%] 13[0.5%] 7[0.4%] Race unknown 188[12.1%] 153[11.0%] 105[5.2%] 61[2.5%] 87[5.0%]
Education Level Less Than high school 69[4.5%] 66[4.7%] 137[6.8%] 198[8.3%] 112[6.5%] High School or Equivalent 744[48.0%] 624[44.7%] 903[44.9%] 2,176[90.7%] 1,582[91.3%] Some Post-secondary 450[29.0%] 435[31.2%] 584[29.0%] 26[1.1%] 39[2.3%] Associates Degree [0.0%] [0.0%] [0.0%] [0.0%] [0.0%] Bachelors Degree [0.0%] 387[19.2%] 0[0.0%] 0[0.0%] [0.0%] Post-baccalaureate degree [0.0%] [0.0%] [0.0%] [0.0%] [0.0%] Post-high school ed. unknown. 287[18.5%] 270[19.4%] [0.0%] [0.0%] [0.0%] Education unknown [0.0%] [0.0%] [0.0%] [0.0%] [0.0%]
Age
0.0%
10.0%
20.0%
30.0%
40.0%
50.0%
PY04-05 PY03-04 PY02-03 PY01-02 PY00-01
Age 18 Age 19 - 21 Age 22 - 29 Age 30 - 44Age 45 - 54 Age 55 - 61 Age 62 - 64 Age 65 +
Race and Ethnicity
0.0%
20.0%
40.0%
60.0%
80.0%
PY04-05 PY03-04 PY02-03 PY01-02 PY00-01
White/Caucasian Black/African-AmericanAmerican Indian/Alaskan Native Asian
Hawaiian/Pacific Islander Race unknownHispanic/Latino
2006 REPORT CARD FOR EMPLOYMENT AND TRAINING PROGRAMS
34
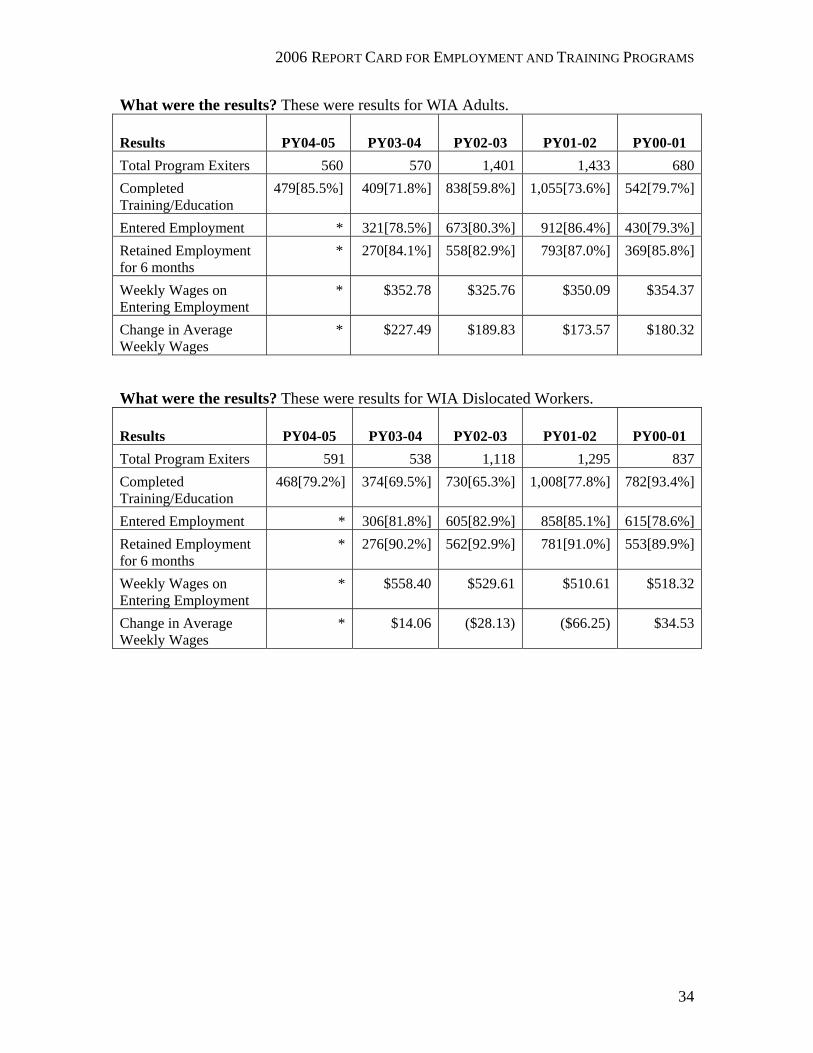
What were the results? These were results for WIA Adults.
Results PY04-05 PY03-04 PY02-03 PY01-02 PY00-01 Total Program Exiters 560 570 1,401 1,433 680Completed Training/Education
479[85.5%] 409[71.8%] 838[59.8%] 1,055[73.6%] 542[79.7%]
Entered Employment * 321[78.5%] 673[80.3%] 912[86.4%] 430[79.3%]Retained Employment for 6 months
* 270[84.1%] 558[82.9%] 793[87.0%] 369[85.8%]
Weekly Wages on Entering Employment
* $352.78 $325.76 $350.09 $354.37
Change in Average Weekly Wages
* $227.49 $189.83 $173.57 $180.32
What were the results? These were results for WIA Dislocated Workers.
Results PY04-05 PY03-04 PY02-03 PY01-02 PY00-01 Total Program Exiters 591 538 1,118 1,295 837Completed Training/Education
468[79.2%] 374[69.5%] 730[65.3%] 1,008[77.8%] 782[93.4%]
Entered Employment * 306[81.8%] 605[82.9%] 858[85.1%] 615[78.6%]Retained Employment for 6 months
* 276[90.2%] 562[92.9%] 781[91.0%] 553[89.9%]
Weekly Wages on Entering Employment
* $558.40 $529.61 $510.61 $518.32
Change in Average Weekly Wages
* $14.06 ($28.13) ($66.25) $34.53
2006 REPORT CARD FOR EMPLOYMENT AND TRAINING PROGRAMS
35
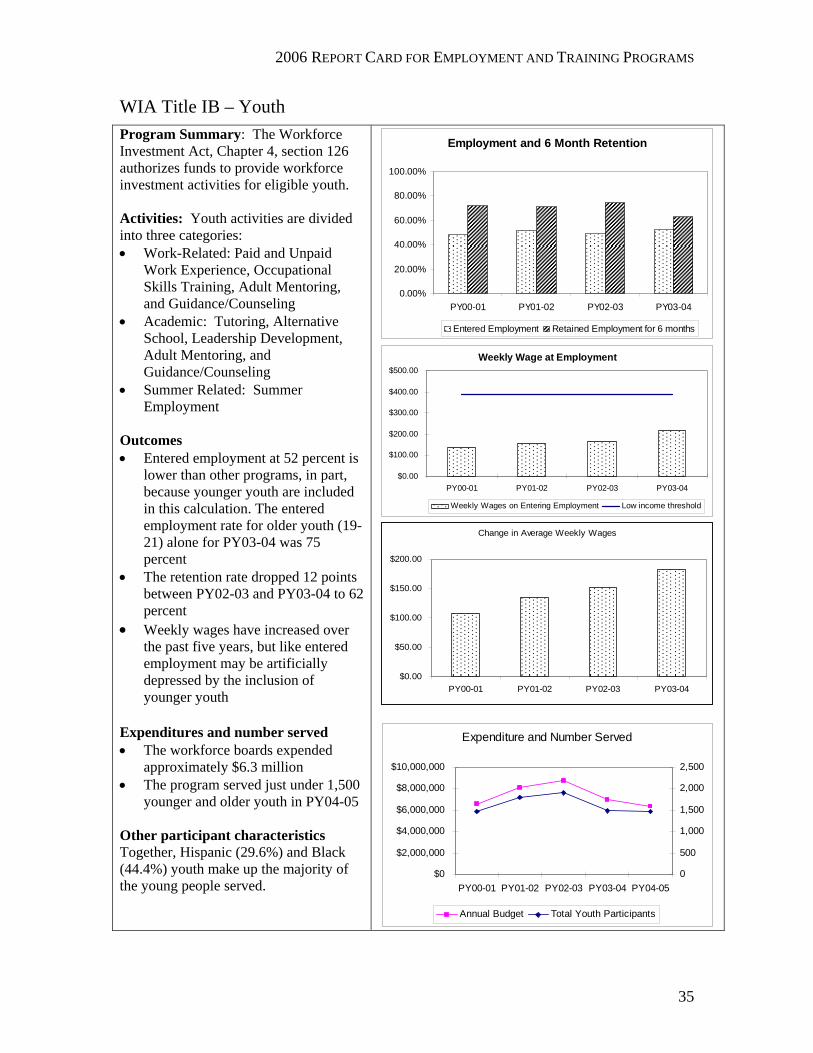
WIA Title IB – Youth Program Summary: The Workforce Investment Act, Chapter 4, section 126 authorizes funds to provide workforce investment activities for eligible youth. Activities: Youth activities are divided into three categories: • Work-Related: Paid and Unpaid
Work Experience, Occupational Skills Training, Adult Mentoring, and Guidance/Counseling
• Academic: Tutoring, Alternative School, Leadership Development, Adult Mentoring, and Guidance/Counseling
• Summer Related: Summer Employment
Outcomes • Entered employment at 52 percent is
lower than other programs, in part, because younger youth are included in this calculation. The entered employment rate for older youth (19-21) alone for PY03-04 was 75 percent
• The retention rate dropped 12 points between PY02-03 and PY03-04 to 62 percent
• Weekly wages have increased over the past five years, but like entered employment may be artificially depressed by the inclusion of younger youth
Expenditures and number served • The workforce boards expended
approximately $6.3 million • The program served just under 1,500
younger and older youth in PY04-05 Other participant characteristics Together, Hispanic (29.6%) and Black (44.4%) youth make up the majority of the young people served.
Employment and 6 Month Retention
0.00%
20.00%
40.00%
60.00%
80.00%
100.00%
PY00-01 PY01-02 PY02-03 PY03-04
Entered Employment Retained Employment for 6 months
Weekly Wage at Employment
$0.00
$100.00
$200.00
$300.00
$400.00
$500.00
PY00-01 PY01-02 PY02-03 PY03-04
Weekly Wages on Entering Employment Low income threshold
Change in Average Weekly Wages
$0.00
$50.00
$100.00
$150.00
$200.00
PY00-01 PY01-02 PY02-03 PY03-04
Expenditure and Number Served
$0
$2,000,000
$4,000,000
$6,000,000
$8,000,000
$10,000,000
PY00-01 PY01-02 PY02-03 PY03-04 PY04-050
500
1,000
1,500
2,000
2,500
Annual Budget Total Youth Participants
2006 REPORT CARD FOR EMPLOYMENT AND TRAINING PROGRAMS
36
Program Summary: The Workforce Investment Act, Chapter 4, section 126 authorizes funds to provide workforce investment activities for eligible youth. The legislation and regulations stress a new approach to serving youth. Youth services are considered to be long –term, with involvement lasting at least a year. Long and short-term goals are set with the youth so they can achieve educational and vocational benchmarks in preparation for the world of work. Educational achievement and retention is priority for younger youth, while employability skills and employment focus is acceptable for older youth (19-21). Activities: Youth activities are divided into three categories: • Work-Related: Paid and Unpaid Work Experience, Occupational Skills Training,
Adult Mentoring, and Guidance/Counseling • Academic: Tutoring, Alternative School, Leadership Development, Adult
Mentoring, and Guidance/Counseling • Summer Related: Summer Employment
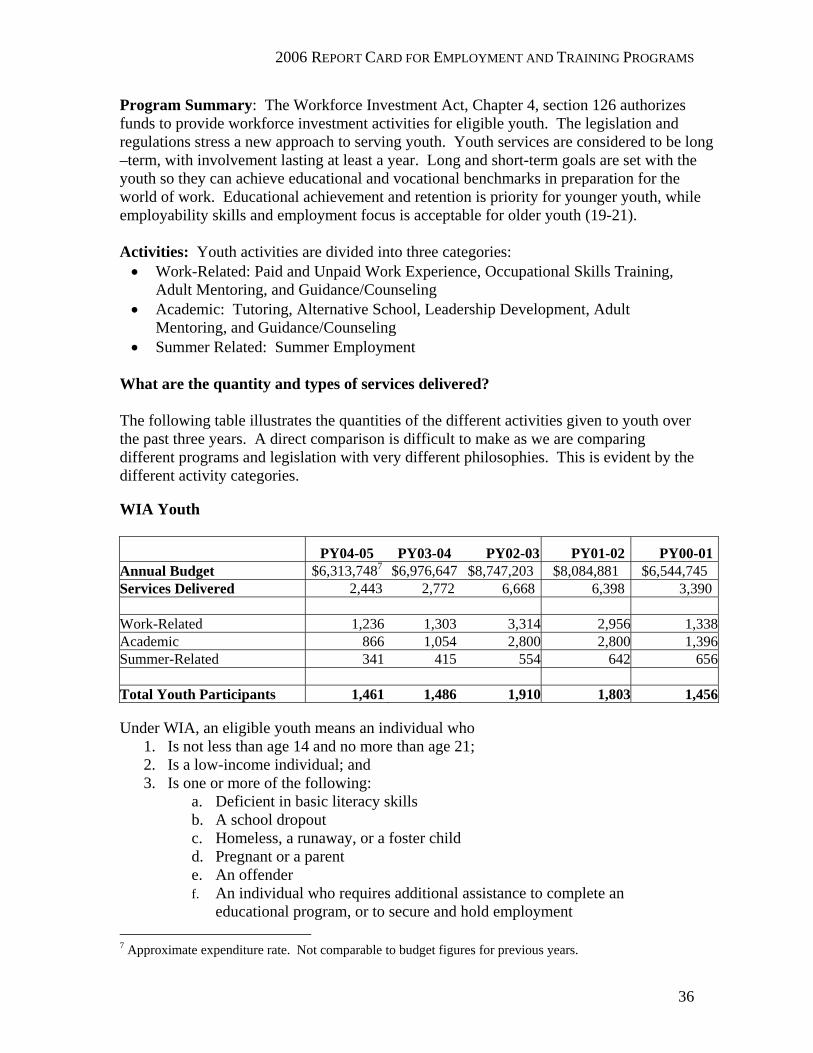
What are the quantity and types of services delivered? The following table illustrates the quantities of the different activities given to youth over the past three years. A direct comparison is difficult to make as we are comparing different programs and legislation with very different philosophies. This is evident by the different activity categories. WIA Youth PY04-05 PY03-04 PY02-03 PY01-02 PY00-01Annual Budget $6,313,7487 $6,976,647 $8,747,203 $8,084,881 $6,544,745 Services Delivered 2,443 2,772 6,668 6,398 3,390 Work-Related 1,236 1,303 3,314 2,956 1,338 Academic 866 1,054 2,800 2,800 1,396 Summer-Related 341 415 554 642 656 Total Youth Participants 1,461 1,486 1,910 1,803 1,456 Under WIA, an eligible youth means an individual who
1. Is not less than age 14 and no more than age 21; 2. Is a low-income individual; and 3. Is one or more of the following:
a. Deficient in basic literacy skills b. A school dropout c. Homeless, a runaway, or a foster child d. Pregnant or a parent e. An offender f. An individual who requires additional assistance to complete an
educational program, or to secure and hold employment 7 Approximate expenditure rate. Not comparable to budget figures for previous years.
2006 REPORT CARD FOR EMPLOYMENT AND TRAINING PROGRAMS
37
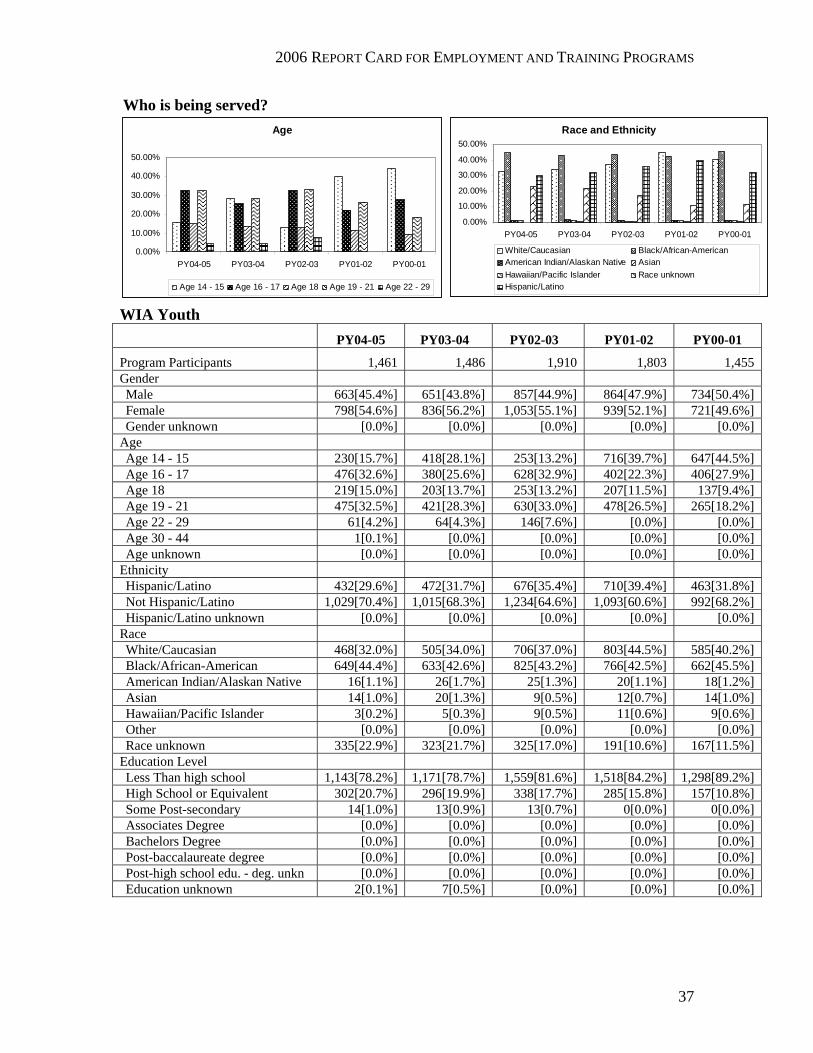
Who is being served?
WIA Youth PY04-05 PY03-04 PY02-03 PY01-02 PY00-01
Program Participants 1,461 1,486 1,910 1,803 1,455 Gender Male 663[45.4%] 651[43.8%] 857[44.9%] 864[47.9%] 734[50.4%] Female 798[54.6%] 836[56.2%] 1,053[55.1%] 939[52.1%] 721[49.6%] Gender unknown [0.0%] [0.0%] [0.0%] [0.0%] [0.0%]
Age Age 14 - 15 230[15.7%] 418[28.1%] 253[13.2%] 716[39.7%] 647[44.5%] Age 16 - 17 476[32.6%] 380[25.6%] 628[32.9%] 402[22.3%] 406[27.9%] Age 18 219[15.0%] 203[13.7%] 253[13.2%] 207[11.5%] 137[9.4%] Age 19 - 21 475[32.5%] 421[28.3%] 630[33.0%] 478[26.5%] 265[18.2%] Age 22 - 29 61[4.2%] 64[4.3%] 146[7.6%] [0.0%] [0.0%] Age 30 - 44 1[0.1%] [0.0%] [0.0%] [0.0%] [0.0%] Age unknown [0.0%] [0.0%] [0.0%] [0.0%] [0.0%]
Ethnicity Hispanic/Latino 432[29.6%] 472[31.7%] 676[35.4%] 710[39.4%] 463[31.8%] Not Hispanic/Latino 1,029[70.4%] 1,015[68.3%] 1,234[64.6%] 1,093[60.6%] 992[68.2%] Hispanic/Latino unknown [0.0%] [0.0%] [0.0%] [0.0%] [0.0%]
Race White/Caucasian 468[32.0%] 505[34.0%] 706[37.0%] 803[44.5%] 585[40.2%] Black/African-American 649[44.4%] 633[42.6%] 825[43.2%] 766[42.5%] 662[45.5%] American Indian/Alaskan Native 16[1.1%] 26[1.7%] 25[1.3%] 20[1.1%] 18[1.2%] Asian 14[1.0%] 20[1.3%] 9[0.5%] 12[0.7%] 14[1.0%] Hawaiian/Pacific Islander 3[0.2%] 5[0.3%] 9[0.5%] 11[0.6%] 9[0.6%] Other [0.0%] [0.0%] [0.0%] [0.0%] [0.0%] Race unknown 335[22.9%] 323[21.7%] 325[17.0%] 191[10.6%] 167[11.5%]
Education Level Less Than high school 1,143[78.2%] 1,171[78.7%] 1,559[81.6%] 1,518[84.2%] 1,298[89.2%] High School or Equivalent 302[20.7%] 296[19.9%] 338[17.7%] 285[15.8%] 157[10.8%] Some Post-secondary 14[1.0%] 13[0.9%] 13[0.7%] 0[0.0%] 0[0.0%] Associates Degree [0.0%] [0.0%] [0.0%] [0.0%] [0.0%] Bachelors Degree [0.0%] [0.0%] [0.0%] [0.0%] [0.0%] Post-baccalaureate degree [0.0%] [0.0%] [0.0%] [0.0%] [0.0%] Post-high school edu. - deg. unkn [0.0%] [0.0%] [0.0%] [0.0%] [0.0%] Education unknown 2[0.1%] 7[0.5%] [0.0%] [0.0%] [0.0%]
Age
0.00%
10.00%
20.00%
30.00%
40.00%
50.00%
PY04-05 PY03-04 PY02-03 PY01-02 PY00-01
Age 14 - 15 Age 16 - 17 Age 18 Age 19 - 21 Age 22 - 29
Race and Ethnicity
0.00%
10.00%
20.00%
30.00%
40.00%
50.00%
PY04-05 PY03-04 PY02-03 PY01-02 PY00-01
White/Caucasian Black/African-AmericanAmerican Indian/Alaskan Native AsianHawaiian/Pacific Islander Race unknownHispanic/Latino

2006 REPORT CARD FOR EMPLOYMENT AND TRAINING PROGRAMS
38
What were the results? Youth Results PY04-05 PY03-04 PY02-03 PY01-02 PY00-01 Total Program Exiters 444 1,102 923 939 758Completed Training/Education
444[100.0%] 1,102[100.0%] 731[79.2%] 803[85.5%] 683[90.1%]
Entered Employment
* 573[52.0%] 356[48.7%] 414[51.6%] 326[47.7%]
Retained Employment for 6 months
* 359[62.7%] 265[74.4%] 293[70.8%] 234[71.8%]
Weekly Wages on Entering Employment
* $217.63 $167.80 $156.84 $136.66
Change in Average Weekly Wages
* $182.77 $151.46 $134.88 $107.94
2006 REPORT CARD FOR EMPLOYMENT AND TRAINING PROGRAMS
39
Charter Oak State College SUMMARY
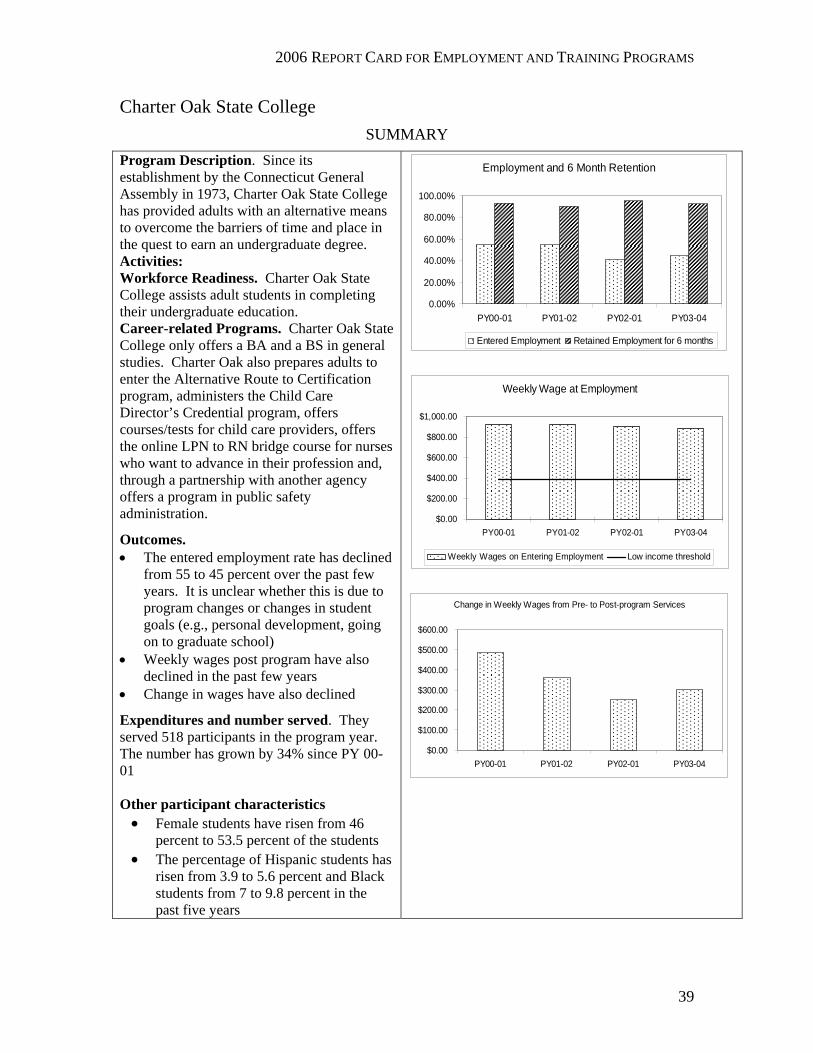
Program Description. Since its establishment by the Connecticut General Assembly in 1973, Charter Oak State College has provided adults with an alternative means to overcome the barriers of time and place in the quest to earn an undergraduate degree. Activities: Workforce Readiness. Charter Oak State College assists adult students in completing their undergraduate education. Career-related Programs. Charter Oak State College only offers a BA and a BS in general studies. Charter Oak also prepares adults to enter the Alternative Route to Certification program, administers the Child Care Director’s Credential program, offers courses/tests for child care providers, offers the online LPN to RN bridge course for nurses who want to advance in their profession and, through a partnership with another agency offers a program in public safety administration.
Outcomes. • The entered employment rate has declined
from 55 to 45 percent over the past few years. It is unclear whether this is due to program changes or changes in student goals (e.g., personal development, going on to graduate school)
• Weekly wages post program have also declined in the past few years
• Change in wages have also declined
Expenditures and number served. They served 518 participants in the program year. The number has grown by 34% since PY 00-01 Other participant characteristics • Female students have risen from 46
percent to 53.5 percent of the students • The percentage of Hispanic students has
risen from 3.9 to 5.6 percent and Black students from 7 to 9.8 percent in the past five years
Employment and 6 Month Retention
0.00%
20.00%
40.00%
60.00%
80.00%
100.00%
PY00-01 PY01-02 PY02-01 PY03-04
Entered Employment Retained Employment for 6 months
Weekly Wage at Employment
$0.00
$200.00
$400.00
$600.00
$800.00
$1,000.00
PY00-01 PY01-02 PY02-01 PY03-04
Weekly Wages on Entering Employment Low income threshold
Change in Weekly Wages from Pre- to Post-program Services
$0.00
$100.00
$200.00
$300.00
$400.00
$500.00
$600.00
PY00-01 PY01-02 PY02-01 PY03-04
2006 REPORT CARD FOR EMPLOYMENT AND TRAINING PROGRAMS
40
Program Description. Since its establishment by the Connecticut General Assembly in 1973, Charter Oak State College has provided adults with an alternative means to overcome the barriers of time and place in the quest to earn an undergraduate degree. Charter Oak State College is accredited by the New England Association of Schools and Colleges and by the State of Connecticut. Charter Oak is Connecticut’s virtual college and its students earn their associate or bachelor’s degrees by combining prior learning with the acquisition of new knowledge. This is accomplished by transferring credits from classroom instruction, distance learning courses, college-level achievement tests, portfolio assessment, college-level training courses offered by business and other organizations, and through individually developed learning contracts with faculty. The Charter Oak program is designed to help students achieve their goals with particular emphasis on gaining the skills and knowledge needed to enter or advance in the workforce. Charter Oak students enroll from across the state and the nation with approximately 56% of its students residing outside Connecticut. Activities: Workforce Readiness: Charter Oak State College assists adult students in completing their undergraduate education. Even though most of the COSC students are already gainfully employed while enrolled at COSC, we have evidence that earning their degree has allowed them to advance in their profession, change careers, or become employed full time. For others, it has helped them become employed. COSC’s degree programs require a minimum of 60 credits in the liberal arts, thus giving the graduate who pursues a concentration with a technical or professional focus, a well-rounded education. Career-related Programs: Charter Oak State College only offers a BA and a BS in general studies. However students are able to select concentrations in such areas as business administration, chemistry, computer science studies, criminal justice, engineering studies, fire science administration, etc. Charter Oak also prepares adults to enter the Alternative Route to Certification program, administers the Child Care Director’s Credential program, offers courses/tests for child care providers, offers the online LPN to RN bridge course for nurses who want to advance in their profession and, through a partnership with another agency offers a program in public safety administration. Adult students are able to build upon credit already earned and work experience to earn their degree by taking courses from COSC, other regionally accredited institutions, through testing, and through non-collegiate courses that have been recommended for credit. Continuing Education: In conjunction with the Connecticut league for Nursing, COSC offers non-credit online programs for nurses who want to return to the nursing profession and a program for nurses who want to specialize in home care nursing. With the Pharmacy Association, COSC offers an online non-credit program for pharmacists who want to return to the profession. COSC also offers a credit certificate in Health Studies that was designed for adults working in the health care field.
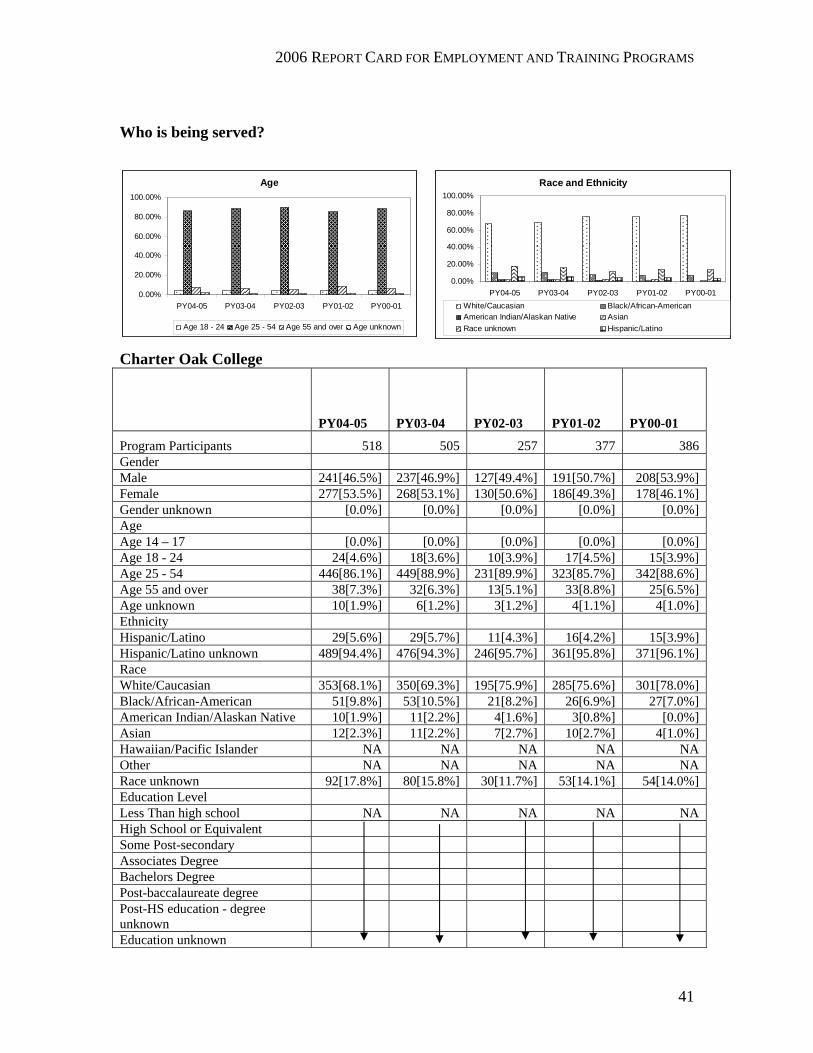
2006 REPORT CARD FOR EMPLOYMENT AND TRAINING PROGRAMS
41
Who is being served?
Race and Ethnicity
0.00%
20.00%
40.00%
60.00%
80.00%
100.00%
PY04-05 PY03-04 PY02-03 PY01-02 PY00-01White/Caucasian Black/African-AmericanAmerican Indian/Alaskan Native AsianRace unknown Hispanic/Latino
Charter Oak College
PY04-05 PY03-04 PY02-03 PY01-02 PY00-01
Program Participants 518 505 257 377 386 Gender Male 241[46.5%] 237[46.9%] 127[49.4%] 191[50.7%] 208[53.9%] Female 277[53.5%] 268[53.1%] 130[50.6%] 186[49.3%] 178[46.1%] Gender unknown [0.0%] [0.0%] [0.0%] [0.0%] [0.0%] Age Age 14 – 17 [0.0%] [0.0%] [0.0%] [0.0%] [0.0%] Age 18 - 24 24[4.6%] 18[3.6%] 10[3.9%] 17[4.5%] 15[3.9%] Age 25 - 54 446[86.1%] 449[88.9%] 231[89.9%] 323[85.7%] 342[88.6%] Age 55 and over 38[7.3%] 32[6.3%] 13[5.1%] 33[8.8%] 25[6.5%] Age unknown 10[1.9%] 6[1.2%] 3[1.2%] 4[1.1%] 4[1.0%] Ethnicity Hispanic/Latino 29[5.6%] 29[5.7%] 11[4.3%] 16[4.2%] 15[3.9%] Hispanic/Latino unknown 489[94.4%] 476[94.3%] 246[95.7%] 361[95.8%] 371[96.1%] Race White/Caucasian 353[68.1%] 350[69.3%] 195[75.9%] 285[75.6%] 301[78.0%] Black/African-American 51[9.8%] 53[10.5%] 21[8.2%] 26[6.9%] 27[7.0%] American Indian/Alaskan Native 10[1.9%] 11[2.2%] 4[1.6%] 3[0.8%] [0.0%] Asian 12[2.3%] 11[2.2%] 7[2.7%] 10[2.7%] 4[1.0%] Hawaiian/Pacific Islander NA NA NA NA NA Other NA NA NA NA NA Race unknown 92[17.8%] 80[15.8%] 30[11.7%] 53[14.1%] 54[14.0%] Education Level Less Than high school NA NA NA NA NA High School or Equivalent Some Post-secondary Associates Degree Bachelors Degree Post-baccalaureate degree Post-HS education - degree unknown
Education unknown
Age
0.00%
20.00%
40.00%
60.00%
80.00%
100.00%
PY04-05 PY03-04 PY02-03 PY01-02 PY00-01
Age 18 - 24 Age 25 - 54 Age 55 and over Age unknown

2006 REPORT CARD FOR EMPLOYMENT AND TRAINING PROGRAMS
42
What were the results? Charter Oak College
Results PY04-05 PY03-04 PY02-01 PY01-02 PY00-01 Total Program Exiters 518 505 227 377 386
Completed Training/Education
518[100.0%] 505[100.0%] 221[97.4%] 371[98.4%] 386[100.0%]
Entered Employment
* 225[44.6%] 91[41.2%] 203[54.7%] 213[55.2%]
Retained Employment for 6 months
* 208[92.4%] 87[95.6%] 184[90.6%] 198[93.0%]
Weekly Wages on Entering Employment
* $888.17 $900.77 $928.33 $923.85
Change in Weekly Wages from pre- to post-program services
* $302.65 $250.60 $359.43 $487.91
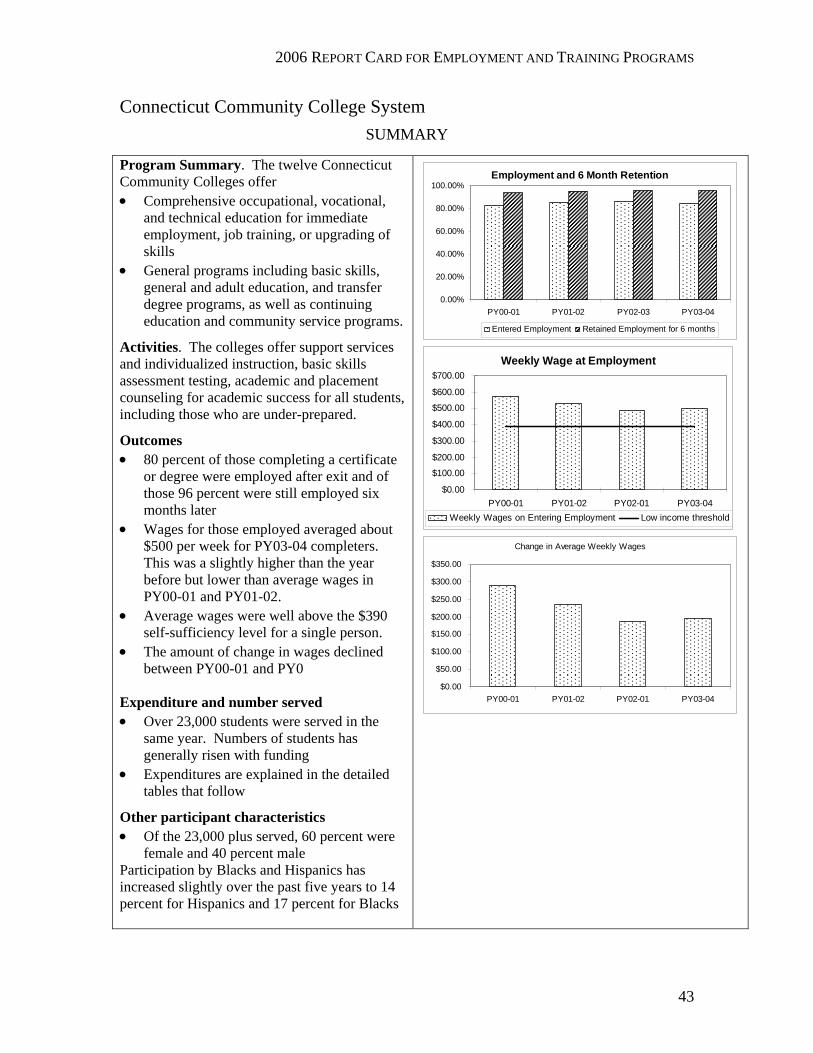
2006 REPORT CARD FOR EMPLOYMENT AND TRAINING PROGRAMS
43
Connecticut Community College System SUMMARY
Program Summary. The twelve Connecticut Community Colleges offer • Comprehensive occupational, vocational,
and technical education for immediate employment, job training, or upgrading of skills
• General programs including basic skills, general and adult education, and transfer degree programs, as well as continuing education and community service programs.
Activities. The colleges offer support services and individualized instruction, basic skills assessment testing, academic and placement counseling for academic success for all students, including those who are under-prepared.
Outcomes • 80 percent of those completing a certificate
or degree were employed after exit and of those 96 percent were still employed six months later
• Wages for those employed averaged about $500 per week for PY03-04 completers. This was a slightly higher than the year before but lower than average wages in PY00-01 and PY01-02.
• Average wages were well above the $390 self-sufficiency level for a single person.
• The amount of change in wages declined between PY00-01 and PY0
Expenditure and number served • Over 23,000 students were served in the
same year. Numbers of students has generally risen with funding
• Expenditures are explained in the detailed tables that follow
Other participant characteristics • Of the 23,000 plus served, 60 percent were
female and 40 percent male Participation by Blacks and Hispanics has increased slightly over the past five years to 14 percent for Hispanics and 17 percent for Blacks
Employment and 6 Month Retention
0.00%
20.00%
40.00%
60.00%
80.00%
100.00%
PY00-01 PY01-02 PY02-03 PY03-04
Entered Employment Retained Employment for 6 months
Weekly Wage at Employment
$0.00
$100.00
$200.00
$300.00
$400.00
$500.00
$600.00
$700.00
PY00-01 PY01-02 PY02-01 PY03-04Weekly Wages on Entering Employment Low income threshold
Change in Average Weekly Wages
$0.00
$50.00
$100.00
$150.00
$200.00
$250.00
$300.00
$350.00
PY00-01 PY01-02 PY02-01 PY03-04
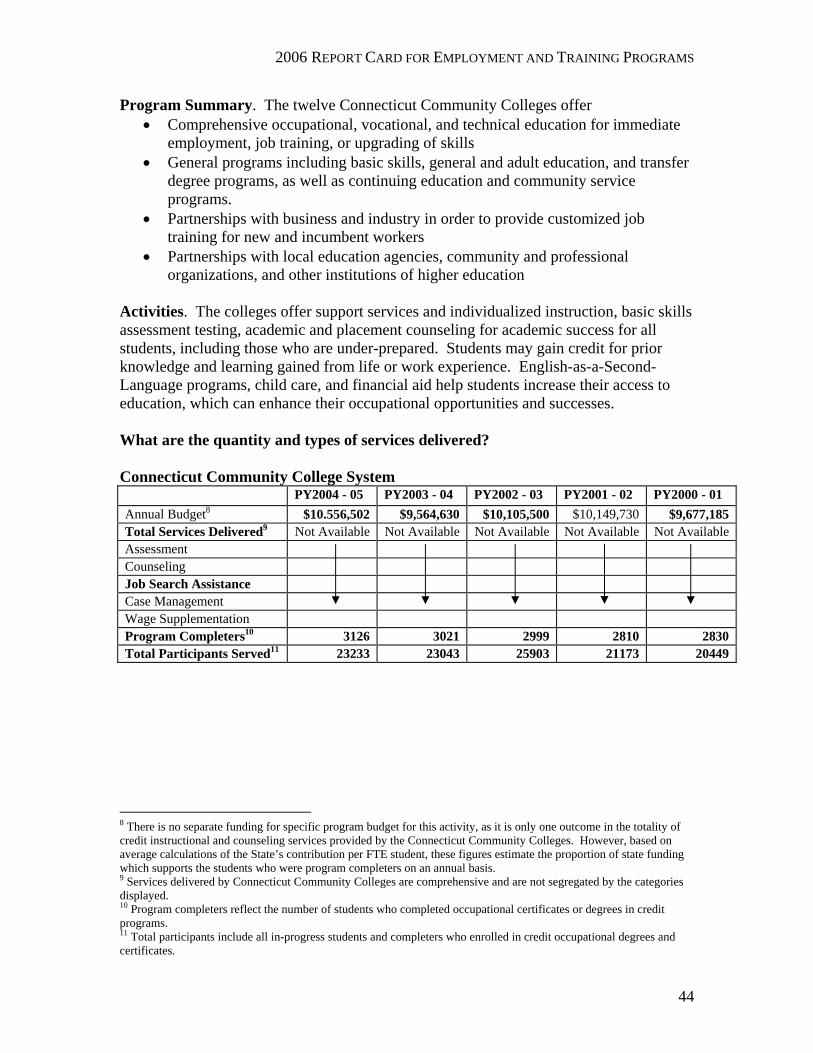
2006 REPORT CARD FOR EMPLOYMENT AND TRAINING PROGRAMS
44
Program Summary. The twelve Connecticut Community Colleges offer • Comprehensive occupational, vocational, and technical education for immediate
employment, job training, or upgrading of skills • General programs including basic skills, general and adult education, and transfer
degree programs, as well as continuing education and community service programs.
• Partnerships with business and industry in order to provide customized job training for new and incumbent workers
• Partnerships with local education agencies, community and professional organizations, and other institutions of higher education
Activities. The colleges offer support services and individualized instruction, basic skills assessment testing, academic and placement counseling for academic success for all students, including those who are under-prepared. Students may gain credit for prior knowledge and learning gained from life or work experience. English-as-a-Second-Language programs, child care, and financial aid help students increase their access to education, which can enhance their occupational opportunities and successes. What are the quantity and types of services delivered? Connecticut Community College System
PY2004 - 05 PY2003 - 04 PY2002 - 03 PY2001 - 02 PY2000 - 01 Annual Budget8 $10.556,502 $9,564,630 $10,105,500 $10,149,730 $9,677,185 Total Services Delivered9 Not Available Not Available Not Available Not Available Not Available Assessment Counseling Job Search Assistance Case Management Wage Supplementation Program Completers10 3126 3021 2999 2810 2830 Total Participants Served11 23233 23043 25903 21173 20449
8 There is no separate funding for specific program budget for this activity, as it is only one outcome in the totality of credit instructional and counseling services provided by the Connecticut Community Colleges. However, based on average calculations of the State’s contribution per FTE student, these figures estimate the proportion of state funding which supports the students who were program completers on an annual basis. 9 Services delivered by Connecticut Community Colleges are comprehensive and are not segregated by the categories displayed. 10 Program completers reflect the number of students who completed occupational certificates or degrees in credit programs. 11 Total participants include all in-progress students and completers who enrolled in credit occupational degrees and certificates.
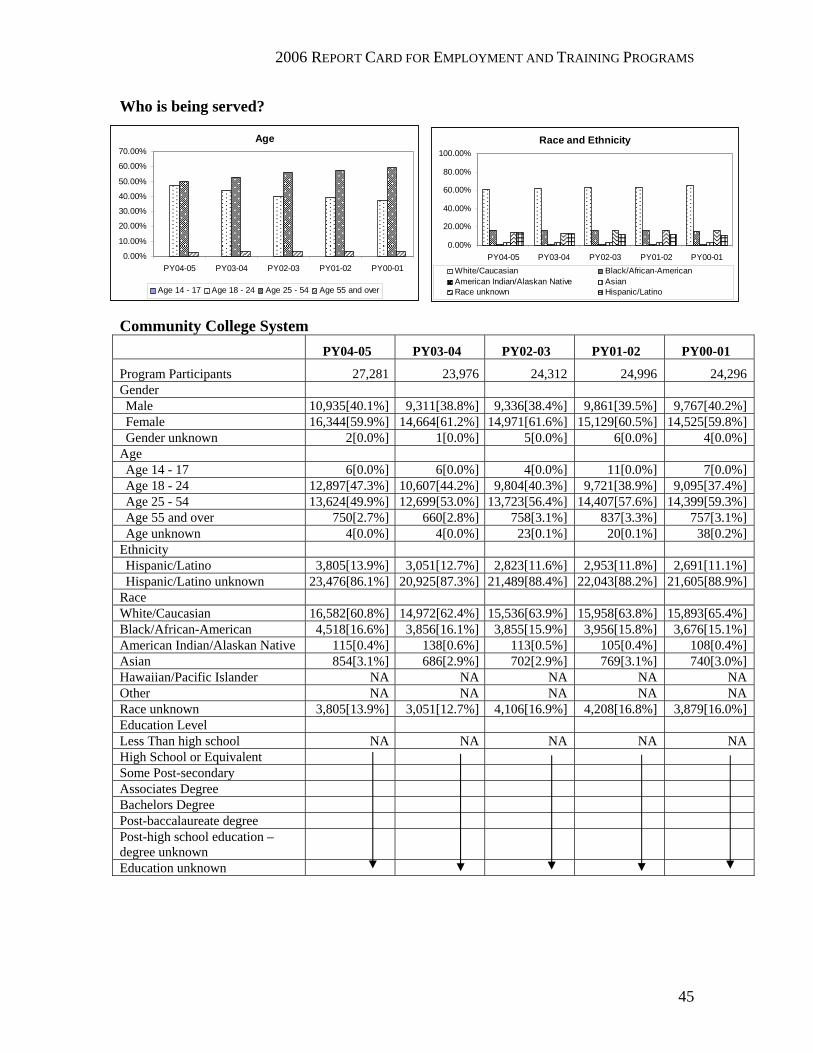
2006 REPORT CARD FOR EMPLOYMENT AND TRAINING PROGRAMS
45
Who is being served?
Community College System PY04-05 PY03-04 PY02-03 PY01-02 PY00-01
Program Participants 27,281 23,976 24,312 24,996 24,296 Gender Male 10,935[40.1%] 9,311[38.8%] 9,336[38.4%] 9,861[39.5%] 9,767[40.2%] Female 16,344[59.9%] 14,664[61.2%] 14,971[61.6%] 15,129[60.5%] 14,525[59.8%] Gender unknown 2[0.0%] 1[0.0%] 5[0.0%] 6[0.0%] 4[0.0%]
Age Age 14 - 17 6[0.0%] 6[0.0%] 4[0.0%] 11[0.0%] 7[0.0%] Age 18 - 24 12,897[47.3%] 10,607[44.2%] 9,804[40.3%] 9,721[38.9%] 9,095[37.4%] Age 25 - 54 13,624[49.9%] 12,699[53.0%] 13,723[56.4%] 14,407[57.6%] 14,399[59.3%] Age 55 and over 750[2.7%] 660[2.8%] 758[3.1%] 837[3.3%] 757[3.1%] Age unknown 4[0.0%] 4[0.0%] 23[0.1%] 20[0.1%] 38[0.2%]
Ethnicity Hispanic/Latino 3,805[13.9%] 3,051[12.7%] 2,823[11.6%] 2,953[11.8%] 2,691[11.1%] Hispanic/Latino unknown 23,476[86.1%] 20,925[87.3%] 21,489[88.4%] 22,043[88.2%] 21,605[88.9%]
Race White/Caucasian 16,582[60.8%] 14,972[62.4%] 15,536[63.9%] 15,958[63.8%] 15,893[65.4%] Black/African-American 4,518[16.6%] 3,856[16.1%] 3,855[15.9%] 3,956[15.8%] 3,676[15.1%] American Indian/Alaskan Native 115[0.4%] 138[0.6%] 113[0.5%] 105[0.4%] 108[0.4%] Asian 854[3.1%] 686[2.9%] 702[2.9%] 769[3.1%] 740[3.0%] Hawaiian/Pacific Islander NA NA NA NA NA Other NA NA NA NA NA Race unknown 3,805[13.9%] 3,051[12.7%] 4,106[16.9%] 4,208[16.8%] 3,879[16.0%] Education Level Less Than high school NA NA NA NA NA High School or Equivalent Some Post-secondary Associates Degree Bachelors Degree Post-baccalaureate degree Post-high school education – degree unknown
Education unknown
Age
0.00%
10.00%
20.00%
30.00%
40.00%
50.00%
60.00%
70.00%
PY04-05 PY03-04 PY02-03 PY01-02 PY00-01
Age 14 - 17 Age 18 - 24 Age 25 - 54 Age 55 and over
Race and Ethnicity
0.00%
20.00%
40.00%
60.00%
80.00%
100.00%
PY04-05 PY03-04 PY02-03 PY01-02 PY00-01White/Caucasian Black/African-AmericanAmerican Indian/Alaskan Native Asian Race unknown Hispanic/Latino
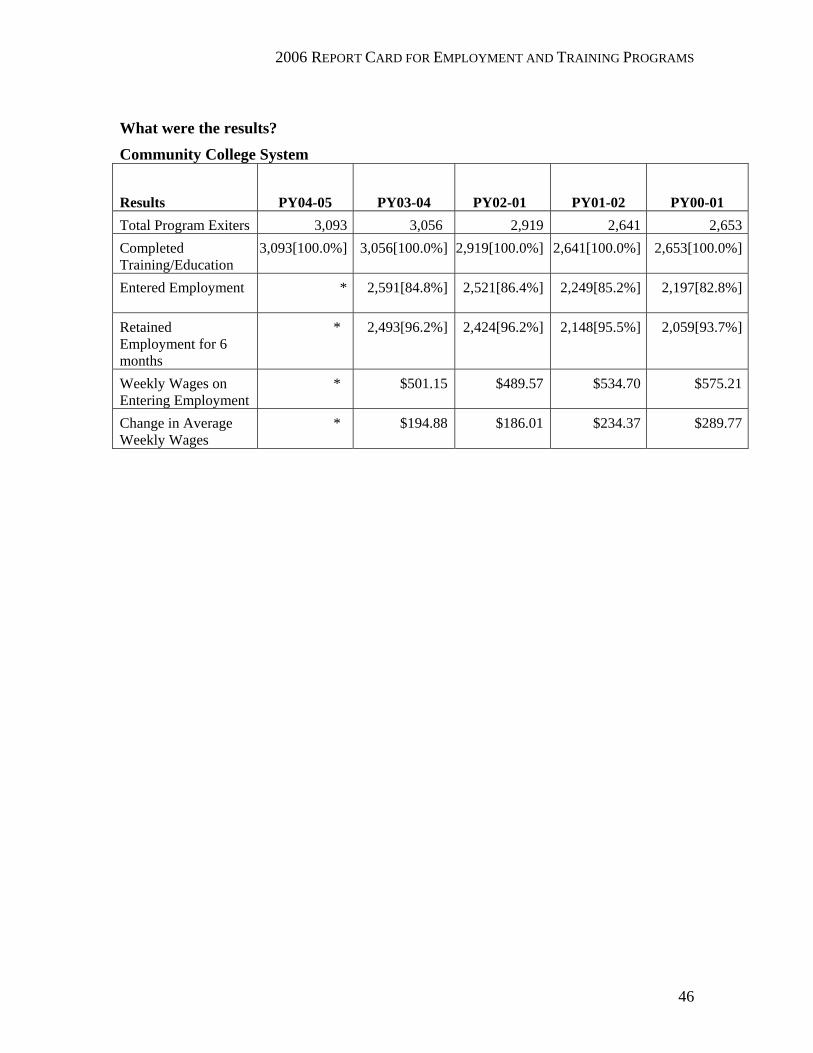
2006 REPORT CARD FOR EMPLOYMENT AND TRAINING PROGRAMS
46
What were the results?
Community College System
Results PY04-05 PY03-04 PY02-01 PY01-02 PY00-01 Total Program Exiters 3,093 3,056 2,919 2,641 2,653Completed Training/Education
3,093[100.0%] 3,056[100.0%] 2,919[100.0%] 2,641[100.0%] 2,653[100.0%]
Entered Employment
* 2,591[84.8%] 2,521[86.4%] 2,249[85.2%] 2,197[82.8%]
Retained Employment for 6 months
* 2,493[96.2%] 2,424[96.2%] 2,148[95.5%] 2,059[93.7%]
Weekly Wages on Entering Employment
* $501.15 $489.57 $534.70 $575.21
Change in Average Weekly Wages
* $194.88 $186.01 $234.37 $289.77
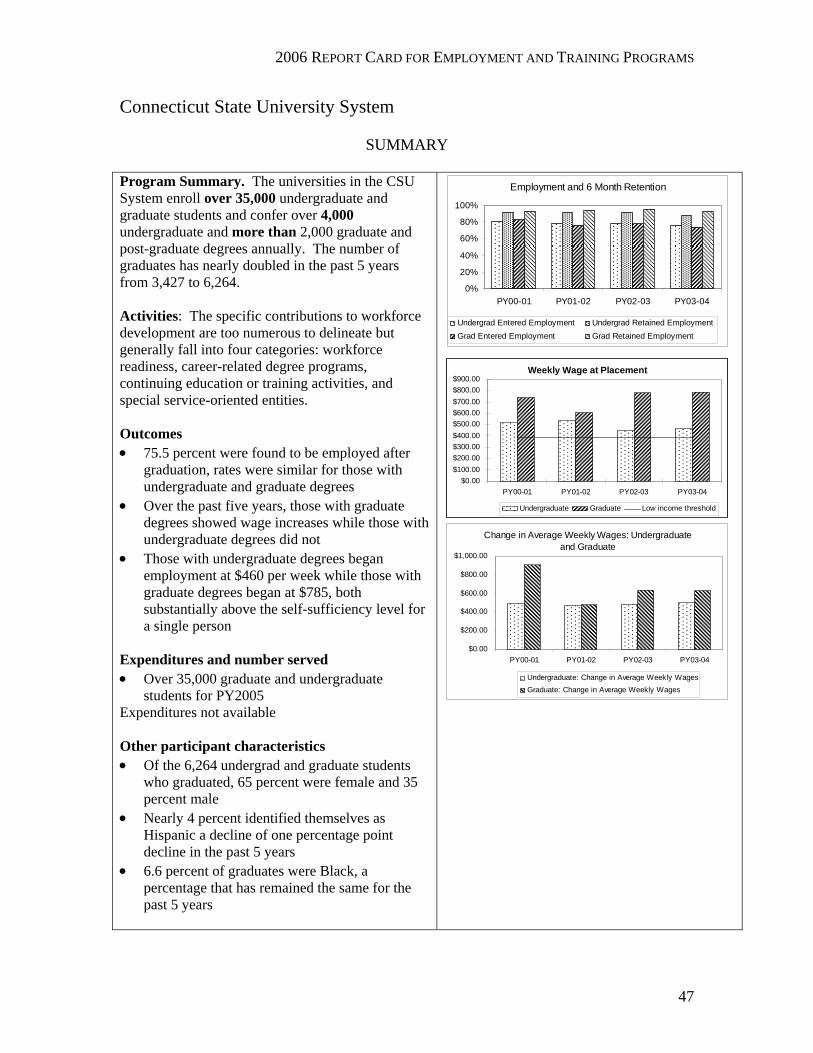
2006 REPORT CARD FOR EMPLOYMENT AND TRAINING PROGRAMS
47
Connecticut State University System
SUMMARY Program Summary. The universities in the CSU System enroll over 35,000 undergraduate and graduate students and confer over 4,000 undergraduate and more than 2,000 graduate and post-graduate degrees annually. The number of graduates has nearly doubled in the past 5 years from 3,427 to 6,264. Activities: The specific contributions to workforce development are too numerous to delineate but generally fall into four categories: workforce readiness, career-related degree programs, continuing education or training activities, and special service-oriented entities. Outcomes • 75.5 percent were found to be employed after
graduation, rates were similar for those with undergraduate and graduate degrees
• Over the past five years, those with graduate degrees showed wage increases while those with undergraduate degrees did not
• Those with undergraduate degrees began employment at $460 per week while those with graduate degrees began at $785, both substantially above the self-sufficiency level for a single person
Expenditures and number served • Over 35,000 graduate and undergraduate
students for PY2005 Expenditures not available Other participant characteristics • Of the 6,264 undergrad and graduate students
who graduated, 65 percent were female and 35 percent male
• Nearly 4 percent identified themselves as Hispanic a decline of one percentage point decline in the past 5 years
• 6.6 percent of graduates were Black, a percentage that has remained the same for the past 5 years
Employment and 6 Month Retention
0%
20%
40%
60%
80%
100%
PY00-01 PY01-02 PY02-03 PY03-04
Undergrad Entered Employment Undergrad Retained Employment Grad Entered Employment Grad Retained Employment
Weekly Wage at Placement
$0.00$100.00$200.00$300.00$400.00$500.00$600.00$700.00$800.00$900.00
PY00-01 PY01-02 PY02-03 PY03-04
Undergraduate Graduate Low income threshold
Change in Average Weekly Wages: Undergraduate and Graduate
$0.00
$200.00
$400.00
$600.00
$800.00
$1,000.00
PY00-01 PY01-02 PY02-03 PY03-04
Undergraduate: Change in Average Weekly WagesGraduate: Change in Average Weekly Wages
2006 REPORT CARD FOR EMPLOYMENT AND TRAINING PROGRAMS
48
Program Summary. The universities in the CSU System enroll over 35,000 undergraduate and graduate students and confer over 4,000 undergraduate and more than 2,000 graduate and post-graduate degrees annually. CSU institutions make a profound commitment to the development, maintenance, enhancement and expansion of Connecticut's workforce. The specific contributions are too numerous to delineate but generally fall into four categories: workforce readiness, career-related degree programs, continuing education or training activities, and special service-oriented entities. Activities: Workforce Readiness. A CSU education enriches the lives of its students and strengthens the communities in which these students live or will live through high-quality programs in which students are exposed to the human experience as reflected in science, history, literature and the arts. A CSU education also contributes directly to workforce development. Through the standards of excellence CSU demands of its students, the readiness of Connecticut's workforce is enhanced significantly.
Career-Related Degree Programs. All CSU students are ready to enter or continue in the workforce upon graduation; increasingly, CSU graduates have completed professional programs that also aim at enhancing career access. Historically, CSU has been heavily involved in K-12 teacher preparation programs, providing almost half of Connecticut’s certified teachers. CSU institutions also offer a number of additional professional, applied programs, especially in the College of Technology at CCSU. Programs are offered at both the baccalaureate and graduate levels. CSU institutions have constantly sought and attained approval to offer new programs or to modify programs with specializations that are directly related to work force needs. In 2001, the universities in the CSU system were authorized to confer the Doctor of Education degree. Central, Southern and Western have distinctive education programs leading to this degree. Continuing Education/Training Activities. CSU evidences increasing activity in offerings that are for non-credit and/or training purposes. All four universities have increased emphases in this area. Consideration is underway for the development of credit bearing, certificate programs.
Special Service-Oriented Entities. All four CSU institutions are active community players and provide services to a variety of community organizations via formal relationships as well as the individual, voluntary actions by students, staff and faculty. Several centers or institutes have been established that will impact workforce issues. CCSU has established the Hospitality and Tourism Institute; the Henry C. Lee Institute for the Study of Crime and Justice; the Institute for Municipal and Regional Policy, and the Biotechnology Institute; ECSU has established a Center for Sustainable Energy Studies and a Sustainable Energy Institute to enable the university to focus research and other resources to assist energy companies in the State; SCSU has established the Business Resource Center on the Center for Community and School Action Research; WCSU has established the Center for Graphics Research and the Center for Financial Forensics and Information Security.
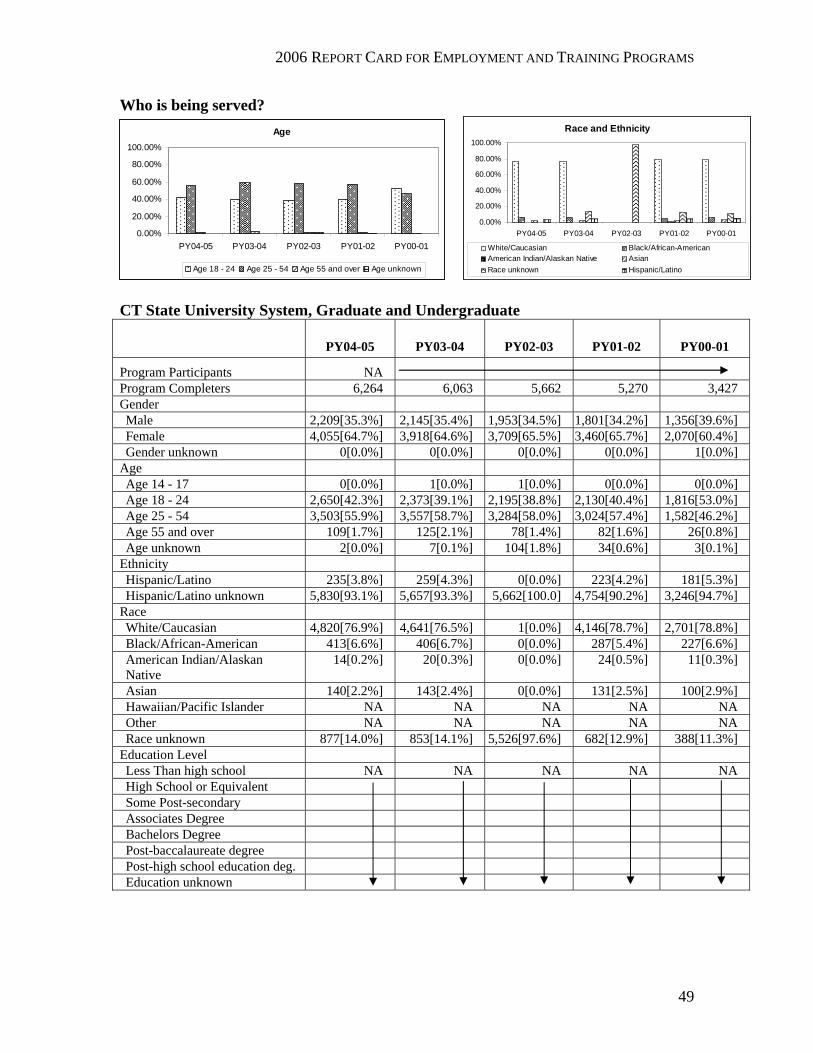
2006 REPORT CARD FOR EMPLOYMENT AND TRAINING PROGRAMS
49
Who is being served? Race and Ethnicity
0.00%
20.00%
40.00%
60.00%
80.00%
100.00%
PY04-05 PY03-04 PY02-03 PY01-02 PY00-01
White/Caucasian Black/African-AmericanAmerican Indian/Alaskan Native AsianRace unknown Hispanic/Latino
CT State University System, Graduate and Undergraduate
PY04-05 PY03-04 PY02-03 PY01-02 PY00-01
Program Participants NA Program Completers 6,264 6,063 5,662 5,270 3,427 Gender Male 2,209[35.3%] 2,145[35.4%] 1,953[34.5%] 1,801[34.2%] 1,356[39.6%] Female 4,055[64.7%] 3,918[64.6%] 3,709[65.5%] 3,460[65.7%] 2,070[60.4%] Gender unknown 0[0.0%] 0[0.0%] 0[0.0%] 0[0.0%] 1[0.0%]
Age Age 14 - 17 0[0.0%] 1[0.0%] 1[0.0%] 0[0.0%] 0[0.0%] Age 18 - 24 2,650[42.3%] 2,373[39.1%] 2,195[38.8%] 2,130[40.4%] 1,816[53.0%] Age 25 - 54 3,503[55.9%] 3,557[58.7%] 3,284[58.0%] 3,024[57.4%] 1,582[46.2%] Age 55 and over 109[1.7%] 125[2.1%] 78[1.4%] 82[1.6%] 26[0.8%] Age unknown 2[0.0%] 7[0.1%] 104[1.8%] 34[0.6%] 3[0.1%]
Ethnicity Hispanic/Latino 235[3.8%] 259[4.3%] 0[0.0%] 223[4.2%] 181[5.3%] Hispanic/Latino unknown 5,830[93.1%] 5,657[93.3%] 5,662[100.0] 4,754[90.2%] 3,246[94.7%]
Race White/Caucasian 4,820[76.9%] 4,641[76.5%] 1[0.0%] 4,146[78.7%] 2,701[78.8%] Black/African-American 413[6.6%] 406[6.7%] 0[0.0%] 287[5.4%] 227[6.6%] American Indian/Alaskan Native
14[0.2%] 20[0.3%] 0[0.0%] 24[0.5%] 11[0.3%]
Asian 140[2.2%] 143[2.4%] 0[0.0%] 131[2.5%] 100[2.9%] Hawaiian/Pacific Islander NA NA NA NA NA Other NA NA NA NA NA Race unknown 877[14.0%] 853[14.1%] 5,526[97.6%] 682[12.9%] 388[11.3%]
Education Level Less Than high school NA NA NA NA NA High School or Equivalent Some Post-secondary Associates Degree Bachelors Degree Post-baccalaureate degree Post-high school education deg. Education unknown
Age
0.00%
20.00%
40.00%
60.00%
80.00%
100.00%
PY04-05 PY03-04 PY02-03 PY01-02 PY00-01
Age 18 - 24 Age 25 - 54 Age 55 and over Age unknown
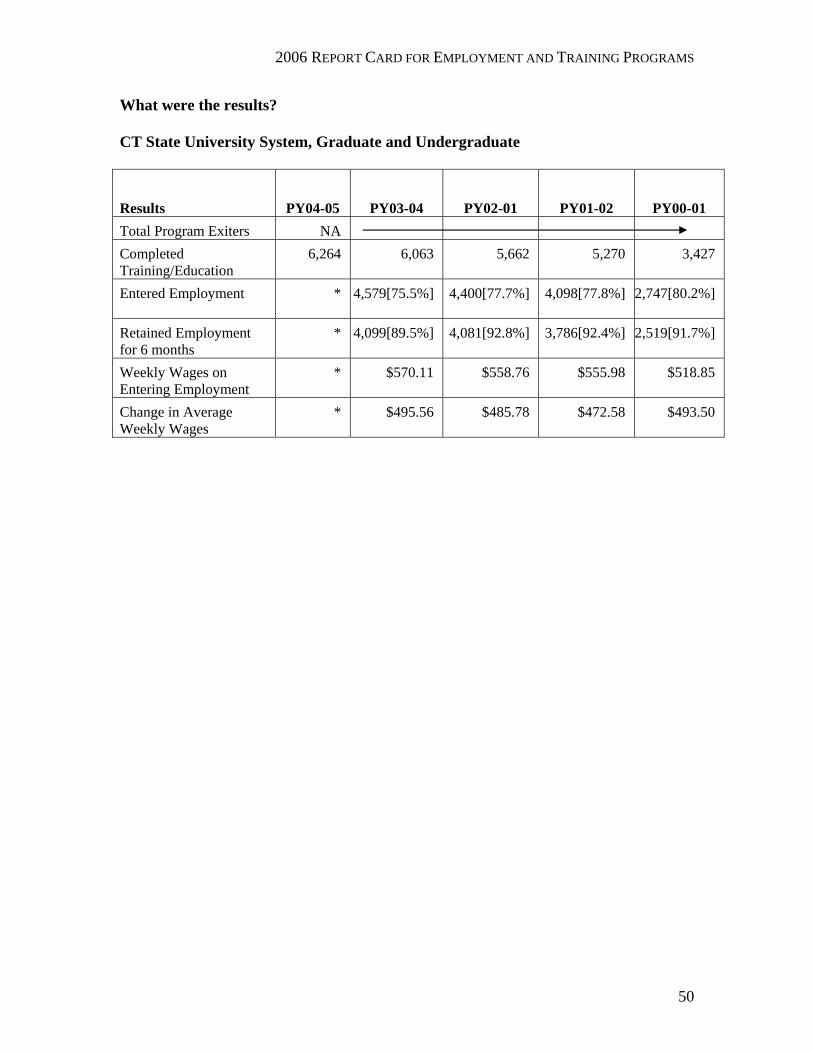
2006 REPORT CARD FOR EMPLOYMENT AND TRAINING PROGRAMS
50
What were the results? CT State University System, Graduate and Undergraduate
Results PY04-05 PY03-04 PY02-01 PY01-02 PY00-01 Total Program Exiters NA Completed Training/Education
6,264 6,063 5,662 5,270 3,427
Entered Employment
* 4,579[75.5%] 4,400[77.7%] 4,098[77.8%] 2,747[80.2%]
Retained Employment for 6 months
* 4,099[89.5%] 4,081[92.8%] 3,786[92.4%] 2,519[91.7%]
Weekly Wages on Entering Employment
* $570.11 $558.76 $555.98 $518.85
Change in Average Weekly Wages
* $495.56 $485.78 $472.58 $493.50
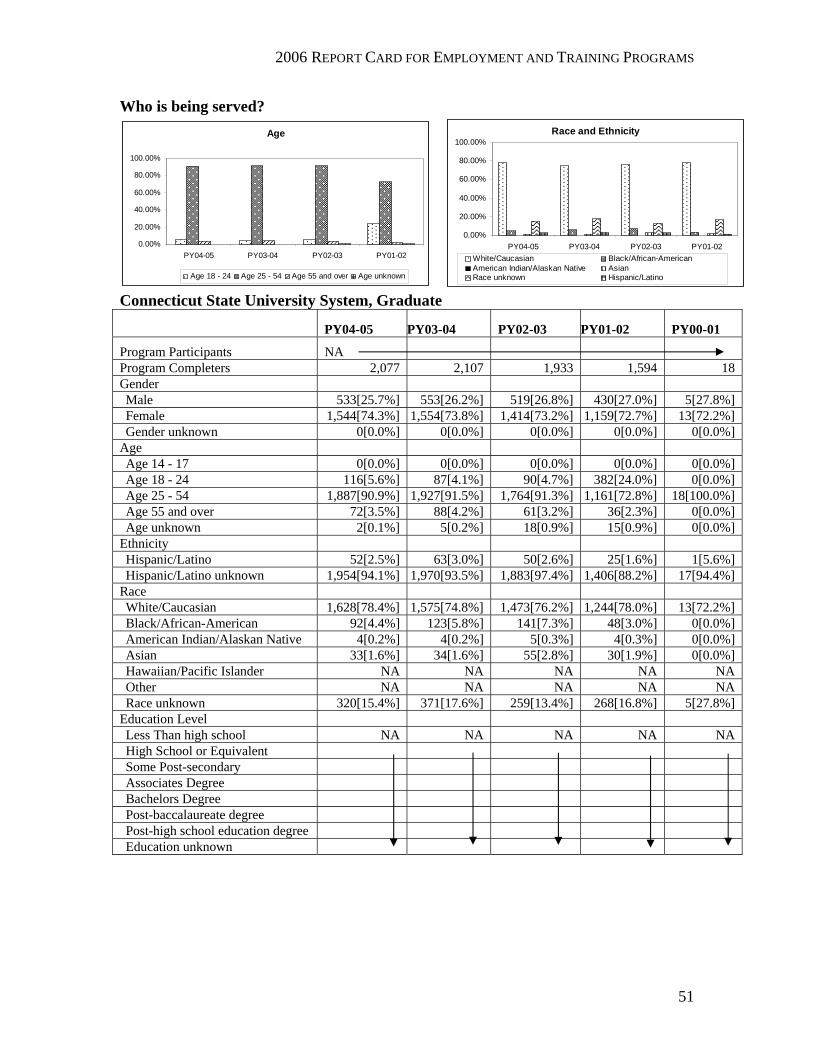
2006 REPORT CARD FOR EMPLOYMENT AND TRAINING PROGRAMS
51
Who is being served? Race and Ethnicity
0.00%
20.00%
40.00%
60.00%
80.00%
100.00%
PY04-05 PY03-04 PY02-03 PY01-02White/Caucasian Black/African-AmericanAmerican Indian/Alaskan Native AsianRace unknown Hispanic/Latino
Connecticut State University System, Graduate
PY04-05 PY03-04 PY02-03 PY01-02 PY00-01
Program Participants NA Program Completers 2,077 2,107 1,933 1,594 18 Gender Male 533[25.7%] 553[26.2%] 519[26.8%] 430[27.0%] 5[27.8%] Female 1,544[74.3%] 1,554[73.8%] 1,414[73.2%] 1,159[72.7%] 13[72.2%] Gender unknown 0[0.0%] 0[0.0%] 0[0.0%] 0[0.0%] 0[0.0%]
Age Age 14 - 17 0[0.0%] 0[0.0%] 0[0.0%] 0[0.0%] 0[0.0%] Age 18 - 24 116[5.6%] 87[4.1%] 90[4.7%] 382[24.0%] 0[0.0%] Age 25 - 54 1,887[90.9%] 1,927[91.5%] 1,764[91.3%] 1,161[72.8%] 18[100.0%] Age 55 and over 72[3.5%] 88[4.2%] 61[3.2%] 36[2.3%] 0[0.0%] Age unknown 2[0.1%] 5[0.2%] 18[0.9%] 15[0.9%] 0[0.0%]
Ethnicity Hispanic/Latino 52[2.5%] 63[3.0%] 50[2.6%] 25[1.6%] 1[5.6%] Hispanic/Latino unknown 1,954[94.1%] 1,970[93.5%] 1,883[97.4%] 1,406[88.2%] 17[94.4%]
Race White/Caucasian 1,628[78.4%] 1,575[74.8%] 1,473[76.2%] 1,244[78.0%] 13[72.2%] Black/African-American 92[4.4%] 123[5.8%] 141[7.3%] 48[3.0%] 0[0.0%] American Indian/Alaskan Native 4[0.2%] 4[0.2%] 5[0.3%] 4[0.3%] 0[0.0%] Asian 33[1.6%] 34[1.6%] 55[2.8%] 30[1.9%] 0[0.0%] Hawaiian/Pacific Islander NA NA NA NA NA Other NA NA NA NA NA Race unknown 320[15.4%] 371[17.6%] 259[13.4%] 268[16.8%] 5[27.8%]
Education Level Less Than high school NA NA NA NA NA High School or Equivalent Some Post-secondary Associates Degree Bachelors Degree Post-baccalaureate degree Post-high school education degree Education unknown
Age
0.00%
20.00%
40.00%
60.00%
80.00%
100.00%
PY04-05 PY03-04 PY02-03 PY01-02
Age 18 - 24 Age 25 - 54 Age 55 and over Age unknown
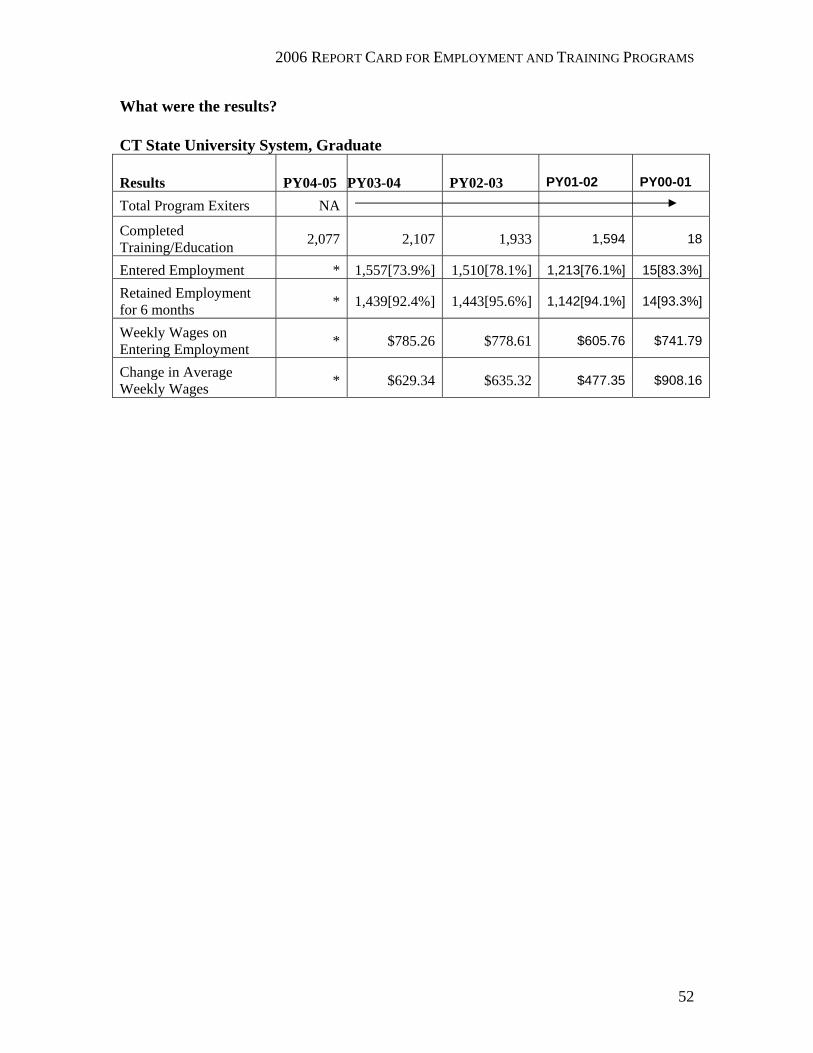
2006 REPORT CARD FOR EMPLOYMENT AND TRAINING PROGRAMS
52
What were the results? CT State University System, Graduate
Results PY04-05 PY03-04 PY02-03 PY01-02 PY00-01 Total Program Exiters NA Completed Training/Education 2,077 2,107 1,933 1,594 18
Entered Employment * 1,557[73.9%] 1,510[78.1%] 1,213[76.1%] 15[83.3%]
Retained Employment for 6 months * 1,439[92.4%] 1,443[95.6%] 1,142[94.1%] 14[93.3%]
Weekly Wages on Entering Employment * $785.26 $778.61 $605.76 $741.79
Change in Average Weekly Wages * $629.34 $635.32 $477.35 $908.16
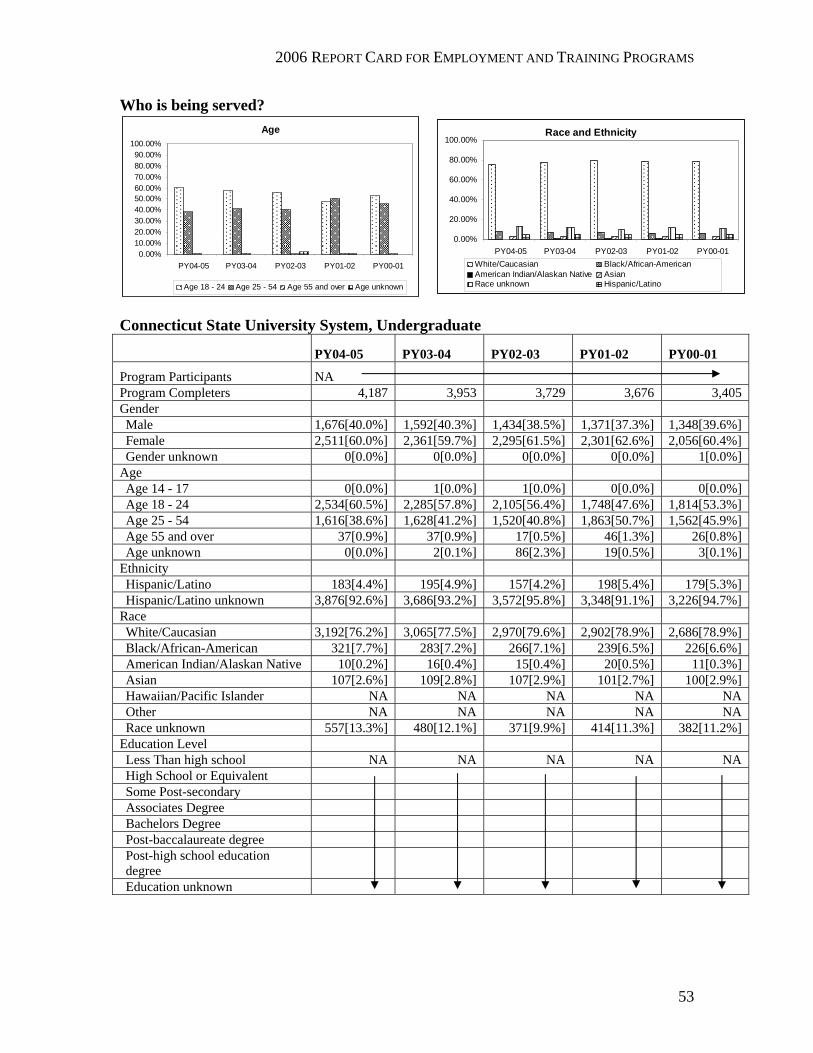
2006 REPORT CARD FOR EMPLOYMENT AND TRAINING PROGRAMS
53
Who is being served?
Connecticut State University System, Undergraduate
PY04-05 PY03-04 PY02-03 PY01-02 PY00-01
Program Participants NA Program Completers 4,187 3,953 3,729 3,676 3,405 Gender Male 1,676[40.0%] 1,592[40.3%] 1,434[38.5%] 1,371[37.3%] 1,348[39.6%] Female 2,511[60.0%] 2,361[59.7%] 2,295[61.5%] 2,301[62.6%] 2,056[60.4%] Gender unknown 0[0.0%] 0[0.0%] 0[0.0%] 0[0.0%] 1[0.0%]
Age Age 14 - 17 0[0.0%] 1[0.0%] 1[0.0%] 0[0.0%] 0[0.0%] Age 18 - 24 2,534[60.5%] 2,285[57.8%] 2,105[56.4%] 1,748[47.6%] 1,814[53.3%] Age 25 - 54 1,616[38.6%] 1,628[41.2%] 1,520[40.8%] 1,863[50.7%] 1,562[45.9%] Age 55 and over 37[0.9%] 37[0.9%] 17[0.5%] 46[1.3%] 26[0.8%] Age unknown 0[0.0%] 2[0.1%] 86[2.3%] 19[0.5%] 3[0.1%]
Ethnicity Hispanic/Latino 183[4.4%] 195[4.9%] 157[4.2%] 198[5.4%] 179[5.3%] Hispanic/Latino unknown 3,876[92.6%] 3,686[93.2%] 3,572[95.8%] 3,348[91.1%] 3,226[94.7%]
Race White/Caucasian 3,192[76.2%] 3,065[77.5%] 2,970[79.6%] 2,902[78.9%] 2,686[78.9%] Black/African-American 321[7.7%] 283[7.2%] 266[7.1%] 239[6.5%] 226[6.6%] American Indian/Alaskan Native 10[0.2%] 16[0.4%] 15[0.4%] 20[0.5%] 11[0.3%] Asian 107[2.6%] 109[2.8%] 107[2.9%] 101[2.7%] 100[2.9%] Hawaiian/Pacific Islander NA NA NA NA NA Other NA NA NA NA NA Race unknown 557[13.3%] 480[12.1%] 371[9.9%] 414[11.3%] 382[11.2%]
Education Level Less Than high school NA NA NA NA NA High School or Equivalent Some Post-secondary Associates Degree Bachelors Degree Post-baccalaureate degree Post-high school education degree
Education unknown
Age
0.00%10.00%20.00%30.00%40.00%50.00%60.00%70.00%80.00%90.00%
100.00%
PY04-05 PY03-04 PY02-03 PY01-02 PY00-01
Age 18 - 24 Age 25 - 54 Age 55 and over Age unknown
Race and Ethnicity
0.00%
20.00%
40.00%
60.00%
80.00%
100.00%
PY04-05 PY03-04 PY02-03 PY01-02 PY00-01White/Caucasian Black/African-AmericanAmerican Indian/Alaskan Native AsianRace unknown Hispanic/Latino
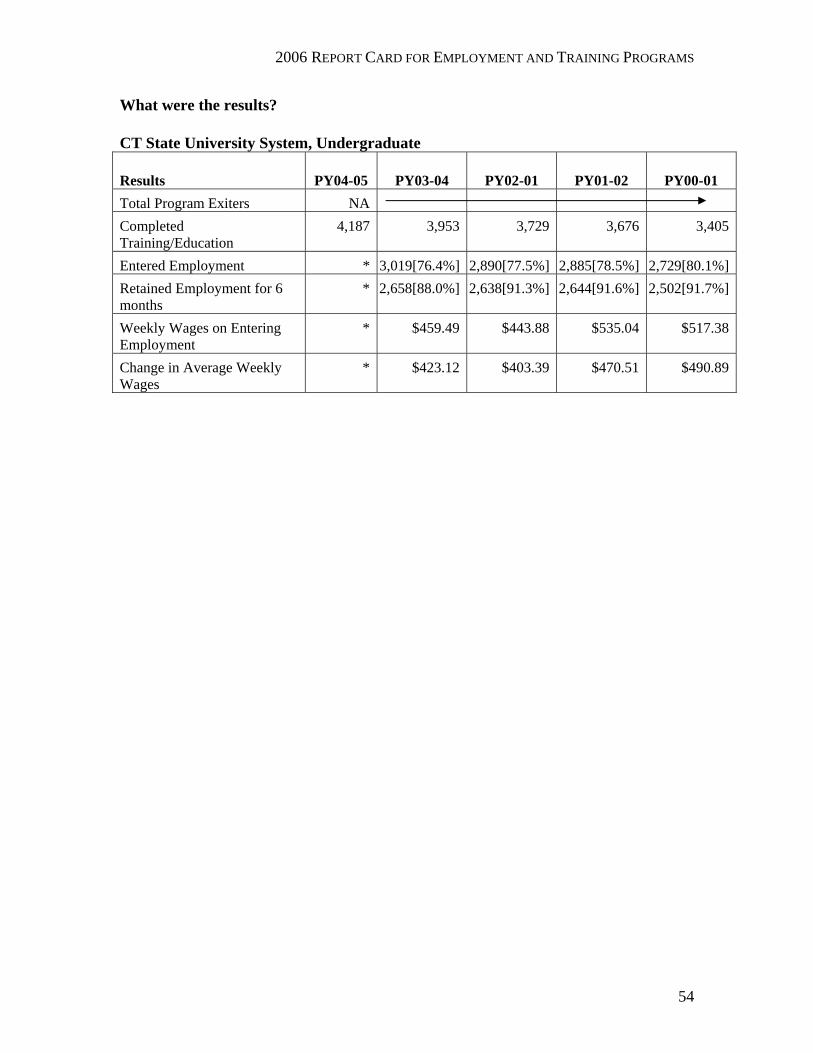
2006 REPORT CARD FOR EMPLOYMENT AND TRAINING PROGRAMS
54
What were the results? CT State University System, Undergraduate
Results PY04-05 PY03-04 PY02-01 PY01-02 PY00-01 Total Program Exiters NA Completed Training/Education
4,187 3,953 3,729 3,676 3,405
Entered Employment * 3,019[76.4%] 2,890[77.5%] 2,885[78.5%] 2,729[80.1%]Retained Employment for 6 months
* 2,658[88.0%] 2,638[91.3%] 2,644[91.6%] 2,502[91.7%]
Weekly Wages on Entering Employment
* $459.49 $443.88 $535.04 $517.38
Change in Average Weekly Wages
* $423.12 $403.39 $470.51 $490.89
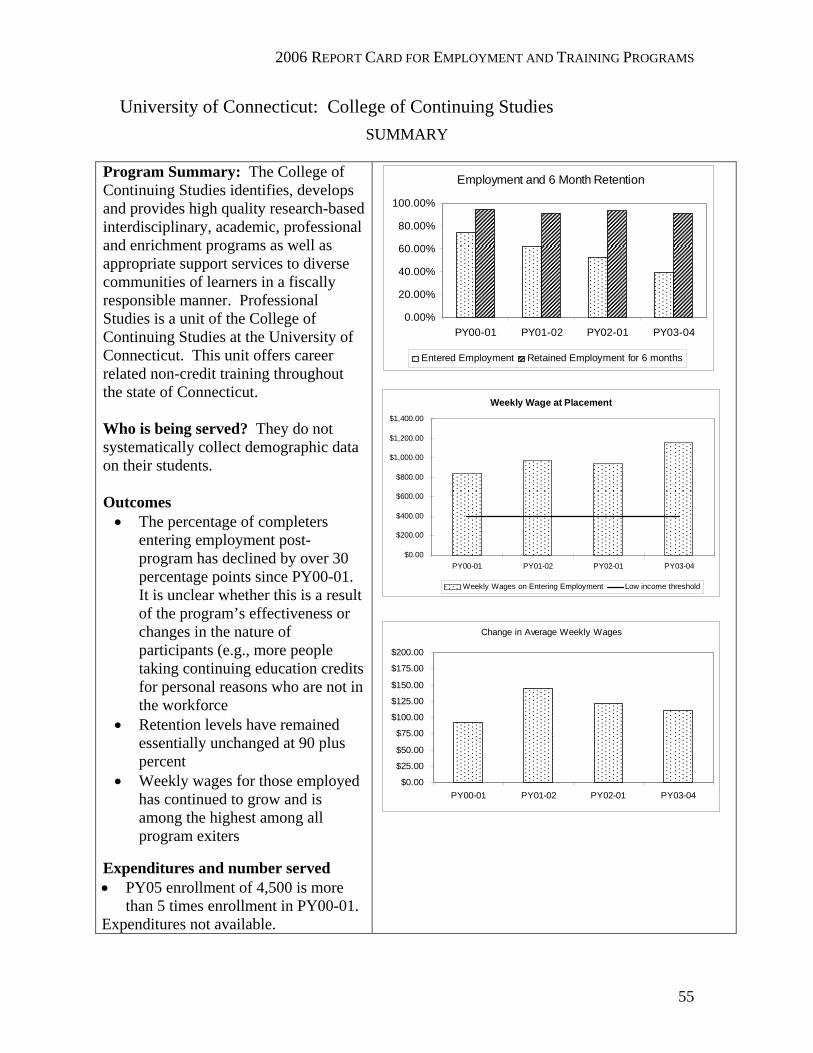
2006 REPORT CARD FOR EMPLOYMENT AND TRAINING PROGRAMS
55
University of Connecticut: College of Continuing Studies SUMMARY
Program Summary: The College of Continuing Studies identifies, develops and provides high quality research-based interdisciplinary, academic, professional and enrichment programs as well as appropriate support services to diverse communities of learners in a fiscally responsible manner. Professional Studies is a unit of the College of Continuing Studies at the University of Connecticut. This unit offers career related non-credit training throughout the state of Connecticut. Who is being served? They do not systematically collect demographic data on their students. Outcomes • The percentage of completers
entering employment post-program has declined by over 30 percentage points since PY00-01. It is unclear whether this is a result of the program’s effectiveness or changes in the nature of participants (e.g., more people taking continuing education credits for personal reasons who are not in the workforce
• Retention levels have remained essentially unchanged at 90 plus percent
• Weekly wages for those employed has continued to grow and is among the highest among all program exiters
Expenditures and number served • PY05 enrollment of 4,500 is more
than 5 times enrollment in PY00-01. Expenditures not available.
Employment and 6 Month Retention
0.00%
20.00%
40.00%
60.00%
80.00%
100.00%
PY00-01 PY01-02 PY02-01 PY03-04
Entered Employment Retained Employment for 6 months
Weekly Wage at Placement
$0.00
$200.00
$400.00
$600.00
$800.00
$1,000.00
$1,200.00
$1,400.00
PY00-01 PY01-02 PY02-01 PY03-04
Weekly Wages on Entering Employment Low income threshold
Change in Average Weekly Wages
$0.00
$25.00
$50.00
$75.00
$100.00
$125.00
$150.00
$175.00
$200.00
PY00-01 PY01-02 PY02-01 PY03-04
2006 REPORT CARD FOR EMPLOYMENT AND TRAINING PROGRAMS
56
There are three areas of study presented separately in this report: Continuing Studies, Undergraduate, and Graduate studies.
The College of Continuing Studies The College of Continuing Studies identifies, develops and provides high quality research-based interdisciplinary, academic, professional and enrichment programs as well as appropriate support services to diverse communities of learners in a fiscally responsible manner. The College of Continuing Studies provides a life long academic partnership between learners and the University of Connecticut. The College provides a statewide gateway to UCONN’s educational resources and services for individuals as well as organizations in both the corporate and public services sectors. Professional Studies is a unit of the College of Continuing Studies at the University of Connecticut. This unit offers career related non-credit training throughout the state of Connecticut. Programs are offered to meet the needs of employers and employees in business and industry as well as nonprofit organizations and school systems. Many of the Professional Studies program offerings serve the training needs of Connecticut’s industry clusters especially in the area of finance, insurance, real estate and healthcare. All of the non-credit programs reported here serve workforce development needs in the state and are supported entirely by participant fees. The College of Continuing Studies receives no state support for its programs. Participant information and enrollment statistics included in this report are for career related workforce development training programs such as; the Paralegal Litigation Certificate Program, the Pharmacy Technician Certificate program, the School Nurse Emergency Medical Services for Children program, real estate courses and modules, and insurance courses which include industry certification designations for CPCU, AIM, and ARM. These programs are offered at University of Connecticut campus locations in Avery Point, Stamford, Storrs, Waterbury and West Hartford as well as at the Hartford Downtown Center and the UConn Health Center. Other Professional Studies workforce development programs are offered on site at schools, businesses and hospitals statewide. No demographics available.
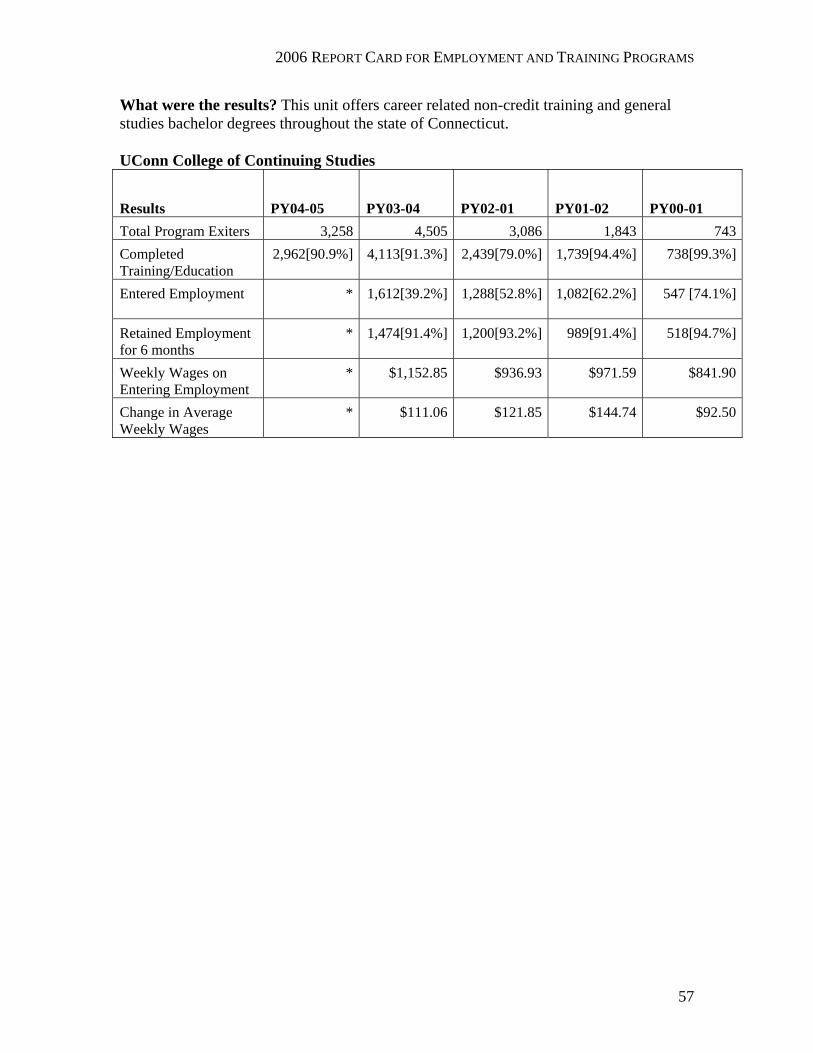
2006 REPORT CARD FOR EMPLOYMENT AND TRAINING PROGRAMS
57
What were the results? This unit offers career related non-credit training and general studies bachelor degrees throughout the state of Connecticut.
UConn College of Continuing Studies
Results PY04-05 PY03-04 PY02-01 PY01-02 PY00-01 Total Program Exiters 3,258 4,505 3,086 1,843 743Completed Training/Education
2,962[90.9%] 4,113[91.3%] 2,439[79.0%] 1,739[94.4%] 738[99.3%]
Entered Employment
* 1,612[39.2%] 1,288[52.8%] 1,082[62.2%] 547 [74.1%]
Retained Employment for 6 months
* 1,474[91.4%] 1,200[93.2%] 989[91.4%] 518[94.7%]
Weekly Wages on Entering Employment
* $1,152.85 $936.93 $971.59 $841.90
Change in Average Weekly Wages
* $111.06 $121.85 $144.74 $92.50

2006 REPORT CARD FOR EMPLOYMENT AND TRAINING PROGRAMS
58
University of Connecticut Undergraduate and Graduate
SUMMARY Program Description. These data are for the combined Undergraduate and Graduate studies programs at the University of Connecticut, including the professional schools. But the University of Connecticut Health Center is not included.
Outcomes • The entered employment rate declined
slightly for all graduates from a high of 65 percent in PY00-01 to 58 percent in PY03-04, 53 percent of those with a graduate degree and 60 percent with an undergraduate degree
• Retention for those with a graduate degree was 88 percent and for those with an undergraduate degree was 82.5 percent both having declined from highs of 91 and 88 percent respectively
• Those with graduate degrees were earning an average of nearly $900 per week while those with undergraduate degrees were earning $450
Expenditures and number served • Approximately 24,500 students were
served in PY04-05. • The university reports its allocation
from the Legislature as approximately $200 million
Other characteristics of participants • Among the approximately 24,500
graduate and undergraduate students, 53 percent were female and 47 percent were male, the percentage of females has declined slightly since PY00-01
• The percentage of both Hispanics and Blacks have risen slightly in the past five years
Employment and Retention at 6 Months
0.00%
20.00%
40.00%
60.00%
80.00%
100.00%
PY00-01 PY01-02 PY02-03 PY03-04
Graduate: Entered EmploymentGraduate: Retained Employment for 6 months
Undergrad: Entered EmploymentUndergrad: Retained Employment for 6 months
Weekly Wage on Entering Employment
$0.00
$200.00
$400.00
$600.00
$800.00
$1,000.00
$1,200.00
PY00-01 PY01-02 PY02-03 PY03-04
Undergraduate Graduate
Wage Change
$0.00$100.00$200.00$300.00$400.00$500.00$600.00$700.00
PY00-01 PY01-02 PY02-03 PY03-04
Graduate Undergrad

2006 REPORT CARD FOR EMPLOYMENT AND TRAINING PROGRAMS
59
Program Description. These data are for the combined Undergraduate and Graduate studies programs at the University of Connecticut, including the professional schools. But the University of Connecticut Health Center is not included. What are the quantity and types of services delivered? No service or budget data provided. Who was served?
Race and Ethnicity
0.00%
20.00%
40.00%
60.00%
80.00%
100.00%
PY04-05 PY03-04 PY02-03 PY01-02 PY00-01
White/Caucasian Black/African-AmericanAmerican Indian/Alaskan AsianNon-Resident Alien Hispanic/Latino
University of Connecticut, Graduate and Undergraduate PY04-05 PY03-04 PY02-03 PY01-02 PY00-01
Program Participants 24,541[100.0%] 23,621[100%] NA Program Completers 5,303 4,573 3,843 Gender Male 11607[47.3%] 11149[47.2%] 2,285[43.1%] 2,070[45.3%] 1,687[43.9%] Female 12934[52.7%] 12472[52.8%] 3,018[56.9%] 2,499[54.6%] 2,154[56.0%] Gender unknown 0[0.0%] 0[0.0%] 4[0.1%] 2[0.1%] Age Age 14 - 17 761[3.1%] 720[3.0%] 0[0.0%] 134[2.9%] NA Age 18 - 24 17969[73.2%] 17139[72.6%] 3,026[57.1%] 2,985[65.3%] Age 25 - 59 5756[23.5%] 5721[24.2%] 2,203[41.5%] 1,436[31.4%] Age 60 and over 55[0.2%] 41[0.2%] 74[1.4%] 18[0.4%] Age unknown 0[0.0%] 0[0.0%] 0[0.0%] 0[0.0%] Ethnicity Hispanic/Latino 1208[4.9%] 1132[4.8%] 216[4.1%] 195[4.3%] 119[3.1%] Hispanic/Latino unknown 23333[94.1%] 22489[95.2%] 5,087[95.9%] 4,378[95.7%] 3,724[96.9%] Race White/Caucasian 19145[78.0%] 18420[78.0%] 3,735[70.4%] 3,099[67.8%] 2,982[77.6%] Black/African-American 1270[5.2%] 1191[5.0%] 221[4.2%] 210[4.6%] 152[4.0%] American Indian/Alaskan 77[0.3%] 76[0.3%] 17[0.3%] 13[0.3%] 14[0.4%] Asian 1435[5.8%] 1329[5.6%] 272[5.1%] 222[4.9%] 197[5.1%] Hawaiian/Pacific Islander NA NA NA NA NA Other NA NA NA NA NA Non-Resident Alien 1406[5.7%] 1473[6.2%] 1,058[20.0%] 1,029[22.5%] 498[13.0%] Education Level Less Than high school NA NA NA NA NA High School or Equivalent Some Post-secondary Associates Degree Bachelors Degree Post-baccalaureate degree Post-HS education - degree
Age
0.0%10.0%20.0%30.0%40.0%50.0%60.0%70.0%80.0%90.0%
100.0%
PY04-05 PY03-04 PY02-03 PY01-02
Age 14 - 17 Age 18 - 24 Age 25 - 59 Age 60 and over
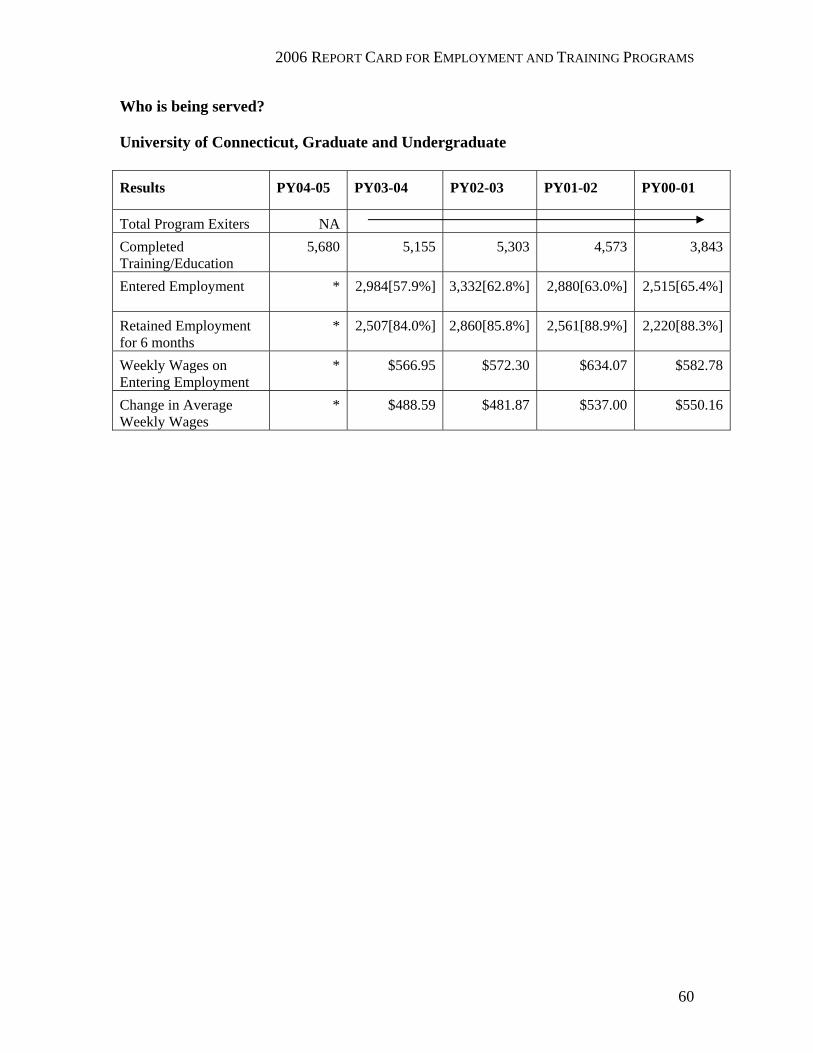
2006 REPORT CARD FOR EMPLOYMENT AND TRAINING PROGRAMS
60
Who is being served? University of Connecticut, Graduate and Undergraduate Results PY04-05 PY03-04 PY02-03 PY01-02 PY00-01
Total Program Exiters NA Completed Training/Education
5,680 5,155 5,303 4,573 3,843
Entered Employment
* 2,984[57.9%] 3,332[62.8%] 2,880[63.0%] 2,515[65.4%]
Retained Employment for 6 months
* 2,507[84.0%] 2,860[85.8%] 2,561[88.9%] 2,220[88.3%]
Weekly Wages on Entering Employment
* $566.95 $572.30 $634.07 $582.78
Change in Average Weekly Wages
* $488.59 $481.87 $537.00 $550.16
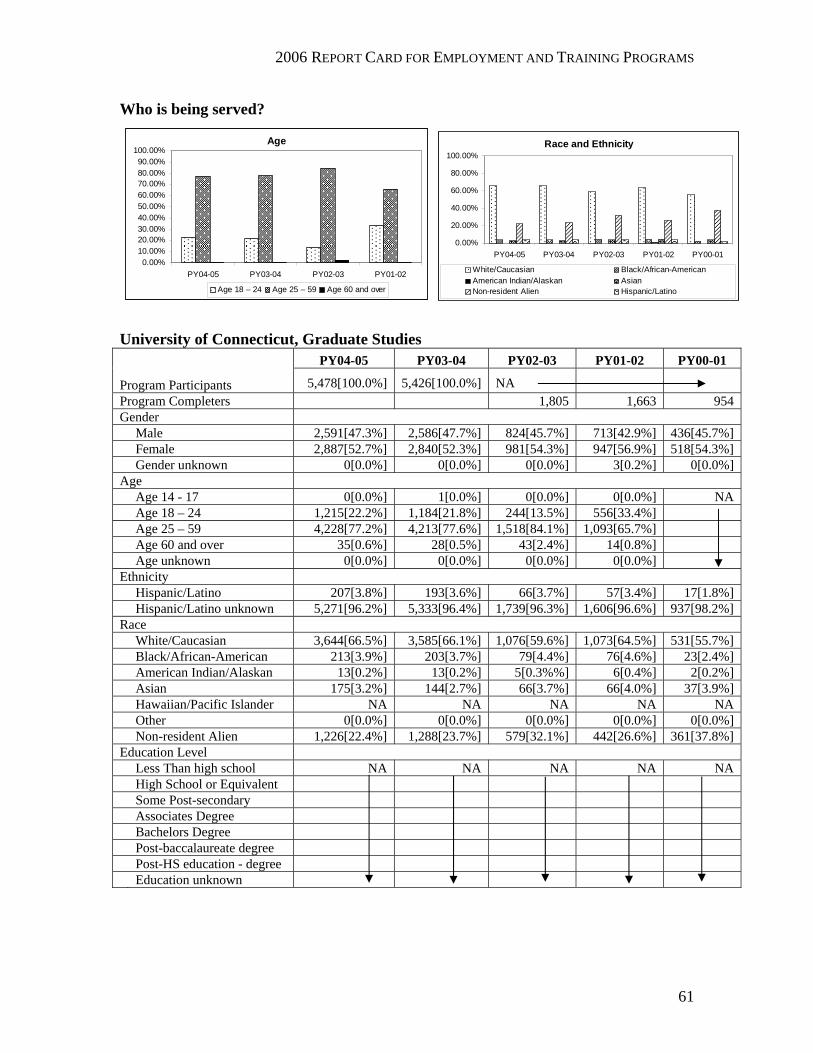
2006 REPORT CARD FOR EMPLOYMENT AND TRAINING PROGRAMS
61
Who is being served?
University of Connecticut, Graduate Studies
PY04-05 PY03-04 PY02-03 PY01-02 PY00-01
Program Participants 5,478[100.0%] 5,426[100.0%] NA Program Completers 1,805 1,663 954 Gender Male 2,591[47.3%] 2,586[47.7%] 824[45.7%] 713[42.9%] 436[45.7%] Female 2,887[52.7%] 2,840[52.3%] 981[54.3%] 947[56.9%] 518[54.3%] Gender unknown 0[0.0%] 0[0.0%] 0[0.0%] 3[0.2%] 0[0.0%] Age Age 14 - 17 0[0.0%] 1[0.0%] 0[0.0%] 0[0.0%] NA Age 18 – 24 1,215[22.2%] 1,184[21.8%] 244[13.5%] 556[33.4%] Age 25 – 59 4,228[77.2%] 4,213[77.6%] 1,518[84.1%] 1,093[65.7%] Age 60 and over 35[0.6%] 28[0.5%] 43[2.4%] 14[0.8%] Age unknown 0[0.0%] 0[0.0%] 0[0.0%] 0[0.0%] Ethnicity Hispanic/Latino 207[3.8%] 193[3.6%] 66[3.7%] 57[3.4%] 17[1.8%] Hispanic/Latino unknown 5,271[96.2%] 5,333[96.4%] 1,739[96.3%] 1,606[96.6%] 937[98.2%] Race White/Caucasian 3,644[66.5%] 3,585[66.1%] 1,076[59.6%] 1,073[64.5%] 531[55.7%] Black/African-American 213[3.9%] 203[3.7%] 79[4.4%] 76[4.6%] 23[2.4%] American Indian/Alaskan 13[0.2%] 13[0.2%] 5[0.3%%] 6[0.4%] 2[0.2%] Asian 175[3.2%] 144[2.7%] 66[3.7%] 66[4.0%] 37[3.9%] Hawaiian/Pacific Islander NA NA NA NA NA Other 0[0.0%] 0[0.0%] 0[0.0%] 0[0.0%] 0[0.0%] Non-resident Alien 1,226[22.4%] 1,288[23.7%] 579[32.1%] 442[26.6%] 361[37.8%] Education Level Less Than high school NA NA NA NA NA High School or Equivalent Some Post-secondary Associates Degree Bachelors Degree Post-baccalaureate degree Post-HS education - degree Education unknown
Age
0.00%10.00%20.00%30.00%40.00%50.00%60.00%70.00%80.00%90.00%
100.00%
PY04-05 PY03-04 PY02-03 PY01-02
Age 18 – 24 Age 25 – 59 Age 60 and over
Race and Ethnicity
0.00%
20.00%
40.00%
60.00%
80.00%
100.00%
PY04-05 PY03-04 PY02-03 PY01-02 PY00-01
White/Caucasian Black/African-AmericanAmerican Indian/Alaskan AsianNon-resident Alien Hispanic/Latino
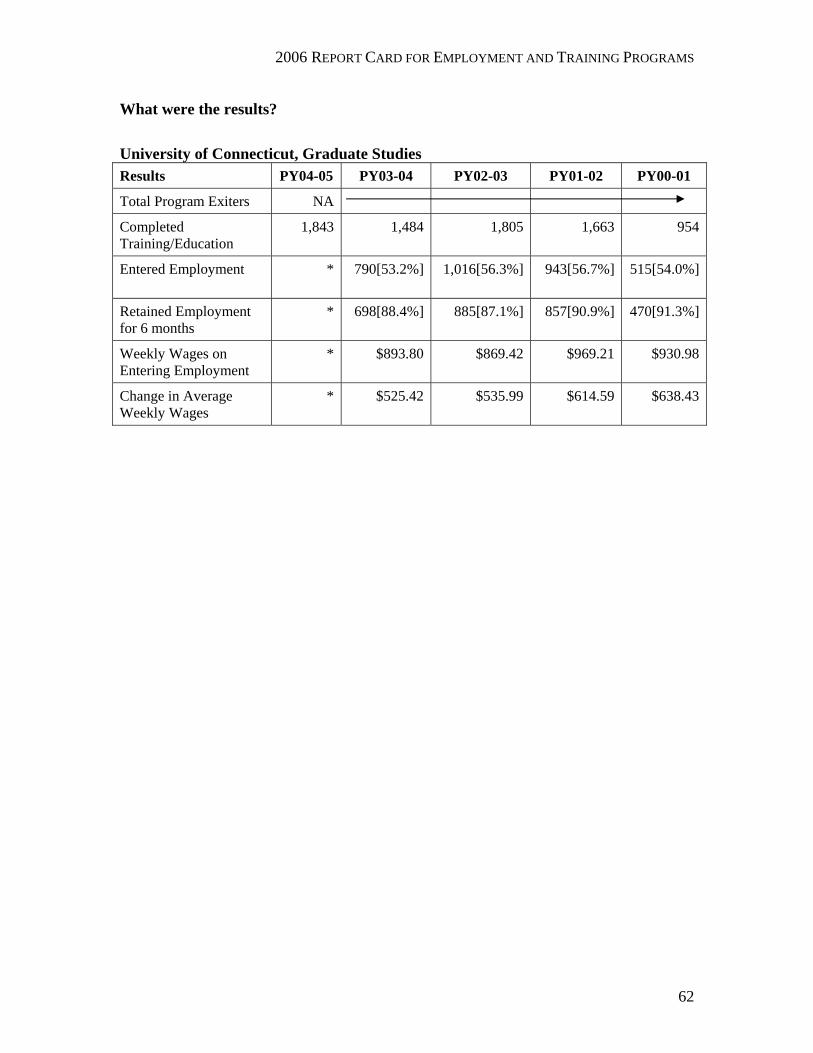
2006 REPORT CARD FOR EMPLOYMENT AND TRAINING PROGRAMS
62
What were the results? University of Connecticut, Graduate Studies Results PY04-05 PY03-04 PY02-03 PY01-02 PY00-01
Total Program Exiters NA
Completed Training/Education
1,843 1,484 1,805 1,663 954
Entered Employment
* 790[53.2%] 1,016[56.3%] 943[56.7%] 515[54.0%]
Retained Employment for 6 months
* 698[88.4%] 885[87.1%] 857[90.9%] 470[91.3%]
Weekly Wages on Entering Employment
* $893.80 $869.42 $969.21 $930.98
Change in Average Weekly Wages
* $525.42 $535.99 $614.59 $638.43
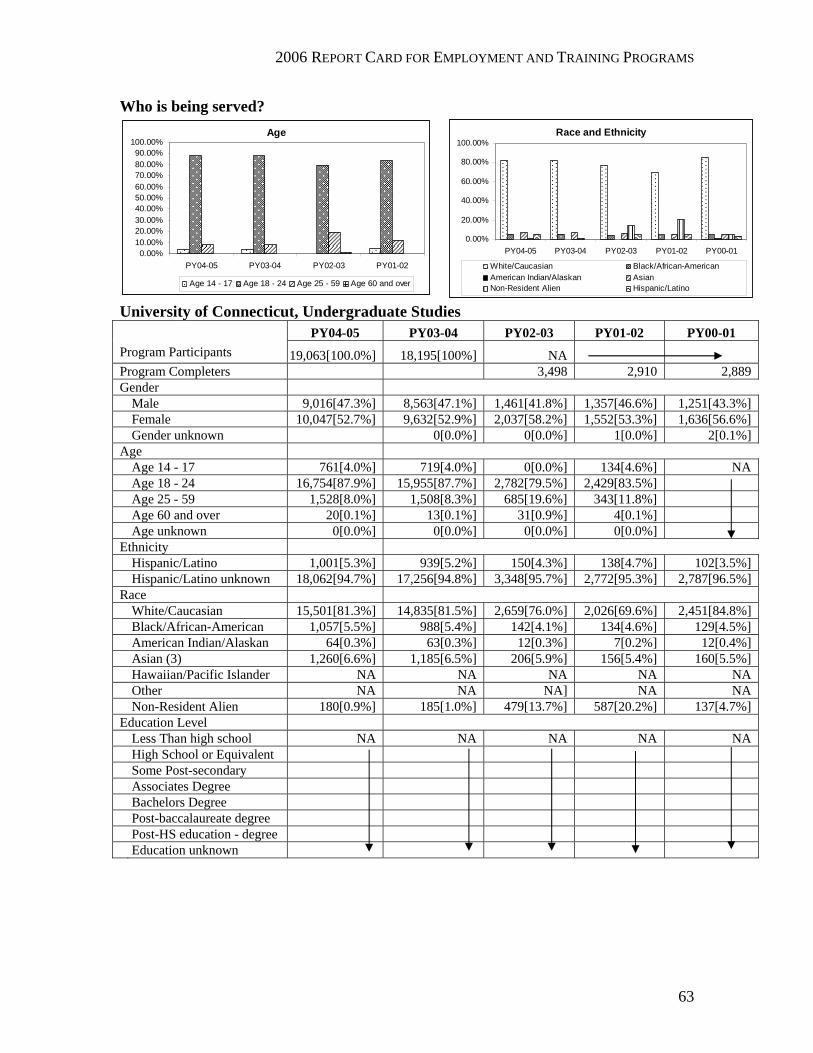
2006 REPORT CARD FOR EMPLOYMENT AND TRAINING PROGRAMS
63
Who is being served? Race and Ethnicity
0.00%
20.00%
40.00%
60.00%
80.00%
100.00%
PY04-05 PY03-04 PY02-03 PY01-02 PY00-01
White/Caucasian Black/African-AmericanAmerican Indian/Alaskan AsianNon-Resident Alien Hispanic/Latino
University of Connecticut, Undergraduate Studies PY04-05 PY03-04 PY02-03 PY01-02 PY00-01
Program Participants 19,063[100.0%] 18,195[100%] NA Program Completers 3,498 2,910 2,889 Gender Male 9,016[47.3%] 8,563[47.1%] 1,461[41.8%] 1,357[46.6%] 1,251[43.3%] Female 10,047[52.7%] 9,632[52.9%] 2,037[58.2%] 1,552[53.3%] 1,636[56.6%] Gender unknown 0[0.0%] 0[0.0%] 1[0.0%] 2[0.1%] Age Age 14 - 17 761[4.0%] 719[4.0%] 0[0.0%] 134[4.6%] NA Age 18 - 24 16,754[87.9%] 15,955[87.7%] 2,782[79.5%] 2,429[83.5%] Age 25 - 59 1,528[8.0%] 1,508[8.3%] 685[19.6%] 343[11.8%] Age 60 and over 20[0.1%] 13[0.1%] 31[0.9%] 4[0.1%] Age unknown 0[0.0%] 0[0.0%] 0[0.0%] 0[0.0%] Ethnicity Hispanic/Latino 1,001[5.3%] 939[5.2%] 150[4.3%] 138[4.7%] 102[3.5%] Hispanic/Latino unknown 18,062[94.7%] 17,256[94.8%] 3,348[95.7%] 2,772[95.3%] 2,787[96.5%] Race White/Caucasian 15,501[81.3%] 14,835[81.5%] 2,659[76.0%] 2,026[69.6%] 2,451[84.8%] Black/African-American 1,057[5.5%] 988[5.4%] 142[4.1%] 134[4.6%] 129[4.5%] American Indian/Alaskan 64[0.3%] 63[0.3%] 12[0.3%] 7[0.2%] 12[0.4%] Asian (3) 1,260[6.6%] 1,185[6.5%] 206[5.9%] 156[5.4%] 160[5.5%] Hawaiian/Pacific Islander NA NA NA NA NA Other NA NA NA] NA NA Non-Resident Alien 180[0.9%] 185[1.0%] 479[13.7%] 587[20.2%] 137[4.7%] Education Level Less Than high school NA NA NA NA NA High School or Equivalent Some Post-secondary Associates Degree Bachelors Degree Post-baccalaureate degree Post-HS education - degree Education unknown
Age
0.00%10.00%20.00%30.00%40.00%50.00%60.00%70.00%80.00%90.00%
100.00%
PY04-05 PY03-04 PY02-03 PY01-02
Age 14 - 17 Age 18 - 24 Age 25 - 59 Age 60 and over
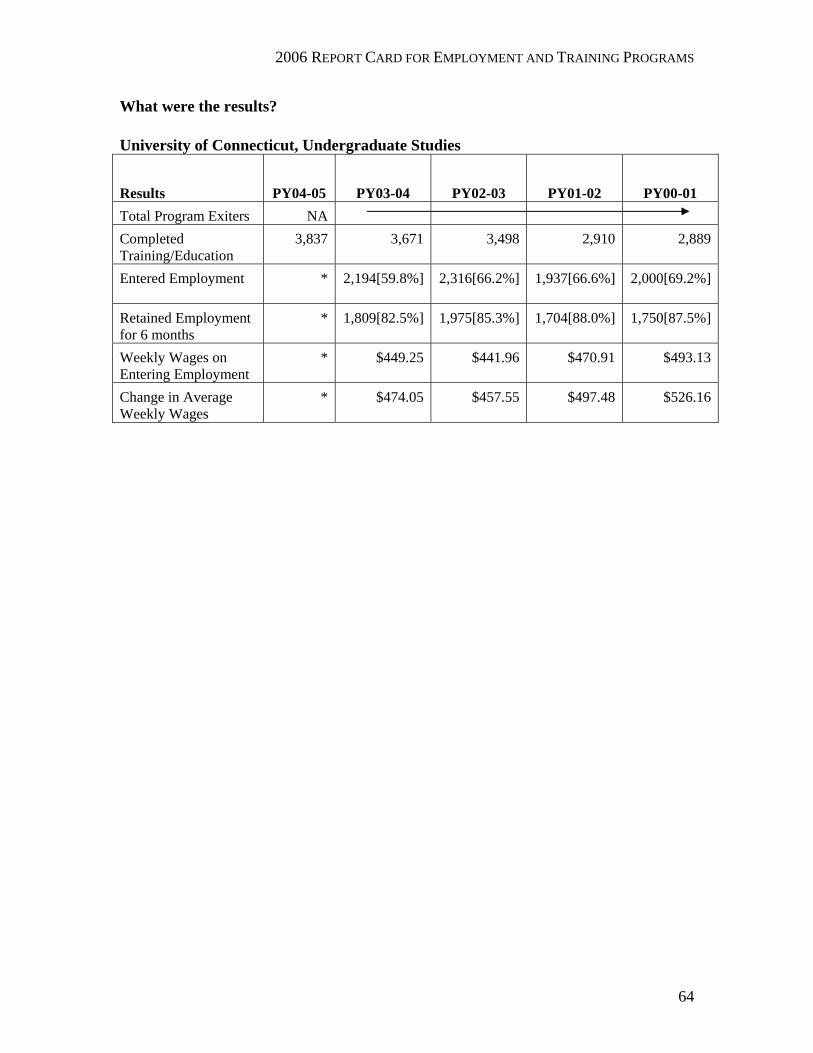
2006 REPORT CARD FOR EMPLOYMENT AND TRAINING PROGRAMS
64
What were the results? University of Connecticut, Undergraduate Studies
Results PY04-05 PY03-04 PY02-03 PY01-02 PY00-01 Total Program Exiters NA Completed Training/Education
3,837 3,671 3,498 2,910 2,889
Entered Employment
* 2,194[59.8%] 2,316[66.2%] 1,937[66.6%] 2,000[69.2%]
Retained Employment for 6 months
* 1,809[82.5%] 1,975[85.3%] 1,704[88.0%] 1,750[87.5%]
Weekly Wages on Entering Employment
* $449.25 $441.96 $470.91 $493.13
Change in Average Weekly Wages
* $474.05 $457.55 $497.48 $526.16
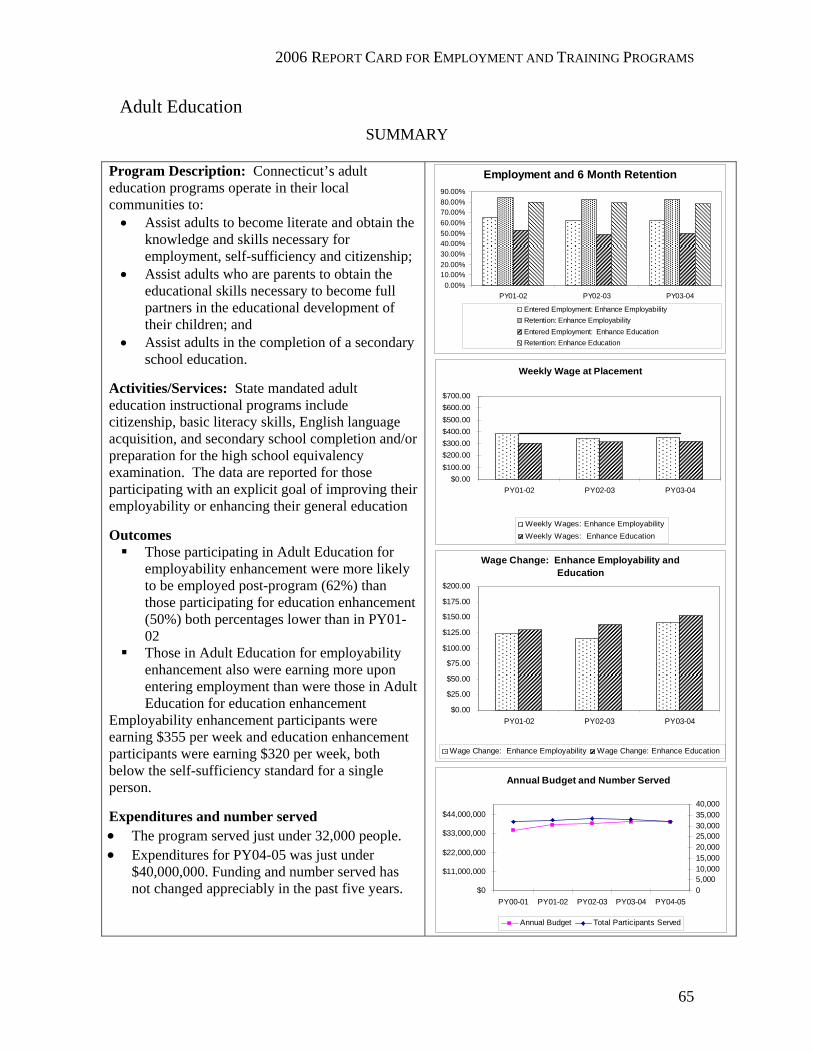
2006 REPORT CARD FOR EMPLOYMENT AND TRAINING PROGRAMS
65
Adult Education SUMMARY
Program Description: Connecticut’s adult education programs operate in their local communities to: • Assist adults to become literate and obtain the
knowledge and skills necessary for employment, self-sufficiency and citizenship;
• Assist adults who are parents to obtain the educational skills necessary to become full partners in the educational development of their children; and
• Assist adults in the completion of a secondary school education.
Activities/Services: State mandated adult education instructional programs include citizenship, basic literacy skills, English language acquisition, and secondary school completion and/or preparation for the high school equivalency examination. The data are reported for those participating with an explicit goal of improving their employability or enhancing their general education Outcomes
Those participating in Adult Education for employability enhancement were more likely to be employed post-program (62%) than those participating for education enhancement (50%) both percentages lower than in PY01-02
Those in Adult Education for employability enhancement also were earning more upon entering employment than were those in Adult Education for education enhancement
Employability enhancement participants were earning $355 per week and education enhancement participants were earning $320 per week, both below the self-sufficiency standard for a single person. Expenditures and number served • The program served just under 32,000 people. • Expenditures for PY04-05 was just under
$40,000,000. Funding and number served has not changed appreciably in the past five years.
Employment and 6 Month Retention
0.00%10.00%20.00%30.00%40.00%50.00%60.00%70.00%80.00%90.00%
PY01-02 PY02-03 PY03-04
Entered Employment: Enhance Employability Retention: Enhance EmployabilityEntered Employment: Enhance EducationRetention: Enhance Education
Weekly Wage at Placement
$0.00$100.00$200.00$300.00$400.00$500.00$600.00$700.00
PY01-02 PY02-03 PY03-04
Weekly Wages: Enhance Employability Weekly Wages: Enhance Education
Wage Change: Enhance Employability and Education
$0.00
$25.00
$50.00
$75.00
$100.00
$125.00
$150.00
$175.00
$200.00
PY01-02 PY02-03 PY03-04
Wage Change: Enhance Employability Wage Change: Enhance Education
Annual Budget and Number Served
$0
$11,000,000
$22,000,000
$33,000,000
$44,000,000
PY00-01 PY01-02 PY02-03 PY03-04 PY04-0505,00010,00015,00020,00025,00030,00035,00040,000
Annual Budget Total Participants Served
2006 REPORT CARD FOR EMPLOYMENT AND TRAINING PROGRAMS
66
Program Description: Connecticut’s adult education programs operate in their local communities to:
• Assist adults to become literate and obtain the knowledge and skills necessary for employment, self-sufficiency and citizenship;
• Assist adults who are parents to obtain the educational skills necessary to become full partners in the educational development of their children; and
• Assist adults in the completion of a secondary school education. Connecticut General Statutes requires that adult education services be provided by local school districts, free of charge, to any adult 16 years of age or over who is no longer enrolled in a public elementary or secondary school program. Local school districts and other eligible agencies providing mandated adult education programs are reimbursed by the Connecticut State Department of Education on a cost-sharing, sliding scale based on the relative wealth of a district. Federal adult education dollars are distributed through a direct and equitable request-for-proposal process. Federal funds are awarded in specific priority areas to a variety of eligible applicants including state and local education agencies, vocational-technical schools, community colleges, volunteer literacy organizations and private nonprofit organizations. Activities/Services: State mandated adult education instructional programs include citizenship, basic literacy skills, English language acquisition, and secondary school completion and/or preparation for the high school equivalency examination. Priority areas for the federal adult education grant include: workplace preparation; workforce education; family literacy; transition to post-secondary education and training; technology implementation; and English language acquisition/civics education. An additional priority area supports the Connecticut Adult Virtual High School. Counseling services are available, and, in some agencies, transportation and childcare services are provided. Workplace and family literacy programs are also offered. The Connecticut State Department of Education’s assessment and instructional system provides a competency-based framework for quality adult education services that integrates standardized assessments in reading, writing, math, listening, and speaking. The Internet-based data management system that all programs use collects individual student data on demographics, student assessment, entry status, goals and achievements. Together the assessment and the data management systems serve as the backbone for Connecticut adult education’s accountability and inform program improvement, state/federal reporting, technical assistance and professional development.
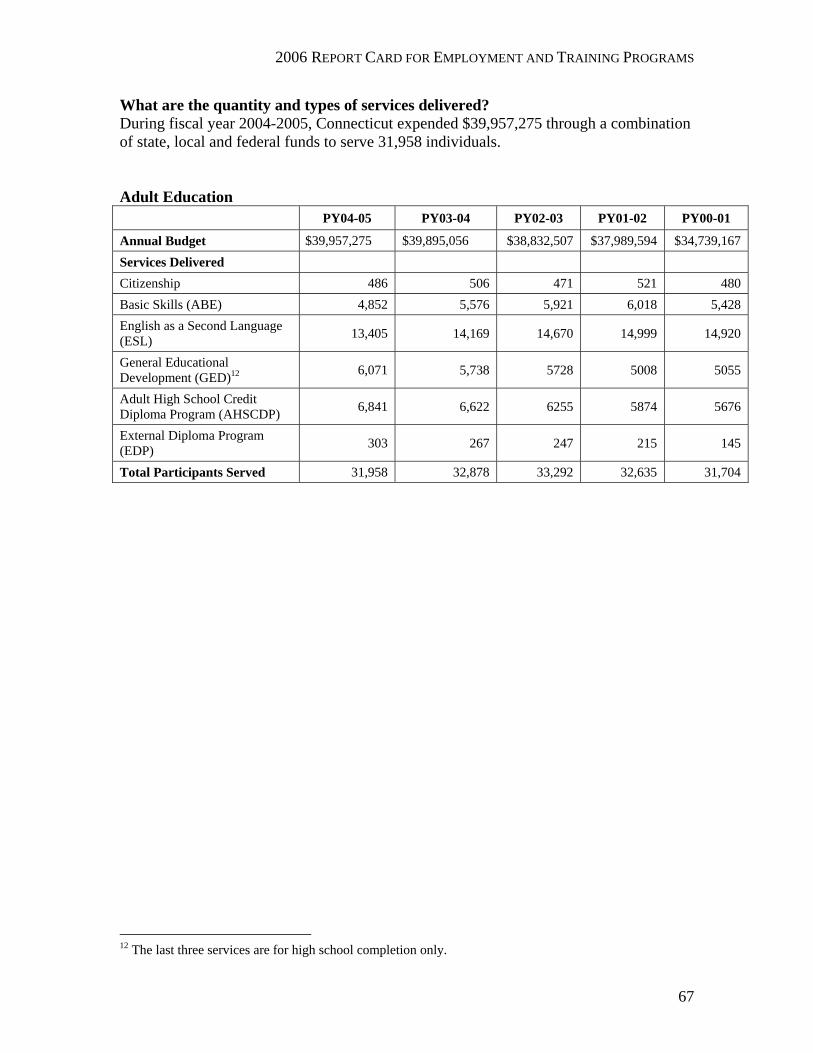
2006 REPORT CARD FOR EMPLOYMENT AND TRAINING PROGRAMS
67
What are the quantity and types of services delivered? During fiscal year 2004-2005, Connecticut expended $39,957,275 through a combination of state, local and federal funds to serve 31,958 individuals. Adult Education PY04-05 PY03-04 PY02-03 PY01-02 PY00-01
Annual Budget $39,957,275 $39,895,056 $38,832,507 $37,989,594 $34,739,167 Services Delivered Citizenship 486 506 471 521 480 Basic Skills (ABE) 4,852 5,576 5,921 6,018 5,428 English as a Second Language (ESL) 13,405 14,169 14,670 14,999 14,920
General Educational Development (GED)12 6,071 5,738 5728 5008 5055
Adult High School Credit Diploma Program (AHSCDP) 6,841 6,622 6255 5874 5676
External Diploma Program (EDP) 303 267 247 215 145
Total Participants Served 31,958 32,878 33,292 32,635 31,704
12 The last three services are for high school completion only.
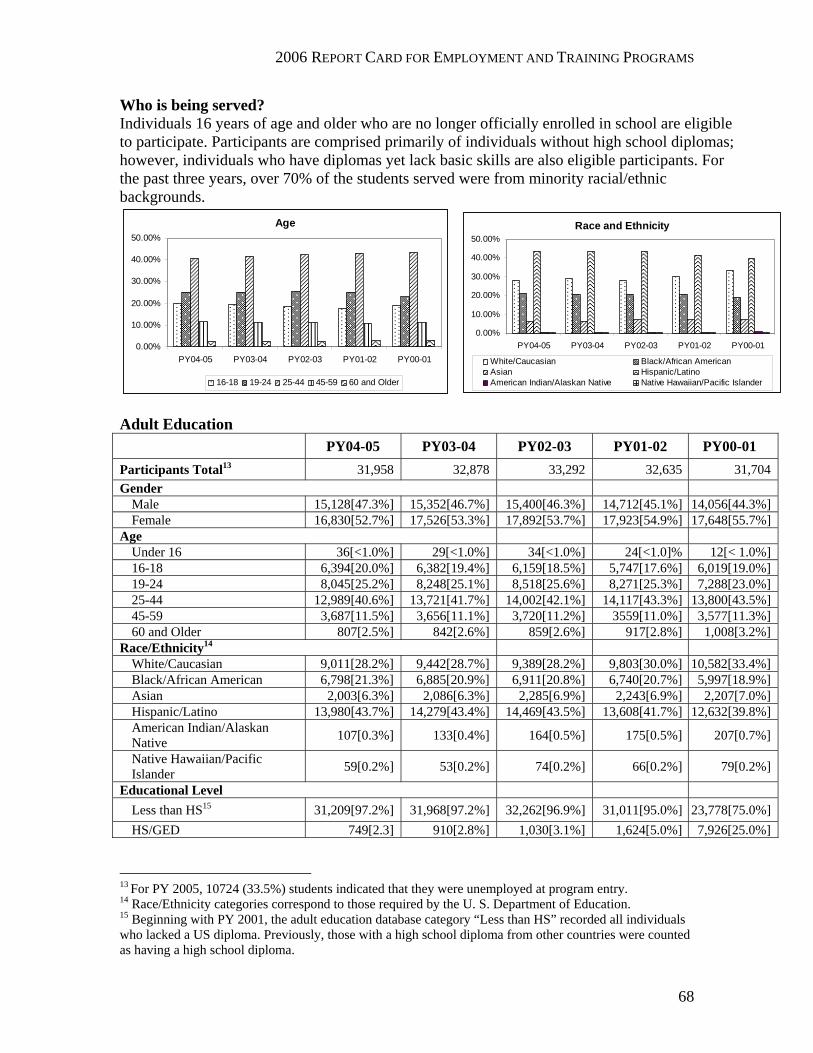
2006 REPORT CARD FOR EMPLOYMENT AND TRAINING PROGRAMS
68
Who is being served? Individuals 16 years of age and older who are no longer officially enrolled in school are eligible to participate. Participants are comprised primarily of individuals without high school diplomas; however, individuals who have diplomas yet lack basic skills are also eligible participants. For the past three years, over 70% of the students served were from minority racial/ethnic backgrounds.
Adult Education
PY04-05 PY03-04 PY02-03 PY01-02 PY00-01 Participants Total13 31,958 32,878 33,292 32,635 31,704 Gender
Male 15,128[47.3%] 15,352[46.7%] 15,400[46.3%] 14,712[45.1%] 14,056[44.3%] Female 16,830[52.7%] 17,526[53.3%] 17,892[53.7%] 17,923[54.9%] 17,648[55.7%]
Age Under 16 36[<1.0%] 29[<1.0%] 34[<1.0%] 24[<1.0]% 12[< 1.0%] 16-18 6,394[20.0%] 6,382[19.4%] 6,159[18.5%] 5,747[17.6%] 6,019[19.0%] 19-24 8,045[25.2%] 8,248[25.1%] 8,518[25.6%] 8,271[25.3%] 7,288[23.0%] 25-44 12,989[40.6%] 13,721[41.7%] 14,002[42.1%] 14,117[43.3%] 13,800[43.5%] 45-59 3,687[11.5%] 3,656[11.1%] 3,720[11.2%] 3559[11.0%] 3,577[11.3%] 60 and Older 807[2.5%] 842[2.6%] 859[2.6%] 917[2.8%] 1,008[3.2%]
Race/Ethnicity14 White/Caucasian 9,011[28.2%] 9,442[28.7%] 9,389[28.2%] 9,803[30.0%] 10,582[33.4%] Black/African American 6,798[21.3%] 6,885[20.9%] 6,911[20.8%] 6,740[20.7%] 5,997[18.9%] Asian 2,003[6.3%] 2,086[6.3%] 2,285[6.9%] 2,243[6.9%] 2,207[7.0%] Hispanic/Latino 13,980[43.7%] 14,279[43.4%] 14,469[43.5%] 13,608[41.7%] 12,632[39.8%] American Indian/Alaskan Native 107[0.3%] 133[0.4%] 164[0.5%] 175[0.5%] 207[0.7%]
Native Hawaiian/Pacific Islander 59[0.2%] 53[0.2%] 74[0.2%] 66[0.2%] 79[0.2%]
Educational Level Less than HS15 31,209[97.2%] 31,968[97.2%] 32,262[96.9%] 31,011[95.0%] 23,778[75.0%] HS/GED 749[2.3] 910[2.8%] 1,030[3.1%] 1,624[5.0%] 7,926[25.0%]
13 For PY 2005, 10724 (33.5%) students indicated that they were unemployed at program entry. 14 Race/Ethnicity categories correspond to those required by the U. S. Department of Education. 15 Beginning with PY 2001, the adult education database category “Less than HS” recorded all individuals who lacked a US diploma. Previously, those with a high school diploma from other countries were counted as having a high school diploma.
Age
0.00%
10.00%
20.00%
30.00%
40.00%
50.00%
PY04-05 PY03-04 PY02-03 PY01-02 PY00-01
16-18 19-24 25-44 45-59 60 and Older
Race and Ethnicity
0.00%
10.00%
20.00%
30.00%
40.00%
50.00%
PY04-05 PY03-04 PY02-03 PY01-02 PY00-01
White/Caucasian Black/African AmericanAsian Hispanic/LatinoAmerican Indian/Alaskan Native Native Hawaiian/Pacific Islander
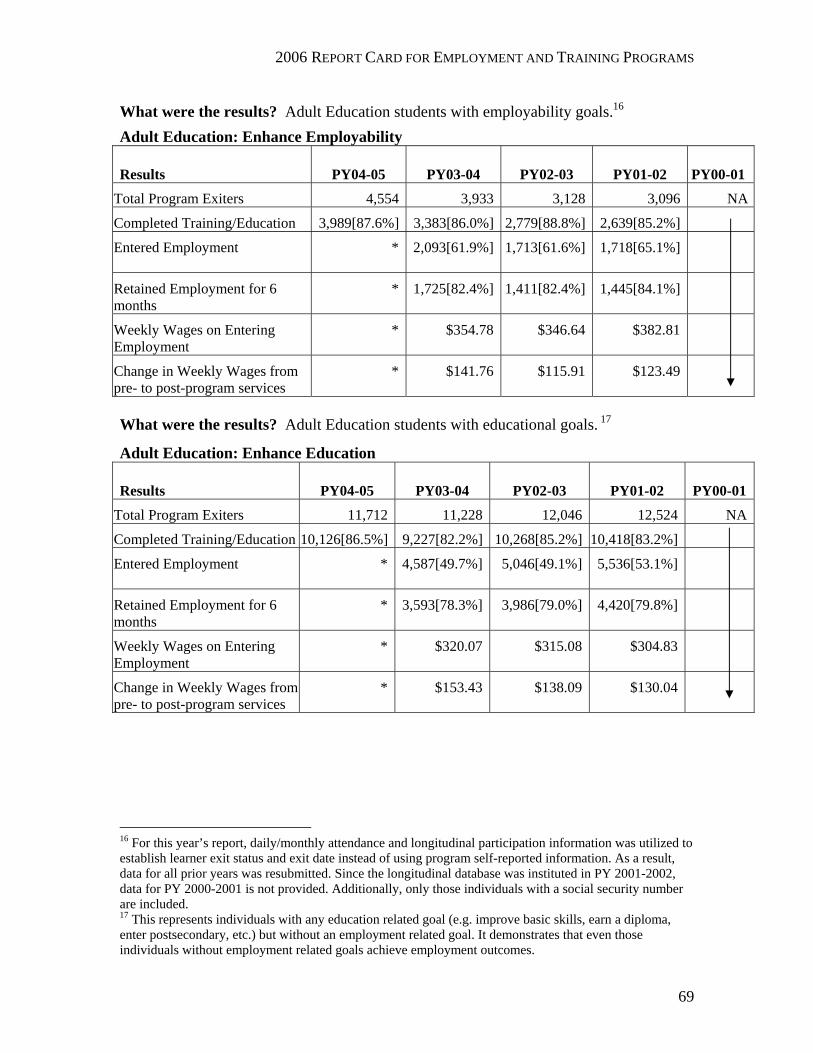
2006 REPORT CARD FOR EMPLOYMENT AND TRAINING PROGRAMS
69
What were the results? Adult Education students with employability goals.16 Adult Education: Enhance Employability
Results PY04-05 PY03-04 PY02-03 PY01-02 PY00-01
Total Program Exiters 4,554 3,933 3,128 3,096 NA
Completed Training/Education 3,989[87.6%] 3,383[86.0%] 2,779[88.8%] 2,639[85.2%]
Entered Employment
* 2,093[61.9%] 1,713[61.6%] 1,718[65.1%]
Retained Employment for 6 months
* 1,725[82.4%] 1,411[82.4%] 1,445[84.1%]
Weekly Wages on Entering Employment
* $354.78 $346.64 $382.81
Change in Weekly Wages from pre- to post-program services
* $141.76 $115.91 $123.49
What were the results? Adult Education students with educational goals. 17
Adult Education: Enhance Education
Results PY04-05 PY03-04 PY02-03 PY01-02 PY00-01
Total Program Exiters 11,712 11,228 12,046 12,524 NA
Completed Training/Education 10,126[86.5%] 9,227[82.2%] 10,268[85.2%] 10,418[83.2%]
Entered Employment
* 4,587[49.7%] 5,046[49.1%] 5,536[53.1%]
Retained Employment for 6 months
* 3,593[78.3%] 3,986[79.0%] 4,420[79.8%]
Weekly Wages on Entering Employment
* $320.07 $315.08 $304.83
Change in Weekly Wages from pre- to post-program services
* $153.43 $138.09 $130.04
16 For this year’s report, daily/monthly attendance and longitudinal participation information was utilized to establish learner exit status and exit date instead of using program self-reported information. As a result, data for all prior years was resubmitted. Since the longitudinal database was instituted in PY 2001-2002, data for PY 2000-2001 is not provided. Additionally, only those individuals with a social security number are included. 17 This represents individuals with any education related goal (e.g. improve basic skills, earn a diploma, enter postsecondary, etc.) but without an employment related goal. It demonstrates that even those individuals without employment related goals achieve employment outcomes.
2006 REPORT CARD FOR EMPLOYMENT AND TRAINING PROGRAMS
70
Other Results for PY 05: Of the 2,520 students who had the goal of earning a diploma and who exited
during the year, 1399 [56%] attained that goal. Of the 31,958 adults enrolled statewide, 13,504 [42%] completed at least one
instructional level according to the criteria established by the US Department of Education’s National Reporting System (NRS).
Of the 2,775 students in Basic Skills programs with standardized pre-post-test information, 1,865 [67%] completed one instructional level according to NRS criteria.
Of the 9,101 students in English-as-a-second-language programs with standardized pre-post-test information, 5,183 [57%] completed one instructional level according to NRS criteria.
Of the 486 students enrolled in Citizenship classes, 419 [86%] successfully prepared for the U.S. Citizenship Test while a total of 167 adults indicated having voted.
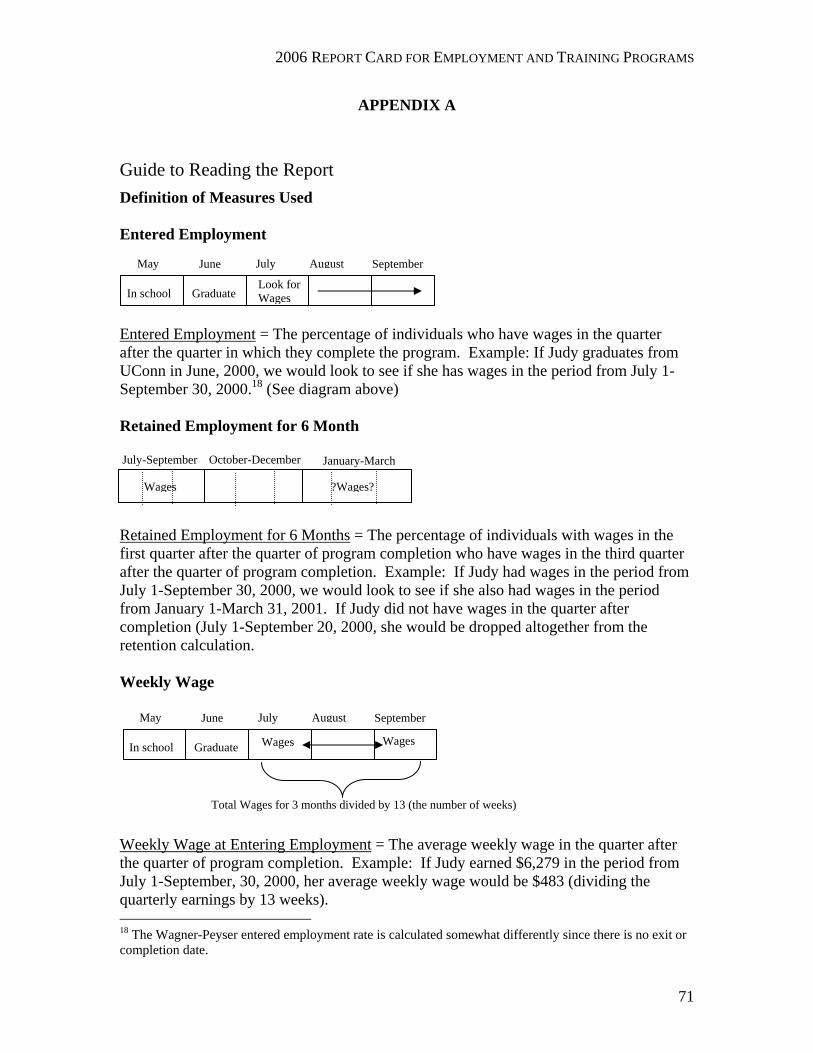
2006 REPORT CARD FOR EMPLOYMENT AND TRAINING PROGRAMS
71
APPENDIX A Guide to Reading the Report Definition of Measures Used Entered Employment
Entered Employment = The percentage of individuals who have wages in the quarter after the quarter in which they complete the program. Example: If Judy graduates from UConn in June, 2000, we would look to see if she has wages in the period from July 1-September 30, 2000.18 (See diagram above) Retained Employment for 6 Month
Retained Employment for 6 Months = The percentage of individuals with wages in the first quarter after the quarter of program completion who have wages in the third quarter after the quarter of program completion. Example: If Judy had wages in the period from July 1-September 30, 2000, we would look to see if she also had wages in the period from January 1-March 31, 2001. If Judy did not have wages in the quarter after completion (July 1-September 20, 2000, she would be dropped altogether from the retention calculation. Weekly Wage
Weekly Wage at Entering Employment = The average weekly wage in the quarter after the quarter of program completion. Example: If Judy earned $6,279 in the period from July 1-September, 30, 2000, her average weekly wage would be $483 (dividing the quarterly earnings by 13 weeks). 18 The Wagner-Peyser entered employment rate is calculated somewhat differently since there is no exit or completion date.
In school Graduate
September July
Look for Wages
AugustJune May
July-September
Wages
October-December January-March
?Wages?
In school Graduate
September July
Wages
AugustJune May
Wages
Total Wages for 3 months divided by 13 (the number of weeks)
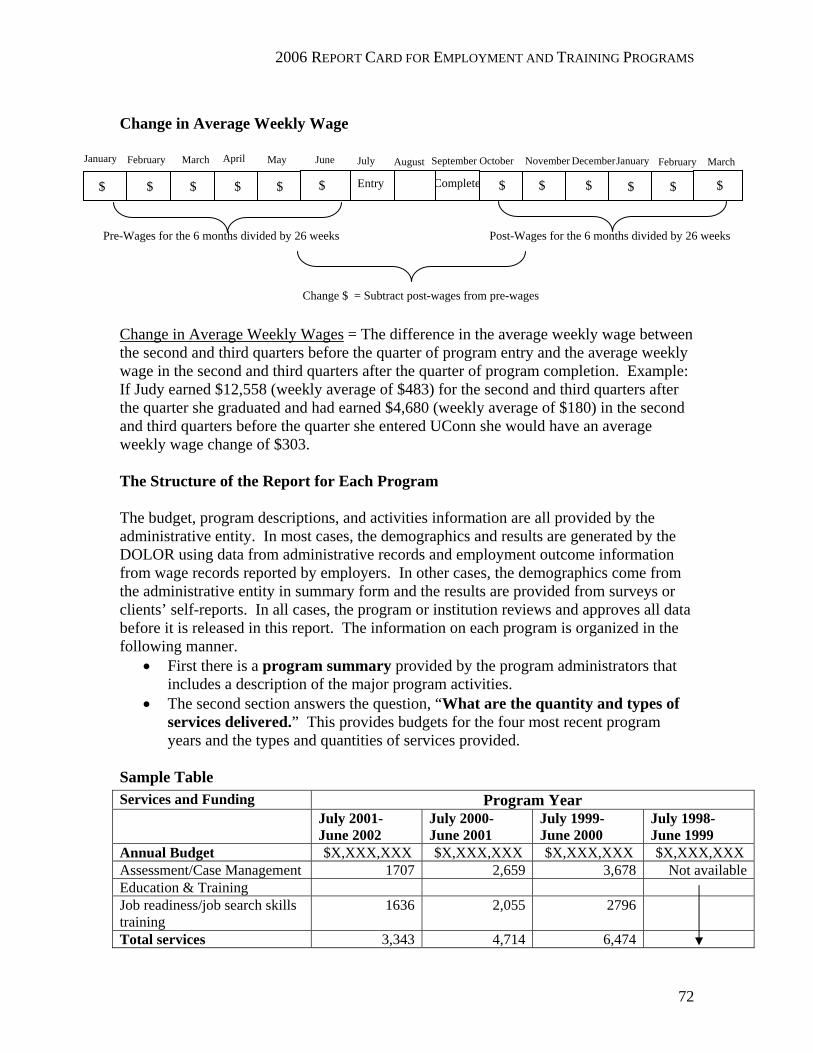
2006 REPORT CARD FOR EMPLOYMENT AND TRAINING PROGRAMS
72
Change in Average Weekly Wage
Change in Average Weekly Wages = The difference in the average weekly wage between the second and third quarters before the quarter of program entry and the average weekly wage in the second and third quarters after the quarter of program completion. Example: If Judy earned $12,558 (weekly average of $483) for the second and third quarters after the quarter she graduated and had earned $4,680 (weekly average of $180) in the second and third quarters before the quarter she entered UConn she would have an average weekly wage change of $303. The Structure of the Report for Each Program The budget, program descriptions, and activities information are all provided by the administrative entity. In most cases, the demographics and results are generated by the DOLOR using data from administrative records and employment outcome information from wage records reported by employers. In other cases, the demographics come from the administrative entity in summary form and the results are provided from surveys or clients’ self-reports. In all cases, the program or institution reviews and approves all data before it is released in this report. The information on each program is organized in the following manner.
• First there is a program summary provided by the program administrators that includes a description of the major program activities.
• The second section answers the question, “What are the quantity and types of services delivered.” This provides budgets for the four most recent program years and the types and quantities of services provided.
Sample Table Services and Funding Program Year July 2001-
June 2002 July 2000- June 2001
July 1999- June 2000
July 1998- June 1999
Annual Budget $X,XXX,XXX $X,XXX,XXX $X,XXX,XXX $X,XXX,XXX Assessment/Case Management 1707 2,659 3,678 Not availableEducation & Training Job readiness/job search skills training
1636 2,055 2796
Total services 3,343 4,714 6,474
Entry Complete
Pre-Wages for the 6 months divided by 26 weeks Post-Wages for the 6 months divided by 26 weeks
Change $ = Subtract post-wages from pre-wages
March February January April May June December November October January February March July August September
$ $ $ $ $ $ $ $ $ $ $ $
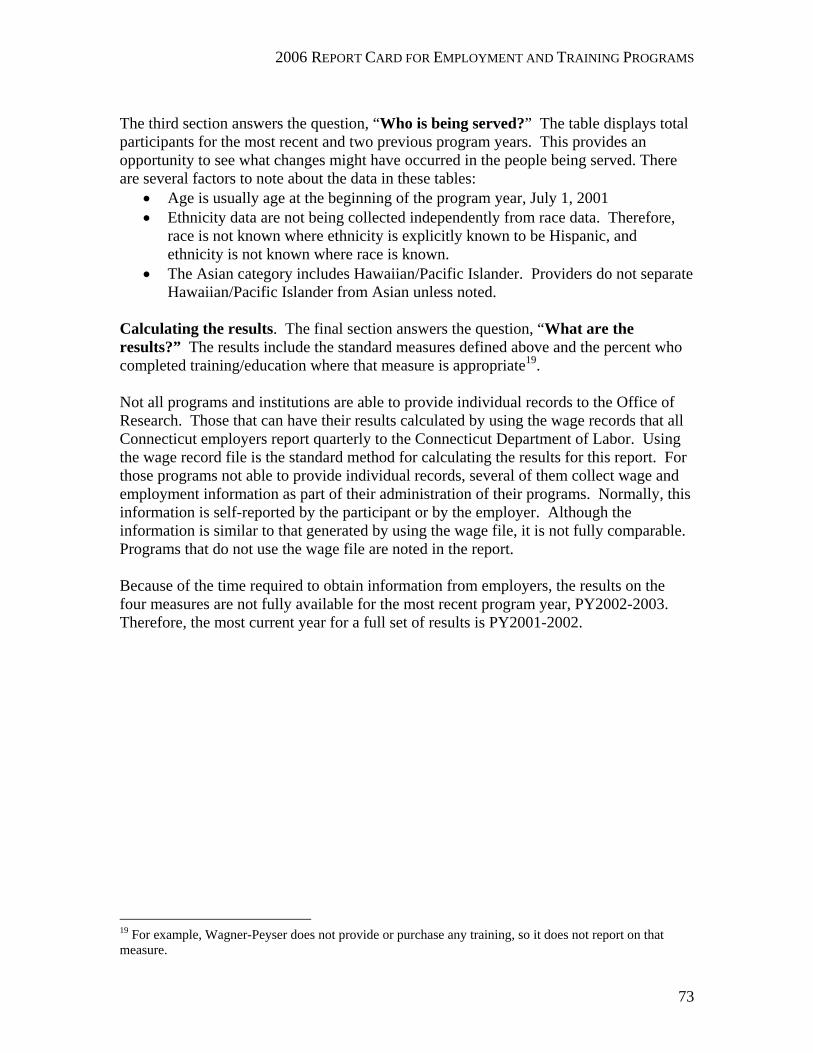
2006 REPORT CARD FOR EMPLOYMENT AND TRAINING PROGRAMS
73
The third section answers the question, “Who is being served?” The table displays total participants for the most recent and two previous program years. This provides an opportunity to see what changes might have occurred in the people being served. There are several factors to note about the data in these tables:
• Age is usually age at the beginning of the program year, July 1, 2001 • Ethnicity data are not being collected independently from race data. Therefore,
race is not known where ethnicity is explicitly known to be Hispanic, and ethnicity is not known where race is known.
• The Asian category includes Hawaiian/Pacific Islander. Providers do not separate Hawaiian/Pacific Islander from Asian unless noted.
Calculating the results. The final section answers the question, “What are the results?” The results include the standard measures defined above and the percent who completed training/education where that measure is appropriate19. Not all programs and institutions are able to provide individual records to the Office of Research. Those that can have their results calculated by using the wage records that all Connecticut employers report quarterly to the Connecticut Department of Labor. Using the wage record file is the standard method for calculating the results for this report. For those programs not able to provide individual records, several of them collect wage and employment information as part of their administration of their programs. Normally, this information is self-reported by the participant or by the employer. Although the information is similar to that generated by using the wage file, it is not fully comparable. Programs that do not use the wage file are noted in the report. Because of the time required to obtain information from employers, the results on the four measures are not fully available for the most recent program year, PY2002-2003. Therefore, the most current year for a full set of results is PY2001-2002.
19 For example, Wagner-Peyser does not provide or purchase any training, so it does not report on that measure.