2006 isat reading and math scores - university of … isat reading and math scores in chicago and...
TRANSCRIPT

2006 ISAT Reading and Math ScoresIn Chicago and the Rest of the State
John Q. Easton
Stuart Luppescu
Todd Rosenkranz
Research Brief
c c s r
CONSORTIUM ONCHICAGO SCHOOL RESEARCHAT THE UNIVERSITY OF CHICAGO
June 2007

2 2006 ISAT Reading and Math Scores
The authors would like to thank the following colleagues and Steering Committee
members for their thoughtful comments and suggestions on this research data
brief: Elaine Allensworth, Elizabeth Hawthorne, George Lowery, Ruanda Garth
McCullough, Melissa Roderick, Penny Bender Sebring, Arie van der Ploeg,
Josie Yanguas, and Kim Zalent.
Thanks to Penny Bender Sebring for shepherding this report through
production.
This research was conducted with core support from the John D. and
Catherine T. MacArthur Foundation and the Spencer Foundation.
Acknowledgements

2ISAT Report Brief
consortium on chicago school research at the university of chicago 1
When the 2006 Illinois Standards Achievement Test (ISAT) scores
were finally released in March 2007, there were many questions
about the comparability of the 2006 test to earlier ISATs. The 2006 ISAT
was a new test—with new items, a new format, new timing requirements,
and new scoring procedures. Understandably, many people were skeptical
about whether it was appropriate to compare 2006 results to prior ones,
especially given the dramatic improvements.1
Because this controversy drew so much attention, perhaps less attention
was paid to a careful analysis of the 2006 results in their own right. This
data brief looks more thoroughly into the 2006 test results for Chicago
Public Schools (CPS).2
First, we look at Chicago results compared to those for all other stu-
dents in the state of Illinois. To do this, we take the statewide data and
remove Chicago students so that we get a mutually exclusive comparison.
We find that the gaps between Chicago students and other students
in thestateof Illinoisaremuchsmaller inuppergradesthan in lower
grades.Inreading,thedifferencebetweenChicagoandtherestofthe
state is one-half as big at eighth grade as it is at third grade. This
suggeststhatstudentsgetprogressivelystrongergoingfromlowerto
uppergradesinChicagoPublicSchools,relativetotherestofIllinois.
Second, we examine these test scores within racial/ethnic groups,
comparing African-American, Latino, White, and Asian students in CPS
to their counterparts in the rest of the state. No Child Left Behind (NCLB)
has made reducing the achievement gap between minority and nonminority

students a national goal. It also has heightened our awareness of differences between demographic groups, and it has suggested the utility of comparing students with similar characteristics to each other.
Our findings show that the big gapsbetween students
inCPSand in the restof thestatedisappearwhenwe
compare racial/ethnic groups in CPS to their counter-
partsintherestofthestate.Infact,somegroupsinCPS
consistentlyoutperformtheircounterpartsintherestof
thestate.Therearestilllargedifferencesinperformance,
however,betweenAfrican-AmericanandLatinostudents
ontheonehandandWhiteandAsianstudentsontheother.
The 2006 ISAT was created with a “vertical” or cross-grade scale, so that all students from grades three through eight are measured on the same underlying scale. Although reading and math have separate scales, they both range from a minimum score of 120 to a
maximum score of 340 to 411, depending on subject and grade level. One of the most important benefits of the vertical scale is that in the future, when subsequent ISAT results become available, we can measure the amount of achievement growth that students make from one grade to the next because the underlying scale is constant and spans the grade levels. Although the Iowa Tests of Basic Skills used in CPS until 2005 had this feature, the old ISAT did not.3
Figure 1 shows the average scale scores in reading and math for CPS students compared to the rest of the students in public schools in Illinois for grades three through eight. A quick glance shows, as expected, that scores increase with the grades. A second glance shows, also as expected, that Chicago students score lower—often one full grade or more—than other Illinois students. For example, note that the average third-grade student outside of Chicago scored higher in reading than the average Chicago fourth-grader.
A more careful look reveals another pattern. In the upper grades, the gap between Chicago students
Figure 1
Chicago 2006 ISAT Average Scale Scores Compared to the Rest of the StateFigure 1. Chicago 2006 ISAT Average Scale Scores Compared to the Rest of the State
ISAT
Rea
ding
Sca
le S
core
ISAT
Mat
h Sc
ale
Scor
e
Grade
CPS
Rest of the State
CPS
Rest of the State
Reading
200
150
300
250
100
50
0
200
150
300
250
100
50
0
Grade
Math
3 4 5 6 7 8 3 4 5 6 7 8
2 2006 ISAT Reading and Math Scores

and other students in Illinois is considerably smaller than it is in the lower grades. In third-grade reading, Chicago students trail the rest of the state by 17 scale score points (191 vs. 208). This is equal to a difference of 0.62 standard deviation units. (See Tables 1 and 2 in the Appendix for detailed statistics, including mean values, standard deviations, number of cases, medians, and scores for the 25th and 75th percentile on the distribution for each grade and subject. Table 3 shows group differences in standard deviation units.) By sixth grade, the difference is down to 12 points (224 vs. 236), or 0.46 SDs. By eighth grade, the difference is 9 points (242 vs. 251), or 0.36 SDs. This is still a sizable difference, but the gap in eighth-grade reading is about one-half the size of the third-grade reading gap.
Although it is not quite so strong, the same pattern holds in math. There is a 21 point difference between Chicago students and students in the rest of the state in grade three (0.72 SDs), an 16 point difference in grade six (0.60 SDs), and a 15 point difference in grade eight (0.52 SDs).
In the past, it had been common for observers to claim that students fell further behind the longer they were enrolled in CPS. The evidence suggests the con-trary, at least relative to Illinois: on the whole, students in upper grades are not as behind as students in lower grades. Rather than showing that CPS students are doing better in the upper grades, this could also mean that students in the rest of the state are doing worse. Although a full test of either assumption requires longitudinal data that is not available, what we show here supports the idea that students do better after more time in CPS elementary schools relative to other students statewide.
In order to take a more complete look at test scores in Chicago compared to the rest of the state, we use the more complex display of a box plot to make detailed comparisons. A box plot shows the full distribution of scores on a given variable—in this case, ISAT reading and math scores. The box marks off the middle 50 percent of the distribution, with the top line indicating the score at the 75th percentile, the line in the middle
Figure 2
How to Read a Box PlotFigure 2. How to Read a Box Plot
Box Plot Example
Scal
e Sc
ore
280
300
240
220
200
180
160
140
120
260
340
360
320
Grade
75th Percentile
Mean50th Percentile(median)
25th Percentile
Scal
e Sc
ore
280
300
240
220
200
180
160
140
120
260
340
360
320
Grade
Adding Cut Scores for State Achievement Levels
Exceeds
Meets
Below
Warning
3 4 5 6 7 8 3 4 5 6 7 8
Research Brief 3

indicating the 50th percentile (median), and the lower line indicating the 25th percentile. The mean (statisti-cal average) is marked by a cross. In Figure 2, the score at the 75th percentile is 233, the score at the median is 204, the score at the 25th percentile is 176, and the mean score is 208. The “whisker” at the top of the box marks the highest score (after removing outliers), so the top whisker spans the top 25 percent of scores; similarly, the lower whisker marks the lowest score and spans the range of the bottom 25 percent.
To provide additional information to the graphics, we include the cut scores that differentiate the four Illinois student performance levels (exceeds standards, meets standards, below standards, and academic warning) from each other. These are shown on the box plot graphs on the right in Figure 2. The topmost line (dark gray) differentiates the scores that exceed state standards from lower scores. Next, the light gray line marks the cut between scores that meet state standards and scores that do not meet state standards. Finally, the yellow line marks the cut scores between academic
warning and below standards. Scores below the yellow line are in the warning category.4
Our initial graph compares the average ISAT scores in reading and math for CPS students and for students in the rest of the state. In Figure 3, we show more detail with the box plots. The two box plots show the distribution of reading scores on the left and math scores on the right. CPS students are shown by the darker box plots; these plots are to the left of the lighter box plots, which show scores of students from the rest of Illinois. Note that the three lines indicate the cut scores that define student performance levels in Illinois.
These three lines allow us to readily estimate the percentage of students in each of the four categories of Illinois student performance levels. In eighth-grade reading, for example, there are no students in the warn-ing category either for CPS or for the rest of Illinois, and about 25 percent of CPS students are below standards. About 75 percent of CPS students meet or exceed state standards, with about 8 percent exceeding them.
Figure 3
Chicago 2006 ISAT Score Distributions: Chicago Compared to the Rest of the State for All StudentsFigure 3. Chicago 2006 Math ISAT Score DistributionsChicago Compared to the Rest of the State for All Students
Reading
Scal
e Sc
ore
280
300
240
220
200
180
160
140
120
260
340
360
320
Grade
Scal
e Sc
ore
280
300
240
220
200
180
160
140
120
260
340
360
320
Grade
Math
Meets-Exceeds CutBelow-Meets CutWarning-Below Cut
3 4 5 6 7 8 3 4 5 6 7 8
CPS
Rest of the State
Meets-Exceeds CutBelow-Meets CutWarning-Below Cut
CPS
Rest of the State
4 2006 ISAT Reading and Math Scores

One can see that the gap narrows going up the grade levels. This is true for average students, for relatively low-performing students at the 25th percentile, and for relatively high-scoring students at the 75th percentile; it is especially true for students at the 25th percentile. In third-grade reading, for example, CPS students lag behind the rest of the state by 23 points (168 vs. 191). By eighth grade, that difference is down to seven points (229 vs. 236). It is encouraging to note that the weakest students are relatively stronger in the upper grades.
One still cannot escape noticing the very large gaps between Chicago and the rest of the state; even as they narrow in the upper grades, they are still large. It is also evident that Chicago scores are at least one grade below the rest of Illinois. For example in eighth-grade reading, where the gap between Chicago and the rest of the state is smallest, Chicago eighth-graders are scoring about the same as seventh-graders in the rest of the state.
Figure 3 shows the ISAT performance of all CPS students in comparison to all students in the rest of the
state. Figure 4 looks at only African-American students. In both reading and math, CPS African-American students are directly compared to African-American students in the rest of Illinois.
Here we see some of the same patterns for African-Americans students that we saw for all students in Figure 3. There is a gap in the lower grades between African-American students in Chicago compared to those in the rest of the state in both reading and in math. In reading the third-grade gap is seven points, favoring African-American students outside of Chicago. Note that this is considerably smaller than the 17 point gap for all students shown earlier. By eighth grade, that gap has not only disappeared but reversed, with Chicago African-American students outscoring their counterparts in the rest of Illinois by one point. In standard deviation units, the difference at grade three is 0.27 standard deviation units lower for African-American students in CPS. By eighth grade, CPS African-American students score 0.06 standard deviations units higher. (See Tables 1 and 2 in the
Figure 4
Chicago 2006 ISAT Score Distributions: Chicago Compared to the Rest of the State for African-American StudentsFigure 4. Chicago 2006 Math ISAT Score DistributionsChicago Compared to the Rest of the State for Black Students
Reading
Scal
e Sc
ore
280
300
240
220
200
180
160
140
120
260
340
360
320
Grade
Scal
e Sc
ore
280
300
240
220
200
180
160
140
120
260
340
360
320
Grade
Math
Meets-Exceeds CutBelow-Meets CutWarning-Below Cut
3 4 5 6 7 8 3 4 5 6 7 8
CPS
Rest of the State
Meets-Exceeds CutBelow-Meets CutWarning-Below Cut
CPS
Rest of the State
Research Brief 5

Appendix for detailed information. Table 3 includes score gaps in standard deviation units.) In math, there is a 10 point gap in third grade between African-American students in CPS compared to those in the rest of the state. By eighth grade, that gap is reduced to slightly over two points.
The pattern holds at the 25th and 75th percentiles for reading as well. Chicago’s African-American stu-dents at the 25th percentile (the bottom line on the box plot) scored much lower than African-American students at the 25th percentile in the rest of the state in the third grade. By eighth grade, this gap is gone (in fact, it is reversed). Similarly, Chicago’s African-American students at the 75th percentile are below their counterparts in the rest of the state in the third grade, but they are equal to them in the eighth grade.
Scores for African-American students in Chicago and in the rest of the state are quite low compared to scores for students of other racial/ethnic backgrounds. In eighth-grade reading, for example, African-American students in CPS score 20 points lower than
White CPS students. This is the “achievement gap” that NCLB is rightly concerned about, which is evident not only in test scores but in other outcome measures as well, including graduation rates.5 Yet if we compare CPS scores to other scores in the state or nation, we get a substantially different picture of the relative per-formance of CPS students by making our comparison within similar groups of students.
The same pattern prevails for Latino students (see Figure 5), and this time it is even somewhat more favorable for Chicago students. In reading, Chicago Latino students in third grade underperform Latinos in the rest of Illinois by about three score points. For eighth-graders, Chicago Latino students outperform their counterparts by four score points. In math, there was a bigger gap of six points at third grade; this gap favored Latino students outside of Chicago over Latino students in CPS. For eighth-graders, the gap is less than 1 point. Note also the performance among students at the 25th percentile. In both reading and math, CPS Latino students are below their counterparts in the third
Figure 5
Chicago 2006 ISAT Score Distributions: Chicago Compared to the Rest of the State for Latino StudentsFigure 5. Chicago 2006 Math ISAT Score DistributionsChicago Compared to the Rest of the State for Latino Students
Reading
Scal
e Sc
ore
280
300
240
220
200
180
160
140
120
260
340
360
320
Grade
Scal
e Sc
ore
280
300
240
220
200
180
160
140
120
260
340
360
320
Grade
Math
Meets-Exceeds CutBelow-Meets CutWarning-Below Cut
3 4 5 6 7 8 3 4 5 6 7 8
CPS
Rest of the State
Meets-Exceeds CutBelow-Meets CutWarning-Below Cut
CPS
Rest of the State
6 2006 ISAT Reading and Math Scores

grade and higher than they are in the eighth grade. It is worth observing, however, that Latino students
still score considerably lower than both White and Asian students in CPS and in the rest of the state.
White CPS students are a relative minority, making up only about 9 percent of the ISAT population. White students are the majority across the rest of Illinois, where they account for nearly 70 percent of the ISAT population.
Chicago White students perform well on the ISAT in comparison to White students in the rest of the state. (See Figure 6). In reading, in fact, on average they consistently score as well as or better than their peers statewide. In third grade, the gap favors Chicago White students. In eighth grade, that gap is still in favor of CPS and is slightly higher. Chicago’s White students at the 25th percentile are behind their counterparts in the third grade, but ahead of them in the eighth grade. White students at the 75th percentile ranking are con-sistently ahead of or equal to their peers statewide.
The pattern is somewhat different in math. Average
White students in CPS score about the same as average White students in the rest of the state at all grade levels. White students at the 25th percentile in CPS are a little behind similar students in the rest of the state at all grade levels, but are less behind in eighth grade than in third. White students at the 75th per-centile in CPS are consistently ahead.
There are relatively few Asian students in CPS or in the rest of Illinois. They make up about 3 percent of the tested population in Chicago and 4 percent of the tested population in the rest of the state. On the whole, Asian students score well on the ISAT; they outperform students in all other racial/ethnic groups in both reading and math. (See Figure 7).
We see the same trend for Asian students that we see with other groups in reading, but not in math. In the third grade, Asian students in Chicago score lower in reading than Asian students in the rest of Illinois; and in eighth grade, Asian students in Chicago score about the same as other groups of students.
In math, CPS Asian students are outperformed at
Figure 6
Chicago 2006 ISAT Score Distributions: Chicago Compared to the Rest of the State for White StudentsFigure 6. Chicago 2006 Math ISAT Score DistributionsChicago Compared to the Rest of the State for White Students
Reading
Scal
e Sc
ore
280
300
240
220
200
180
160
140
120
260
340
360
320
Grade
Scal
e Sc
ore
280
300
240
220
200
180
160
140
120
260
340
360
320
Grade
Math
Meets-Exceeds CutBelow-Meets CutWarning-Below Cut
3 4 5 6 7 8 3 4 5 6 7 8
CPS
Rest of the State
Meets-Exceeds CutBelow-Meets CutWarning-Below Cut
CPS
Rest of the State
Research Brief 7

every grade except seventh by Asian students in the rest of the state. This finding, like others shown here, probably runs counter to many expectations or stereo- types about test score performance. It is true that Asian students in CPS score high in math—in fact,
Figure 7
Chicago 2006 ISAT Score Distributions: Chicago Compared to the Rest of the State for Asian StudentsFigure 7. Chicago 2006 Math ISAT Score DistributionsChicago Compared to the Rest of the State for Asian Students
Reading
Scal
e Sc
ore
280
300
240
220
200
180
160
140
120
260
340
360
320
Grade
Scal
e Sc
ore
280
300
240
220
200
180
160
140
120
260
340
360
320
Grade
Math
Meets-Exceeds CutBelow-Meets CutWarning-Below Cut
3 4 5 6 7 8 3 4 5 6 7 8
CPS
Rest of the State
Meets-Exceeds CutBelow-Meets CutWarning-Below Cut
CPS
Rest of the State
considerably higher than African-American, Latino, and White students. But unlike those students, when we make comparisons to similar students statewide we see lower, rather than higher, scores.
8 2006 ISAT Reading and Math Scores

2
consortium on chicago school research at the university of chicago 9
Conclusion
This simple analysis of 2006 ISAT scores brings to light several interesting
findings that are not widely known about CPS test performance.
First, CPS relative performance is better in upper grades than in lower
grades in comparison to students in public schools in the rest of Illinois. This
is especially true in reading and especially true among African-American
and Latino students, who constitute nearly 90 percent of CPS enrollment.
This finding suggests that longer enrollment in CPS leads to better relative
performance, not worse as was suggested previously. We don’t have longitu-
dinal data to fully test our assertion, but the data show a strong suggestive
pattern that this is the case.
A second somewhat unexpected finding is that reading performance in
CPS looks stronger than math performance in comparison to the rest of the
state. Typically, CPS elementary students have scored higher in math than
in reading on both the ISAT and the Iowa Tests of Basic Skills.6 White stu-
dents are the exception, but students of other racial/ethnic groups are behind
their counterparts in the rest of the state at all grade levels in math. The gaps
decrease in the upper grades, but not as significantly as they do in reading.
The most compelling finding here is that when we disaggregate ISAT
reading scores by race/ethnicity and compare students in CPS to their coun-
terparts in the rest of Illinois, CPS student performance looks more positive
than what we are accustomed to seeing. In the upper grades, in fact, CPS
students often look better. For example, this finding is true for African-
American and Latino students in eighth-grade reading. It is also true for
White students at every grade level in reading. The findings tend to hold for
weak, average, and strong students in CPS as well. The math findings aren’t
as positive; CPS students trail their counterparts across grades. It is still the
case, however, that the gap narrows in the upper grades.
African-American and Latino students are the two largest racial/ethnic groups in Chicago Public Schools. They score lower on the ISAT than White and Asian students, not only in Chicago but across the rest of the state as well. The rest of Illinois has higher ISAT scores than CPS, primarily because there is a larger enrollment of White students and a lower enrollment of racial/ethnic groups that have been long underserved by our educational systems. CPS would actually outscore the rest of the state on the ISAT if its enrollment had the same racial composition. Student performance in CPS looks remarkably better than typically portrayed when
we make these group-to-group comparisons. Perhaps these findings also suggest that CPS does relatively better with traditionally underserved populations than the rest of the state does and that ways to improve can be found in Chicago rather than elsewhere.
We cannot ignore, however, the gaps between African-American and Latino students on the one hand and White and Asian students on the other. Although CPS looks good in comparison to the rest of the state, both CPS and Illinois exhibit large achievement gaps between minority and nonminority students that need to be redressed.
Endnotes1 See, for example: Dell’Angela, Tracey. 2007. City grade schools shine on tests. Chicago Tribune, March 6. Golab, Art, and Rosalind Rossi. 2007. Highest test scores go to Chicago schools. Chicago Sun-Times, March 6.
Test scores better, but some question results. 2007. NBC-5 News, March 6. 2 For more technical information about the 2006 test and a description of how the old and new tests were linked, see the Illinois State Board of Education Assessment Division, “Report on the ISAT/SAT-10 Bridge Study and Development of the 2006 ISAT Reporting Scales.” March 17, 2006. Available online at http://isbe.net/assessment/pdfs/Bridge_study.pdf.
3 The old Illinois Standards Achievement Test only tested third-, fifth-, and eighth-graders, another factor that made it difficult to measure annual achievement growth in students. 4 Cut scores document from the Illinois State Board of Education. Available online at http://isbe.net/assessment/pdfs/cut_points_07.pdf.5 Allensworth, Elaine. 2005. Graduation and dropout trends in Chicago: A look at cohorts of students from 1991 to 2004. Chicago: Consortium on Chicago School Research at the University of Chicago.6 Chicago Public Schools test score reports. Available online at http://research.cps.k12.il.us/cps/accountweb/Reports/citywide.html.
10 2006 ISAT Reading and Math Scores
Appendix
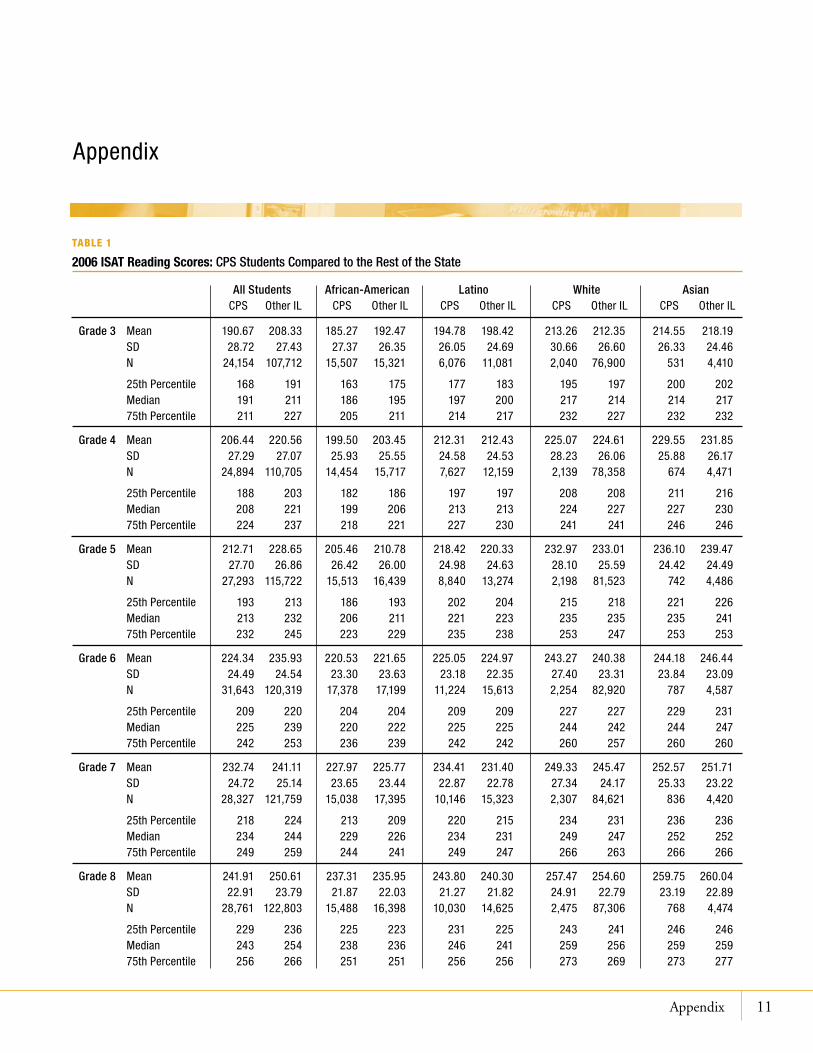
All Students African-American Latino White Asian CPS OtherIL CPS OtherIL CPS OtherIL CPS OtherIL CPS OtherIL
Grade 3 Mean 190.67 208.33 185.27 192.47 194.78 198.42 213.26 212.35 214.55 218.19 SD 28.72 27.43 27.37 26.35 26.05 24.69 30.66 26.60 26.33 24.46 N 24,154 107,712 15,507 15,321 6,076 11,081 2,040 76,900 531 4,410
25thPercentile 168 191 163 175 177 183 195 197 200 202 Median 191 211 186 195 197 200 217 214 214 217 75thPercentile 211 227 205 211 214 217 232 227 232 232
Grade 4 Mean 206.44 220.56 199.50 203.45 212.31 212.43 225.07 224.61 229.55 231.85 SD 27.29 27.07 25.93 25.55 24.58 24.53 28.23 26.06 25.88 26.17 N 24,894 110,705 14,454 15,717 7,627 12,159 2,139 78,358 674 4,471
25thPercentile 188 203 182 186 197 197 208 208 211 216 Median 208 221 199 206 213 213 224 227 227 230 75thPercentile 224 237 218 221 227 230 241 241 246 246
Grade 5 Mean 212.71 228.65 205.46 210.78 218.42 220.33 232.97 233.01 236.10 239.47 SD 27.70 26.86 26.42 26.00 24.98 24.63 28.10 25.59 24.42 24.49 N 27,293 115,722 15,513 16,439 8,840 13,274 2,198 81,523 742 4,486
25thPercentile 193 213 186 193 202 204 215 218 221 226 Median 213 232 206 211 221 223 235 235 235 241 75thPercentile 232 245 223 229 235 238 253 247 253 253
Grade 6 Mean 224.34 235.93 220.53 221.65 225.05 224.97 243.27 240.38 244.18 246.44 SD 24.49 24.54 23.30 23.63 23.18 22.35 27.40 23.31 23.84 23.09 N 31,643 120,319 17,378 17,199 11,224 15,613 2,254 82,920 787 4,587
25thPercentile 209 220 204 204 209 209 227 227 229 231 Median 225 239 220 222 225 225 244 242 244 247 75thPercentile 242 253 236 239 242 242 260 257 260 260
Grade 7 Mean 232.74 241.11 227.97 225.77 234.41 231.40 249.33 245.47 252.57 251.71 SD 24.72 25.14 23.65 23.44 22.87 22.78 27.34 24.17 25.33 23.22 N 28,327 121,759 15,038 17,395 10,146 15,323 2,307 84,621 836 4,420
25thPercentile 218 224 213 209 220 215 234 231 236 236 Median 234 244 229 226 234 231 249 247 252 252 75thPercentile 249 259 244 241 249 247 266 263 266 266
Grade 8 Mean 241.91 250.61 237.31 235.95 243.80 240.30 257.47 254.60 259.75 260.04 SD 22.91 23.79 21.87 22.03 21.27 21.82 24.91 22.79 23.19 22.89 N 28,761 122,803 15,488 16,398 10,030 14,625 2,475 87,306 768 4,474
25thPercentile 229 236 225 223 231 225 243 241 246 246 Median 243 254 238 236 246 241 259 256 259 259 75thPercentile 256 266 251 251 256 256 273 269 273 277
Table 1
2006 ISAT Reading Scores: CPS Students Compared to the Rest of the State
Appendix 11

All Students African-American Latino White Asian CPS OtherIL CPS OtherIL CPS OtherIL CPS OtherIL CPS OtherIL
Grade 3 Mean 198.67 219.34 191.69 201.74 204.36 210.05 222.24 223.52 230.00 233.85 SD 29.11 28.14 27.01 26.18 26.22 25.21 30.13 27.09 27.79 27.70 N 25,152 110,467 15,485 15,336 6,079 11,070 2,037 76,873 531 4,407 25thPercentile 178 200 173 183 187 193 201 205 212 217 Median 198 219 190 201 203 209 223 223 231 233 75thPercentile 219 236 209 219 223 228 243 240 247 251
Grade 4 Mean 214.82 232.45 206.40 214.54 221.49 225.07 234.11 236.38 244.25 248.25 SD 27.00 27.00 24.16 24.42 23.54 23.90 27.62 25.51 26.71 28.35 N 25,819 113,346 14,418 15,713 7,622 12,159 2,136 78,338 672 4,470
25thPercentile 195 215 188 196 206 209 216 219 226 229 Median 215 233 206 213 223 224 235 237 243 247 75thPercentile 233 251 223 231 237 241 253 253 259 267
Grade 5 Mean 222.97 242.79 213.85 222.47 229.45 234.43 244.79 247.26 257.56 262.19 SD 27.00 30.00 22.42 24.31 24.34 24.99 31.29 29.19 32.39 32.56 N 28,197 118,230 15,487 16,414 8,842 13,276 2,192 81,512 742 4,483
25thPercentile 203 222 198 205 211 217 222 227 234 239 Median 219 241 210 219 228 233 243 246 257 261 75thPercentile 239 261 227 237 245 250 267 267 281 285
Grade 6 Mean 235.23 251.70 227.85 233.14 239.43 241.83 255.70 256.43 266.55 270.83 SD 25.00 28.00 21.94 23.35 23.28 23.16 29.46 26.90 29.04 31.17 N 32,579 122,585 17,347 17,193 11,179 15,606 2,252 82,902 787 4,583
25thPercentile 216 232 211 216 222 225 235 238 246 250 Median 232 250 225 231 238 240 254 255 267 270 75thPercentile 250 270 241 247 254 255 275 275 287 291
Grade 7 Mean 245.21 260.31 237.22 239.12 248.16 248.52 266.87 265.77 281.48 281.24 SD 27.00 31.00 23.39 24.22 24.39 25.36 33.07 29.92 33.47 33.93 N 29,132 123,746 15,001 17,373 10,123 15,314 2,308 84,623 835 4,420
25thPercentile 226 238 221 222 232 230 244 246 258 258 Median 243 258 235 237 247 247 264 264 280 280 75thPercentile 261 280 251 255 263 264 288 285 305 305
Grade 8 Mean 258.08 273.34 250.52 253.21 261.57 261.00 277.85 278.14 288.90 295.19 SD 26.00 30.00 22.37 23.48 23.66 24.28 30.55 29.38 31.18 36.05 N 29,598 124,545 15,431 16,383 10,019 14,625 2,468 87,275 768 4,472
25thPercentile 240 251 235 237 245 244 256 258 268 270 Median 255 272 248 251 259 259 276 276 287 291 75thPercentile 273 291 265 267 276 275 298 295 308 318
Table 2
2006 ISAT Math Scores: CPS Students Compared to the Rest of the State
12 2006 ISAT Reading and Math Scores

Appendix 13
Table 3
2006 ISAT Reading and Math Standardized Differences Scores
Reading Standardized Differences
All Students African-American Latino White Asian Grade 3 -0.62 -0.27 -0.14 0.03 -0.15Grade 4 -0.51 -0.15 0.00 0.02 -0.09Grade 5 -0.57 -0.20 -0.08 0.00 -0.14Grade 6 -0.46 -0.05 0.00 0.12 -0.10Grade 7 -0.33 0.09 0.13 0.16 0.04Grade 8 -0.36 0.06 0.16 0.13 -0.01
Math Standardized Differences
All Students African-American Latino White Asian
Grade 3 -0.72 -0.37 -0.22 -0.05 -0.14Grade 4 -0.66 -0.33 -0.15 -0.09 -0.14Grade 5 -0.67 -0.36 -0.20 -0.08 -0.14Grade 6 -0.60 -0.23 -0.10 -0.03 -0.14Grade 7 -0.50 -0.08 -0.01 0.04 0.01Grade 8 -0.52 -0.12 0.02 -0.01 -0.18
ChicagoMean–RestofILMean
StandardizedDifference= PooledStandardDeviation
AnegativedifferenceindicateshigherscoresintherestofIllinois.
ApositivedifferenceindicateshigherscoresinCPS.
AbouttheAuthors
JohnQ.EastonJohn Q. Easton is Executive Director of the Consortium on Chicago School Research (CCSR). He has been affiliated with CCSR since its inception in 1990 and led its first research study. Much of Easton’s research at CCSR examines trends in achievement test scores and the use of test scores in school improvement and school accountability efforts. He is coauthor of a recent study on the relationship between freshman-year academic performance and high school graduation. Easton holds a PhD in Measurement, Evaluation, and Statistical Analysis from the University of Chicago.
StuartLuppescuStuart Luppescu is Chief Psychometrician at the Consortium. In his 15 years at CCSR, he has worked on projects involving measure development, survey data analysis, test equating, and studies of achieve-ment test trends. He holds a PhD in Educational Measurement from the University of Chicago.
ToddRosenkranzTodd Rosenkranz is the Data Archivist and Deputy Psychometrician at the Consortium. In his eight years at CCSR, he has done extensive work on test trends for the ITBS, ISAT, TAP, and PSAE. He has an MA in Public Policy from the Irving B. Harris Graduate School of Public Policy Studies at the University of Chicago.
This report reflects the interpretation of the authors.Although the Consortium’s Steering Committee providedtechnicaladviceandreviewedearlierversions,noformalendorsementbytheseindividuals,organizations,orthefullConsortiumshouldbeassumed.
ThisreportwasproducedbytheConsortium’spublicationsandcommunicationsstaff.
Editing and project management by the University Publications Office
Graphic Design by Jeff Hall Design


2
consortium on chicago school research at the university of chicago �
Steering CommitteeGeorge Lowery, Co-chair Roosevelt University
Josie Yanguas, Co-chair Illinois Resource Center
Institutional Members
Clarice Berry Chicago Principals and Administrators Association
Daniel T. Bugler Barbara Eason-Watkins Christy Harris Chicago Public Schools
Marilyn Stewart Chicago Teachers Union
Cleo A. Boswell Illinois State Board of Education
Individual Members
Gina Burkhardt Learning Point Associates
Elizabeth Hawthorne Change Consultancy
Timothy Knowles Center for Urban School Improvement
Janet Knupp Chicago Public Education Fund
Mark Larson National Louis University
Carol D. Lee Northwestern University
Deidra Lewis City Colleges of Chicago
Peter Martinez University of Illinois at Chicago
Ruanda Garth McCullough Loyola University
Samuel Meisels Erikson Institute
James Pellegrino University of Illinois at Chicago
Stephen Raudenbush University of Chicago
James Spillane Northwestern University
Kim Zalent Business Professional People for the Public Interest
Steve Zemelman Illinois Network of Charter Schools
Martha Zurita Latino Youth Alternative High School
The Consortium on Chicago School Research (CCSR) at the University of Chicago aims to conduct research of high technical quality that can inform
and assess policy and practice in the Chicago Public Schools. By broadly engag-ing local leadership in our work, and presenting our findings to diverse audiences, we seek to expand communication among researchers, policy makers, and practi- tioners. CCSR encourages the use of research in policy action, but does not argue for particular policies or programs. Rather, we believe that good policy is most likely to result from a genuine competition of ideas, informed by the best evidence that can be obtained.
Our Mission
Consortium on Chicago School Research
DirectorsJohn Q. Easton Executive Director Consortium on Chicago School Research
Elaine Allensworth Consortium on Chicago School Research
Melissa Roderick University of Chicago
Penny Bender Sebring Consortium on Chicago School Research

ccsr.uchicago.edu 1313 East 60th Street Chicago, Illinois 60637 T 773-702-3364 F 773-702-2010
7383347809789
ISBN 978-0-9787383-3-451000 >
c c s r
CONSORTIUM ONCHICAGO SCHOOL RESEARCHAT THE UNIVERSITY OF CHICAGO