2005 wheat research verification program - uaex.edu wheat research verification program ... direct...
TRANSCRIPT

2005 Wheat Research Verification Program
Conducted by: Mr. Jack ‘Trey’ Reaper III, WRVP Coordinator Mr. J. Dwayne Beaty, Former WRVP Coordinator Dr. Jason P. Kelley, Extension Agronomist Dr. Rob Hogan, Extension Economist
County Agents Cooperators County Mr. Gus Wilson Mr. Jack Shell Ashley Ms. Carey Wall Mr. David Crabtree Crawford Mr. Wes Kirkpatrick Mr. Eric Wright Desha Mr. Steven Sheets Schluterman Brothers Logan Mr. Reggie Talley Carroll Brothers Monroe Mr. Craig Allen Mr. Roger Bradley Poinsett Mr. Mike Andrews Mr. David Smith Randolph
Acknowledgements: Agricultural Experiment Station, Fayetteville Dr. Gene Milus, Department of Plant Pathology Dr. Robert Bacon, Department of Crop, Soil, and Environmental Sciences Extension Service Specialists Dr. Rick Cartwright, Extension Plant Pathologist Mr. Cliff Coker, Extension Plant Pathologist Dr. Leo Espinoza, Extension Soils Specialist Dr. Dennis Gardisser, Extension Agricultural Engineer
Mr. Gary Huitink, Extension Agricultural Engineer Dr. Gus Lorenz, Extension Entomologist Dr. Terry Kirkpatrick, Extension Plant Pathologist Mr. Phil Tacker, Extension Agricultural Engineer Special acknowledgement to the members of the Arkansas Wheat Promotion Board:
Mr. Morris Crandall Mr. Davey Farabough Mr. David Jessup Mr. Cal McCastlain Mr. Jackie Prince Mr. Terry Dabbs Mr. Blake Swears Mr. William Turner Mr. Barry Walls
1
University of Arkansas, United States Department of Agriculture and County Governments Cooperating.
The Arkansas Cooperative Extension Service offers its programs to all eligible persons regardless of race, color, national origin, religion, gender, age, disability, marital or veteran status, or any other legally protected status, and is an Equal
Opportunity Employer.
Abstract
The 2005 Wheat Research Verification Program (WRVP) was implemented by the University of Arkansas Cooperative Extension Service on 7 producer fields located in Ashley, Crawford, Desha, Logan, Monroe, Poinsett and Randolph Counties. Although 16 WRVP fields were planned, frequent rains throughout October and November delayed planting in the central and northeast parts of the state. This decrease in WRVP fields is in direct relation to the decreased wheat acreage in Arkansas this past year. Cooperators from the counties above selected 7 varieties from a short list provided by the agent and research verification coordinator. These varieties were selected based upon performance and characteristics determined by the University of Arkansas variety tests. Soil types ranged from sandy loam to silty clay, with previous crops of corn, soybean, rice, and peas. Seeding dates ranged from October 1 through November 9, with seeding rates varying from 100 to 180 lbs/ac. Four fields were drill seeded and three were broadcast seeded. Cooperators in Ashley and Desha Counties utilized a bedded seedbed to provide multiple drain furrows that became critical in such a wet growing season. Only two fields in the WRVP were treated with herbicides. Leaf and stripe rusts were common in most WRVP fields. More importantly, these diseases were noticed at high levels much earlier in the growing season. The timing of a fungicide application was critical to prevent a sequential application. Careful weekly scouting prevented any WRVP field from being treated twice. Four of seven WRVP were treated with either Quilt or Propimax for stripe rust control. Insects were also not a factor throughout the season; however, many fields showed the typical minor symptoms of barley yellow dwarf virus (BYDV), which is vectored by aphids. Although most fields experienced wet weather for most of the growing season, dry weather throughout May and early June allowed for a timely harvest. Harvest dates ranged from June 3 through June 14. Average yield for the WRVP was 70.5 bu/ac, compared to a state average yield of 50 bu/ac on only 175,000 harvested acres. The Ashley and Desha County fields, the only bedded fields in the program, had exceptional yields of 91.7 and 91.0 bu/ac, respectively. These fields also had the highest amount of seasonal rainfall. The dry May also improved test weight over the few previous years. The average test weight was 58.4 lb/bu Improved variety selection, good surface drainage, timely fertilization, and effective pest management practices have been frequently mentioned by producers and county agents as factors which make WRVP fields more profitable and/or produce higher yields. Economic analysis was conducted using a budget generator to estimate specific costs of production for each field. The price used was the state average wheat price for June delivery based upon June prices at elevators throughout eastern Arkansas and the Arkansas River Valley. Five of the 7 WRVP fields resulted in a positive net return. Fertilizer remains the greatest input cost associated with wheat production in Arkansas. The Wheat Research Verification Program continues to demonstrate that Extension’s research-based recommendations can produce profitable, high yielding wheat across a wide range of conditions and soil types. Over a 19-year period, the WRVP has averaged 13.3 bu/ac greater than the state average yield. The program is funded by the wheat checkoff dollars and administered through the Arkansas Wheat Promotion Board.
2

Introduction
The Wheat Research Verification Program (WRVP) represents an interdisciplinary effort of farmers, county Extension agents, Extension specialists, and researchers committed to improving the profitability of wheat production in Arkansas. The WRVP program began in 1986 under the direction of the University of Arkansas Cooperative Extension Service. The Arkansas Wheat Promotion Board has allocated the funding necessary for the WRVP program each year since its inception. The WRVP program is designed as on-farm demonstrations of all the research-based recommendations required to grow wheat profitably in Arkansas. The WRVP program is part of the University of Arkansas Extension Service's goal of helping wheat producers make economically, agronomically, and environmentally sound decisions on their farms. The specific objectives of the program are: 1. To verify research-based recommendations for profitable wheat production in
all wheat producing areas of Arkansas. 2. To develop a database for economic analysis of all aspects of wheat production. 3. To demonstrate that consistently high yields of wheat can be produced
economically with the use of available technology and inputs. 4. To identify specific problems and opportunities in Arkansas wheat production
for further investigation. 5. To promote timely cultural and management practices among all wheat
farmers. 6. To provide training and assistance to county agents with limited expertise in
wheat production.
3

2005 Wheat Research Verification Program Fields
Eleven farms enrolled a field in the Wheat Research Verification Program in the fall of 2003. The fields were located on commercial wheat farms and ranged in size from 30 to 60 acres. The locations of the WRVP fields are shown in Figure 1, designated according to the WRVP coordinator responsible for each field.
Crawford
Logan
Pulaski
Randolph
Greene
Clay
Mississippi
Cross
Woodruff
Monroe
Desha
Trey Reaper Dwayne Beaty
Figure 1. Location of the 2005 WRVP Fields
Poinsett
Crittenden
St. Francis
Ashley
Jackson
Not planted due to weather
4

The program is conducted for two consecutive years with each grower/cooperator. When an interested cooperator was identified, the cooperator, county agent, and specialist selected a field to enroll in the program in the fall of 2004. Prospective fields are required to meet the following criteria specified by the WRVP advisory committee: 1. Field size of at least 15 acres. 2. A yield potential equal to or greater than the county average. 3. A soil pH above 5.6. 4. A previous crop of corn, sorghum (without atrazine), soybeans, summer fallow,
rice, or pasture. 5. The potential for good surface drainage. A representative soil sample of the field was analyzed and the field was inspected by the coordinator and county agent. When the soil test results were obtained, the county agent, cooperator, and coordinator met to discuss recommended practices for seedbed preparation, wheat variety selection, and fertilization. All management decisions were made based on current Extension recommendations. For situations where there were no specific recommendations included in the field plan, a member of the Wheat Verification Committee was consulted. As often as practical, members of the committee were consulted and updated on the condition of the fields. Once seedbed preparation began, the day-to-day management decisions were made by the county agent and coordinator with assistance from appropriate specialists and researchers as conditions warranted. Data were collected on stand counts, growth stage, tillering, heads per square foot, diseases, weeds, and insects during the course of the growing season. Grain yields and test weights were determined by elevator weigh tickets on all WRVP fields. Harvest loss was estimated by determining the number of grains per square foot remaining after harvest. Twenty-one grains per square foot is equal to the threshold value of one bushel per acre. The 2005 WRVP fields had low harvest loss estimates. An economic analysis of each field was conducted by an Extension economist and is included in the appendix of this report. To facilitate comparisons among fields and to allow year-to-year comparisons, average costs of certain operations are computed and used to generate the budgets in this report.
5

Results and Discussion
The variety, field size and preplant fertilizer for each WRVP field are listed in Table 1. The average field size was 60.9 acres ranging from 30 to 100 acres.
Table 1. Variety, Field Size, and Preplant Fertilizer, WRVP Fields 2005
County Variety Field Size (Acres)
Preplant Fertilizer1
(lbs/ac) Ashley Terral TV 8450 100 0-50-75
Crawford Delta King 9410 45 2.0 tons chicken litter Desha Terral LA 841 30 0-60-80 Logan Pioneer 26R15 40 27-69-0
Monroe Pat 76 30-80-80 Poinsett Delta King 9216 95 30-60-60
Randolph Croplan 554W 40 40-40-0 1Nitrogen – Phosphorus – Potassium.
Coordinators of the Wheat Research Verification Program met with the Extension Wheat Agronomist to develop a short list of varieties suited to each potential verification field’s environment. Initially, 16 WRVP fields were planned for the 2005 growing season. Unfortunately, an unusually wet fall prevented half of these fields from being planted. Although the Jackson County field was planted, consistent showers and cool temperatures resulted in a less than adequate stand causing the cooperator to abandon the field. For those fields that were planted, the Wheat Update, a summary of variety trials conducted by the University of Arkansas Agricultural Experiment Station, was used to obtain yield, physiological, and disease data for certain varieties on a range of soil types. The producer made the final variety selection using those on the list provided by the county agent. The best overall disease resistance and yield history is sought in variety selection. Seven varieties were planted in the WRVP in the fall of 2004, reflecting the specific needs of different soil types, geographic regions, and the overall management strategy employed by the cooperators. The preplant fertilizer was applied according to soil test recommendations. The fields in Logan, Monroe, Poinsett, and Randolph Counties received supplemental fall nitrogen due to previous crops of either corn or rice. All others received mixed fertilizer. In most cases, it is expedient and practical to apply fertilizer for both wheat and double-cropped soybeans in the fall. Thus, the fertilizer applied may not accurately reflect the needs of the wheat crop alone. This is especially true for the fields where large amounts of potash and phosphorus were applied. Furthermore, the cost of preplant fertilizer was assigned to wheat according to the following schedule: 100% of nitrogen applied and 50% of phosphorus and potash. Table 2 shows the soil classification for each WRVP field. These fields consisted of silty clay and silt loam soils. The range in soil types reflects the range of soils where wheat could be planted in Arkansas during the fall of 2004.
6
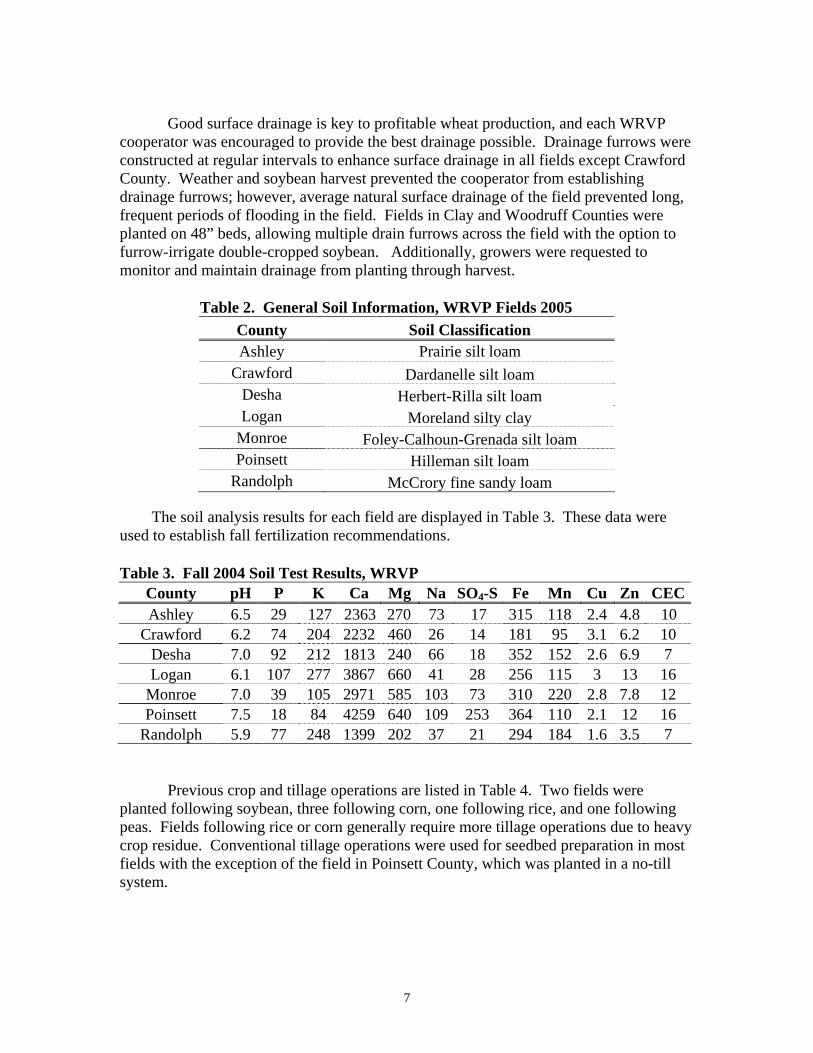
Good surface drainage is key to profitable wheat production, and each WRVP cooperator was encouraged to provide the best drainage possible. Drainage furrows were constructed at regular intervals to enhance surface drainage in all fields except Crawford County. Weather and soybean harvest prevented the cooperator from establishing drainage furrows; however, average natural surface drainage of the field prevented long, frequent periods of flooding in the field. Fields in Clay and Woodruff Counties were planted on 48” beds, allowing multiple drain furrows across the field with the option to furrow-irrigate double-cropped soybean. Additionally, growers were requested to monitor and maintain drainage from planting through harvest.
Table 2. General Soil Information, WRVP Fields 2005 County Soil Classification Ashley Prairie silt loam
Crawford Dardanelle silt loam Desha Herbert-Rilla silt loam Logan Moreland silty clay
Monroe Foley-Calhoun-Grenada silt loam Poinsett Hilleman silt loam
Randolph McCrory fine sandy loam The soil analysis results for each field are displayed in Table 3. These data were used to establish fall fertilization recommendations. Table 3. Fall 2004 Soil Test Results, WRVP
County pH P K Ca Mg Na SO4-S Fe Mn Cu Zn CECAshley 6.5 29 127 2363 270 73 17 315 118 2.4 4.8 10
Crawford 6.2 74 204 2232 460 26 14 181 95 3.1 6.2 10 Desha 7.0 92 212 1813 240 66 18 352 152 2.6 6.9 7 Logan 6.1 107 277 3867 660 41 28 256 115 3 13 16
Monroe 7.0 39 105 2971 585 103 73 310 220 2.8 7.8 12 Poinsett 7.5 18 84 4259 640 109 253 364 110 2.1 12 16
Randolph 5.9 77 248 1399 202 37 21 294 184 1.6 3.5 7
Previous crop and tillage operations are listed in Table 4. Two fields were planted following soybean, three following corn, one following rice, and one following peas. Fields following rice or corn generally require more tillage operations due to heavy crop residue. Conventional tillage operations were used for seedbed preparation in most fields with the exception of the field in Poinsett County, which was planted in a no-till system.
7
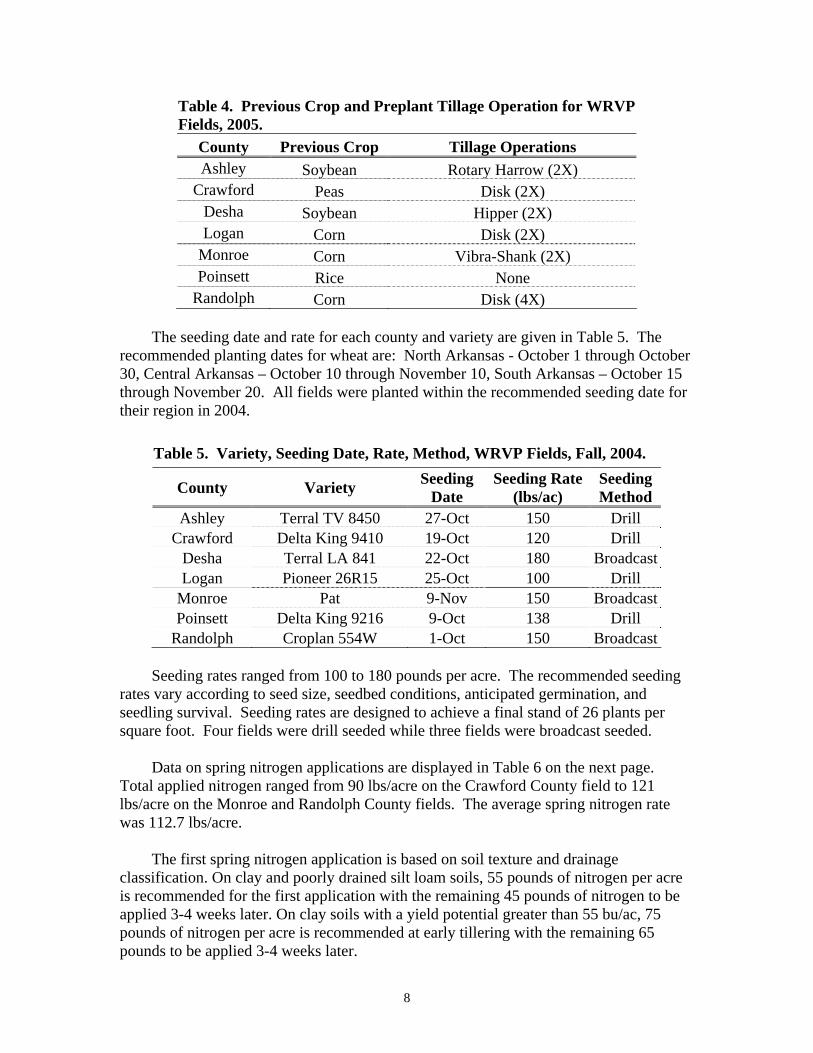
Table 4. Previous Crop and Preplant Tillage Operation for WRVP Fields, 2005.
County Previous Crop Tillage Operations Ashley Soybean Rotary Harrow (2X)
Crawford Peas Disk (2X) Desha Soybean Hipper (2X) Logan Corn Disk (2X)
Monroe Corn Vibra-Shank (2X) Poinsett Rice None
Randolph Corn Disk (4X) The seeding date and rate for each county and variety are given in Table 5. The recommended planting dates for wheat are: North Arkansas - October 1 through October 30, Central Arkansas – October 10 through November 10, South Arkansas – October 15 through November 20. All fields were planted within the recommended seeding date for their region in 2004.
Table 5. Variety, Seeding Date, Rate, Method, WRVP Fields, Fall, 2004.
County Variety Seeding Date
Seeding Rate (lbs/ac)
Seeding Method
Ashley Terral TV 8450 27-Oct 150 Drill Crawford Delta King 9410 19-Oct 120 Drill
Desha Terral LA 841 22-Oct 180 BroadcastLogan Pioneer 26R15 25-Oct 100 Drill
Monroe Pat 9-Nov 150 BroadcastPoinsett Delta King 9216 9-Oct 138 Drill
Randolph Croplan 554W 1-Oct 150 Broadcast Seeding rates ranged from 100 to 180 pounds per acre. The recommended seeding rates vary according to seed size, seedbed conditions, anticipated germination, and seedling survival. Seeding rates are designed to achieve a final stand of 26 plants per square foot. Four fields were drill seeded while three fields were broadcast seeded. Data on spring nitrogen applications are displayed in Table 6 on the next page. Total applied nitrogen ranged from 90 lbs/acre on the Crawford County field to 121 lbs/acre on the Monroe and Randolph County fields. The average spring nitrogen rate was 112.7 lbs/acre. The first spring nitrogen application is based on soil texture and drainage classification. On clay and poorly drained silt loam soils, 55 pounds of nitrogen per acre is recommended for the first application with the remaining 45 pounds of nitrogen to be applied 3-4 weeks later. On clay soils with a yield potential greater than 55 bu/ac, 75 pounds of nitrogen per acre is recommended at early tillering with the remaining 65 pounds to be applied 3-4 weeks later.
8

On loamy soils with good drainage, 90-100 pounds of nitrogen per acre is generally recommended for high yields. A single application at mid-tillering stage of wheat development may often satisfy the nitrogen requirements of the crop. However, heavy or frequent spring rainfall causes saturated soils and subsequent loss and/or leaching of nitrates outside the root zone. Thus, split applications of nitrogen are often required to avoid excessive nitrogen losses. In addition, standing water may cause nitrogen losses that can be corrected with supplemental fertilizer of 20-40 pounds of nitrogen per acre, according to Extension recommendations. Frequent rainfall, heavy rainfall, and standing water did occur on WRVP fields in the spring. All 2005 WRVP fields except those located in the Arkansas River Valley (Crawford and Logan Counties) received split applications of nitrogen. Five of the seven WRVP fields received sulfur with the first spring nitrogen application. Sulfur was applied due to low soil test sulfur rates of less than 30 lbs/ac (Table 3). Unlike many Arkansas wheat fields in 2005, all WRVP fields received the first application of spring nitrogen timely. Several fields across the state were fertilized late because of rainfall and/or abandoned due to decreased yield potential.
Table 6. Spring Nitrogen, WRVP Fields, 2005. First Application Second Application
County Date Source
Date Source Total
lb N/A
Ashley 25-Jan 130# urea + 50# A.S. 15-Mar 100# urea 116
Crawford 18-Feb 125# 36-0-0-9 plus 2.5 tons/ac litter 16-Mar 125# 36-0-0-9 90
Desha 16-Feb 125# urea + 50# A.S. 16-Mar 108# urea 118 Logan 17-Feb 200# urea + 50# A.S. N/A N/A 103
Monroe 17-Feb 135# urea 17-Mar 130# urea 121 Poinsett 11-Feb 135# urea 5-Mar 125# urea 120
Randolph 11-Feb 130# urea + 50# A.S. 5-Mar 110 # urea 121 1Urea (46-0-0), A.S. = Ammonium sulfate (21-0-0-24). The 2005 WRVP fields were not immune to weeds and disease. A summary of pests and chemicals used is displayed in Table 7. Ryegrass was not as common as in 2004. The Monroe County field was the only one treated with Osprey for ryegrass and other winter weeds. The new chemical provided good control of these pests. The Randolph County field was treated with Harmony Extra for winter weed control. Others had minimal pressure but didn’t require treatment. Five fields in the program were treated for winter broadleaf weeds with spring applications. Stripe and leaf rusts were an issue across the state in 2005. Both diseases apparently overwintered in late 2004 and were observed in wheat much earlier than normal. Because of this, the timing of a fungicide application was critical. An application made too early may result in a subsequent application. On the other hand, one made too late could result in yield loss. Stripe rust was first noticed in the Logan County field around growth stage 6, just before the joint moves up the stem. This field was watched very closely, as were others, from this point. After consulting with our Extension Plant Pathologists, we decided to treat
9
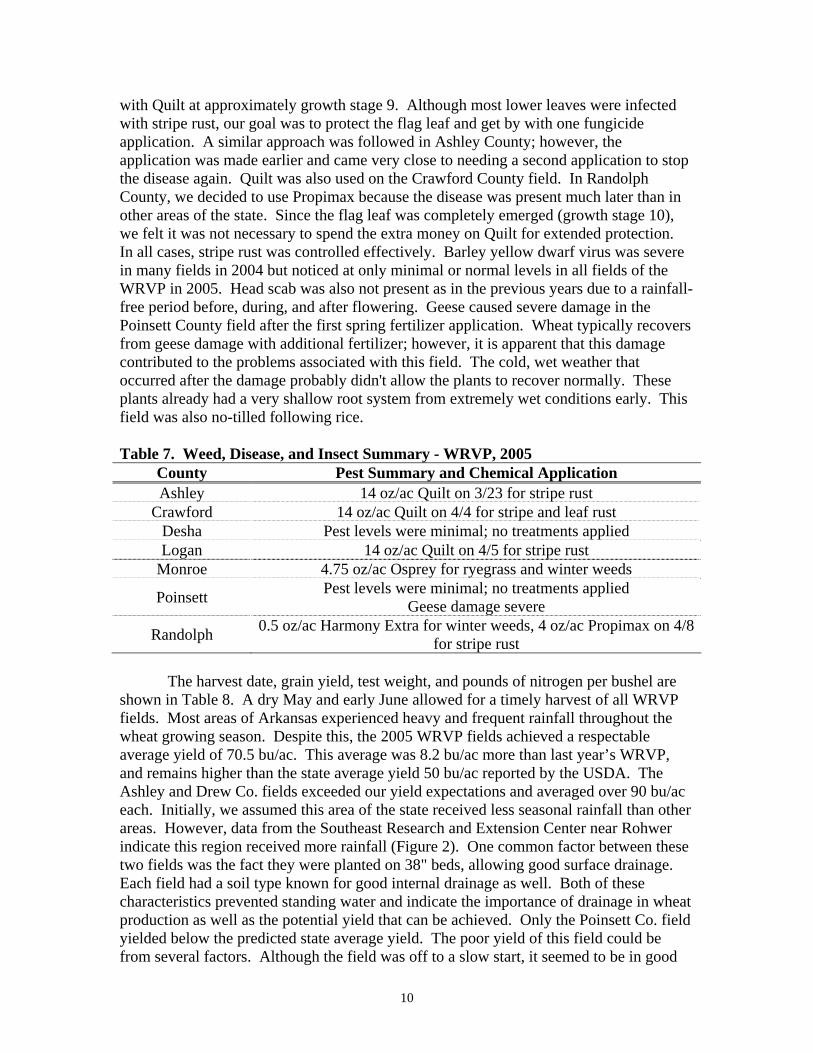
with Quilt at approximately growth stage 9. Although most lower leaves were infected with stripe rust, our goal was to protect the flag leaf and get by with one fungicide application. A similar approach was followed in Ashley County; however, the application was made earlier and came very close to needing a second application to stop the disease again. Quilt was also used on the Crawford County field. In Randolph County, we decided to use Propimax because the disease was present much later than in other areas of the state. Since the flag leaf was completely emerged (growth stage 10), we felt it was not necessary to spend the extra money on Quilt for extended protection. In all cases, stripe rust was controlled effectively. Barley yellow dwarf virus was severe in many fields in 2004 but noticed at only minimal or normal levels in all fields of the WRVP in 2005. Head scab was also not present as in the previous years due to a rainfall-free period before, during, and after flowering. Geese caused severe damage in the Poinsett County field after the first spring fertilizer application. Wheat typically recovers from geese damage with additional fertilizer; however, it is apparent that this damage contributed to the problems associated with this field. The cold, wet weather that occurred after the damage probably didn't allow the plants to recover normally. These plants already had a very shallow root system from extremely wet conditions early. This field was also no-tilled following rice. Table 7. Weed, Disease, and Insect Summary - WRVP, 2005
County Pest Summary and Chemical Application Ashley 14 oz/ac Quilt on 3/23 for stripe rust
Crawford 14 oz/ac Quilt on 4/4 for stripe and leaf rust Desha Pest levels were minimal; no treatments applied Logan 14 oz/ac Quilt on 4/5 for stripe rust
Monroe 4.75 oz/ac Osprey for ryegrass and winter weeds
Poinsett Pest levels were minimal; no treatments applied Geese damage severe
Randolph 0.5 oz/ac Harmony Extra for winter weeds, 4 oz/ac Propimax on 4/8 for stripe rust
The harvest date, grain yield, test weight, and pounds of nitrogen per bushel are shown in Table 8. A dry May and early June allowed for a timely harvest of all WRVP fields. Most areas of Arkansas experienced heavy and frequent rainfall throughout the wheat growing season. Despite this, the 2005 WRVP fields achieved a respectable average yield of 70.5 bu/ac. This average was 8.2 bu/ac more than last year’s WRVP, and remains higher than the state average yield 50 bu/ac reported by the USDA. The Ashley and Drew Co. fields exceeded our yield expectations and averaged over 90 bu/ac each. Initially, we assumed this area of the state received less seasonal rainfall than other areas. However, data from the Southeast Research and Extension Center near Rohwer indicate this region received more rainfall (Figure 2). One common factor between these two fields was the fact they were planted on 38" beds, allowing good surface drainage. Each field had a soil type known for good internal drainage as well. Both of these characteristics prevented standing water and indicate the importance of drainage in wheat production as well as the potential yield that can be achieved. Only the Poinsett Co. field yielded below the predicted state average yield. The poor yield of this field could be from several factors. Although the field was off to a slow start, it seemed to be in good
10

shape before and after the first spring fertilizer application was applied. Geese severely damaged the field approximately three weeks after this application leaving little leaf tissue above the soil surface. Cold, wet weather followed, and it seemed as if the plants did not have enough of a root system to recover from the damage. In hindsight, an additional N application probably would have helped. In a normal year wheat recovers well from geese damage at this growth stage.
The WRVP attempts to avoid low test weights by planting varieties with good test weight characteristics and timely harvest. Low test weights were reported across the state as well as for some WRVP fields. WRVP test weights ranged from 55.9 to 60.5 with an average of 58.4 lb/bu.
The pounds of nitrogen per bushel variable is a simple ratio of total applied
nitrogen divided by the grain yield. It attempts to measure the efficiency of nitrogen fertilizer applications. The efficiency ranged from 1.08 lbs N/bu to 3.48 lbs N/bu and averaged 1.79 lbs N/bu of wheat.
Table 8. Harvest Date, Grain Yield, Test Weight for WRVP Fields, 2005
County Harvest Date Test
Weight (lb/bu)
Yield (bu/ac @ 13.5%)
Pounds N/bu
Ashley 8-Jun 58.4 91.7 1.26 Crawford 14-Jun 59.0 83.0 1.08
Desha 3-Jun 57.8 91.0 1.30 Logan 6-Jun 55.9 69.5 1.48
Monroe 10-Jun 58.5 65.0 1.86 Poinsett 9-Jun 58.5 34.5 3.48
Randolph 7-Jun 60.5 58.7 2.06 Average: 58.4 70.5 1.79 State Yield Average: 50.0
Figure 2. Seasonal Rainfall of WRVP Fields, 2004-2005.
05
1015202530354045
Crawford Logan Poinsett Randolph Rohwer**
County
Inch
es
Seasonal Rainfall(Nov'04 - May'05)
11

The Wheat Research Verification Program continues to demonstrate that high yields of wheat can be produced consistently and economically according to the research-based recommendations published by the Cooperative Extension Service.
Economic Analysis
This section provides information on the development of estimated production costs for the 2005 Wheat Research Verification Program. Records of field operations on each field provided the basis for estimating these costs. The field records were compiled by participating county Extension faculty and the coordinators of the Wheat Research Verification Program.
Using WRVP production data from 7 fields in 7 counties, operating costs, and net returns above total specified costs assuming a 25 percent land rent were estimated for each field. While some WRVP fields are not in a crop-sharing situation, it is better to assume all fields have crop share costs for comparison. Break-even prices needed to cover total specified costs are also presented. Please keep in mind that overall net returns may not necessarily reflect the actual amount received for the wheat crop, but is an estimate considering all possible expenses related to wheat production. Specified Operating Costs
Specified operating costs listed in Table 9 are those expenditures that would generally require annual cash outlays and would be included on an annual operating loan application. Actual quantities of all operating inputs were used in this analysis. However, since prices of inputs may be influenced by quantity discounts, and similar factors that are independent of production management issues being tested by WRVP, constant input prices were used across all fields. This procedure was used so that the objective to verify research recommendations would not be obscured by highly variable input prices.
Machinery fuel and repair costs were calculated using a budget generator based on parameters and standards published in the American Society of Agricultural Engineers 1995 Handbook. Therefore, the producer’s actual machinery costs will likely vary somewhat from the machinery cost estimates that are presented in this report. However, the producer’s actual field operations were used as a basis for the calculations. Equipment size and type were matched as closely as possible to the existing data set used in the series of Extension Technical Bulletins Estimating 2003 Production Costs in Arkansas.
Specified operating costs for the 7 WRVP fields ranged from $104.19 per acre to $148.73 per acre. The average over all fields was $125.14. Specified Ownership Costs
Machinery ownership costs represent the capital replacement costs of owning and using equipment and can vary greatly from one farm to another depending on the farm’s size, management skills, and annual use. Specified ownership costs presented in Table 9 include depreciation, interest, taxes, and insurance. These costs were based on the initial
12
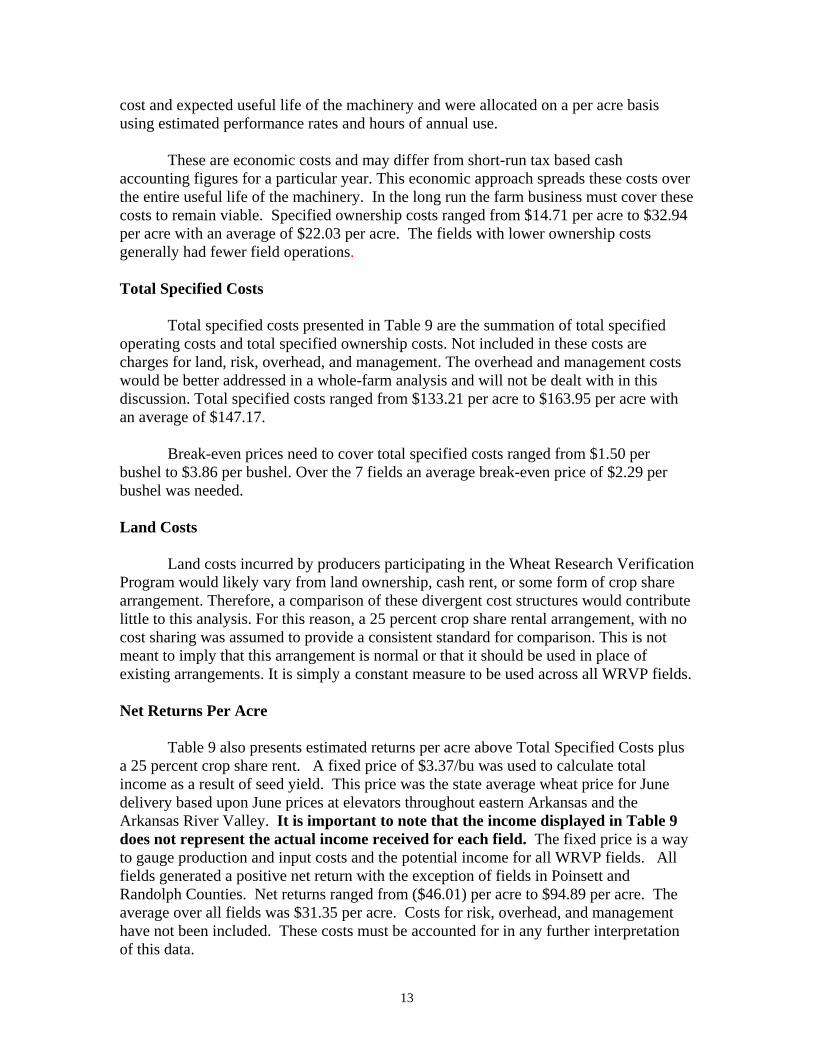
cost and expected useful life of the machinery and were allocated on a per acre basis using estimated performance rates and hours of annual use.
These are economic costs and may differ from short-run tax based cash accounting figures for a particular year. This economic approach spreads these costs over the entire useful life of the machinery. In the long run the farm business must cover these costs to remain viable. Specified ownership costs ranged from $14.71 per acre to $32.94 per acre with an average of $22.03 per acre. The fields with lower ownership costs generally had fewer field operations. Total Specified Costs
Total specified costs presented in Table 9 are the summation of total specified operating costs and total specified ownership costs. Not included in these costs are charges for land, risk, overhead, and management. The overhead and management costs would be better addressed in a whole-farm analysis and will not be dealt with in this discussion. Total specified costs ranged from $133.21 per acre to $163.95 per acre with an average of $147.17.
Break-even prices need to cover total specified costs ranged from $1.50 per bushel to $3.86 per bushel. Over the 7 fields an average break-even price of $2.29 per bushel was needed. Land Costs
Land costs incurred by producers participating in the Wheat Research Verification Program would likely vary from land ownership, cash rent, or some form of crop share arrangement. Therefore, a comparison of these divergent cost structures would contribute little to this analysis. For this reason, a 25 percent crop share rental arrangement, with no cost sharing was assumed to provide a consistent standard for comparison. This is not meant to imply that this arrangement is normal or that it should be used in place of existing arrangements. It is simply a constant measure to be used across all WRVP fields. Net Returns Per Acre
Table 9 also presents estimated returns per acre above Total Specified Costs plus a 25 percent crop share rent. A fixed price of $3.37/bu was used to calculate total income as a result of seed yield. This price was the state average wheat price for June delivery based upon June prices at elevators throughout eastern Arkansas and the Arkansas River Valley. It is important to note that the income displayed in Table 9 does not represent the actual income received for each field. The fixed price is a way to gauge production and input costs and the potential income for all WRVP fields. All fields generated a positive net return with the exception of fields in Poinsett and Randolph Counties. Net returns ranged from ($46.01) per acre to $94.89 per acre. The average over all fields was $31.35 per acre. Costs for risk, overhead, and management have not been included. These costs must be accounted for in any further interpretation of this data.
13

14
Various Specified Operating Costs
Table 10 lists various specified operating costs that are required for wheat production. As seen in previous years, the largest specified operating cost in the WRVP was for fertilization with an average cost of $54.59 per acre. These costs ranged from $32.25 to $81.51 and include those associated with fertilizer application. This broad range can be attributed to three production aspects: previous crop, double-cropped production, and single vs. split fertilizer applications. The highest fertilization costs were in Monroe and Poinsett Counties. Seed costs ranged from $12.00 to $23.40 per acre, averaging $16.91 per acre over the 7 fields. Preplant tillage was another notable specified operating cost for some fields. It ranged from $0 to $20.60 per acre with an average of $8.50 per acre.

Table 9. Economic Summary of Wheat Research Verification Fields in 2005. Total Specified Total Specified Break-even Returns Above Total Operating Break-even Operating and Break-even Price with Total Specified Yield1 Income2 Costs3 Operating4 Ownership Costs5 Price6 Land Costs7 Costs8
County (bu/ac) ($/ac) ($/ac) ($/bu) ($/ac) ($/bu) ($/bu) ($/ac) Ashley 91.7 $309.03 $135.41 $1.48 $156.35 $1.71 $2.27 $75.42
Crawford 83.0 $279.71 $104.19 $1.26 $137.13 $1.65 $2.20 $72.65 Desha 92.0 $310.04 $115.05 $1.25 $137.64 $1.50 $1.99 $94.89 Logan 69.5 $234.22 $116.20 $1.67 $138.45 $1.99 $2.66 $37.21
Monroe 65.0 $219.05 $148.73 $2.29 $163.44 $2.51 $3.35 $0.85 Poinsett 34.5 $116.27 $116.92 $3.39 $133.21 $3.86 $5.15 ($46.01)
Randolph 58.7 $197.82 $139.48 $2.38 $163.95 $2.79 $3.72 ($15.59) Average: 70.6 $238.02 $125.14 $1.96 $147.17 $2.29 $3.05 $31.35
1Yields adjusted to 13.5% moisture. 2Based upon state average wheat price for June delivery, $3.37/bu. 3Specified out-of-pocket expenses, such as seed, fertilizer, herbicides, irrigation, etc. 4Price per bushel required by the farmer to equal total specified operating costs. Does not include land, overhead, risk, and management cost. 5Total specified operating costs plus ownership costs which include charges for depreciation and interest on all machinery and irrigation equipment, taxes, and insurance. 6Price per bushel required by the farmer to equal total specified operating and ownership costs. Does not include overhead, risk, and management costs. 7Break-even price per bushel plus a 25% crop share rent. Does not include overhead, risk, and management costs. 8A 25% crop share rent was assumed as a land charge for a renter situation. No cost sharing was assumed.
15

16
Table 10. Various Specified Operating Costs of the Wheat Verification Fields in 2005. Preplant Tillage Pest Control Operating Fertilization Seed Insecticide Fungicide Herbicide Other Total No. of Cost1 Cost Cost Cost Cost1 Cost1 Costs Operating
County Trips ($/ac) ($/ac) ($/ac) ($/ac) ($/ac) ($/ac) ($/ac) ($/ac) Ashley 2 $4.74 $45.90 $19.50 $0.00 $12.32 $5.56 $52.13 $140.15
Crawford 2 $10.52 $32.25 $15.60 $0.00 $12.32 $0.00 $33.50 $104.19 Desha 1 $3.84 $48.15 $23.40 $0.00 $0.00 $0.00 $39.66 $115.05 Logan 1 $8.71 $52.60 $13.00 $0.00 $12.32 $0.00 $29.57 $116.20
Monroe 1 $2.58 $81.51 $12.00 $0.00 $0.00 $14.25 $38.39 $148.73 Poinsett 0 $0.00 $64.00 $17.94 $0.00 $0.00 $0.00 $34.98 $116.92
Randolph 4 $20.60 $49.00 $19.50 $0.00 $9.32 $6.11 $34.95 $139.48 $125.82 Average: 1.8 $8.50 $54.59 $16.91 $0.00 $11.57 $8.64 $37.60
1Average cost reflects an average of only the cooperators using this practice.

17
Appendix
Economic Analysis By County
Estimated operating expenses and crop input costs

18
Table 1.A Estimated resource use and costs for field operations, per Acre WRVP - 2005 Ashley Co. _____________________________________________________________________________________________________________________________________________ TRACTOR COST EQUIP COST ALLOC LABOR OPERATING INPUT OPERATION/ SIZE/ TRACTOR PERF TIMES -------------- -------------- ------------- ---------------------- TOTAL OPERATING INPUT UNIT SIZE RATE OVER MTH DIRECT FIXED DIRECT FIXED HOURS COST AMOUNT PRICE COST COST _____________________________________________________________________________________________________________________________________________ ------------dollars----------- dollars -------dollars-------- Fertilizer spreader 32' MFWD 150 0.052 1.00 Oct 0.95 0.79 0.22 0.40 0.067 0.49 2.86 0-40-80 lb 100.0000 0.12 12.70 12.70 Hiclr sprayer,320gal 60' 0.027 1.00 Oct 0.45 0.76 0.038 0.28 1.51 Glyphosate pint 2.0000 2.78 5.56 5.56 Rotary hoe 21' MFWD 150 0.049 2.00 Oct 1.79 1.50 0.13 0.38 0.127 0.92 4.74 Grain drill 20' MFWD 150 0.118 1.00 Oct 2.15 1.80 0.82 1.66 0.283 2.05 8.50 Wheat seed - private lb 150.0000 0.13 19.50 19.50 Fertilizer spreader 32' MFWD 150 0.052 1.00 Jan 0.95 0.79 0.22 0.40 0.067 0.49 2.86 Urea+Am.Sulfate lb 130.0000 0.14 18.20 18.20 Cstm ap air fert lb 1.00 Mar 100.0000 0.05 5.00 5.00 Urea 46% lb 100.0000 0.15 15.00 15.00 Cstm ap air 5 gal acre 1.00 Mar 1.0000 4.00 4.00 4.00 Quilt pt. 0.8750 14.08 12.32 12.32 Combine Wheat 25' 0.182 1.00 Jun 6.23 12.41 0.227 1.65 20.30 Custom haul bu 1.00 Jun 91.7000 0.15 13.75 13.75 ------- ------- ------- ------- ------ ------- ------- ------- TOTALS 5.85 4.90 8.10 16.03 0.812 5.89 106.03 146.83 INTEREST ON OPERATING CAPITAL 3.62 UNALLOCATED LABOR 5.89 TOTAL SPECIFIED COST 156.35 _____________________________________________________________________________________________________________________________________________
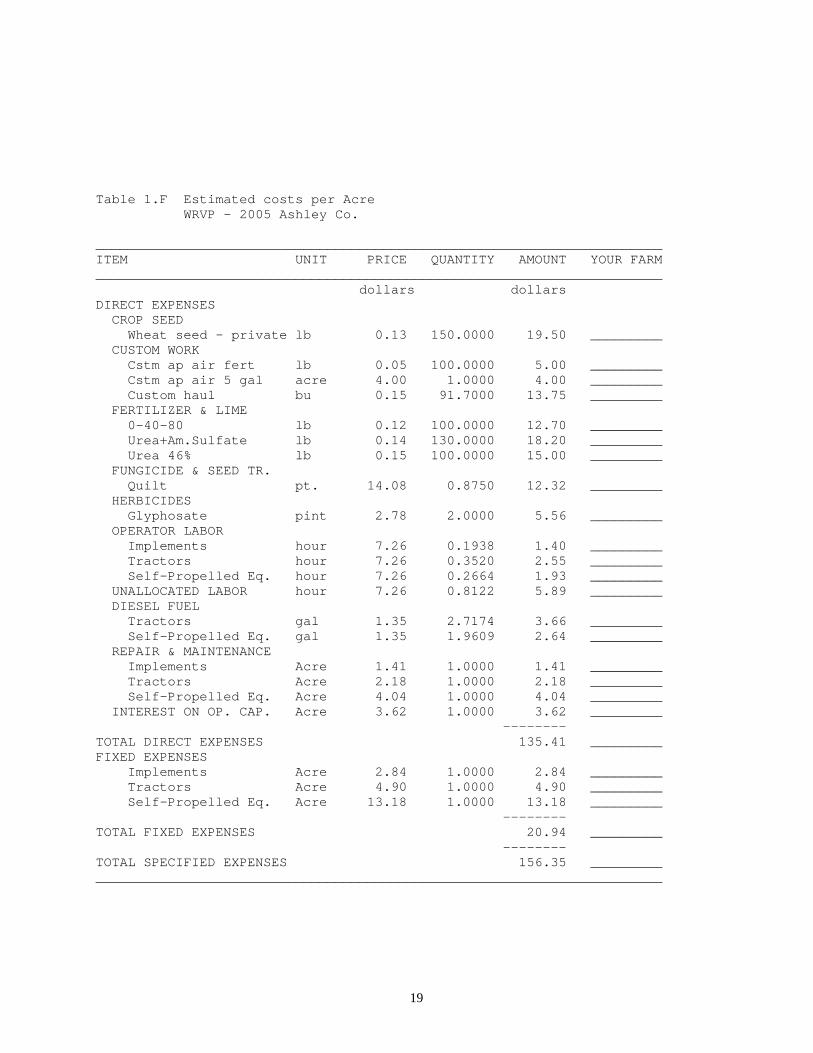
19
Table 1.F Estimated costs per Acre WRVP - 2005 Ashley Co. _______________________________________________________________________ ITEM UNIT PRICE QUANTITY AMOUNT YOUR FARM _______________________________________________________________________ dollars dollars DIRECT EXPENSES CROP SEED Wheat seed - private lb 0.13 150.0000 19.50 _________ CUSTOM WORK Cstm ap air fert lb 0.05 100.0000 5.00 _________ Cstm ap air 5 gal acre 4.00 1.0000 4.00 _________ Custom haul bu 0.15 91.7000 13.75 _________ FERTILIZER & LIME 0-40-80 lb 0.12 100.0000 12.70 _________ Urea+Am.Sulfate lb 0.14 130.0000 18.20 _________ Urea 46% lb 0.15 100.0000 15.00 _________ FUNGICIDE & SEED TR. Quilt pt. 14.08 0.8750 12.32 _________ HERBICIDES Glyphosate pint 2.78 2.0000 5.56 _________ OPERATOR LABOR Implements hour 7.26 0.1938 1.40 _________ Tractors hour 7.26 0.3520 2.55 _________ Self-Propelled Eq. hour 7.26 0.2664 1.93 _________ UNALLOCATED LABOR hour 7.26 0.8122 5.89 _________ DIESEL FUEL Tractors gal 1.35 2.7174 3.66 _________ Self-Propelled Eq. gal 1.35 1.9609 2.64 _________ REPAIR & MAINTENANCE Implements Acre 1.41 1.0000 1.41 _________ Tractors Acre 2.18 1.0000 2.18 _________ Self-Propelled Eq. Acre 4.04 1.0000 4.04 _________ INTEREST ON OP. CAP. Acre 3.62 1.0000 3.62 _________ -------- TOTAL DIRECT EXPENSES 135.41 _________ FIXED EXPENSES Implements Acre 2.84 1.0000 2.84 _________ Tractors Acre 4.90 1.0000 4.90 _________ Self-Propelled Eq. Acre 13.18 1.0000 13.18 _________ -------- TOTAL FIXED EXPENSES 20.94 _________ -------- TOTAL SPECIFIED EXPENSES 156.35 _________ _______________________________________________________________________
20
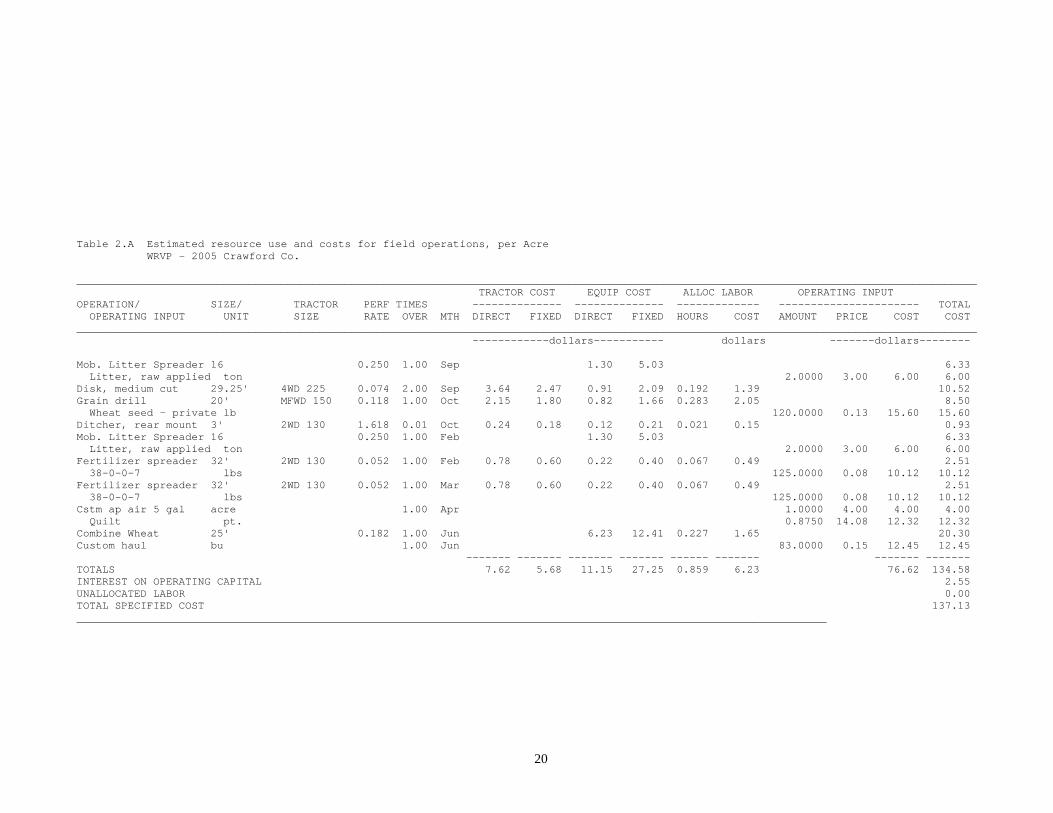
Table 2.A Estimated resource use and costs for field operations, per Acre WRVP - 2005 Crawford Co. _____________________________________________________________________________________________________________________________________________ TRACTOR COST EQUIP COST ALLOC LABOR OPERATING INPUT OPERATION/ SIZE/ TRACTOR PERF TIMES -------------- -------------- ------------- ---------------------- TOTAL OPERATING INPUT UNIT SIZE RATE OVER MTH DIRECT FIXED DIRECT FIXED HOURS COST AMOUNT PRICE COST COST _____________________________________________________________________________________________________________________________________________ ------------dollars----------- dollars -------dollars-------- Mob. Litter Spreader 16 0.250 1.00 Sep 1.30 5.03 6.33 Litter, raw applied ton 2.0000 3.00 6.00 6.00 Disk, medium cut 29.25' 4WD 225 0.074 2.00 Sep 3.64 2.47 0.91 2.09 0.192 1.39 10.52 Grain drill 20' MFWD 150 0.118 1.00 Oct 2.15 1.80 0.82 1.66 0.283 2.05 8.50 Wheat seed - private lb 120.0000 0.13 15.60 15.60 Ditcher, rear mount 3' 2WD 130 1.618 0.01 Oct 0.24 0.18 0.12 0.21 0.021 0.15 0.93 Mob. Litter Spreader 16 0.250 1.00 Feb 1.30 5.03 6.33 Litter, raw applied ton 2.0000 3.00 6.00 6.00 Fertilizer spreader 32' 2WD 130 0.052 1.00 Feb 0.78 0.60 0.22 0.40 0.067 0.49 2.51 38-0-0-7 lbs 125.0000 0.08 10.12 10.12 Fertilizer spreader 32' 2WD 130 0.052 1.00 Mar 0.78 0.60 0.22 0.40 0.067 0.49 2.51 38-0-0-7 lbs 125.0000 0.08 10.12 10.12 Cstm ap air 5 gal acre 1.00 Apr 1.0000 4.00 4.00 4.00 Quilt pt. 0.8750 14.08 12.32 12.32 Combine Wheat 25' 0.182 1.00 Jun 6.23 12.41 0.227 1.65 20.30 Custom haul bu 1.00 Jun 83.0000 0.15 12.45 12.45 ------- ------- ------- ------- ------ ------- ------- ------- TOTALS 7.62 5.68 11.15 27.25 0.859 6.23 76.62 134.58 INTEREST ON OPERATING CAPITAL 2.55 UNALLOCATED LABOR 0.00 TOTAL SPECIFIED COST 137.13 _____________________________________________________________________________________________________________________________________________

21
Table 2.F Estimated costs per Acre WRVP - 2005 Crawford Co. _______________________________________________________________________ ITEM UNIT PRICE QUANTITY AMOUNT YOUR FARM _______________________________________________________________________ dollars dollars DIRECT EXPENSES CROP SEED Wheat seed - private lb 0.13 120.0000 15.60 _________ CUSTOM WORK Cstm ap air 5 gal acre 4.00 1.0000 4.00 _________ Custom haul bu 0.15 83.0000 12.45 _________ FERTILIZER & LIME Litter, raw applied ton 3.00 4.0000 12.00 _________ 38-0-0-7 lbs 0.08 250.0000 20.25 _________ FUNGICIDE & SEED TR. Quilt pt. 14.08 0.8750 12.32 _________ OPERATOR LABOR Implements hour 7.26 0.2070 1.50 _________ Tractors hour 7.26 0.4247 3.08 _________ Self-Propelled Eq. hour 7.26 0.2275 1.65 _________ DIESEL FUEL Tractors gal 1.35 3.7716 5.09 _________ Self-Propelled Eq. gal 1.35 1.8746 2.53 _________ GASOLINE Self-Propelled Eq. gal 1.04 2.5000 2.60 _________ REPAIR & MAINTENANCE Implements Acre 2.31 1.0000 2.31 _________ Tractors Acre 2.53 1.0000 2.53 _________ Self-Propelled Eq. Acre 3.71 1.0000 3.71 _________ INTEREST ON OP. CAP. Acre 2.55 1.0000 2.55 _________ -------- TOTAL DIRECT EXPENSES 104.19 _________ FIXED EXPENSES Implements Acre 4.77 1.0000 4.77 _________ Tractors Acre 5.68 1.0000 5.68 _________ Self-Propelled Eq. Acre 22.48 1.0000 22.48 _________ -------- TOTAL FIXED EXPENSES 32.94 _________ -------- TOTAL SPECIFIED EXPENSES 137.13 _________ _______________________________________________________________________
22
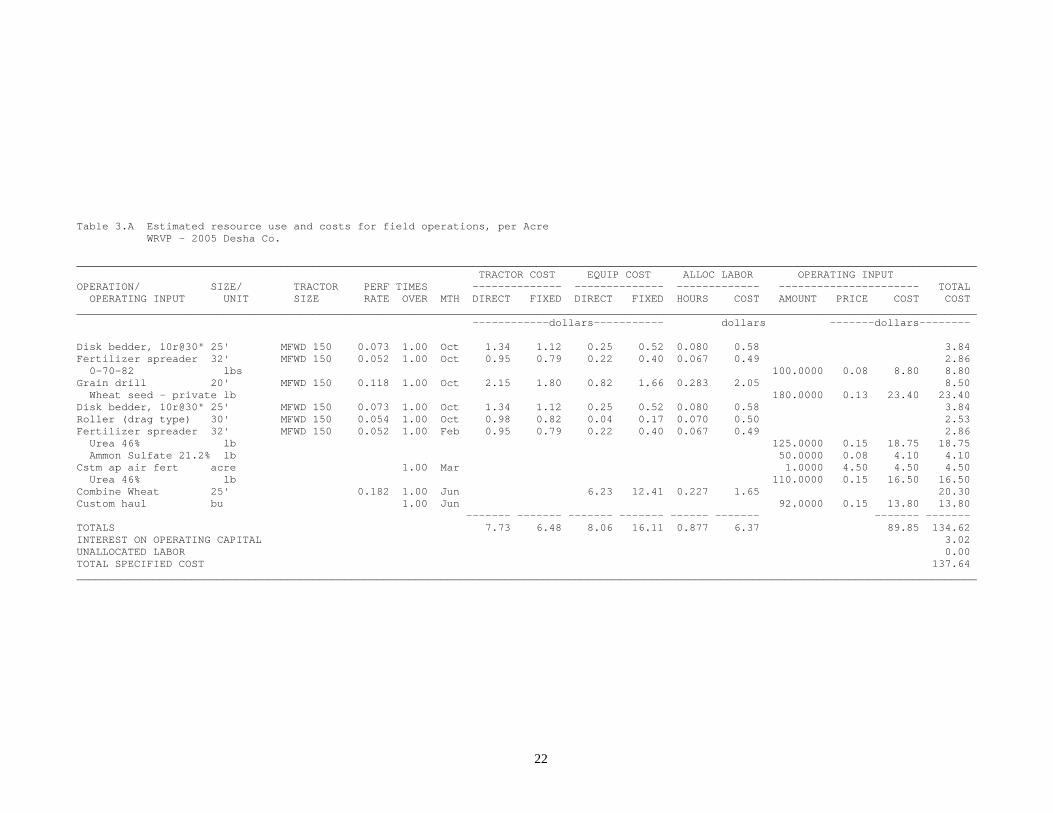
Table 3.A Estimated resource use and costs for field operations, per Acre WRVP - 2005 Desha Co. _____________________________________________________________________________________________________________________________________________ TRACTOR COST EQUIP COST ALLOC LABOR OPERATING INPUT OPERATION/ SIZE/ TRACTOR PERF TIMES -------------- -------------- ------------- ---------------------- TOTAL OPERATING INPUT UNIT SIZE RATE OVER MTH DIRECT FIXED DIRECT FIXED HOURS COST AMOUNT PRICE COST COST _____________________________________________________________________________________________________________________________________________ ------------dollars----------- dollars -------dollars-------- Disk bedder, 10r@30" 25' MFWD 150 0.073 1.00 Oct 1.34 1.12 0.25 0.52 0.080 0.58 3.84 Fertilizer spreader 32' MFWD 150 0.052 1.00 Oct 0.95 0.79 0.22 0.40 0.067 0.49 2.86 0-70-82 lbs 100.0000 0.08 8.80 8.80 Grain drill 20' MFWD 150 0.118 1.00 Oct 2.15 1.80 0.82 1.66 0.283 2.05 8.50 Wheat seed - private lb 180.0000 0.13 23.40 23.40 Disk bedder, 10r@30" 25' MFWD 150 0.073 1.00 Oct 1.34 1.12 0.25 0.52 0.080 0.58 3.84 Roller (drag type) 30' MFWD 150 0.054 1.00 Oct 0.98 0.82 0.04 0.17 0.070 0.50 2.53 Fertilizer spreader 32' MFWD 150 0.052 1.00 Feb 0.95 0.79 0.22 0.40 0.067 0.49 2.86 Urea 46% lb 125.0000 0.15 18.75 18.75 Ammon Sulfate 21.2% lb 50.0000 0.08 4.10 4.10 Cstm ap air fert acre 1.00 Mar 1.0000 4.50 4.50 4.50 Urea 46% lb 110.0000 0.15 16.50 16.50 Combine Wheat 25' 0.182 1.00 Jun 6.23 12.41 0.227 1.65 20.30 Custom haul bu 1.00 Jun 92.0000 0.15 13.80 13.80 ------- ------- ------- ------- ------ ------- ------- ------- TOTALS 7.73 6.48 8.06 16.11 0.877 6.37 89.85 134.62 INTEREST ON OPERATING CAPITAL 3.02 UNALLOCATED LABOR 0.00 TOTAL SPECIFIED COST 137.64 _____________________________________________________________________________________________________________________________________________

23
Table 3.F Estimated costs per Acre WRVP - 2005 Desha Co. _______________________________________________________________________ ITEM UNIT PRICE QUANTITY AMOUNT YOUR FARM _______________________________________________________________________ dollars dollars DIRECT EXPENSES CROP SEED Wheat seed - private lb 0.13 180.0000 23.40 _________ CUSTOM WORK Cstm ap air fert acre 4.50 1.0000 4.50 _________ Custom haul bu 0.15 92.0000 13.80 _________ FERTILIZER & LIME 0-70-82 lbs 0.08 100.0000 8.80 _________ Urea 46% lb 0.15 235.0000 35.25 _________ Ammon Sulfate 21.2% lb 0.08 50.0000 4.10 _________ OPERATOR LABOR Implements hour 7.26 0.1850 1.34 _________ Tractors hour 7.26 0.4653 3.37 _________ Self-Propelled Eq. hour 7.26 0.2275 1.65 _________ DIESEL FUEL Tractors gal 1.35 3.5921 4.84 _________ Self-Propelled Eq. gal 1.35 1.8746 2.53 _________ REPAIR & MAINTENANCE Implements Acre 1.83 1.0000 1.83 _________ Tractors Acre 2.88 1.0000 2.88 _________ Self-Propelled Eq. Acre 3.70 1.0000 3.70 _________ INTEREST ON OP. CAP. Acre 3.02 1.0000 3.02 _________ -------- TOTAL DIRECT EXPENSES 115.05 _________ FIXED EXPENSES Implements Acre 3.69 1.0000 3.69 _________ Tractors Acre 6.48 1.0000 6.48 _________ Self-Propelled Eq. Acre 12.41 1.0000 12.41 _________ -------- TOTAL FIXED EXPENSES 22.59 _________ -------- TOTAL SPECIFIED EXPENSES 137.64 _________ _______________________________________________________________________

24
Table 4.A Estimated resource use and costs for field operations, per Acre WRVP - 2005 Logan Co. _____________________________________________________________________________________________________________________________________________ TRACTOR COST EQUIP COST ALLOC LABOR OPERATING INPUT OPERATION/ SIZE/ TRACTOR PERF TIMES -------------- -------------- ------------- ---------------------- TOTAL OPERATING INPUT UNIT SIZE RATE OVER MTH DIRECT FIXED DIRECT FIXED HOURS COST AMOUNT PRICE COST COST _____________________________________________________________________________________________________________________________________________ ------------dollars----------- dollars -------dollars-------- Disk, light cut 32' MFWD 170 0.067 2.00 Sep 2.61 1.97 0.86 1.98 0.174 1.26 8.71 Grain drill 20' MFWD 150 0.118 1.00 Oct 2.15 1.80 0.82 1.66 0.283 2.05 8.50 Wheat seed - private lb 100.0000 0.13 13.00 13.00 Fertilizer spreader 32' MFWD 150 0.052 1.00 Dec 0.95 0.79 0.22 0.40 0.067 0.49 2.86 Urea 46% lb 50.0000 0.15 7.50 7.50 0-60-0 lb 100.0000 0.11 11.00 11.00 Fertilizer spreader 32' MFWD 150 0.052 1.00 Feb 0.95 0.79 0.22 0.40 0.067 0.49 2.86 Urea 46% lb 200.0000 0.15 30.00 30.00 Ammon Sulfate 21.2% lb 50.0000 0.08 4.10 4.10 Cstm ap air 5 gal acre 1.00 Apr 1.0000 4.00 4.00 4.00 Quilt pt. 0.8750 14.08 12.32 12.32 Combine Wheat 25' 0.182 1.00 Jun 6.23 12.41 0.227 1.65 20.30 Custom haul bu 1.00 Jun 69.5000 0.15 10.42 10.42 ------- ------- ------- ------- ------ ------- ------- ------- TOTALS 6.68 5.37 8.36 16.87 0.820 5.95 92.34 135.59 INTEREST ON OPERATING CAPITAL 2.86 UNALLOCATED LABOR 0.00 TOTAL SPECIFIED COST 138.45 _____________________________________________________________________________________________________________________________________________

25
Table 4.F Estimated costs per Acre WRVP - 2005 Logan Co. _______________________________________________________________________ ITEM UNIT PRICE QUANTITY AMOUNT YOUR FARM _______________________________________________________________________ dollars dollars DIRECT EXPENSES CROP SEED Wheat seed - private lb 0.13 100.0000 13.00 _________ CUSTOM WORK Cstm ap air 5 gal acre 4.00 1.0000 4.00 _________ Custom haul bu 0.15 69.5000 10.42 _________ FERTILIZER & LIME Urea 46% lb 0.15 250.0000 37.50 _________ 0-60-0 lb 0.11 100.0000 11.00 _________ Ammon Sulfate 21.2% lb 0.08 50.0000 4.10 _________ FUNGICIDE & SEED TR. Quilt pt. 14.08 0.8750 12.32 _________ OPERATOR LABOR Implements hour 7.26 0.2010 1.45 _________ Tractors hour 7.26 0.3916 2.84 _________ Self-Propelled Eq. hour 7.26 0.2275 1.65 _________ DIESEL FUEL Tractors gal 1.35 3.1749 4.28 _________ Self-Propelled Eq. gal 1.35 1.8746 2.53 _________ REPAIR & MAINTENANCE Implements Acre 2.13 1.0000 2.13 _________ Tractors Acre 2.39 1.0000 2.39 _________ Self-Propelled Eq. Acre 3.70 1.0000 3.70 _________ INTEREST ON OP. CAP. Acre 2.86 1.0000 2.86 _________ -------- TOTAL DIRECT EXPENSES 116.20 _________ FIXED EXPENSES Implements Acre 4.45 1.0000 4.45 _________ Tractors Acre 5.37 1.0000 5.37 _________ Self-Propelled Eq. Acre 12.41 1.0000 12.41 _________ -------- TOTAL FIXED EXPENSES 22.24 _________ -------- TOTAL SPECIFIED EXPENSES 138.45 _________ _______________________________________________________________________

26
Table 5.A Estimated resource use and costs for field operations, per Acre WRVP - 2005 Monroe Co. _____________________________________________________________________________________________________________________________________________ TRACTOR COST EQUIP COST ALLOC LABOR OPERATING INPUT OPERATION/ SIZE/ TRACTOR PERF TIMES -------------- -------------- ------------- ---------------------- TOTAL OPERATING INPUT UNIT SIZE RATE OVER MTH DIRECT FIXED DIRECT FIXED HOURS COST AMOUNT PRICE COST COST _____________________________________________________________________________________________________________________________________________ ------------dollars----------- dollars -------dollars-------- Field cultivator 31.5' MFWD 150 0.044 1.00 Nov 0.80 0.67 0.22 0.46 0.057 0.41 2.58 Cstm ap grd fert dry acre 1.00 Nov 1.0000 4.00 4.00 4.00 0-20-20 lb 400.0000 0.08 35.60 35.60 Ammon Nitrate 34% lb 88.0000 0.07 6.16 6.16 Cstm seed grd brdcst acre 1.00 Nov 1.0000 4.50 4.50 4.50 Wheat seed - public lb 100.0000 0.12 12.00 12.00 Field cultivator 31.5' MFWD 150 0.044 1.00 Nov 0.80 0.67 0.22 0.46 0.057 0.41 2.58 Cstm ap fert&herb li acre 1.00 Feb 1.0000 4.00 4.00 4.00 Urea 46% lb 135.0000 0.15 20.25 20.25 Osprey oz 4.7500 3.00 14.25 14.25 Cstm ap grd fert dry acre 1.00 Mar 1.0000 4.00 4.00 4.00 Urea 46% lb 130.0000 0.15 19.50 19.50 Combine Wheat 25' 0.182 1.00 Jun 6.23 12.41 0.227 1.65 20.30 Custom haul bu 1.00 Jun 65.0000 0.15 9.75 9.75 ------- ------- ------- ------- ------ ------- ------- ------- TOTALS 1.60 1.34 6.68 13.35 0.341 2.48 134.01 159.49 INTEREST ON OPERATING CAPITAL 3.95 UNALLOCATED LABOR 0.00 TOTAL SPECIFIED COST 163.44 _____________________________________________________________________________________________________________________________________________

27
Table 5.F Estimated costs per Acre WRVP - 2005 Monroe Co. _______________________________________________________________________ ITEM UNIT PRICE QUANTITY AMOUNT YOUR FARM _______________________________________________________________________ dollars dollars DIRECT EXPENSES CROP SEED Wheat seed - public lb 0.12 100.0000 12.00 _________ CUSTOM WORK Cstm ap grd fert dry acre 4.00 2.0000 8.00 _________ Cstm seed grd brdcst acre 4.50 1.0000 4.50 _________ Cstm ap fert&herb li acre 4.00 1.0000 4.00 _________ Custom haul bu 0.15 65.0000 9.75 _________ FERTILIZER & LIME 0-20-20 lb 0.08 400.0000 35.60 _________ Ammon Nitrate 34% lb 0.07 88.0000 6.16 _________ Urea 46% lb 0.15 265.0000 39.75 _________ HERBICIDES Osprey oz 3.00 4.7500 14.25 _________ OPERATOR LABOR Implements hour 7.26 0.0176 0.12 _________ Tractors hour 7.26 0.0968 0.70 _________ Self-Propelled Eq. hour 7.26 0.2275 1.65 _________ DIESEL FUEL Tractors gal 1.35 0.7472 1.00 _________ Self-Propelled Eq. gal 1.35 1.8746 2.53 _________ REPAIR & MAINTENANCE Implements Acre 0.45 1.0000 0.45 _________ Tractors Acre 0.60 1.0000 0.60 _________ Self-Propelled Eq. Acre 3.70 1.0000 3.70 _________ INTEREST ON OP. CAP. Acre 3.95 1.0000 3.95 _________ -------- TOTAL DIRECT EXPENSES 148.73 _________ FIXED EXPENSES Implements Acre 0.93 1.0000 0.93 _________ Tractors Acre 1.34 1.0000 1.34 _________ Self-Propelled Eq. Acre 12.41 1.0000 12.41 _________ -------- TOTAL FIXED EXPENSES 14.70 _________ -------- TOTAL SPECIFIED EXPENSES 163.44 _________ _______________________________________________________________________
28
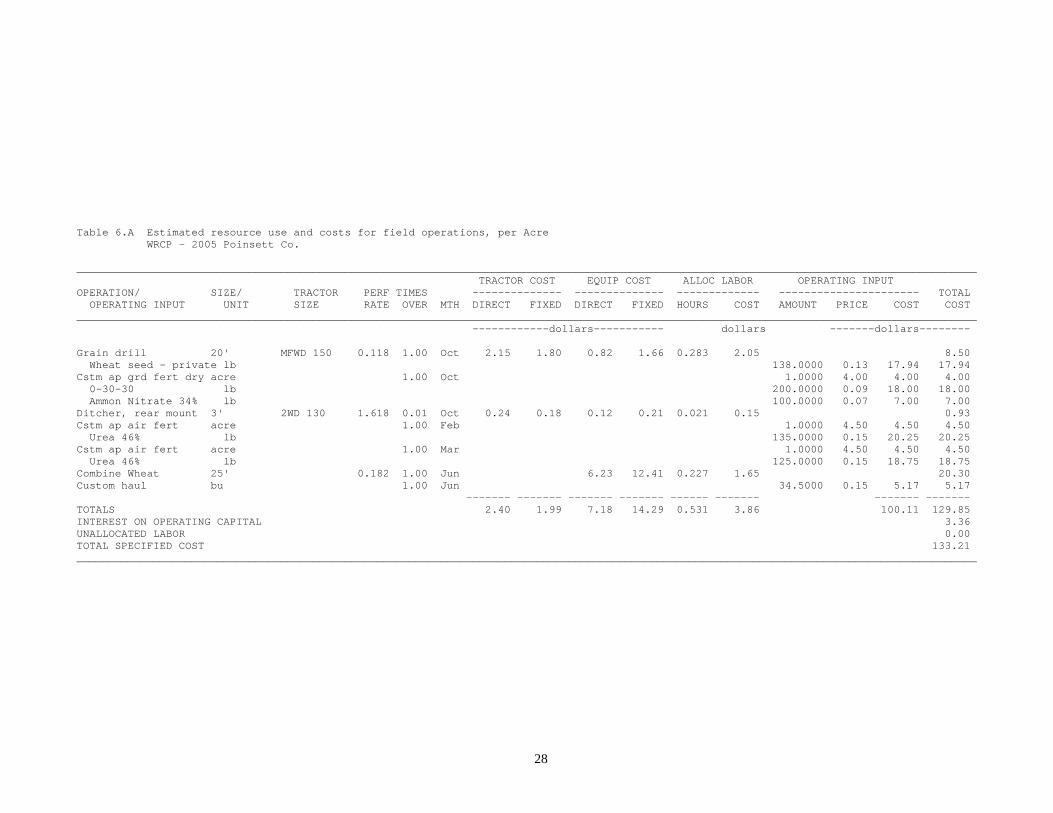
Table 6.A Estimated resource use and costs for field operations, per Acre WRCP - 2005 Poinsett Co. _____________________________________________________________________________________________________________________________________________ TRACTOR COST EQUIP COST ALLOC LABOR OPERATING INPUT OPERATION/ SIZE/ TRACTOR PERF TIMES -------------- -------------- ------------- ---------------------- TOTAL OPERATING INPUT UNIT SIZE RATE OVER MTH DIRECT FIXED DIRECT FIXED HOURS COST AMOUNT PRICE COST COST _____________________________________________________________________________________________________________________________________________ ------------dollars----------- dollars -------dollars-------- Grain drill 20' MFWD 150 0.118 1.00 Oct 2.15 1.80 0.82 1.66 0.283 2.05 8.50 Wheat seed - private lb 138.0000 0.13 17.94 17.94 Cstm ap grd fert dry acre 1.00 Oct 1.0000 4.00 4.00 4.00 0-30-30 lb 200.0000 0.09 18.00 18.00 Ammon Nitrate 34% lb 100.0000 0.07 7.00 7.00 Ditcher, rear mount 3' 2WD 130 1.618 0.01 Oct 0.24 0.18 0.12 0.21 0.021 0.15 0.93 Cstm ap air fert acre 1.00 Feb 1.0000 4.50 4.50 4.50 Urea 46% lb 135.0000 0.15 20.25 20.25 Cstm ap air fert acre 1.00 Mar 1.0000 4.50 4.50 4.50 Urea 46% lb 125.0000 0.15 18.75 18.75 Combine Wheat 25' 0.182 1.00 Jun 6.23 12.41 0.227 1.65 20.30 Custom haul bu 1.00 Jun 34.5000 0.15 5.17 5.17 ------- ------- ------- ------- ------ ------- ------- ------- TOTALS 2.40 1.99 7.18 14.29 0.531 3.86 100.11 129.85 INTEREST ON OPERATING CAPITAL 3.36 UNALLOCATED LABOR 0.00 TOTAL SPECIFIED COST 133.21 _____________________________________________________________________________________________________________________________________________

29
Table 6.F Estimated costs per Acre WRCP - 2005 Poinsett Co. _______________________________________________________________________ ITEM UNIT PRICE QUANTITY AMOUNT YOUR FARM _______________________________________________________________________ dollars dollars DIRECT EXPENSES CROP SEED Wheat seed - private lb 0.13 138.0000 17.94 _________ CUSTOM WORK Cstm ap grd fert dry acre 4.00 1.0000 4.00 _________ Cstm ap air fert acre 4.50 2.0000 9.00 _________ Custom haul bu 0.15 34.5000 5.17 _________ FERTILIZER & LIME 0-30-30 lb 0.09 200.0000 18.00 _________ Ammon Nitrate 34% lb 0.07 100.0000 7.00 _________ Urea 46% lb 0.15 260.0000 39.00 _________ OPERATOR LABOR Implements hour 7.26 0.1566 1.13 _________ Tractors hour 7.26 0.1475 1.07 _________ Self-Propelled Eq. hour 7.26 0.2275 1.65 _________ DIESEL FUEL Tractors gal 1.35 1.1211 1.51 _________ Self-Propelled Eq. gal 1.35 1.8746 2.53 _________ REPAIR & MAINTENANCE Implements Acre 0.94 1.0000 0.94 _________ Tractors Acre 0.88 1.0000 0.88 _________ Self-Propelled Eq. Acre 3.70 1.0000 3.70 _________ INTEREST ON OP. CAP. Acre 3.36 1.0000 3.36 _________ -------- TOTAL DIRECT EXPENSES 116.92 _________ FIXED EXPENSES Implements Acre 1.87 1.0000 1.87 _________ Tractors Acre 1.99 1.0000 1.99 _________ Self-Propelled Eq. Acre 12.41 1.0000 12.41 _________ -------- TOTAL FIXED EXPENSES 16.29 _________ -------- TOTAL SPECIFIED EXPENSES 133.21 _________ _______________________________________________________________________

30
Table 7.A Estimated resource use and costs for field operations, per Acre WRVP - 2005 Randolph Co. _____________________________________________________________________________________________________________________________________________ TRACTOR COST EQUIP COST ALLOC LABOR OPERATING INPUT OPERATION/ SIZE/ TRACTOR PERF TIMES -------------- -------------- ------------- ---------------------- TOTAL OPERATING INPUT UNIT SIZE RATE OVER MTH DIRECT FIXED DIRECT FIXED HOURS COST AMOUNT PRICE COST COST _____________________________________________________________________________________________________________________________________________ ------------dollars----------- dollars -------dollars-------- Disk, light cut 25' MFWD 150 0.086 4.00 Sep 6.29 5.27 1.75 4.03 0.447 3.24 20.60 Cstm ap grd fert dry acre 1.00 Oct 1.0000 4.00 4.00 4.00 40-40-0 lbs 100.0000 0.08 8.90 8.90 Cstm seed grd brdcst acre 1.00 Oct 1.0000 4.50 4.50 4.50 Wheat seed - private lb 150.0000 0.13 19.50 19.50 Disk, light cut 25' MFWD 150 0.086 1.00 Oct 1.57 1.31 0.43 1.00 0.111 0.81 5.15 Ditcher, rear mount 3' 2WD 130 1.618 0.01 Oct 0.24 0.18 0.12 0.21 0.021 0.15 0.93 Cstm ap grd fert dry acre 1.00 Feb 1.0000 4.00 4.00 4.00 Urea 46% lb 130.0000 0.15 19.50 19.50 Ammon Sulfate 21.2% lb 50.0000 0.08 4.10 4.10 Cstm ap fert&herb li acre 1.00 Mar 1.0000 4.00 4.00 4.00 Urea 46% lb 110.0000 0.15 16.50 16.50 Harmony Extra oz 0.5000 12.23 6.11 6.11 Cstm ap air 5 gal acre 1.00 Apr 1.0000 4.00 4.00 4.00 Propimax EC oz 4.0000 2.33 9.32 9.32 Combine Wheat 25' 0.182 1.00 Jun 6.23 12.41 0.227 1.65 20.30 Custom haul bu 1.00 Jun 58.7000 0.15 8.80 8.80 ------- ------- ------- ------- ------ ------- ------- ------- TOTALS 8.10 6.78 8.55 17.68 0.807 5.86 113.24 160.23 INTEREST ON OPERATING CAPITAL 3.71 UNALLOCATED LABOR 0.00 TOTAL SPECIFIED COST 163.95 _____________________________________________________________________________________________________________________________________________
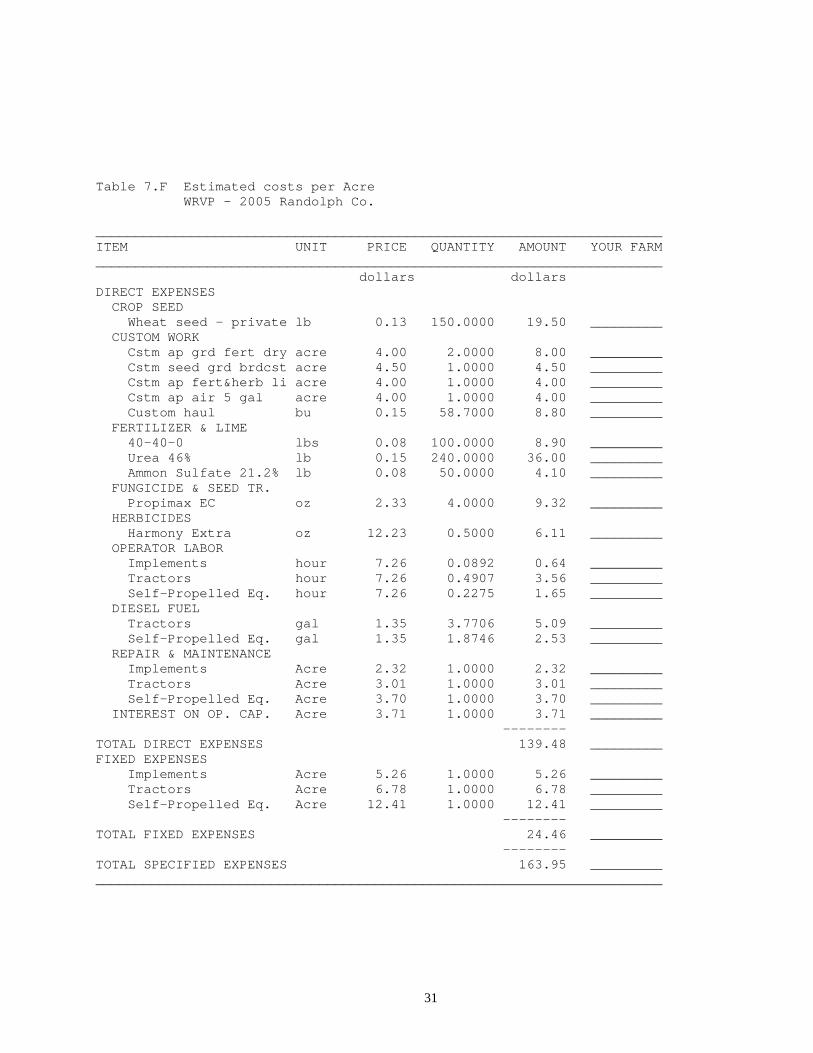
31
Table 7.F Estimated costs per Acre WRVP - 2005 Randolph Co. _______________________________________________________________________ ITEM UNIT PRICE QUANTITY AMOUNT YOUR FARM _______________________________________________________________________ dollars dollars DIRECT EXPENSES CROP SEED Wheat seed - private lb 0.13 150.0000 19.50 _________ CUSTOM WORK Cstm ap grd fert dry acre 4.00 2.0000 8.00 _________ Cstm seed grd brdcst acre 4.50 1.0000 4.50 _________ Cstm ap fert&herb li acre 4.00 1.0000 4.00 _________ Cstm ap air 5 gal acre 4.00 1.0000 4.00 _________ Custom haul bu 0.15 58.7000 8.80 _________ FERTILIZER & LIME 40-40-0 lbs 0.08 100.0000 8.90 _________ Urea 46% lb 0.15 240.0000 36.00 _________ Ammon Sulfate 21.2% lb 0.08 50.0000 4.10 _________ FUNGICIDE & SEED TR. Propimax EC oz 2.33 4.0000 9.32 _________ HERBICIDES Harmony Extra oz 12.23 0.5000 6.11 _________ OPERATOR LABOR Implements hour 7.26 0.0892 0.64 _________ Tractors hour 7.26 0.4907 3.56 _________ Self-Propelled Eq. hour 7.26 0.2275 1.65 _________ DIESEL FUEL Tractors gal 1.35 3.7706 5.09 _________ Self-Propelled Eq. gal 1.35 1.8746 2.53 _________ REPAIR & MAINTENANCE Implements Acre 2.32 1.0000 2.32 _________ Tractors Acre 3.01 1.0000 3.01 _________ Self-Propelled Eq. Acre 3.70 1.0000 3.70 _________ INTEREST ON OP. CAP. Acre 3.71 1.0000 3.71 _________ -------- TOTAL DIRECT EXPENSES 139.48 _________ FIXED EXPENSES Implements Acre 5.26 1.0000 5.26 _________ Tractors Acre 6.78 1.0000 6.78 _________ Self-Propelled Eq. Acre 12.41 1.0000 12.41 _________ -------- TOTAL FIXED EXPENSES 24.46 _________ -------- TOTAL SPECIFIED EXPENSES 163.95 _________ _______________________________________________________________________