2005-2006 beginning college survey of … college survey of student... · 2005-2006 beginning...
TRANSCRIPT
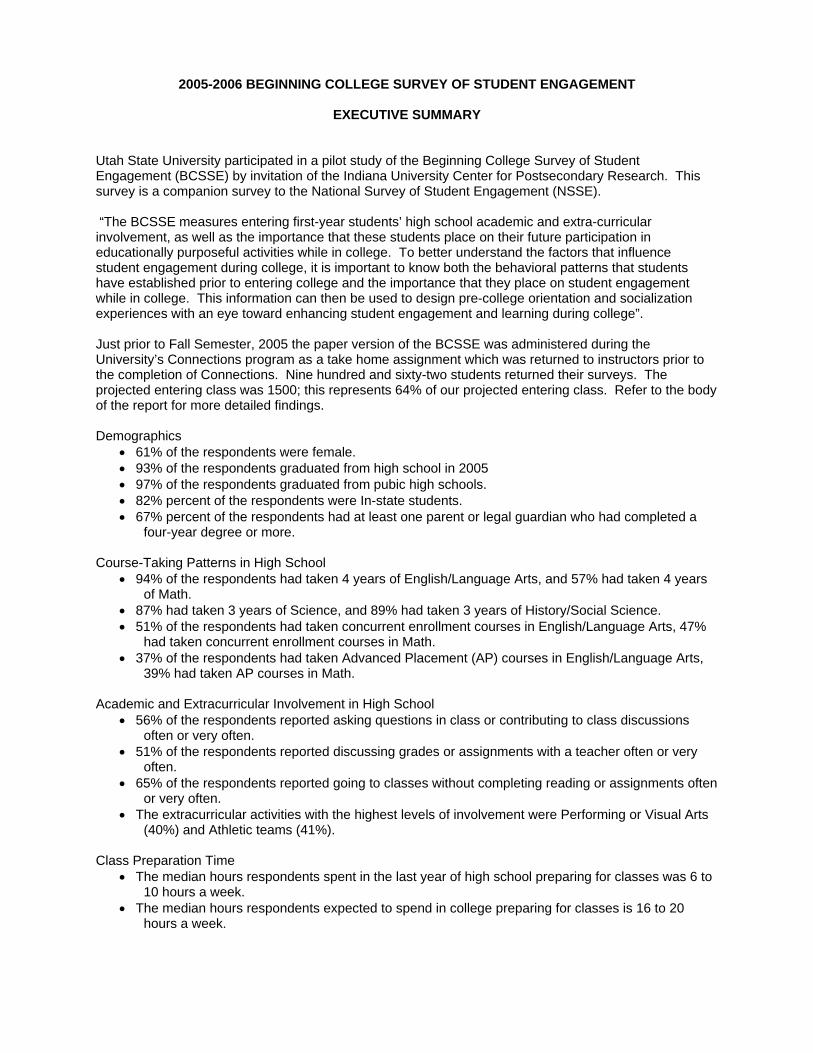
2005-2006 BEGINNING COLLEGE SURVEY OF STUDENT ENGAGEMENT
EXECUTIVE SUMMARY
Utah State University participated in a pilot study of the Beginning College Survey of Student Engagement (BCSSE) by invitation of the Indiana University Center for Postsecondary Research. This survey is a companion survey to the National Survey of Student Engagement (NSSE). “The BCSSE measures entering first-year students’ high school academic and extra-curricular involvement, as well as the importance that these students place on their future participation in educationally purposeful activities while in college. To better understand the factors that influence student engagement during college, it is important to know both the behavioral patterns that students have established prior to entering college and the importance that they place on student engagement while in college. This information can then be used to design pre-college orientation and socialization experiences with an eye toward enhancing student engagement and learning during college”. Just prior to Fall Semester, 2005 the paper version of the BCSSE was administered during the University’s Connections program as a take home assignment which was returned to instructors prior to the completion of Connections. Nine hundred and sixty-two students returned their surveys. The projected entering class was 1500; this represents 64% of our projected entering class. Refer to the body of the report for more detailed findings. Demographics
• 61% of the respondents were female. • 93% of the respondents graduated from high school in 2005 • 97% of the respondents graduated from pubic high schools. • 82% percent of the respondents were In-state students. • 67% percent of the respondents had at least one parent or legal guardian who had completed a
four-year degree or more. Course-Taking Patterns in High School
• 94% of the respondents had taken 4 years of English/Language Arts, and 57% had taken 4 years of Math.
• 87% had taken 3 years of Science, and 89% had taken 3 years of History/Social Science. • 51% of the respondents had taken concurrent enrollment courses in English/Language Arts, 47%
had taken concurrent enrollment courses in Math. • 37% of the respondents had taken Advanced Placement (AP) courses in English/Language Arts,
39% had taken AP courses in Math. Academic and Extracurricular Involvement in High School
• 56% of the respondents reported asking questions in class or contributing to class discussions often or very often.
• 51% of the respondents reported discussing grades or assignments with a teacher often or very often.
• 65% of the respondents reported going to classes without completing reading or assignments often or very often.
• The extracurricular activities with the highest levels of involvement were Performing or Visual Arts (40%) and Athletic teams (41%).
Class Preparation Time
• The median hours respondents spent in the last year of high school preparing for classes was 6 to 10 hours a week.
• The median hours respondents expected to spend in college preparing for classes is 16 to 20 hours a week.

Adjustment to College • The areas where respondents expected the most difficulty adjusting to college were: Keeping up
with school work, managing their time, and paying for college expenses. Shaping Student Expectations
• The most influential sources for respondent’s expectations of college were: family members, and friends/students in high school.
The Beginning College Survey of Student EngagementIndiana University Center for Postsecondary Research
1900 East Tenth StreetEigenmann Hall Suite 419
Bloomington, IN 47406-7512Phone: 812-856-5824
Utah State University
Selected Results from the 2005-2006Beginning College Survey of Student Engagement
BCSSE
Page 1
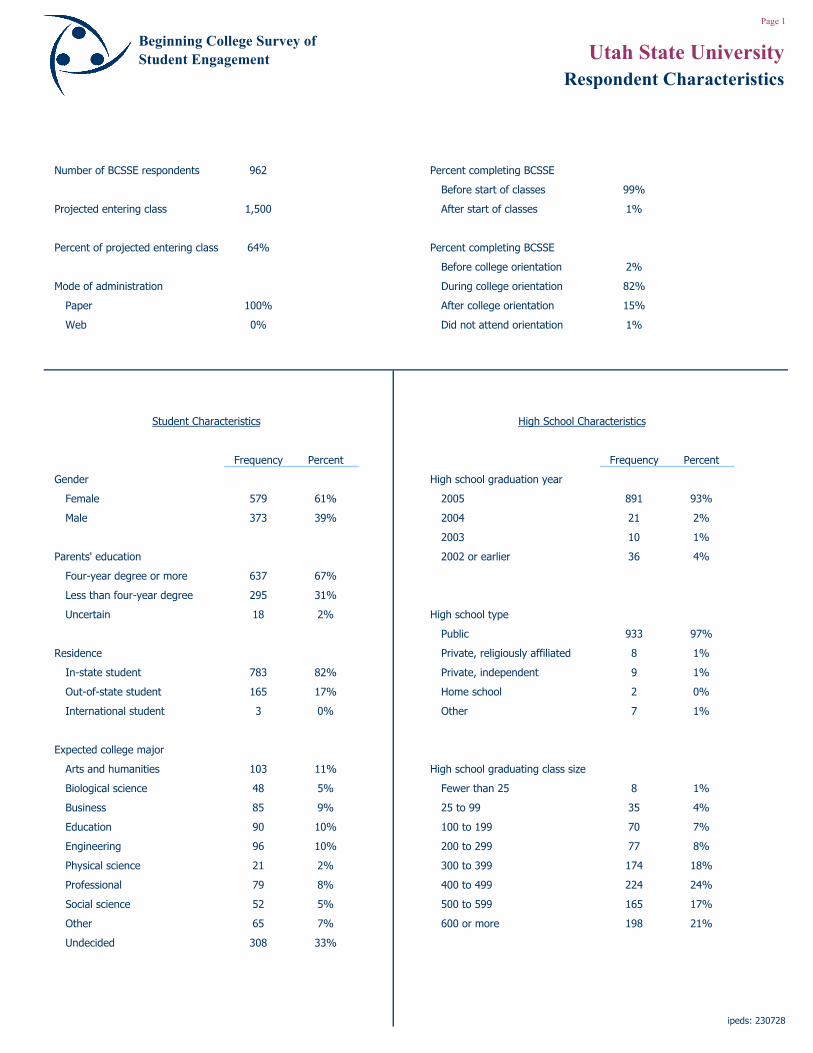
Number of BCSSE respondents 962 Percent completing BCSSE
Before start of classes 99%
Projected entering class 1,500 After start of classes 1%
Percent of projected entering class 64% Percent completing BCSSE
Before college orientation 2%
Mode of administration During college orientation 82%
Paper 100% After college orientation 15%
Web 0% Did not attend orientation 1%
Frequency Percent Frequency Percent
Gender High school graduation year
Female 579 61% 2005 891 93%
Male 373 39% 2004 21 2%
2003 10 1%
Parents' education 2002 or earlier 36 4%
Four-year degree or more 637 67%
Less than four-year degree 295 31%
Uncertain 18 2% High school type
Public 933 97%
Residence Private, religiously affiliated 8 1%
In-state student 783 82% Private, independent 9 1%
Out-of-state student 165 17% Home school 2 0%
International student 3 0% Other 7 1%
Expected college major
Arts and humanities 103 11% High school graduating class size
Biological science 48 5% Fewer than 25 8 1%
Business 85 9% 25 to 99 35 4%
Education 90 10% 100 to 199 70 7%
Engineering 96 10% 200 to 299 77 8%
Physical science 21 2% 300 to 399 174 18%
Professional 79 8% 400 to 499 224 24%
Social science 52 5% 500 to 599 165 17%
Other 65 7% 600 or more 198 21%
Undecided 308 33%
ipeds: 230728
Utah State UniversityRespondent Characteristics
Student Characteristics High School Characteristics
Beginning College Survey of Student Engagement
Page 2
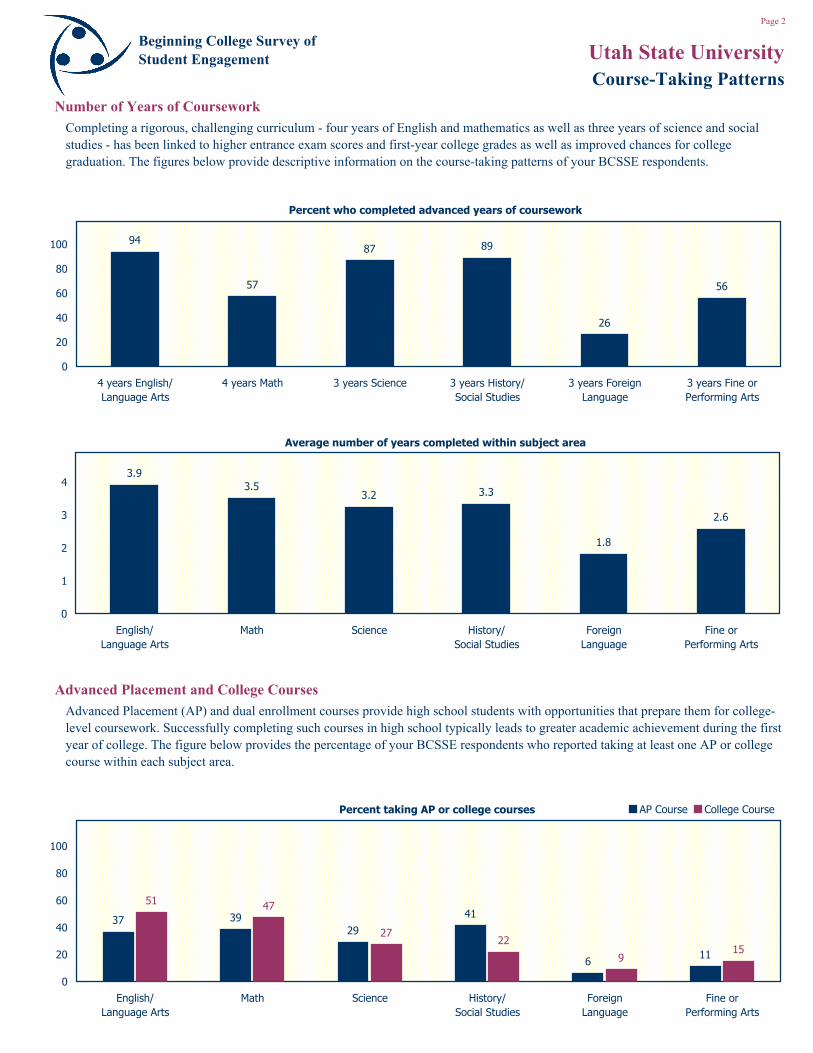
Advanced Placement (AP) and dual enrollment courses provide high school students with opportunities that prepare them for college-level coursework. Successfully completing such courses in high school typically leads to greater academic achievement during the first year of college. The figure below provides the percentage of your BCSSE respondents who reported taking at least one AP or college course within each subject area.
Number of Years of Coursework
Utah State University
Advanced Placement and College Courses
Course-Taking Patterns
Completing a rigorous, challenging curriculum - four years of English and mathematics as well as three years of science and social studies - has been linked to higher entrance exam scores and first-year college grades as well as improved chances for college graduation. The figures below provide descriptive information on the course-taking patterns of your BCSSE respondents.
Percent who completed advanced years of coursework
94
57
87 89
26
56
0
20
40
60
80
100
4 years English/Language Arts
4 years Math 3 years Science 3 years History/Social Studies
3 years ForeignLanguage
3 years Fine orPerforming Arts
Percent taking AP or college courses
37 3929
41
611
51 47
2722
915
0
20
40
60
80
100
English/Language Arts
Math Science History/Social Studies
ForeignLanguage
Fine orPerforming Arts
AP Course College Course
Average number of years completed within subject area
3.93.5
3.2 3.3
1.8
2.6
0
1
2
3
4
English/Language Arts
Math Science History/Social Studies
ForeignLanguage
Fine orPerforming Arts
Beginning College Survey of Student Engagement

Page 3
Participation in extracurricular activities in high school is positively linked with being engaged in other productive activities and increases the chances that students will be satisfied and stay in school. Also, those students who took part in high school extracurricular activities are more likely to be so engaged in college. The figure that follows provides summary information about the level of involvement of your BCSSE respondents in various high school extracurricular activities.
Academic Involvement
Utah State University
Extracurricular Involvement
Academic and Extracurricular Involvement
Students start college with habits of the mind and heart developed during high school and even earlier. The degree to which they were involved in academic activities in high school is an indicator of what they can be expected to do in college. The figure below provides a descriptive summary of the academic involvement of your BCSSE respondents during their senior year of high school.
Percent by level of academic involvement
5 7
65
9
3424
49
22
39 4228
5749
41 3846
56 51
7
35
17
35
14
33
0
20
40
60
80
100
Ask questions inclass or
contribute toclass discussions
Discuss grades orassignments with
a teacher
Come to classwithout
completingreadings orassignments
Work with otherstudents on
projects duringclass
Work withclassmates
outside of class toprepare classassignments
Prepare two ormore drafts of a
paper beforeturning it in
Discuss ideasfrom your
readings orclasses with
teachers outsideof class
Discuss ideasfrom your
readings withothers outside of
class
Low Moderate High
Percent highly involved in multiple extracurricular activities
81
53
31
167
0
20
40
60
80
100
1 or more 2 or more 3 or more 4 or more 5 or more
Percent by level of extracurricular involvement
45 41
54
83
51
77 73
39
15 18 21
8
2314 16
3140 41
26
10
27
9 11
29
0
20
40
60
80
100
Performing orvisual artsprograms
Athletic teams Leadershippositions
Publications Academic honorsocieties
Academic clubs Vocational clubs Service clubs ororganizations
Low Moderate High
Beginning College Survey of Student Engagement
Page 4
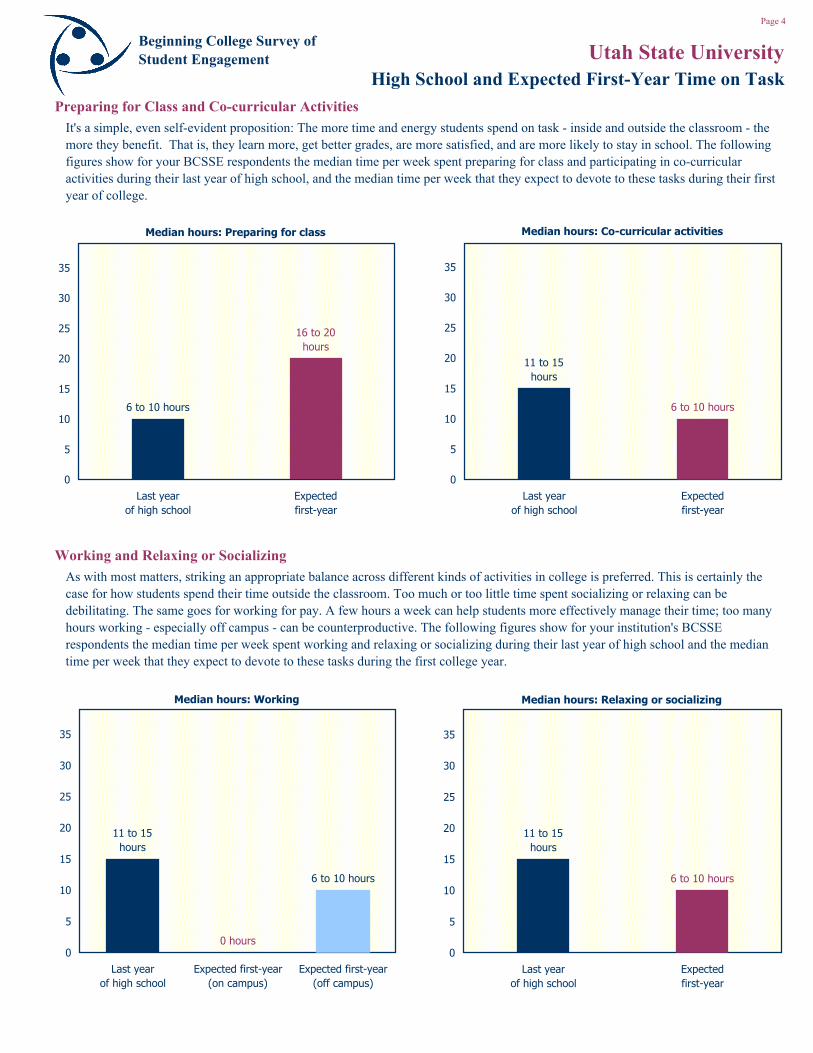
As with most matters, striking an appropriate balance across different kinds of activities in college is preferred. This is certainly the case for how students spend their time outside the classroom. Too much or too little time spent socializing or relaxing can be debilitating. The same goes for working for pay. A few hours a week can help students more effectively manage their time; too many hours working - especially off campus - can be counterproductive. The following figures show for your institution's BCSSE respondents the median time per week spent working and relaxing or socializing during their last year of high school and the median time per week that they expect to devote to these tasks during the first college year.
Working and Relaxing or Socializing
Preparing for Class and Co-curricular Activities
Utah State UniversityHigh School and Expected First-Year Time on Task
It's a simple, even self-evident proposition: The more time and energy students spend on task - inside and outside the classroom - the more they benefit. That is, they learn more, get better grades, are more satisfied, and are more likely to stay in school. The following figures show for your BCSSE respondents the median time per week spent preparing for class and participating in co-curricular activities during their last year of high school, and the median time per week that they expect to devote to these tasks during their first year of college.
Median hours: Working
11 to 15 hours
0 hours
6 to 10 hours
0
5
10
15
20
25
30
35
Last yearof high school
Expected first-year(on campus)
Expected first-year(off campus)
Beginning College Survey of Student Engagement
Median hours: Preparing for class
6 to 10 hours
16 to 20 hours
0
5
10
15
20
25
30
35
Last yearof high school
Expectedfirst-year
Median hours: Co-curricular activities
11 to 15 hours
6 to 10 hours
0
5
10
15
20
25
30
35
Last yearof high school
Expectedfirst-year
Median hours: Relaxing or socializing
11 to 15 hours
6 to 10 hours
0
5
10
15
20
25
30
35
Last yearof high school
Expectedfirst-year
Page 5
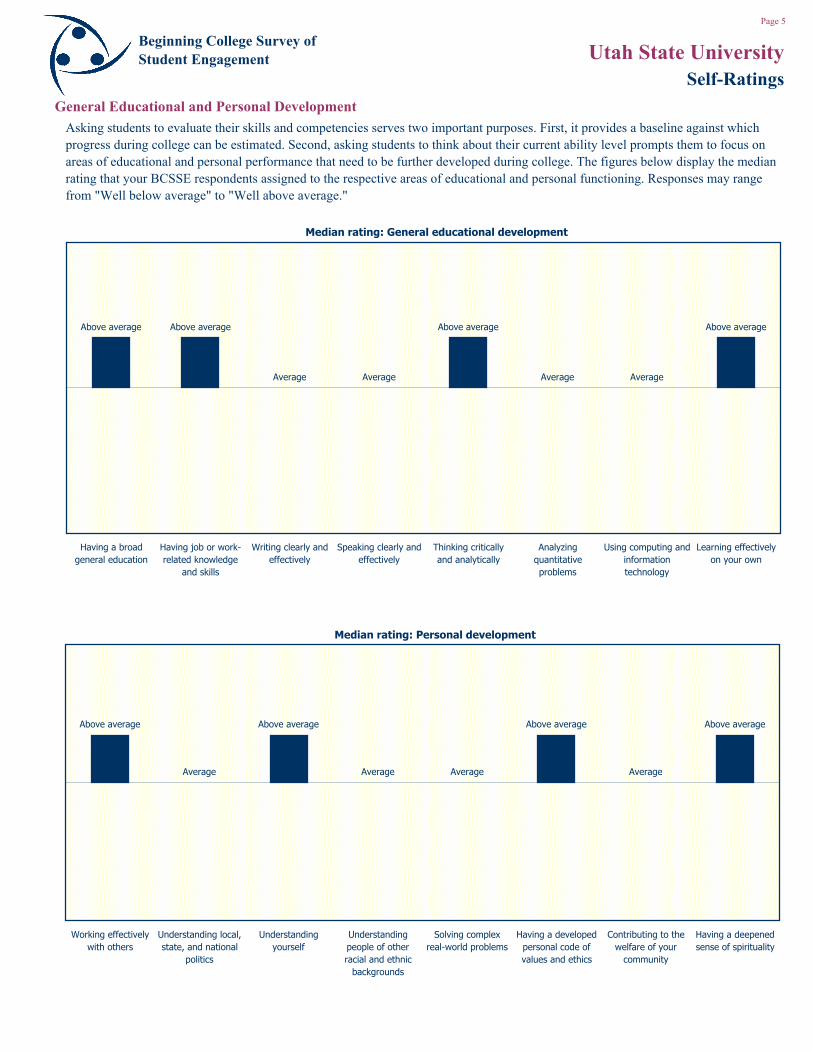
General Educational and Personal Development
Utah State UniversitySelf-Ratings
Asking students to evaluate their skills and competencies serves two important purposes. First, it provides a baseline against which progress during college can be estimated. Second, asking students to think about their current ability level prompts them to focus on areas of educational and personal performance that need to be further developed during college. The figures below display the median rating that your BCSSE respondents assigned to the respective areas of educational and personal functioning. Responses may range from "Well below average" to "Well above average."
Median rating: General educational development
Above average Above average
Average Average
Above average
Average
Above average
Average
-3
-2
-1
0
1
2
Having a broadgeneral education
Having job or work-related knowledge
and skills
Writing clearly andeffectively
Speaking clearly andeffectively
Thinking criticallyand analytically
Analyzingquantitativeproblems
Using computing andinformationtechnology
Learning effectivelyon your own
Beginning College Survey of Student Engagement
Median rating: Personal development
Above average
Average
Above average
Average Average Average
Above averageAbove average
-3
-2
-1
0
1
2
Working effectivelywith others
Understanding local,state, and national
politics
Understandingyourself
Understandingpeople of otherracial and ethnic
backgrounds
Solving complexreal-world problems
Having a developedpersonal code ofvalues and ethics
Contributing to thewelfare of your
community
Having a deepenedsense of spirituality
Page 6
A lot
Not at all
A lot
Not at all
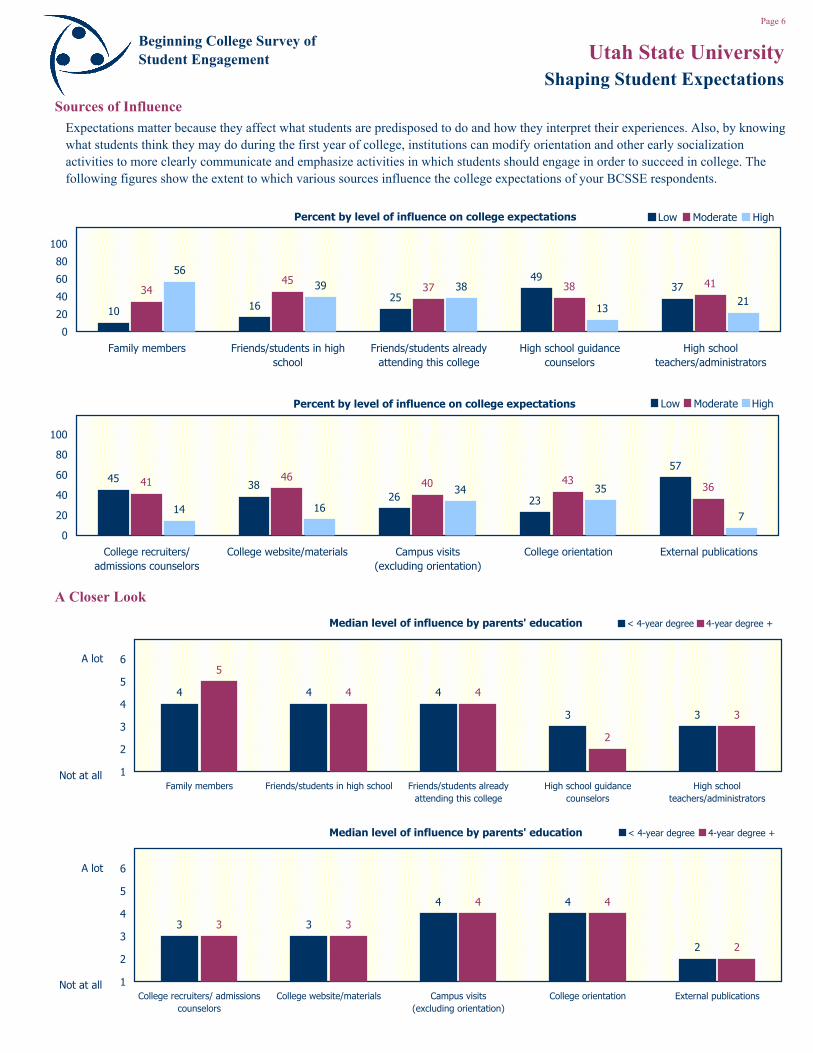
Sources of Influence
Utah State University
A Closer Look
Shaping Student Expectations
Expectations matter because they affect what students are predisposed to do and how they interpret their experiences. Also, by knowing what students think they may do during the first year of college, institutions can modify orientation and other early socialization activities to more clearly communicate and emphasize activities in which students should engage in order to succeed in college. The following figures show the extent to which various sources influence the college expectations of your BCSSE respondents.
Percent by level of influence on college expectations
10 1625
493734
4537 38 41
5639 38
1321
0
20
40
60
80
100
Family members Friends/students in highschool
Friends/students alreadyattending this college
High school guidancecounselors
High schoolteachers/administrators
Low Moderate High
Percent by level of influence on college expectations
4538
26 23
5741 46 40 43
36
14 16
34 35
7
0
20
40
60
80
100
College recruiters/admissions counselors
College website/materials Campus visits(excluding orientation)
College orientation External publications
Low Moderate High
Beginning College Survey of Student Engagement
Median level of influence by parents' education
4 4 4
3 3
5
4 4
2
3
1
2
3
4
5
6
Family members Friends/students in high school Friends/students alreadyattending this college
High school guidancecounselors
High schoolteachers/administrators
< 4-year degree 4-year degree +
Median level of influence by parents' education
3 3
4 4
2
3 3
4 4
2
1
2
3
4
5
6
College recruiters/ admissionscounselors
College website/materials Campus visits(excluding orientation)
College orientation External publications
< 4-year degree 4-year degree +
Page 7
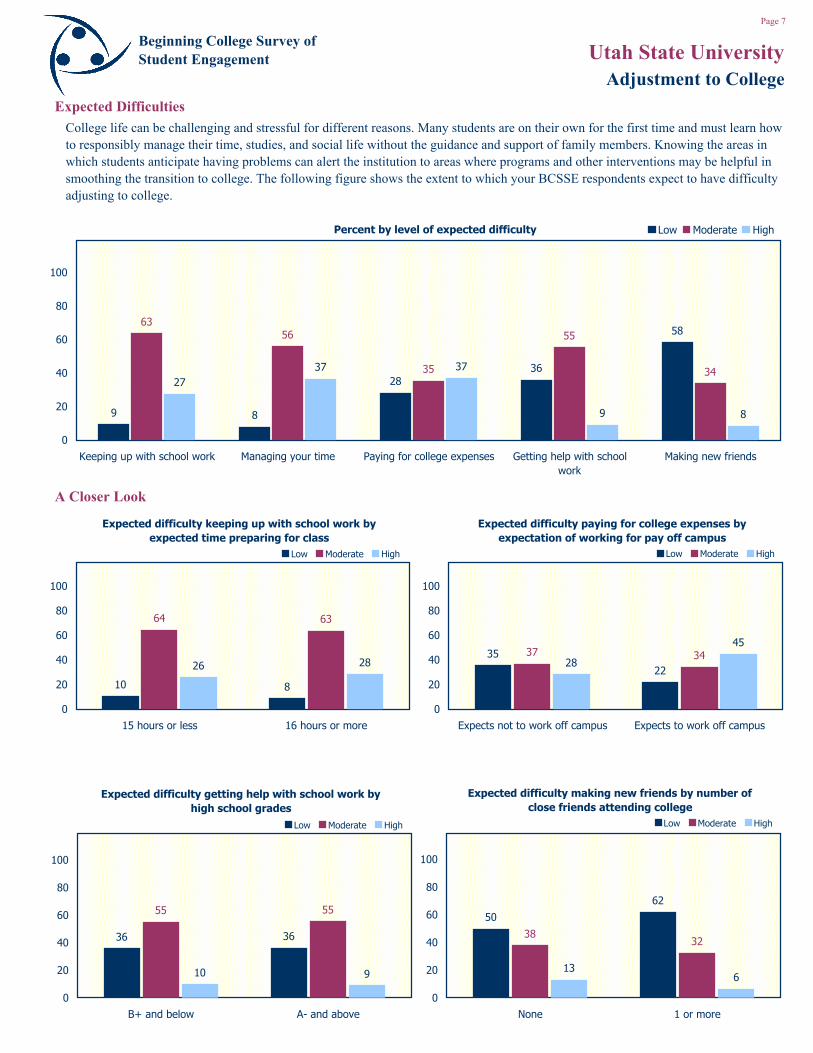
Expected Difficulties
Utah State University
A Closer Look
Adjustment to College
College life can be challenging and stressful for different reasons. Many students are on their own for the first time and must learn how to responsibly manage their time, studies, and social life without the guidance and support of family members. Knowing the areas in which students anticipate having problems can alert the institution to areas where programs and other interventions may be helpful in smoothing the transition to college. The following figure shows the extent to which your BCSSE respondents expect to have difficulty adjusting to college.
Percent by level of expected difficulty
9 8
2836
5863
56
35
55
3427
37 37
9 8
0
20
40
60
80
100
Keeping up with school work Managing your time Paying for college expenses Getting help with schoolwork
Making new friends
Low Moderate High
Expected difficulty keeping up with school work by expected time preparing for class
10 8
64 63
26 28
0
20
40
60
80
100
15 hours or less 16 hours or more
Low Moderate High
Beginning College Survey of Student Engagement
Expected difficulty making new friends by number of close friends attending college
50
62
3832
136
0
20
40
60
80
100
None 1 or more
Low Moderate High
Expected difficulty getting help with school work by high school grades
36 36
55 55
10 9
0
20
40
60
80
100
B+ and below A- and above
Low Moderate High
Expected difficulty paying for college expenses by expectation of working for pay off campus
35
22
37 3428
45
0
20
40
60
80
100
Expects not to work off campus Expects to work off campus
Low Moderate High
Page 8
VeryImportant
NotImportant
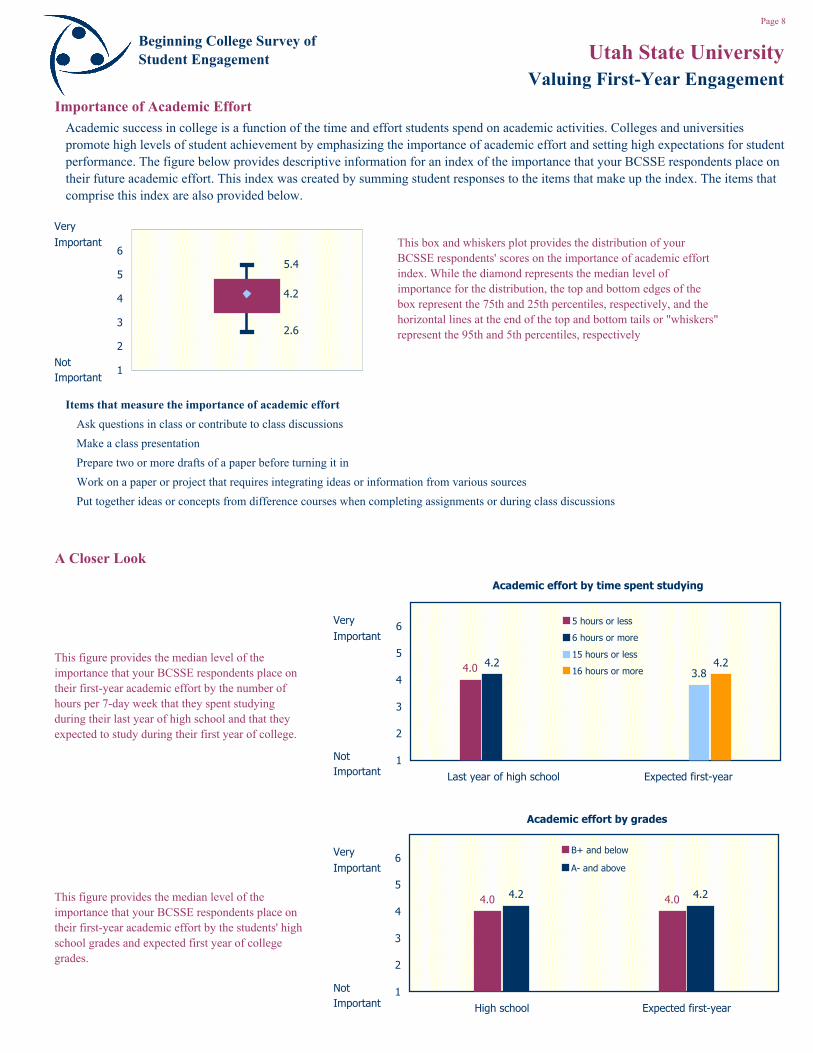
Items that measure the importance of academic effortAsk questions in class or contribute to class discussionsMake a class presentationPrepare two or more drafts of a paper before turning it inWork on a paper or project that requires integrating ideas or information from various sourcesPut together ideas or concepts from difference courses when completing assignments or during class discussions
A Closer Look
VeryImportant
NotImportant
VeryImportant
NotImportant
Utah State UniversityValuing First-Year Engagement
Academic success in college is a function of the time and effort students spend on academic activities. Colleges and universities promote high levels of student achievement by emphasizing the importance of academic effort and setting high expectations for student performance. The figure below provides descriptive information for an index of the importance that your BCSSE respondents place on their future academic effort. This index was created by summing student responses to the items that make up the index. The items that comprise this index are also provided below.
This figure provides the median level of the importance that your BCSSE respondents place on their first-year academic effort by the students' high school grades and expected first year of college grades.
This box and whiskers plot provides the distribution of your BCSSE respondents' scores on the importance of academic effort index. While the diamond represents the median level of importance for the distribution, the top and bottom edges of the box represent the 75th and 25th percentiles, respectively, and the horizontal lines at the end of the top and bottom tails or "whiskers" represent the 95th and 5th percentiles, respectively
This figure provides the median level of the importance that your BCSSE respondents place on their first-year academic effort by the number of hours per 7-day week that they spent studying during their last year of high school and that they expected to study during their first year of college.
Importance of Academic Effort
Academic effort by time spent studying
4.0 4.23.8
4.2
1
2
3
4
5
6
Last year of high school Expected first-year
5 hours or less
6 hours or more
15 hours or less
16 hours or more
Academic effort by grades
4.0 4.04.2 4.2
1
2
3
4
5
6
High school Expected first-year
B+ and below
A- and above
Beginning College Survey of Student Engagement
2.6
4.2
5.4
1
2
3
4
5
6

Page 9
VeryImportant
NotImportant
Items that measure the importance of faculty interactionUse email to communicate with an instructorDiscuss grades or assignments with an instructorTalk about career plans with a faculty member or advisorDiscuss ideas from your readings or classes with faculty members outside of classReceive prompt feedback from faculty on your academic performance (written or oral)Work harder than you think you can to meet an instructor's standards or expectations
VeryImportant
NotImportant
VeryImportant
NotImportant
Importance of Faculty Interaction
Utah State UniversityValuing First-Year Engagement
Students learn firsthand how to think about and solve practical problems by interacting with faculty inside and outside of classrooms. As a result, their teachers become role models, mentors, and guides for lifelong learning. The figure below provides descriptive information for an index of the importance that your BCSSE respondents place on their future interaction with faculty on your campus. This index was created by summing student responses to the items that make up the index. The items that comprise this index are also provided below.
This figure shows the median level of the importance that your BCSSE respondents place on their interaction with faculty by the students' gender
A Closer Look
This figure shows the median level of the importance that your BCSSE respondents place on their interaction with faculty by whether or not one or more of the students' parents received at least a bachelor's degree.
This box and whiskers plot provides the distribution of your BCSSE students' scores on the importance of faculty interaction index. While the diamond represents the median level of importance for the distribution, the top and bottom edges of the box represent the 75th and 25th percentiles, respectively, and the horizontal lines at the end of the top and bottom tails or "whiskers" represent the 95th and 5th percentiles, respectively.
Faculty interaction by parents' education
5.0 5.0
1
2
3
4
5
6
< 4-year degree 4-year degree +
Faculty interaction by gender
5.24.8
1
2
3
4
5
6
Female Male
Beginning College Survey of Student Engagement
3.7
5.0
6.0
1
2
3
4
5
6

Page 10
VeryImportant
NotImportant
Items that measure the importance of diverse perspectivesHave serious conversations with students of a different race or ethnicity than your ownHave serious conversations with students who are very different from you in terms of their religious beliefs, political opinions, and personal valuesExamine the strengths and weaknesses of your own views on a topic or issueTry to better understand someone else's views by imagining how an issue looks from is or her perspectiveLearn something that changes the way you understand an issue or concept
VeryImportant
NotImportant
VeryImportant
NotImportant
This figure shows the median level of the importance that your BCSSE respondents place on their exposure to and learning from diverse perspectives by the students' gender
A Closer Look
This figure shows the median level of the importance that your BCSSE respondents place on their exposure to and learning from diverse perspectives by whether or not one or more of the students' parents received at least a bachelor's degree.
This box and whiskers plot provides the distribution of your BCSSE respondents' scores on the importance of diverse perspectives index. While the diamond represents the median level of importance for the distribution, the top and bottom edges of the box represent the 75th and 25th percentiles, respectively, and the horizontal lines at the end of the top and bottom tails or "whiskers" represent the 95th and 5th percentiles, respectively
Importance of Diverse Perspectives
Utah State UniversityValuing First-Year Engagement
Experiencing diversity teaches students valuable things about themselves and other cultures. It also prepares them to work effectively with people from different backgrounds, a personal competency that is increasingly important. The figures below provide descriptive information for an index of the importance that your BCSSE respondents place on their future diverse learning experiences. This index was created by summing student responses to the items that make up the index. The items that comprise this index are also provided below.
Diverse perspectives by parents' education
4.6 4.6
1
2
3
4
5
6
< 4-year degree 4-year degree +
Diverse perspectives by gender
4.64.3
1
2
3
4
5
6
Female Male
Beginning College Survey of Student Engagement
2.8
4.6
6.0
1
2
3
4
5
6
Page 11
VeryImportant
NotImportant
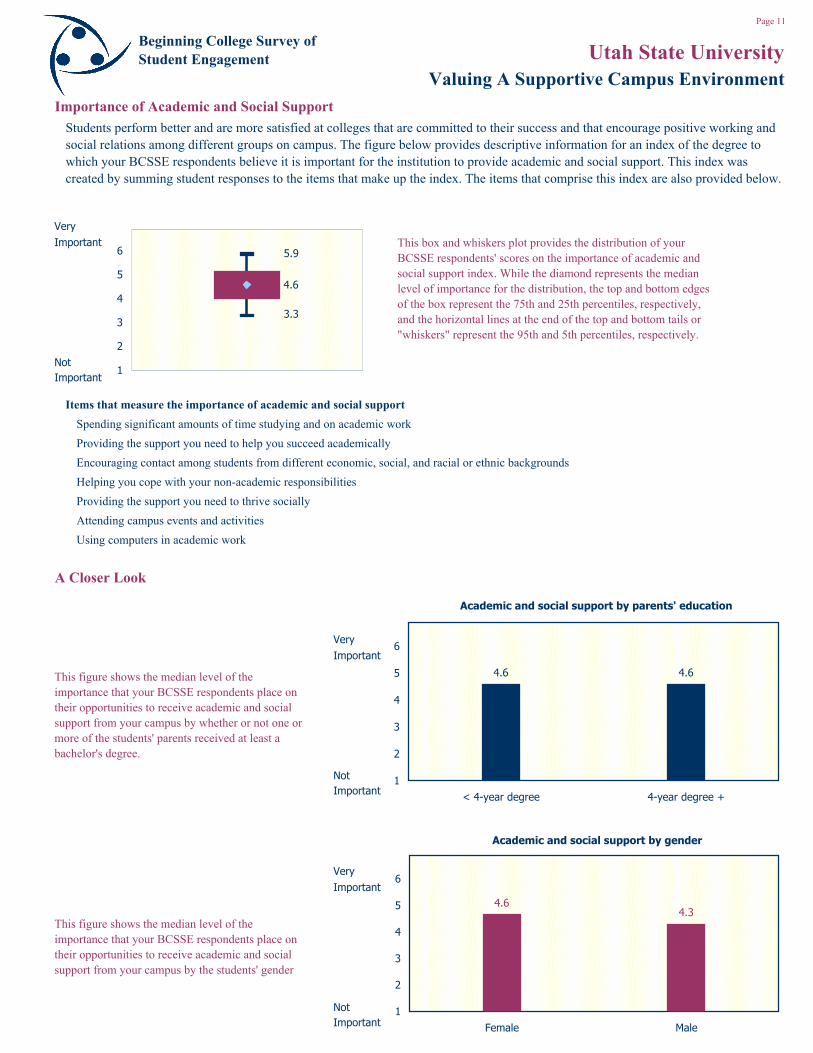
Items that measure the importance of academic and social supportSpending significant amounts of time studying and on academic workProviding the support you need to help you succeed academicallyEncouraging contact among students from different economic, social, and racial or ethnic backgroundsHelping you cope with your non-academic responsibilitiesProviding the support you need to thrive sociallyAttending campus events and activitiesUsing computers in academic work
VeryImportant
NotImportant
VeryImportant
NotImportant
Importance of Academic and Social Support
Utah State UniversityValuing A Supportive Campus Environment
Students perform better and are more satisfied at colleges that are committed to their success and that encourage positive working and social relations among different groups on campus. The figure below provides descriptive information for an index of the degree to which your BCSSE respondents believe it is important for the institution to provide academic and social support. This index was created by summing student responses to the items that make up the index. The items that comprise this index are also provided below.
This figure shows the median level of the importance that your BCSSE respondents place on their opportunities to receive academic and social support from your campus by the students' gender
A Closer Look
This figure shows the median level of the importance that your BCSSE respondents place on their opportunities to receive academic and social support from your campus by whether or not one or more of the students' parents received at least a bachelor's degree.
This box and whiskers plot provides the distribution of your BCSSE respondents' scores on the importance of academic and social support index. While the diamond represents the median level of importance for the distribution, the top and bottom edges of the box represent the 75th and 25th percentiles, respectively, and the horizontal lines at the end of the top and bottom tails or "whiskers" represent the 95th and 5th percentiles, respectively.
Academic and social support by parents' education
4.6 4.6
1
2
3
4
5
6
< 4-year degree 4-year degree +
Academic and social support by gender
4.64.3
1
2
3
4
5
6
Female Male
Beginning College Survey of Student Engagement
3.3
4.6
5.9
1
2
3
4
5
6