2004 web gis wepp
TRANSCRIPT

The authors are solely responsible for the content of this technical presentation. The technical presentation does not necessarily reflect the official position of ASAE or CSAE, and its printing and distribution does not constitute an endorsement of views which may be expressed. Technical presentations are not subject to the formal peer review process, therefore, they are not to be presented as refereed publications. Citation of this work should state that it is from an ASAE/CSAE meeting paper. EXAMPLE: Author's Last Name, Initials. 2004. Title of Presentation. ASAE/CSAE Meeting Paper No. 04xxxx. St. Joseph, Mich.: ASAE. For information about securing permission to reprint or reproduce a technical presentation, please contact ASAE at [email protected] or 269-429-0300 (2950 Niles Road, St. Joseph, MI 49085-9659 USA).
An ASAE/CSAE Meeting Presentation Paper Number: 042024
Web-based GIS Application of the WEPP Model
Dennis C. Flanagan, Agricultural Engineer USDA-ARS National Soil Erosion Research Laboratory, 275 S. Russell St., West Lafayette, Indiana, 47907 USA. email: [email protected]
James R. Frankenberger, Computer Specialist USDA-ARS National Soil Erosion Research Laboratory, 275 S. Russell St., West Lafayette, Indiana, 47907 USA. email: [email protected]
Bernard A. Engel, Professor Agricultural & Biological Eng. Dept., Purdue University, 225 S. University St., West Lafayette, Indiana, 47907 USA. email: [email protected]
Written for presentation at the 2004 ASAE/CSAE Annual International Meeting
Sponsored by ASAE/CSAE Fairmont Chateau Laurier, The Westin, Government Centre
Ottawa, Ontario, Canada 1 - 4 August 2004
Abstract. WEPP (Water Erosion Prediction Project) is a process-based, distributed parameter, continuous simulation erosion prediction model. Work over the past several years has focused on development of improved user interfaces and linkage of WEPP to Geographic Information Systems (GIS) that can allow rapid and impartial delineation of watersheds and topographic features based upon digital elevation data. However, many potential users of WEPP have little or no experience with commercial GIS packages, and that software can also be quite expensive. This paper discusses a web-based WEPP-GIS system that only requires a user to have a network connection and web browser. GIS Viewer software allows users to specify an area of interest to model with WEPP, then digital elevation data for the area is sent to topographic parameterization software to delineate watersheds, channels and hillslopes. The digital elevation data are processed on the server side, and then images of the delineated watershed and hillslopes are passed to the user’s web-browser window. Once the hillslopes and channels have been located, WEPP model simulations of representative hillslope profiles and channels, and/or all flowpaths in the watershed, are conducted. The modeled soil erosion results in graphical format are sent as images to the client computer. Subsequent model simulations using different land management practices can help to show the impact of conservation practices on runoff and soil erosion. Keywords. Erosion prediction, Geographic Information Systems, Internet

2
Introduction Prediction of runoff, soil erosion and sediment yield is becoming increasingly important as concerns about water quality increase. Use of computer simulation models is the only feasible approach in determining the impact of various land management scenarios across large areas, due to high dollar, time and labor costs associated with on-site monitoring activities.
For field- and farm- scale predictions of soil erosion and sediment delivery, the USDA-Agricultural Research Service and other federal agencies have developed the Water Erosion Prediction Project (WEPP) model (Flanagan and Nearing, 1995). This erosion prediction model is based upon fundamental hydrologic and erosion processes, and predicts runoff, soil loss, sediment transport and sediment deposition from individual storm events within a continuous simulation. Running cumulative totals allow calculation of monthly, annual and average annual runoff, soil loss and sediment yield results for hillslope profiles as well as small watersheds composed of multiple hillslopes, channels and impoundments.
WEPP was publicly released in 1995, but at that time only had a DOS-based interface to assist users in building and editing input files and setting up hillslope and watershed simulations (Flanagan et al., 1994). The DOS interface was mainly developed for use by researchers in testing the model and conducting validation exercises – it was not suitable for field users and in particular the simulation of watersheds could be confusing and cumbersome. From 1996 to 2000, a Windows interface for WEPP was developed (Flanagan et al., 1998), that made model simulations much easier, and the software was comparable to other Windows programs.
However, even with the Windows software, simulation of watersheds with WEPP could still be difficult and time-consuming, because in this interface the user still needs to provide all of the topographic, soil, management, and other information for all elements of the watershed. For a small watershed composed of a few elements (such as one channel and three hillslopes), this is not too difficult, but for a more typical farm watershed with perhaps seven channel segments and twenty hillslopes, structuring and providing data for every element can become a daunting task.
To address these concerns, efforts to utilize digital elevation data and apply the WEPP model within a Geographic Information System (GIS) were begun in 1996. Techniques were developed and tested to use digital elevation model (DEM) data to define water flow paths within a sub-basin, then utilize the flow path information to derive a representative hillslope profile for use in watershed simulations (Cochrane and Flanagan, 1999; Cochrane and Flanagan, 2003). Ultimately this work resulted in the GeoWEPP software (Renschler et al., 2002; Renschler, 2003), which is an ArcView∗ extension currently operating under ESRI Arcview 3.x and also requiring the ESRI Spatial Analyst* software.
GeoWEPP is a powerful and useful tool that can allow for much easier and rapid watershed applications of the WEPP model. Some advantages of GeoWEPP include the ability to use DEM data from a variety of sources, as well access to the full power of the GIS environment. A major disadvantage is that the user has to manage and find data, and use the correct projections and data preparations, all of which can be very confusing for novice GIS users. Additionally, a GeoWEPP user must have a personal computer (PC) with the necessary software (ArcView and Spatial Analyst) and hardware (large hard drive, large amount of memory, fast processor) to handle processing of spatial data. The ESRI software costs $3690 (http://store.esri.com/esri), and an adequate PC for GIS applications would cost about $2000.
∗ Use of trade names does not imply endorsement by the USDA-Agricultural Research Service or Purdue University.

3
To address some of the shortcomings of the current GeoWEPP tool, and provide a more useful GIS interface that is accessible by the widest possible group of users, development began in 2003 on a Web-based GIS interface for WEPP. This new tool would utilize the core procedures developed by Cochrane and Flanagan (1999) and implemented in GeoWEPP, but would do so within an interface that would only require a Web-browser and Internet connection on the user’s PC. This paper describes the current status of the WEPP Web-based GIS interface, and provides an example application of the software.
Materials and Methods The Web-based GIS interface for the WEPP model is composed of several pieces. We will discuss here the individual components and how they function together to perform a WEPP watershed model simulation.
The Water Erosion Prediction Project (WEPP) Model
The basic WEPP model is a program coded in FORTRAN-77 containing approximately 220 subroutines. WEPP contains modules to predict infiltration, percolation, evapotranspiration, daily water balance, surface runoff, plant growth, residue decomposition, soil disturbance and consolidation, flow hydraulics, soil detachment by raindrop impact, soil detachment by flowing water, sediment transport, and sediment deposition (Flanagan et al., 1995). Additionally it has components to predict channel detachment, down cutting and widening, deposition in channels, as well as estimate the deposition of sediment in surface impoundments such as culverts and farm ponds (Ascough et al., 1997).
For simulation of runoff and erosion from hillslope profiles, a minimum of four input files are required: slope, soil, management and climate (Flanagan and Livingston, 1995). Additional input files for fixed date or depletion level irrigation can be used for hillslope simulations. In watershed simulations, each hillslope modeled must have the basic four input files, as must each channel element. Channels also require a channel input parameter file containing information specific for the waterway. If impoundments are utilized, then a special input file for them must also be created. Watershed simulations also require a structure file that describes how each element in the watershed is connected to the others.
CLIGEN (Nicks et al., 1995) is a climate generator for WEPP (also coded in FORTRAN-77) that predicts daily temperatures, rainfall depth, storm intensity characteristics, solar radiation, wind speed and wind direction. The generator is most often used to generate a long time series of simulated weather (50 or 100 years) to use as climate input for the WEPP model.
GIS Interface Hardware and Software
A dedicated dual processor Athlon server running Linux is the hardware for the current prototype system. The server has 2GB of memory and 250GB of disk space, and has been initially designed to support a small number of concurrent users (about 25).
This project uses the open source MapServer environment from the University of Minnesota (http://mapserver.gis.umn.edu) as the basic Web GIS. The TOPAZ (TOpographic PArameteriZation, Garbrecht and Martz, 1997) digital landscape analysis tool, which includes flow-vector and subcatchment information, is used for channel, watershed and sub-basin (hillslope) delineation.
There are six major software components of the Web-based WEPP GIS system (Figure 1). A user selects a state of interest, then can zoom in to find their specific area of interest. The data for display is obtained from the TerraServer site and from local spatial data on the NSERL server. Image data is sent from the MapServer software (1 in Figure 1) to the client’s Web-

4
browser, and MapServer also handles requests for zooming and panning. After the exact location of interest to conduct a model simulation with WEPP has been identified, TopazPrep software (2 in Figure 1) extracts a region of the DEM to process with TOPAZ. TopazPrep is custom software coded in C++ and PHP. PHP is an open source scripting language used for Web development and it can be inserted into HTML (HyperText Markup Language).
Figure 1. WEPP Web-based GIS system schematic.
The TOPAZ software (3 in Figure 1) is run at least two times. The first time is to delineate the entire network of channels within the displayed region of the DEM. Once the delineated channels are visible, the user can either accept them, or alter the critical source area and minimum channel length parameters and rerun TOPAZ until a satisfactory representation of the channel network is visible. The user must then select the outlet point for their watershed of interest, after which TOPAZ is run a second time to delineate the watershed boundary and sub-basins (hillslope regions). The area the user can model is currently limited to 0.25 degrees latitude by 0.25 degrees longitude, in order to ensure that TOPAZ can handle the extracted
Mapserver (Web GIS) (1)
[HTML, Javascript, Map config. files]
User’s (Client) Web Browser (Internet Explorer, Netscape, etc.)
Web Server – (Apache 2.0)
Client PC
Server Hardware
TOPAZ Maps
TerraServer Web Services (Orthophotos,
DRGs) remote data
Erosion Maps
TopazPrep (2)– extract DEM data, reformat
[PHP, C++]
TOPAZ (3) – channel
delineation [FORTRAN]
TOPAZ (3) – watershed delineation
[FORTRAN] NED, Land use, soils, roads, rivers layers
WeppPrep (4) – extract land use, soils, climate, generate WEPP inputs, run model, produce maps [PHP, C++]
WEPP (6) [FORTRAN]
WEPP generated
data
TOPAZ generated
data
CLIGEN (5)[FORTRAN]

5
DEM and have a reasonable response time. Once an acceptable watershed has been delineated, the WeppPrep (4 in Figure 1) program (custom software also written in C++ and PHP) generates WEPP inputs from the extracted DEM, land use, soils and TOPAZ watershed structures. WeppPrep also executes the CLIGEN (5 in Figure 1) weather generator to create a climate input file for WEPP. Finally, the WEPP model (6 in Figure 1) is run on the hillslopes/channels and/or flowpaths. Once the WEPP simulations are complete, WeppPrep scans the output files, interprets the results and produces maps which are sent to the client using MapServer.
On-line Data Access
The WEPP Web-based GIS software utilizes many datasets. Some of these are housed locally on the server at the NSERL, while others are accessed via the Internet as needed for an individual user’s session.
The commonly available data on the NSERL server used as the basis for the WEPP inputs are: • The National Elevation Dataset from the United States Geological Survey (USGS)
(http://gisdata.usgs.gov/NED/default.asp), 30 m coverage for the entire U.S. This data has been pre-processed and clipped by state boundaries with a 1 km buffer.
• The National Land Cover Dataset from the USGS (http://landcover.usgs.gov/nationallandcover.asp). The current dataset is from 1992, with an update to 2001 data expected in the near future.
• The STATSGO soil data from USDA Natural Resources Conservation Service – This is at a regional scale with the SOILS5 ID linking to the existing WEPP soil data from 1995. Some areas have more detailed SSURGO data that in the future would be better to use for WEPP simulations (http://www.ncgc.nrcs.usda.gov/branch/ssb/products/ssurgo).
• Climate Data – There are about 2600 weather stations in the U.S. parameterized for application of CLIGEN. Recently the ability to utilize PRISM (Parameter elevations Regressions on Independent Slopes Model) climate data has become available, and is an option within the WEPP Web-GIS interface. PRISM (http://www.ocs.orst.edu/prism) data is at a 4 km resolution with monthly normal data points for precipitation (1961-2000), minimum temperature (1971-2000) and maximum temperature (1971-2000). We can select the nearest station to the watershed and optionally insert the PRISM monthly means into a new CLIGEN parameter file before running the generator.
Topographic map images (digital raster graphs) and orthophotos are provided to assist users in locating the area where they wish to apply the WEPP watershed model. These data do not permanently reside on the NSERL server, but are instead retrieved on demand from TerraServer USA (http://terraservice.net) using the Web Mapping Services protocol. Other image data such as rivers, roads and county boundaries are kept on the local NSERL server and are also used for orientating the user. However, none of the image information is actually used as input when running a WEPP model simulation.
Example Application The remainder of this paper will be comprised of an example application of the WEPP Web-based GIS product, and examining how it can be used to identify areas requiring alternative land management to reduce soil erosion or sediment loss to acceptable levels. Currently, a user would open their web browser software, then connect to the NSERL web interface site at the URL http://milford.nserl.purdue.edu, and select the Web Internet GIS Interface option.

6
Figure 2. Main screen of the WEPP Web-based GIS system.
Figure 2 shows the current main screen for the interface. In the prototype, complete data has only been prepared for Indiana, New York and Vermont, while information for other states is in the process of being created. The user would select a state, for example New York, and then proceed to the next screen (Figure 3).
Figure 3 shows the outline of the state of New York, along with counties outlined and named. The user would use a left mouse click on the county of interest to re-center the state map, then could click on the zoom in button (magnifying glass icon with a “+” sign). In this example, we will choose a watershed site in Rensselear County, which is on the eastern side of the state (below Washington County and unlabeled in initial state view).

7
Figure 3. State (New York) screen of the WEPP Web-based GIS system.
The user could select either DRG images or orthophotos from the TerraServer, in order to orient themselves and locate their watershed of interest. In Figure 4, we are using the DRG image, and have delineated the channel network with the TOPAZ program and USGS 30 m DEM data.
The next step is to select an outlet point for our watershed of interest. In Figure 5 we have zoomed in one step closer, selected an outlet point for our watershed, and then run TOPAZ again to build the subcatchments.
Setting up and running the WEPP model is the next step in the process. The user would click on the “Setup WEPP Model” button at the bottom right of the screen in Figure 5, to proceed to the screen displayed in Figure 6. The nearest climate station that has been automatically selected is Troy Lock and Dam. We have also chosen to use the PRISM spatial climate adjustments for our watershed location, and run a simulation of 10 years for the entire watershed and for all flowpaths within the watershed. The cropping management that we have selected is a corn-soybean rotation with a fall moldboard plowing tillage system. The soil selected is a Farmington silt loam. Other parameters associated with the channels can also be selected and modified. To run the actual WEPP model simulations, we click on the “Run WEPP” button at the bottom right of the screen in Figure 6.

8
Figure 4. WEPP Web-based GIS window view after zooming into Rensselear County in the State of New York, and building channel network.
Figure 5. Watershed and subcatchments (hillslopes) delineated with the TOPAZ software.

9
Figure 6. Setting up WEPP model simulation run for delineated watershed.
Figure 7. WEPP predicted spatial soil loss results for a fall moldboard plow corn-soybean rotation. Initial base T (Tolerable soil loss) value used was 1 T/ha/yr.
10
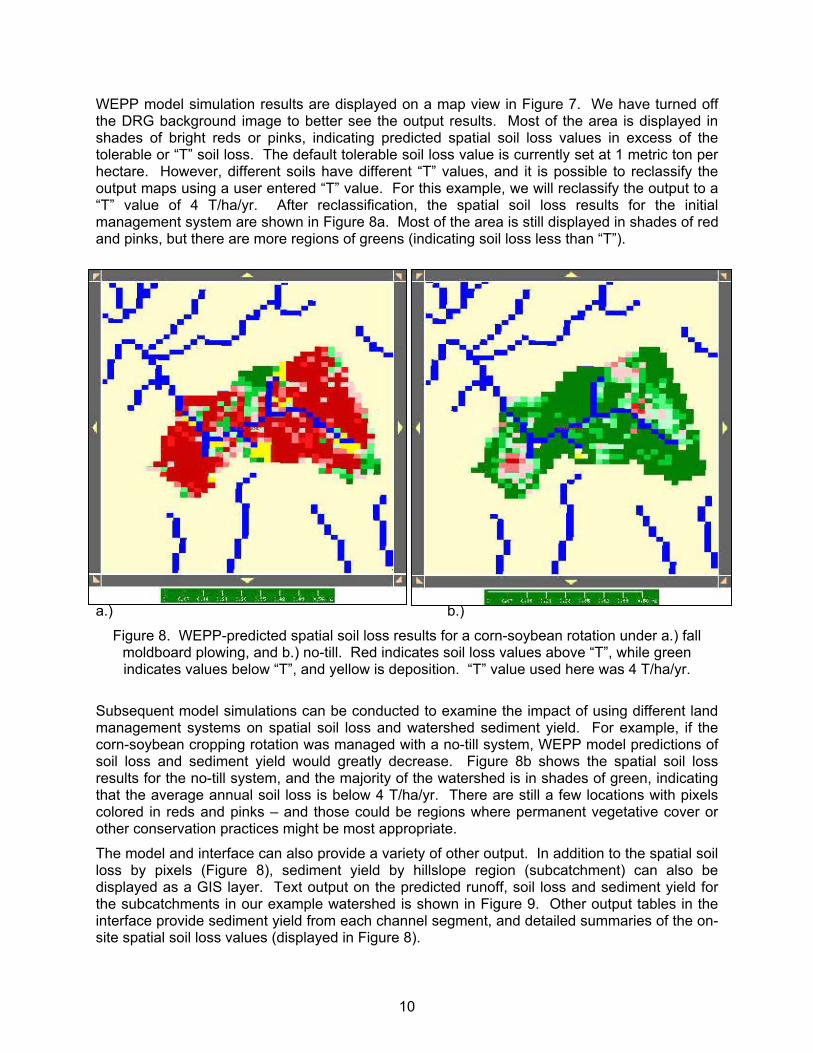
WEPP model simulation results are displayed on a map view in Figure 7. We have turned off the DRG background image to better see the output results. Most of the area is displayed in shades of bright reds or pinks, indicating predicted spatial soil loss values in excess of the tolerable or “T” soil loss. The default tolerable soil loss value is currently set at 1 metric ton per hectare. However, different soils have different “T” values, and it is possible to reclassify the output maps using a user entered “T” value. For this example, we will reclassify the output to a “T” value of 4 T/ha/yr. After reclassification, the spatial soil loss results for the initial management system are shown in Figure 8a. Most of the area is still displayed in shades of red and pinks, but there are more regions of greens (indicating soil loss less than “T”).
a.) b.)
Figure 8. WEPP-predicted spatial soil loss results for a corn-soybean rotation under a.) fall moldboard plowing, and b.) no-till. Red indicates soil loss values above “T”, while green indicates values below “T”, and yellow is deposition. “T” value used here was 4 T/ha/yr.
Subsequent model simulations can be conducted to examine the impact of using different land management systems on spatial soil loss and watershed sediment yield. For example, if the corn-soybean cropping rotation was managed with a no-till system, WEPP model predictions of soil loss and sediment yield would greatly decrease. Figure 8b shows the spatial soil loss results for the no-till system, and the majority of the watershed is in shades of green, indicating that the average annual soil loss is below 4 T/ha/yr. There are still a few locations with pixels colored in reds and pinks – and those could be regions where permanent vegetative cover or other conservation practices might be most appropriate.
The model and interface can also provide a variety of other output. In addition to the spatial soil loss by pixels (Figure 8), sediment yield by hillslope region (subcatchment) can also be displayed as a GIS layer. Text output on the predicted runoff, soil loss and sediment yield for the subcatchments in our example watershed is shown in Figure 9. Other output tables in the interface provide sediment yield from each channel segment, and detailed summaries of the on-site spatial soil loss values (displayed in Figure 8).

11
Figure 9. WEPP-predicted runoff, soil loss, and sediment yield for each of the hillslope subcatchments in Figure 6 under the no-till corn-soybean rotation management system.
Future Work Additional work is continuing on the WEPP Web-based GIS system, and a fully functional product is expected to be completed by the end of 2004. Elevation datasets for all remaining states need to be completed, and additional functionality is needed for selection, viewing and modification of channel parameters. Expansion of cropping/management data is also in progress to provide a wide range of typical sets for each state. At some point in the future, the ability to insert impoundments at locations within a watershed needs to be added. This type of interface with additional modifications could also be used to assist with estimation of soil erosion under center pivot irrigation systems.

12
Conclusion The WEPP Web-based GIS software is a very powerful tool that will allow for rapid and unbiased estimates of soil loss and sediment yield from small watersheds. When databases are populated for the entire United States, it will be very easy to determine potential soil erosion under current land management, impacts of alternative land management, and critical locations that may need the highest level of soil conservation practices. Further development on this type of software will be needed to provide enhanced tools that can utilize all of the features of the WEPP model (impoundments, irrigation, etc.).
References Ascough, J.C. II, C. Baffaut, M.A. Nearing and B.Y. Liu. 1997. The WEPP watershed model I.:
hydrology and erosion. Trans. ASAE 40(4):921-933. Cochrane, T.A. and D.C. Flanagan. 1999. Assessing water erosion in small watersheds using
WEPP with GIS and digital elevation models. J. Soil and Water Conserv. 54(4):678-685. Cochrane, T.A. and D.C. Flanagan. 2003. WEPP watershed modeling with DEM's and GIS:
the representative hillslope profile method. Trans. ASAE 46(4):1041-1049. Flanagan, D.C. and S.J. Livingston (eds.). 1995. Water Erosion Prediction Project (WEPP)
Version 95.7 User Summary. NSERL Report No. 11, National Soil Erosion Research Laboratory, USDA-Agricultural Research Service, West Lafayette, Indiana.
Flanagan, D.C. and M.A. Nearing (eds.). 1995. USDA-Water Erosion Prediction Project (WEPP) Hillslope Profile and Watershed Model Documentation. NSERL Report No. 10, National Soil Erosion Research Laboratory, USDA-Agricultural Research Service, West Lafayette, Indiana.
Flanagan, D.C., D.A. Whittemore, S.J. Livingston, J.C. Ascough and M.R. Savabi. 1994. Interface for the Water Erosion Prediction Project model. ASAE Paper No. 94-2105. St. Joseph, MI: ASAE. 16 pp.
Flanagan, D.C., J.C. Ascough II, A.D. Nicks, M.A. Nearing and J.M. Laflen. 1995. Overview of the Water Erosion Prediction Project erosion model. Chapter 1 in (D.C. Flanagan and M.A. Nearing, eds.): USDA-Water Erosion Prediction Project (WEPP) Hillslope Profile and Watershed Model Documentation, NSERL Report No. 10, USDA-Agricultural Research Service, West Lafayette, Indiana.
Flanagan, D.C., H. Fu, J.R. Frankenberger, S.J. Livingston and C.R. Meyer. 1998. A Windows interface for the WEPP erosion model. ASAE Paper No. 98-2135. St. Joseph, MI: ASAE. 14 pp.
Garbrecht, J. and L. W. Martz, L.W. 1997. TOPAZ: An Automated Digital Landscape Analysis Tool for Topographic Evaluation, Drainage Identification, Watershed Segmentation and Subcatchment Parameterization: Overview. ARS-NAWQL 95-1, US Department of Agriculture, Agricultural Research Service, Durant, Oklahoma.
Nicks, A.D., L.J. Lane and G.A. Gander. 1995. Weather generator. Chapter 2 in (D.C. Flanagan and M.A. Nearing, eds.): USDA-Water Erosion Prediction Project (WEPP) Hillslope Profile and Watershed Model Documentation, NSERL Report No. 10, USDA-Agricultural Research Service, West Lafayette, Indiana.
Renschler, C.S., D.C. Flanagan, B.A. Engel and J.R. Frankenberger. 2002. GeoWEPP – the geospatial interface to the Water Erosion Prediction Project. ASAE Paper No. 02-2171. St. Joseph, MI: ASAE. 10 pp.
Renschler, C.S. 2003. Designing geo-spatial interfaces to scale process models: The GeoWEPP approach. Hydrological Processes 17:1005-1007.