2004 heller et al life cycle energy andenvironmental benefits of generating electricity from willow...
DESCRIPTION
Life cycle energy andenvironmental benefitsof generating electricity from willow biomassTRANSCRIPT
� Corresponding author. T
E-mail address: gregak@
0960-1481/$ - see front mat
doi:10.1016/j.renene.2003.1
el.: +1-734-764-3194; fax: +1-734-647-5841.
umich.edu (G.A. Keoleian).
ter # 2003 Elsevier Ltd. All rights reserved.
1.018
Renewable Energy 29 (2004) 1023–1042
www.elsevier.com/locate/renene
Life cycle energy and environmental benefitsof generating electricity from willow biomass
Martin C. Heller a, Gregory A. Keoleian a,�, Margaret K. Mannb,Timothy A. Volk c
a Center for Sustainable Systems, School of Natural Resources and Environment, University of Michigan,
430 East University Street, Ann Arbor, MI 48109-1115, USAb National Renewable Energy Laboratory, 1617 Cole Boulevard, Golden, CO 80401, USA
c SUNY College of Environmental Science and Forestry, 133 Illick Hall, Syracuse, NY 13210, USA
Received 1 November 2003; accepted 26 November 2003
Abstract
Biomass is a key renewable energy source expected to play an important role in US elec-tricity production under stricter emission regulations and renewable portfolio standards.Willow energy crops are being developed in the northeast US as a fuel source for increasingbiomass energy and bioproduct demands. A life cycle inventory is presented that char-acterizes the full cradle-to-grave energy and environmental performance of willow biomass-to-electricity. A willow biomass production model is developed using demonstration-scalefield experience from New York. Scenarios are presented that mimic anticipated cofiringoperations, including supplemental use of wood residues, at an existing coal-fired generatingfacility. At a cofiring rate of 10% biomass, the system net energy ratio (electricity delivereddivided by total fossil fuel consumed) increases by 8.9% and net global warming potentialdecreases by 7–10%. Net SO2 emissions are reduced by 9.5% and a significant reduction inNOx emissions is expected. In addition, we estimate system performance of using willow bio-mass in dedicated biomass gasification and direct-fired generating facilities and demonstratethat the pollution avoided (relative to the current electricity grid) is comparable to otherrenewables such as PV and wind.# 2003 Elsevier Ltd. All rights reserved.
Keywords: Energy crops; Cofiring with coal; Air emissions; Global warming
M.C. Heller et al. / Renewable Energy 29 (2004) 1023–10421024
1. Introduction
Electricity generation in the US contributes significantly to many currentenvironmental challenges including acid deposition, regional haze, ground-levelozone and smog formation, mercury pollution, and global warming. In response tothese challenges, numerous proposals for a coordinated emissions reduction policyhave been introduced in recent US Congressional sessions [1]. While differing inapproach and target emission limits, each of the bills introduced into the 106th and107th Congresses contains provisions to reduce power plant emissions of NOx,SO2, CO2, and Hg over the next decade. In addition, several bills in Congress callfor the establishment of a national renewable portfolio standard (RPS) in order tostimulate growth in non-hydroelectric renewable energy fields. Biomass, along withwind, is a key renewable resource expected to play an important role in future elec-tricity production under stricter emission regulations and RPS [2].To date, biomass has been a relatively small portion of the overall US energy
budget, supplying about 3% of the 104 EJ (98 quadrillion BTU) consumed in 2000[3]. The vast majority of this biomass is used for cogeneration of steam and elec-tricity within the pulp and paper industry. Business-as-usual projections showmodest increases in biomass use in the electricity generation sector, but underaggressive RPS scenarios and in scenarios that assume CO2 reductions based onthe Kyoto Protocol, electricity generation from biomass increases substantially[4,5]. Estimates of biomass resources show that there are 535 million wet tonnes ofbiomass available in the US on an annual basis, with 18 million wet tonnes (about3 GW of capacity) available today at prices of $1.25 per million BTU or less [6].Biomass resources included in this estimate are agricultural residues; forestry resi-dues; urban wood waste and mill residues; and dedicated energy crops such asswitch grass, hybrid poplar, and willow.A demonstration program under the auspices of the The Salix Consortium is
developing and facilitating the commercialization of willow biomass short rotationwoody crops in the Northeastern and Midwestern regions of the US. To date, over200 ha of willow have been established in western and central New York. In thenear-term, the harvested willow biomass will be used to supplement new cofiringoperations at an electricity generating facility in western NY. Longer term potentialuses for the biomass include the production of bioproducts that would otherwisebe made from petroleum and electricity generation using gasification and fuel cells.As policy-makers and regulators attempt to address multiple environmental
goals and electricity generators plan for compliance to yet uncertain standards,thorough assessments of technologies are necessary. Life cycle assessment (LCA)methodology offers such a comprehensive, system-based analysis of the energy andenvironmental performance of a product system [7]. In LCA, the material andenergy inputs and outputs are quantified throughout a product’s life, from rawmaterial acquisition through production, use and disposal. Potential environmentalimpacts of the product system are then assessed based on this life cycle inventory.This paper describes an LCA model of the agricultural production of willow bio-
mass feedstock and the cofiring of this biomass with coal to generate electricity.

1025M.C. Heller et al. / Renewable Energy 29 (2004) 1023–1042
Willow biomass production modeling is based on demonstration-scale field experi-
ence from NY and scenarios are presented that mimic anticipated cofiring oper-
ation at the Dunkirk, NY generating facility. Results focus on system energy
performance and criteria air emissions. In addition, we estimate system perform-
ance of using willow biomass in dedicated biomass gasification and direct-fired
generating facilities. The air pollution prevented from using willow biomass as a
substitute for coal and national-average grid electricity is examined. Finally, the
energy and environmental performance of the willow system is compared with pho-
tovoltaic and wind electricity generating systems.
2. Methods
LCA methodology follows the ISO 14040 guidelines [7]. The model was
developed using the software program, Tools for Environmental Analysis and
Management (TEAM 3.0), by Ecobalance, Inc. Modules for generalized practices
such as raw material extraction, large market chemical production, average grid
electricity generation, transportation fuel production, and transport emissions were
taken from Ecobalance’s Database for Environmental Analysis and Management
(DEAM 3.0). The net greenhouse effect was calculated using global warming
potentials from the Intergovernmental Panel on Climate Change (IPCC) (direct
effect, 100-year time horizon) [8].The goal of this study is to evaluate the energy and environmental performance
of the biomass-to-electricity system under development by the Salix Consortium.
Willow biomass crops are to be cofired in an existing pulverized coal boiler at the
Dunkirk facility in Dunkirk, NY. The willow biomass will be supplemented with
waste wood residues. The system boundaries for the cofiring LCA include all
operations required for production of willow biomass, coal mining and processing,
coal and biomass transportation, manufacturing of cofiring retrofit equipment, and
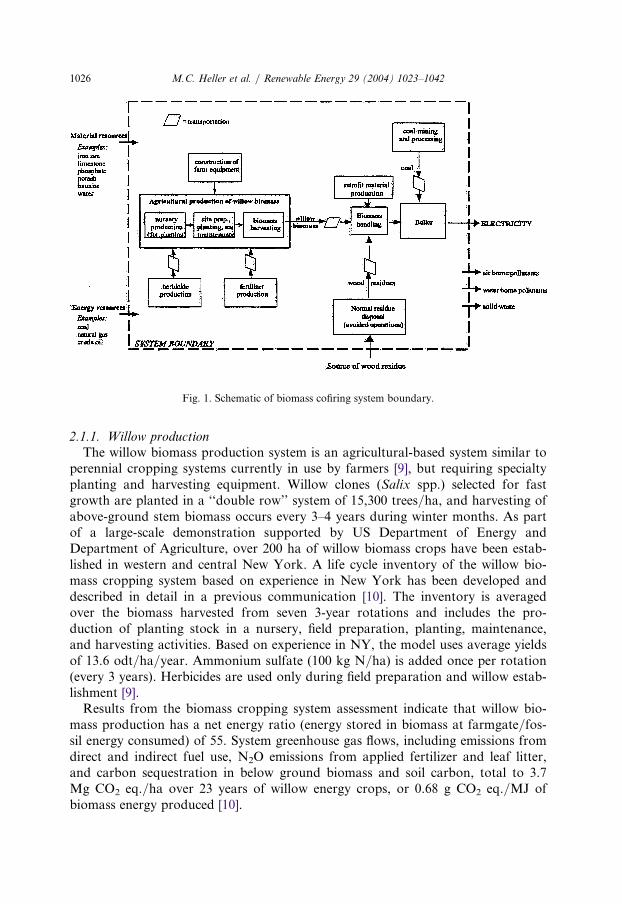
the avoided operations of wood residue landfill disposal (Fig. 1). The functional
unit is 1 MWh of generated electricity delivered to the grid.
2.1. Biomass feedstock
Two cofiring scenarios, both at a 10% (by energy) cofiring ratio but involving
different biomass mixes, are considered. In the first, which is based on likely oper-
ating conditions at Dunkirk, 5% (by weight) of the annual biomass supply to the
power plant is willow and the remainder is wood residues (residue/willow blend).
In the second scenario, all of the biomass necessary for a 10% cofire is willow (all-
willow). Providing a continual supply of willow biomass may require alternative
harvesting and storage techniques from those modeled here. Thus, the second scen-
ario is an approximation of an all-willow cofiring system. The following sections
contain modeling and allocation details for biomass feedstock production.
M.C. Heller et al. / Renewable Energy 29 (2004) 1023–10421026
2.1.1. Willow productionThe willow biomass production system is an agricultural-based system similar to
perennial cropping systems currently in use by farmers [9], but requiring specialtyplanting and harvesting equipment. Willow clones (Salix spp.) selected for fastgrowth are planted in a ‘‘double row’’ system of 15,300 trees/ha, and harvesting ofabove-ground stem biomass occurs every 3–4 years during winter months. As partof a large-scale demonstration supported by US Department of Energy andDepartment of Agriculture, over 200 ha of willow biomass crops have been estab-lished in western and central New York. A life cycle inventory of the willow bio-mass cropping system based on experience in New York has been developed anddescribed in detail in a previous communication [10]. The inventory is averagedover the biomass harvested from seven 3-year rotations and includes the pro-duction of planting stock in a nursery, field preparation, planting, maintenance,and harvesting activities. Based on experience in NY, the model uses average yieldsof 13.6 odt/ha/year. Ammonium sulfate (100 kg N/ha) is added once per rotation(every 3 years). Herbicides are used only during field preparation and willow estab-lishment [9].Results from the biomass cropping system assessment indicate that willow bio-
mass production has a net energy ratio (energy stored in biomass at farmgate/fos-sil energy consumed) of 55. System greenhouse gas flows, including emissions fromdirect and indirect fuel use, N2O emissions from applied fertilizer and leaf litter,and carbon sequestration in below ground biomass and soil carbon, total to 3.7Mg CO2 eq./ha over 23 years of willow energy crops, or 0.68 g CO2 eq./MJ ofbiomass energy produced [10].
Fig. 1. Schematic of biomass cofiring system boundary.
1027M.C. Heller et al. / Renewable Energy 29 (2004) 1023–1042
2.1.2. Wood residuesCofiring operations at Dunkirk will use a mixture of willow biomass and wood
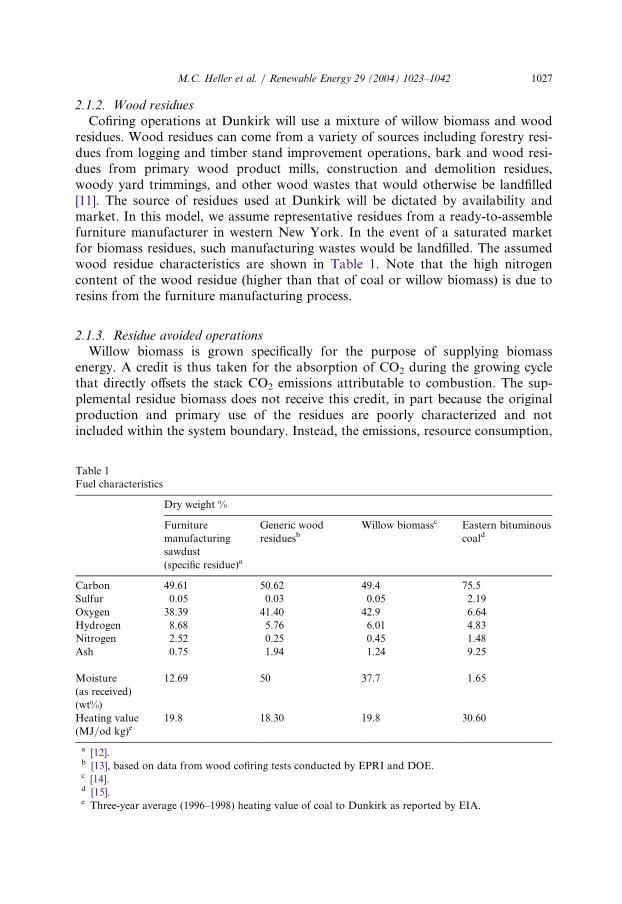
residues. Wood residues can come from a variety of sources including forestry resi-dues from logging and timber stand improvement operations, bark and wood resi-dues from primary wood product mills, construction and demolition residues,woody yard trimmings, and other wood wastes that would otherwise be landfilled[11]. The source of residues used at Dunkirk will be dictated by availability andmarket. In this model, we assume representative residues from a ready-to-assemblefurniture manufacturer in western New York. In the event of a saturated marketfor biomass residues, such manufacturing wastes would be landfilled. The assumedwood residue characteristics are shown in Table 1. Note that the high nitrogencontent of the wood residue (higher than that of coal or willow biomass) is due toresins from the furniture manufacturing process.
2.1.3. Residue avoided operationsWillow biomass is grown specifically for the purpose of supplying biomass
energy. A credit is thus taken for the absorption of CO2 during the growing cyclethat directly offsets the stack CO2 emissions attributable to combustion. The sup-plemental residue biomass does not receive this credit, in part because the originalproduction and primary use of the residues are poorly characterized and notincluded within the system boundary. Instead, the emissions, resource consumption,
Table 1
Fuel characteristics
Dry weight %
Furniture
manufacturing
sawdust
(specific residue)a
Generic wood
residuesbW
illow biomassc Eastern bituminouscoald
Carbon
49.61 50.62 4 9.4 75.5Sulfur
0.05 0.03 0.05 2.19Oxygen
38.39 41.40 4 2.9 6.64Hydrogen
8.68 5.76 6.01 4.83Nitrogen
2.52 0.25 0.45 1.48Ash
0.75 1.94 1.24 9.25Moisture
(as received)
(wt%)
12.69
50 3 7.7 1.65Heating value
(MJ/od kg)e
19.8 18.30 1 9.8 30.60a [12].b [13], based on data from wood cofiring tests conducted by EPRI and DOE.c [14].d [15].e Three-year average (1996–1998) heating value of coal to Dunkirk as reported by EIA.
M.C. Heller et al. / Renewable Energy 29 (2004) 1023–10421028
and energy use (or generation) that would have occurred during the alternative dis-posal of the biomass are credited to the life cycle inventory as avoided operations[13]. In this study, it was assumed that the alternative route of disposal would belandfill.Landfill decomposition of woody residues follows the model proposed by Mann
and Spath [13], with 34.8% of the carbon in the landfilled biomass decomposing toa gas approximated as a mixture of 50% CO2 and 50% methane. It was assumedthat 10% of the landfill methane is either chemically oxidized or converted by bac-teria to CO2, thus reducing methane atmospheric emissions [13,16]. Many landfillfacilities operate gas recovery systems and recovered gas is either flared or utilizedto generate electricity. The furniture manufacturer that is the source of residuesassumed in this model operates plants serviced by the Chautauqua County Landfill(Jamestown, NY) and the Lakeview Landfill (Erie, PA). Based on facility pro-duction, we assume 25% of the generated residue would be disposed at the Lake-view site and the remainder at Chautauqua County. Chautauqua has a landfill gasrecovery system which according to US Environmental Protection Agency (EPA)models recovers 50% of generated landfill gas, all of which is currently flared.Lakeview landfill claims that their gas recovery is 85% efficient and utilizes 82% ofthat gas to generate electricity (6 MW capacity) with the remainder being flared.Combining practices at the two landfills, it is assumed that 17.4% of the generatedgas is captured and used to generate electricity, 41.3% is captured and flared (i.e.converted to CO2 with no power generation), and 41.3% is emitted directly to theatmosphere. Thus, avoided wood residue landfill avoids some electricity gener-ation. This avoided electricity generation, along with associated energy require-ments and emissions, is substituted in the life cycle inventory with grid electricityrepresentative of the Northeast Power Coordinating Council (NPCC).For comparison, a ‘‘generic’’ wood residue scenario is also considered. The fuel
characteristics for this scenario are also included in Table 1. Landfill operationsassume the same 34.8% carbon decomposition and 10% methane oxidation, but gasrecovery is based on national averages. According to the most recent estimates fromthe EPA, 49% of all methane from landfills is generated at sites with landfill gasrecovery, and these sites average 75% recovery efficiency [17]. Using these nationalaverages, we assume 36.75% of the methane is combusted and thus converted toCO2, and 49% of the collected landfill methane is utilized to generate electricity [17].
2.2. Biomass transport
The distance from existing willow plantations and the Dunkirk Power Plant isapproximately 40.2 km (25 miles). This transportation distance is used for the resi-due/willow blend scenario. The wood residue transportation distance used is thedistance between Dunkirk and Jamestown and Dunkirk and Erie, PA, weighted bythe amount of residue produced in each facility. The resulting transport distance is76.5 km.For generic residue transport and hypothetical scenarios with expanded willow
plantations (all-willow scenarios), it is assumed that the biomass origin would be
1029M.C. Heller et al. / Renewable Energy 29 (2004) 1023–1042
within an 80 km (50 miles) radius of the power plant. Average transportation dis-tance can then be calculated by
d ¼ 2
3R0s ð1Þ
where R0 is the containing radius and s the tortuosity factor (ratio of actual traveldistance to line of sight).For a regular rectangular road grid, s ¼ 1:27; for a broken landscape (hilly,
lakes, swamps), s ¼ 3 [18]. For this model, s ¼ 1:8, giving an average transpor-tation distance of 96 km (60 miles).Biomass transportation is by 40 short ton diesel truck, and the empty return is
included. Fuel consumption at maximum load is 39 l per 100 km. Emissions asso-ciated with truck transportation are from the DEAM database. Material require-ments for manufacturing of the truck are as follows: 900 kg aluminum, 272 kgiron, 13,790 kg steel, 370 kg tire. For truck decommissioning, it was assumed that50% of the tractor (remainder is salvaged for parts) and the entire trailer is shred-ded for scrap. The shredding process is modeled as in a previous study [19]. Manu-facturing and decommissioning burdens are allocated on a per km of transportbasis by assuming a useful truck life of 15 years, with an average annual mileage of48,280 km (30,000 miles). A 2% haul loss was assumed for biomass transport.
2.3. Energy conversion—cofiring
The energy conversion portion of the life cycle inventory makes use of the modeldeveloped by Mann and Spath and described in detail in [13,20], with modifica-tions noted here.The cofiring model is based on anticipated operations at Dunkirk Power Plant
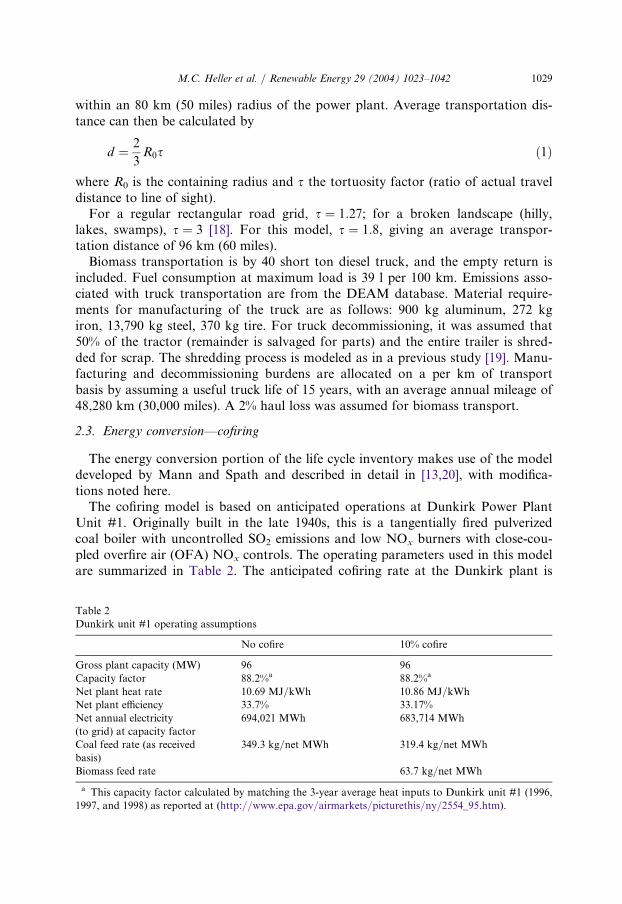
Unit #1. Originally built in the late 1940s, this is a tangentially fired pulverizedcoal boiler with uncontrolled SO2 emissions and low NOx burners with close-cou-pled overfire air (OFA) NOx controls. The operating parameters used in this modelare summarized in Table 2. The anticipated cofiring rate at the Dunkirk plant is
Table 2
Dunkirk unit #1 operating assumptions
No cofire
10% cofireGross plant capacity (MW)
96 96Capacity factor
88.2%a 88.2%aNet plant heat rate
10.69 MJ/kWh 10.86 MJ/kWhNet plant efficiency
33.7% 33.17%Net annual electricity
(to grid) at capacity factor
694,021 MWh
683,714 MWhCoal feed rate (as received
basis)
349.3 kg/net MWh
319.4 kg/net MWhBiomass feed rate
63.7 kg/net MWha This capacity factor calculated by matching the 3-year average heat inputs to Dunkirk unit #1 (1996,
1997, and 1998) as reported at (http://www.epa.gov/airmarkets/picturethis/ny/2554_95.htm).
M.C. Heller et al. / Renewable Energy 29 (2004) 1023–10421030
10–15%. Data from cofiring tests at the Dunkirk plant are not yet available. Thus,parameters for cofiring operation are estimates based largely on experience at othercofiring power plants [21]. The addition of biomass handling equipment is expectedto result in a slight increase in plant parasitic load, although the increase in loadfrom biomass handling will be largely offset by reduced coal pulverizer activity [22].There is also an expected slight decrease in boiler efficiency due to the highermoisture content of biomass compared with coal.
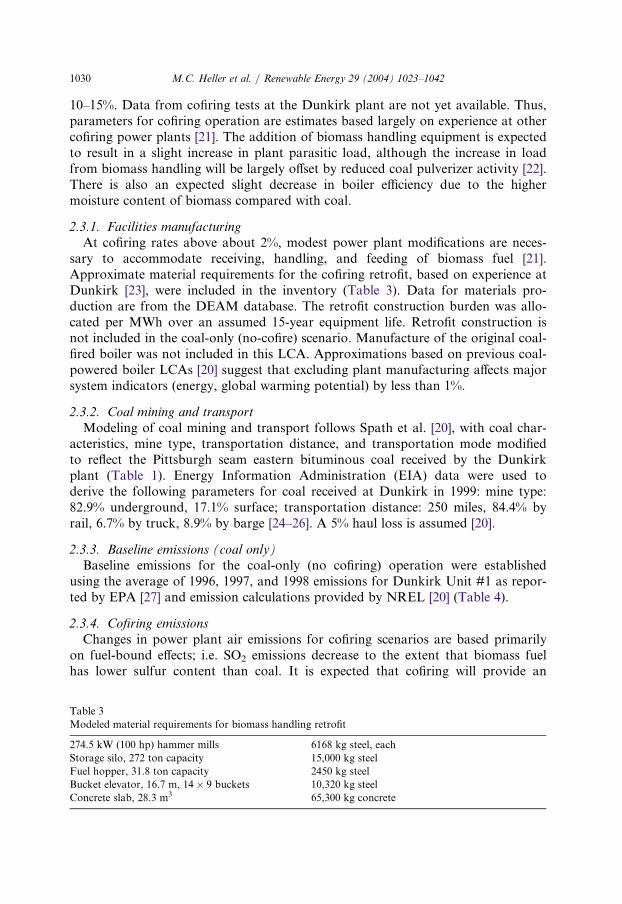
2.3.1. Facilities manufacturingAt cofiring rates above about 2%, modest power plant modifications are neces-
sary to accommodate receiving, handling, and feeding of biomass fuel [21].Approximate material requirements for the cofiring retrofit, based on experience atDunkirk [23], were included in the inventory (Table 3). Data for materials pro-duction are from the DEAM database. The retrofit construction burden was allo-cated per MWh over an assumed 15-year equipment life. Retrofit construction isnot included in the coal-only (no-cofire) scenario. Manufacture of the original coal-fired boiler was not included in this LCA. Approximations based on previous coal-powered boiler LCAs [20] suggest that excluding plant manufacturing affects majorsystem indicators (energy, global warming potential) by less than 1%.
2.3.2. Coal mining and transportModeling of coal mining and transport follows Spath et al. [20], with coal char-
acteristics, mine type, transportation distance, and transportation mode modifiedto reflect the Pittsburgh seam eastern bituminous coal received by the Dunkirkplant (Table 1). Energy Information Administration (EIA) data were used toderive the following parameters for coal received at Dunkirk in 1999: mine type:82.9% underground, 17.1% surface; transportation distance: 250 miles, 84.4% byrail, 6.7% by truck, 8.9% by barge [24–26]. A 5% haul loss is assumed [20].
2.3.3. Baseline emissions (coal only)Baseline emissions for the coal-only (no cofiring) operation were established
using the average of 1996, 1997, and 1998 emissions for Dunkirk Unit #1 as repor-ted by EPA [27] and emission calculations provided by NREL [20] (Table 4).
2.3.4. Cofiring emissionsChanges in power plant air emissions for cofiring scenarios are based primarily
on fuel-bound effects; i.e. SO2 emissions decrease to the extent that biomass fuelhas lower sulfur content than coal. It is expected that cofiring will provide an
Table 3
Modeled material requirements for biomass handling retrofit
274.5 kW (100 hp) hammer mills 6
168 kg steel, eachStorage silo, 272 ton capacity 1
5,000 kg steelFuel hopper, 31.8 ton capacity 2
450 kg steelBucket elevator, 16.7 m, 14� 9 buckets 1
0,320 kg steelConcrete slab, 28.3 m3 6
5,300 kg concrete
1031M.C. Heller et al. / Renewable Energy 29 (2004) 1023–1042
additional reduction in NOx emissions due to the higher volatility and moisture
content of biomass. Correlations presented by Tillman predict a 16.1% and 26.4%
reduction in NOx emissions at 10% and 15% cofire (energy basis), respectively [28].
These effects depend largely on boiler configuration and operation, however. Since
emissions data are not currently available for cofiring in the Dunkirk boiler, we
present NOx emissions cases based on ‘‘fuel-bound effects’’ and compare them with
results based on Tillman’s correlation.
2.4. Estimates of dedicated biomass electricity generation and comparison with otherrenewables
In order to consider the performance of a dedicated willow biomass electricity
generating system, the willow biomass production and transportation models were
linked to sets of power plant emission factors for biomass gasification and direct-
fired operations. Specified conversion efficiencies were used to establish feedstock
(i.e. willow biomass) production and transportation flows that were then combined
with power plant emissions (Table 5) to provide rough estimates of system per-
formance. Note that these estimates do not include power plant construction and
decommissioning or additional operational demands of the power plant.
Table 5
Dedicated biomass power plant emission data
NREL gasificationa
EPRI gasificationb E PRI direct-firedbConversion efficiency
37.2% 36% 2 7.7%Emission factors (g/MWhelec)
CO
0.86 206 2 019NMHC
515.5 96 2 69.2NOx
479 645 6 7.3Particulates
(unspecified)
3.7
na n aSO2
254 818 n aa [29].b [21].
Table 4
Dunkirk Unit #1 baseline air emissions (no cofiring)
Compound E
mission (kg/MWh net electricity)CO2 9
32.1NOx (as NO2)
1.583SO2
15.022CO
0.105VOC
0.012Particulates
0.135Ash (dry)
31.62
M.C. Heller et al. / Renewable Energy 29 (2004) 1023–10421032
Results from willow gasification and direct-fired scenarios are presented in termsof the pollution prevention achieved relative to US ‘‘composite kWh’’ average gridelectricity generation. Data for this average grid generation are from the DEAMdatabase and includes production, combustion, and waste management of the fivemain fuels in the following proportions (1996 values): coal (56.6%), nuclear (22%),hydroelectricity (10.6%), natural gas (8.6%), heavy fuel oil (2.2%).For comparison, avoided pollution realized across the life cycle of two other
important renewable energy sources, building-integrated photovoltaic (BIPV) andwind-powered electricity generation, are presented. The BIPV system is anamphorous silicon PV with a 6% conversion efficiency affixed to a standing seamroof located in New York, NY. A description of the life cycle inventory analysis ispresented in Keoleian and Lewis [30]. The wind-powered generation system pre-sented is a 9 MW (18�500 kW units) land-based Danish wind farm analyzed bySchleisner [31]. Avoided pollution is again presented relative to average US gridelectricity generation.
3. Results
3.1. Biomass cofiring
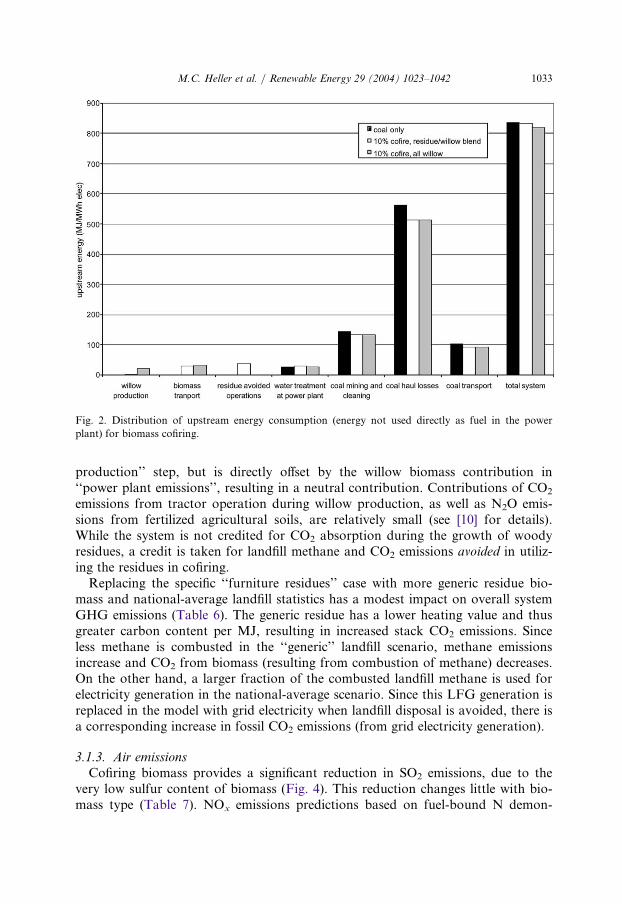
3.1.1. Energy analysisGenerating electricity with coal alone consumes 11,496 MJ/MWhelec across the
full life cycle, 93% of which is coal used directly at the plant. Due to the largequantity of coal processed, upstream energy consumption (i.e. energy not useddirectly as fuel at the plant) is dominated by coal mining, transportation, and losses(Fig. 2). Substituting biomass for coal decreases this energy consumption some-what, but also introduces additional upstream energy consumption in producing thebiomass. As a result, total upstream energy consumption remains nearly unchangedwith cofiring. Note that if coal haul losses are not included, upstream energy con-sumption for the no-cofire case decreases to 273 MJ/MWhelec, while the residue/willow blend and all-willow cofire are 320 and 304 MJ/MWhelec, respectively.Net energy ratio, defined as the electricity produced by the system divided by the
total fossil fuel energy consumed, is a useful indicator of system performance. Thenet energy ratio for the no-cofire case is 0.313. This increases to 0.341 with 10%cofiring, with very little difference in net energy ratio between the two cofiringscenarios.
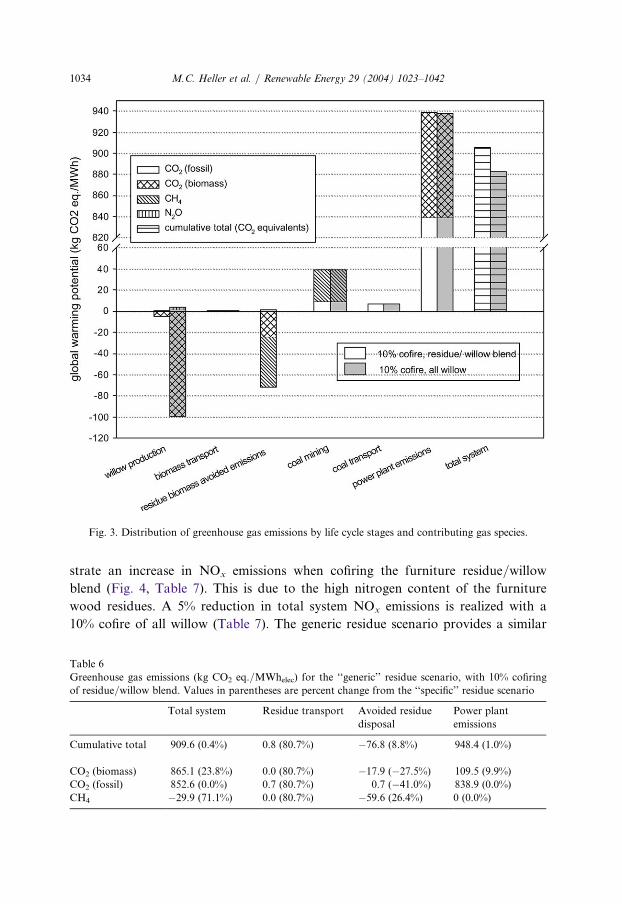
3.1.2. Global warming potentialIn our model, generating electricity from coal alone releases 978 kg CO2 eq./
MWh, 95% of which is released in the form of CO2 at the power plant. Mining andtransportation of the coal compose the balance, contributing 42.8 and 7.6 kg CO2
eq./MWh, respectively. Fig. 3 demonstrates how the greenhouse gas emissions aredistributed in the cofiring scenarios. GHG emissions from coal mining, transport,and combustion are reduced by replacing coal with biomass during cofiring. CO2
absorbed in the growing of willow biomass is credited to the system in the ‘‘willow
1033M.C. Heller et al. / Renewable Energy 29 (2004) 1023–1042
production’’ step, but is directly offset by the willow biomass contribution in‘‘power plant emissions’’, resulting in a neutral contribution. Contributions of CO2
emissions from tractor operation during willow production, as well as N2O emis-sions from fertilized agricultural soils, are relatively small (see [10] for details).While the system is not credited for CO2 absorption during the growth of woodyresidues, a credit is taken for landfill methane and CO2 emissions avoided in utiliz-ing the residues in cofiring.Replacing the specific ‘‘furniture residues’’ case with more generic residue bio-
mass and national-average landfill statistics has a modest impact on overall systemGHG emissions (Table 6). The generic residue has a lower heating value and thusgreater carbon content per MJ, resulting in increased stack CO2 emissions. Sinceless methane is combusted in the ‘‘generic’’ landfill scenario, methane emissionsincrease and CO2 from biomass (resulting from combustion of methane) decreases.On the other hand, a larger fraction of the combusted landfill methane is used forelectricity generation in the national-average scenario. Since this LFG generation isreplaced in the model with grid electricity when landfill disposal is avoided, there isa corresponding increase in fossil CO2 emissions (from grid electricity generation).
3.1.3. Air emissionsCofiring biomass provides a significant reduction in SO2 emissions, due to the
very low sulfur content of biomass (Fig. 4). This reduction changes little with bio-mass type (Table 7). NOx emissions predictions based on fuel-bound N demon-
Fig. 2. Distribution of upstream energy consumption (energy not used directly as fuel in the power
plant) for biomass cofiring.
M.C. Heller et al. / Renewable Energy 29 (2004) 1023–10421034
strate an increase in NOx emissions when cofiring the furniture residue/willow
blend (Fig. 4, Table 7). This is due to the high nitrogen content of the furniture
wood residues. A 5% reduction in total system NOx emissions is realized with a
10% cofire of all willow (Table 7). The generic residue scenario provides a similar
Fig. 3. Distribution of greenhouse gas emissions by life cycle stages and contributing gas species.
Table 6
Greenhouse gas emissions (kg CO2 eq./MWhelec) for the ‘‘generic’’ residue scenario, with 10% cofiring
of residue/willow blend. Values in parentheses are percent change from the ‘‘specific’’ residue scenario
Total system
Residue transport Avoided residuedisposal
P
e
ower plant
missions
Cumulative total
909.6 (0.4%) 0.8 (80.7%) �76.8 (8.8%) 948.4 (1.0%)CO2 (biomass)
865.1 (23.8%) 0.0 (80.7%) �17.9 (�27.5%) 109.5 (9.9%)CO2 (fossil)
852.6 (0.0%) 0.7 (80.7%) 0.7 (�41.0%) 838.9 (0.0%)CH4
�29.9 (71.1%) 0.0 (80.7%) �59.6 (26.4%) 0 (0.0%)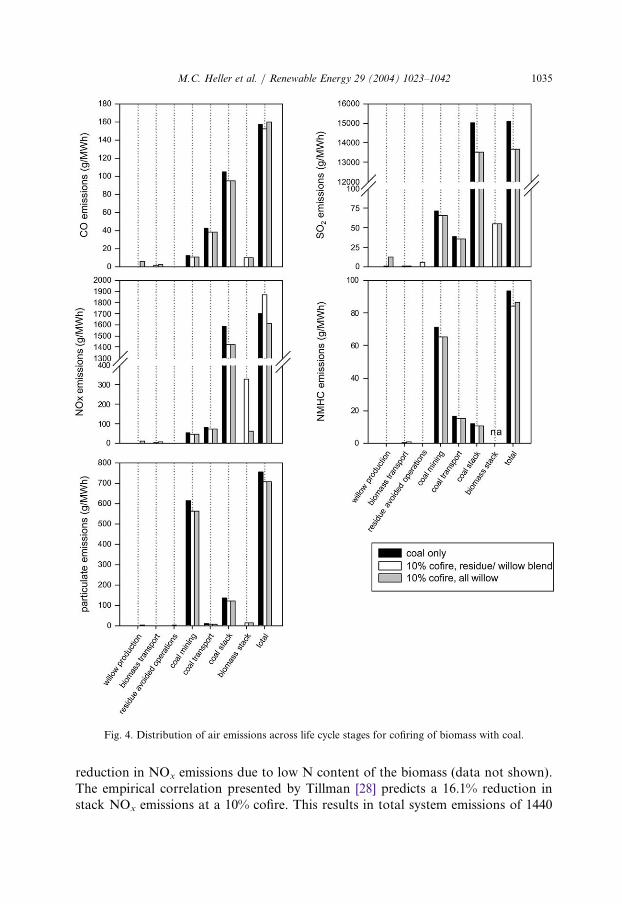
1035M.C. Heller et al. / Renewable Energy 29 (2004) 1023–1042
reduction in NOx emissions due to low N content of the biomass (data not shown).The empirical correlation presented by Tillman [28] predicts a 16.1% reduction instack NOx emissions at a 10% cofire. This results in total system emissions of 1440
Fig. 4. Distribution of air emissions across life cycle stages for cofiring of biomass with coal.
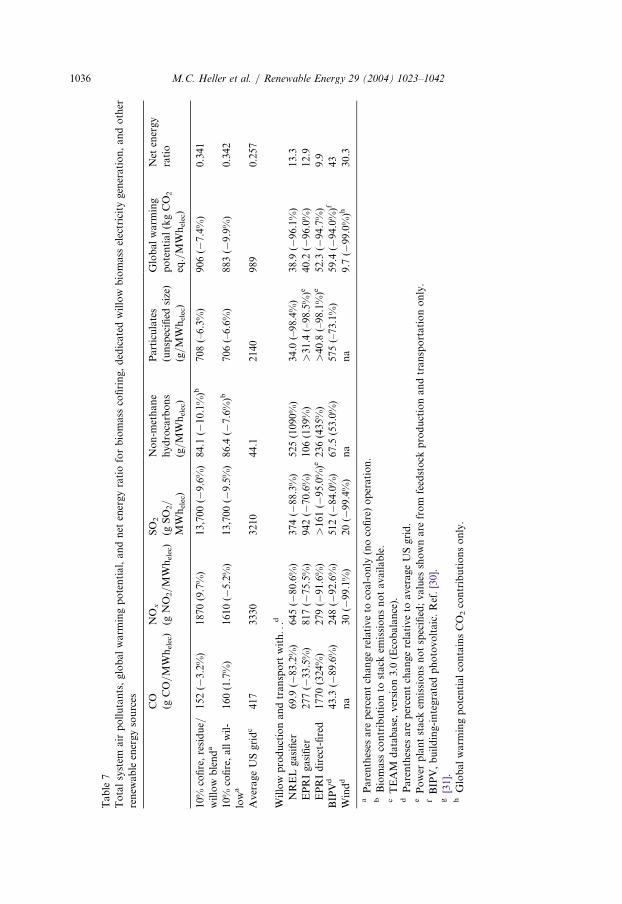
Table7
Totalsystem
airpollutants,globalwarm
ingpotential,andnetenergyratioforbiomasscofiring,dedicatedwillowbiomasselectricitygeneration,andother
renew
ableenergysources
CO
(gCO/MWhelec)
NO
x
(gNO2/MWhelec)
SO2
(gSO2/
MWhelec)
Non-m
ethane
hydrocarbons
(g/MWhelec)
Particulates
(unspecified
size)
(g/MWhelec)
Globalwarm
ing
potential(kgCO2
eq./MWhelec)
Netenergy
ratio
10%
cofire,residue/
willowblenda
152(�3.2%)
1870(9.7%)
13,700(�9.6%)
84.1(�10.1%)b
708(–6.3%)
906(�7.4%)
0.341
10%
cofire,allwil-
lowa
160(1.7%)
1610(�5.2%)
13,700(�9.5%)
86.4(�7.6%)b
706(–6.6%)
883(�9.9%)
0.342
AverageUSgridc
417
3330
3210
44.1
2140
989
0.257
Willowproductionandtransportwith...d
NRELgasifier
69.9(�83.2%)
645(�80.6%)
374(�88.3%)
525(1090%
)34.0(–98.4%)
38.9(�96.1%)
13.3
EPRIgasifier
277(�33.5%)
817(�75.5%)
942(�70.6%)
106(139%)
>31.4(–98.5%)e
40.2(�96.0%)
12.9
EPRIdirect-fired
1770(324%)
279(�91.6%)
>161(�95.0%)e
236(435%)
>40.8(–98.1%)e
52.3(�94.7%)
9.9
BIPVd
43.3(�89.6%)
248(�92.6%)
512(�84.0%)
67.5(53.0%)
575(–73.1%)
59.4(�94.0%)f
43
Windd
na
30(�99.1%)
20(�99.4%)
na
na
9.7(�99.0%)h
30.3
aParentheses
are
percentchangerelativeto
coal-only(nocofire)operation.
bBiomasscontributionto
stack
emissionsnotavailable.
cTEAM
database,version3.0(Ecobalance).
dParentheses
are
percentchangerelativeto
averageUSgrid.
ePower
plantstack
emissionsnotspecified;values
shownare
from
feedstock
productionandtransportationonly.
fBIPV,building-integratedphotovoltaic.Ref.[30].
g[31].
hGlobalwarm
ingpotentialcontainsCO2contributionsonly.
M.C. Heller et al. / Renewable Energy 29 (2004) 1023–10421036
1037M.C. Heller et al. / Renewable Energy 29 (2004) 1023–1042
and 1456 g NOx/MWh for the residue/willow blend and the all-willow scenario,respectively (15% and 14% system reduction relative to no cofire, respectively).The model also predicts a roughly 6% reduction in particulate emissions with
10% cofiring, all of which is realized through reduced coal mining operation (Fig. 4,Table 7). However, the model assumes that there is no change in power plant par-ticulate emissions with cofiring of biomass.Cofiring biomass also provides significant reductions in mercury emissions.
Metal analysis of willow biomass indicates an average mercury content of 0.005mg/od kg [14] (Hg content not available for residue biomass). Assuming that allthe biomass-derived Hg volatilizes during combustion, a 10% cofire of all willowwould reduce the system air emissions of Hg by 8.4%. Contributions of mercuryfrom willow production are negligible. Note that there is a potential for biomass tocontain other heavy metals of concern. Metal content in the biomass is a functionof metal concentrations in the soil where the crop is grown and tree uptakeefficiency [32,33].
3.2. Dedicated willow biomass electricity generation in comparison with otherrenewables
Table 7 also contains the estimated emissions for dedicated willow biomass toelectricity system, using both direct-fired and gasification conversion technologies.In these scenarios, it is assumed that willow biomass supplies all of the feedstockenergy to the power plant. Emissions from the production and transportation ofwillow are combined with power plant emission factors contained in Table 5. Sig-nificant pollution prevention (relative to the current US electricity grid) is realizedwith biomass-generated electricity. The high net energy ratios demonstrate the fos-sil energy leveraging of a renewable energy source. For example, 13 units of elec-tricity are generated for every one unit of fossil energy consumed across the full lifecycle of willow gasification.Comparisons with example LCAs of other renewable energy technologies reveal
that biomass affords relatively similar levels of avoided pollution (Table 7). Bio-mass outperforms BIPV from an energy perspective (as well as the closely corre-lated global warming potential) but does not score as well as wind generation. Itshould be noted, however, that these studies do not take into account the powerfluctuation of the different generating systems. Both wind and solar are intermittentsources, while biomass permits continual base load generation.
4. Discussion
Cofiring biomass with coal provides numerous environmental benefits. While theupstream energy consumed in growing or processing and transporting biomassroughly balances the reduced consumption from mining, processing, and transport-ing less coal (Fig. 2), the system realizes an overall benefit through reduced fossilfuel consumption at the power plant (reduced coal use), which is reflected inincreased net energy ratios. Cofiring also imparts reductions in system greenhouse
M.C. Heller et al. / Renewable Energy 29 (2004) 1023–10421038
effect that scale with the cofiring rate, although our model demonstrates that theextent of these reductions can be dependent on the source and type of biomass aswell as the modeling procedure adopted.Willow biomass is grown specifically for electricity generation and thus willow
production is considered to be within the power generation system boundary. As aresult, electricity generation with willow biomass is nearly GHG neutral (40–50 kgCO2 eq./MWhelec). However, the original growth of residue biomass is not con-sidered within the power generation system boundary and a CO2 absorption creditis not taken for the growth of this biomass. Utilizing biomass residues for elec-tricity generation avoids other means of disposal (in this case, landfill) and in turnavoids the GHG emissions that would have occurred as a result of that disposal.While not all of the carbon in the residue biomass decomposes to gaseous productsin our landfill model, methane generation through anaerobic decomposition con-tributes strongly to the net greenhouse effect due to methane’s relatively highequivalent global warming potential (GWPCH4
¼ 23 kg CO2 eq./kg CH4 [8]).Decomposition of 100 kg of residue biomass in the ‘‘specific residue’’ landfill scen-ario releases 127.2 kg total CO2 eq., whereas complete aerobic decomposition (orcomplete combustion) releases 181.9 kg CO2. Thus, in this situation, landfilled bio-mass has a lower global warming potential than combustion, but there is a signifi-cant loss of potential for power generation. Under the ‘‘specific’’ landfill scenario,100 kg of biomass generates 0.03 kWh electricity through landfill gas capture butthe same 100 kg of biomass represents 132 kWh of generation potential in a cofir-ing operation. Comparison of the different residue scenarios indicates that smallchanges in biomass characteristics, transportation distances, and disposal manage-ment can influence the resulting greenhouse gas benefit. Under the ‘‘generic’’ land-fill scenario, 100 kg of biomass leads to 166.2 kg total CO2 eq. A previous reportthat considered a combination of residue disposal through landfill and utilizationas mulch found that disposal of 100 kg of biomass releases 248.2 kg total CO2 eq.[13]. Clearly, such allocation procedures must be standardized if they are to beused in CO2 emission regulation and/or trading.Cofiring biomass reduces emissions of SO2, Hg, and (in most cases) NOx. The
extent to which biomass cofiring will reduce NOx remains case-specific, as it isdependent on not only biomass composition but also boiler configuration andoperating conditions. Dedicated biomass generation, which in new power plantswill most likely use gasification technology, also provides significant reductions inSO2, NOx, and Hg emissions relative to the current coal-dominated electricity mix.Recent forecasts by the Energy Information Administration at the US Depart-
ment of Energy predict little to no addition of biomass-powered electricity gener-ation, or indeed any renewable energy sources, when tightened three-pollutant(NOx, SO2, Hg) regulations are adopted [4]. Power generators are expected toinstead choose the less expensive option of installing emission control equipmentwhile maintaining coal as the primary fuel source. However, cases that considerstringent CO2 reductions or aggressive RPS predict significant increases in the useof biomass, both in cofiring operations and dedicated biomass power plants. Whena CO2 cap at 7% below the 1990 level is assumed, biomass cofiring is predicted to
1039M.C. Heller et al. / Renewable Energy 29 (2004) 1023–1042
increase to 50 billion kWh by 2020, more than 700% above the Annual EnergyOutlook reference case. Adopting the goal of 20% RPS by 2020 is forecasted toincrease total biomass-fueled generation to 526 billion kWh by 2020, with 85% ofthis from dedicated power plants. Under this 20% RPS scenario, biomass com-poses 10% of the total electricity generation [4].Establishing energy crops, of course, requires arable land, and there is concern
over the availability of this limited resource. According to our model, supplyingenough willow to support a 10% cofire of all willow at the Dunkirk facility wouldrequire an estimated 2925 ha of plantation. This is 2.5% of the open land with suit-able soils and slopes for willow biomass production within an 83 km radius aroundthe Dunkirk plant (note that Dunkirk is on the shore of Lake Erie, so much of thearea around the plant is unavailable) [34]. Operating a 100 MW gasifier at 37%efficiency and 80% capacity would require 26,865 ha of willow plantation, or only1.3% of the total area within an 80 km radius. In an expanded biomass energymarket, however, willow energy crops will be one of many biomass sources includ-ing urban, agricultural, and forestry residues and other energy crops such asswitchgrass. A recent EIA report estimates that 3.9–5.8 million ha of energy cropswill be needed to meet the 20% RPS by 2020 projection [6]. The report also pointsout that it is possible to grow biomass energy crops on Conservation Reserve Pro-gram (CRP) land, and that this projected energy crop acreage represents 24–37%of the current allowable CRP land. In addition, acreage devoted to farms and ran-ches has been declining steadily since the 1950s [35]. Thus, land use for biomassenergy crops is not expected to conflict with land requirements for food and feedcrop production.
5. Conclusions
Life cycle analysis demonstrates that electricity generation with willow energycrops, either by cofiring with coal or in dedicated biomass power plants, leads tosignificant reductions in many of the environmental impacts of coal-based elec-tricity production. Consumption of non-renewable resources (coal) is reduced, asare net greenhouse gas emissions and criteria air pollutants including SO2, Hg, andlikely, NOx. Cofiring biomass at 10% increases the net energy ratio of producingelectricity by 8.9%. Similarly, the net energy ratio for dedicated biomass gasifi-cation is estimated to be 13, indicating that 13 units of electricity are produced forevery unit of fossil energy consumed across the entire system life cycle. For com-parison, the net energy ratio of the current US electricity grid is 0.26.This study suggests that the environmental impacts from producing electricity
with willow biomass energy crops are similar to using woody residues and that thepollution prevented is comparable to other renewable energy sources (solar andwind). Additional data and experience are needed to determine whether the smalldifferences reported here are indeed significant. It should be noted that choice ofmodeling parameters and allocation procedures can have significant effects onresults. Life cycle assessment based on ISO 14040 guidelines offers a valid means of
M.C. Heller et al. / Renewable Energy 29 (2004) 1023–10421040
quantifying potentially regulated and/or tradable emissions such as SO2, NOx, andgreenhouse gases, but additional standardization will be needed to assure consist-ency. The current study presents results useful for evaluating biomass electricitygeneration as an emerging technology as well as forwarding the discussion ofmethod standardization.In addition to the environmental benefits quantified in this LCA, willow biomass
crops will provide other benefits as they are deployed across the landscape. Theseinclude rural development through the creation of new markets and jobs, enhancedlandscape diversity and wildlife habitat, and reduced erosion potential. Such bene-fits, while important features of willow biomass crops, are not readily captured bylife cycle methodology.Market-based forecasts show that the multiple benefits of renewable energy fuel
sources such as willow biomass will not be realized without proper regulatory orlegislative incentive. While other less costly options exist to reduce air pollutantsfrom existing fossil fuel power plants, biomass energy presents an opportunity toreduce air pollutants while also cutting greenhouse gas emissions and loweringnon-renewable energy consumption.
Acknowledgements
This research is funded by a postdoctoral fellowship grant from the NationalResearch Initiative Competitive Grants Program of the United States Departmentof Agriculture (USDA Award no. 00-35314-09998).
References
[1] Energy Information Administration. Analysis of strategies for reducing multiple emissions from
electric power plants with advanced technology scenarios. Washington, DC: US Department of
Energy; 2001. Report No.: SR/OIAF/2001-05.
[2] Energy Information Administration. Impacts of a 10-percent renewable portfolio standard.
Washington DC: US Department of Energy; 2002. Report No.: SR/OIAF/2002-03. Available
from: http://www.eia.doe.gov/oiaf/servicerpt/rps/pdf/sroiaf(2002)03.pdf.
[3] Energy Information Administration, US Department of Energy. Annual Energy Review 2000.
Washington, DC; 2001. Report No.: DOE/EIA-0384(2000). Available from: http://tonto.eia.doe.-
gov/FTPROOT/multifuel/038400.pdf.
[4] Energy Information Administration. Analysis of strategies for reducing multiple emissions from
electric power plants: sulfur dioxide, nitrogen oxides, carbon dioxide, and mercury and a renewable
energy portfolio standard. Washington, DC: US Department of Energy; 2001. Report No.: SR/
OIAF/2001-03. Available from: http://www.eia.doe.gov/oiaf/servicerpt/epp/pdf/
sroiaf(2001)03.pdf.
[5] Energy Information Administration. Impacts of the Kyoto protocol on US energy markets and
economic activity. Washington, DC: US Department of Energy; 1998. Report No.: SR/OIAF/
98-03. Available from: http://www.eia.doe.gov/oiaf/kyoto/kyotorpt.html.
[6] Haq Z. Biomass for electricity generation. Washington, DC: Energy Information Administration,
US Department of Energy; 2002. Available from: http://www.eia.doe.gov/oiaf/analysispaper/
biomass/pdf/biomass.pdf.
1041M.C. Heller et al. / Renewable Energy 29 (2004) 1023–1042
[7] International Organization for Standardization. Environmental management—life cycle assess-
ment—principles and framework. Geneva; 1997. Report No.: ISO 14040.
[8] Houghton JT, Filho LGM, Bruce J, Lee H, Callander BA, Haites E, et al., editors. Radiative forc-
ing of climate change and an evaluation of the IPCC IS92 emissions scenarios. Cambridge:
Cambridge University Press; 1994.
[9] Abrahamson LP, Volk TA, Kopp RF, White EH, Ballard JL. Willow biomass producer’s hand-
book (revised). Syracuse, NY: Short-Rotation Woody Crops Program, SUNY-ESF; 2002 http://
www.esf.edu/willow/pdf/handbook.pdf.
[10] Heller MC, Keoleian GA, Volk TA. Life cycle assessment of a willow bioenergy cropping system.
Biomass and Bioenergy 2003;25:147–165.
[11] Antares Group Inc. Biomass residue supply curves for the United States. Landover, MD: prepared
for US DOE and NREL; 1999. Report No.: ACG-7-17078-07.
[12] Antares Group Inc., NRG Energy Inc. Pre-operational and startup testing plan for the biomass
system at NRG’s Dunkirk Unit #1; 2001.
[13] Mann MK, Spath PL. A life cycle assessment of biomass cofiring in a coal-fired power plant. Clean
Products and Processes 2001;3:81–91.
[14] Electric Power Research Institute and US Department of Energy. Analysis of willow for use as a
biomass energy source: topical report prepared by the Foster Wheeler Development Corporation;
January 2000.
[15] Vorres KS. Users handbook for the Argonne Premium Coal Sample Program: National Technical
Information Service; 1989. Report No.: ANL/PCSP-89/1. Available from: http://www.anl.gov/
PCS/report/part1.html.
[16] Liptay K, Chanton J, Czepiel P, Mosher B. Use of stable isotopes to determine methane oxidation
in landfill cover soils. Journal of Geophysical Research 1998;103(D7):8243–50.
[17] EPA. Solid waste management and greenhouse gases: a life-cycle assessment of emissions and sinks.
2nd ed. US Environmental Protection Agency; 2002. Report No.: EPA530-R-02-006. Available
from: http://www/epa.gov/globalwarming/actions/waste/greengas.pdf.
[18] Overend RP. The average haul distance and transportation work factors for biomass delivered to a
central plant. Biomass 1982;2:75–9.
[19] Ecobalance, National Pollution Prevention Center. Life cycle inventory analysis of a generic
vehicle: results report. Dearborn, MI: US Automotive Materials Partnership; 1997.
[20] Spath PL, Mann MK, Kerr DR. Life cycle assessment of coal-fired power production. Golden, CO:
National Renewable Energy Laboratory; 1999. Report No.: NREL/TP-570-25119. Available from:
http://www.nrel.gov/docs/fy99osti/25119.pdf5119.pdf.
[21] Electric Power Research Institute and US Department of Energy. Renewable Energy Technology
Characterizations; 1997. Report No.: TR-109496. Available from: http://www.eren.doe.gov/
power/techchar.html.
[22] Lindsey CA, Volk TA. Assessing the commercial potential of a willow biomass crop enterprise.
BIOENERGY 2000 Proceedings, Buffalo, NY; October 15–19, 2000.
[23] Lindsey CA. The Antares Group, Inc., 2001.
[24] Energy Information Administration. Table 24: origin of coal received by electric utility and plant,
1999. US Department of Energy; 1999. Available from: http://www.eia.gov/cneaf/electricity/cq/
t24p30.htm.
[25] Energy Information Administration. Table 64. Domestic distribution of US coal by destination
state, consumer, origin and method of transportation, 1999. US Department of Energy; 1999.
Available from: http://www.eia.doe.gov/cneaf/coal/cia/html/t64p01p18.html.
[26] Energy Information Administration. Table 3. Coal production and number of mines by state and
mine type, 1999. US Department of Energy; 1999. Available from: http://www.eia.doe.gov/cneaf/
coal/cia/html/tbl03p1.html.
[27] EPA. Clean air market programs: Dunkirk plant. US Environmental Protection Agency; 2000.
Available from: http://www.epa.gov/airmarkets/picturethis/ny/2554_95.htm.
[28] Tillman DA. Biomass cofiring: the technology, the experience, the combustion consequences. Bio-
mass and Bioenergy 2000;19:365–84.
M.C. Heller et al. / Renewable Energy 29 (2004) 1023–10421042
[29] Mann MK, Spath PL. Life cycle assessment of a biomass gasification combined-cycle system.
National Renewable Energy Laboratory; 1997. Report No.: NREL/TP-430-23076.
[30] Keoleian GA, Lewis GM. Modeling the life cycle and environmental performance of amorphous
silicon BIPV roofing in the US. Renewable Energy 2003;28:271–93.
[31] Schleisner L. Life cycle assessment of a wind farm and related externalities. Renewable Energy
2000;20:279–88.
[32] Labrecque M, Teodorescu TI. Influence of plantation site and wastewater sludge fertilization on the
performance and foliar nutrient status of two willow species grown under SRIC in southern Quebec
(Canada). Forest Ecology and Management 2001;150:223–39.
[33] Landberg T, Greger M. Can heavy metal tolerant clones of Salix be used as vegetation filters on
heavy metal contaminated land?. In: Aronsson P, Perttu K, editors. Willow vegetation filters for
municipal wastewaters and sludges: a biological purification system. Uppsala, Sweden: Swedish
University of Agricultural Sciences; 1994, p. 133–44.
[34] Neuhauser EF, O’Meara TM, Benjamin WH, Abrahamson LP, Robison DJ, Rooney T, et al.
Economic development through biomass systems integration. Palo Alto, CA; 1995. Report No.:
EPRI Project Rep. No. 3407-20.
[35] USDA. Trends in US Agriculture. National Agricultural Statistics Services, US Department of
Agriculture. Available from: http://www.usda.gov/nass/pubs/trends/index.htm.