2004 annual report more blue - À propos de … · pierre despars vice president, finance and...
TRANSCRIPT

more blue2004 ANNUAL REPORT
GA
ZM
ÉTR
OLIM
ITED
PAR
TNE
RS
HIP
2004A
NN
UA
LR
EP
OR
T

G A Z M É T R O L I M I T E D P A R T N E R S H I P
2 0 0 4 A N N U A L R E P O R T
HIGHLIGHTS
Years ended September 30, (in millions of dollars, except for unit data which is in dollars) 2004 2003
CONSOLIDATED INCOME AND CASH FLOWS
Revenues $1,783 $1,757
Gross margin $ 555 $ 569
Income before interest, taxes and amortization $ 386 $ 385
Partners’ income $ 160 $ 153
Cash flows related to operating activities (before working capital) $ 351 $ 356
Capital expenditures and deferred charges $ 190 $ 235
Partners’ income per unit
Basic $ 1.40 $ 1.39
Diluted $ 1.40 $ 1.39
Distributions paid per unit $ 1.36 $ 1.34
Weighted average number of outstanding units (in millions) 114.5 110.5
Interest coverage on long-term debt over a period of 12 months (times) 2.99 2.88
CONSOLIDATED NORMALIZED VOLUMES (1) (in millions of cubic metres)
MARKETS
Industrial 3,120 3,071
Commercial 1,917 1,905
Residential 752 741
Total 5,789 5,717
OTHER INFORMATION
Authorized rate of return on deemed common equity (Quebec distribution activity) 10.96% 10.34%
Credit ratings
Long-term bonds(2) (S&P/DBRS) A/A A/A
Commercial paper(2) (S&P/DBRS) A-1(low)/R-1(low) A-1(low)/R-1(low)
Stability of distributions (S&P/DBRS) SR-1/STA-1(low) SR-1/STA-1(low)
Market prices on Toronto Stock Exchange (in dollars):
High $22.73 $20.86
Low $19.40 $17.50
Close $21.04 $20.28
Public ownership in Partnership 25.3% 24.9%
CONSOLIDATED BALANCE SHEETS
Total assets $2,361 $2,431
Long-term debt, including current portions $1,209 $1,289
Partners’ equity $ 885 $ 876
Partners’ equity per unit $ 7.73 $ 7.69
Net tangible asset coverage on total long-term debt,
including current portion (times) 1.71 1.66
(1) Estimated volumes at normal temperatures in Quebec only.
(2) Through its General Partner, Gaz Métro, inc.
2,26
3
00
2,35
0
01
2,33
7
02
CAPITAL EXPENDITURES AND DEFERRED CHARGES (in millions of dollars)
139
00
253
01
107
02
CASH FLOWS RELATED TO OPERATING ACTIVITIES(in millions of dollars)
190
00
323
01
299
02
PARTNERS’INCOME(in millions of dollars)
144
00
141
01
155
02
2,43
1
03
235
03
299
03
153
03
2,36
1
04
190
04
341
04
160
04
TOTAL ASSETS (in millions of dollars)
08 transportation and supply systems
10 management committee
12 report to partners
15 mission, objective and the partnership
16 corporate structure
17 the year in review
24 social and environmental report
29 management’s discussion and analysis
43 consolidated financial statements
70 board of directors
75 directors and officers
76 offices
77 information for partners
Just like the large companies that use natural gas for their industrial processes, a growing number of institutions,businesses and homeowners are choosing the “blue solution”to heat air and water. In doing so, these men and women are using the right energy in the right place.
Through the contribution of “blue” to the energy portfolio,Gaz Métro is helping Quebec make even more headway.
more headway
ROBERT TESSIERPresident and Chief Executive Officer

more customers

7,759new customers
opted for the comfort and efficiency of natural gas, a record exceeding
even last year’s performance.The love affair with natural gas
has only just begun.

a more efficient energy
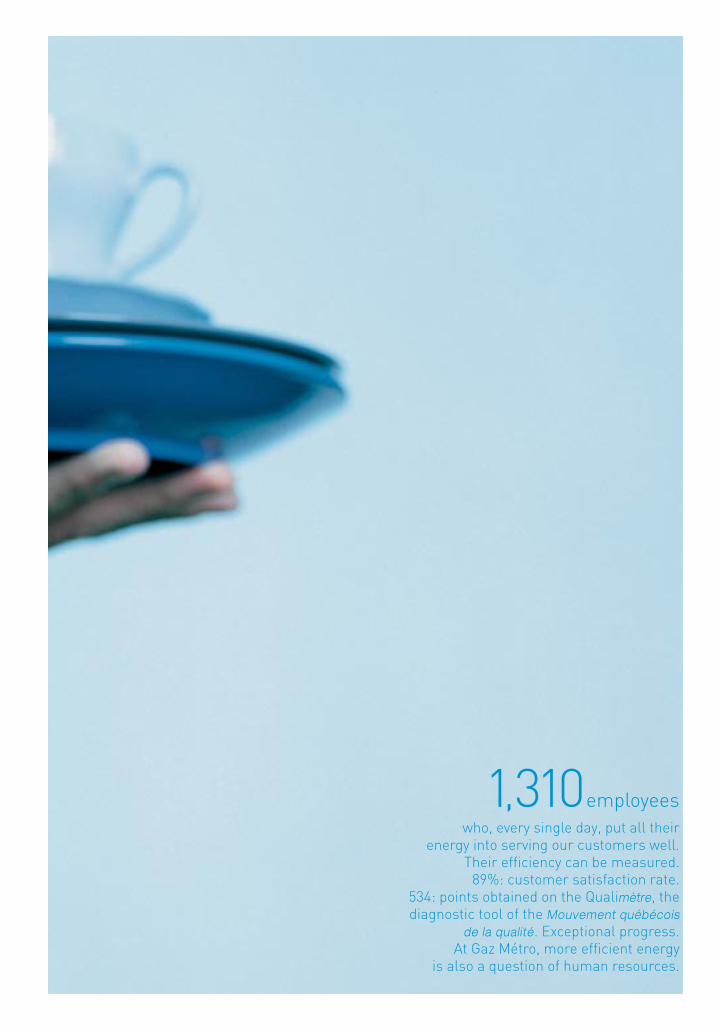
1,310employees
who, every single day, put all their energy into serving our customers well.
Their efficiency can be measured.89%: customer satisfaction rate.
534: points obtained on the Qualimètre, the diagnostic tool of the Mouvement québécois
de la qualité. Exceptional progress. At Gaz Métro, more efficient energy
is also a question of human resources.

more growth

15% annualized total return of a
Gaz Métro unit for 11 years, which is 5% higher than the average return on the S&P/TSX index.

08 G A Z M É T R O L I M I T E D P A R T N E R S H I P
2 0 0 4 A N N U A L R E P O R T
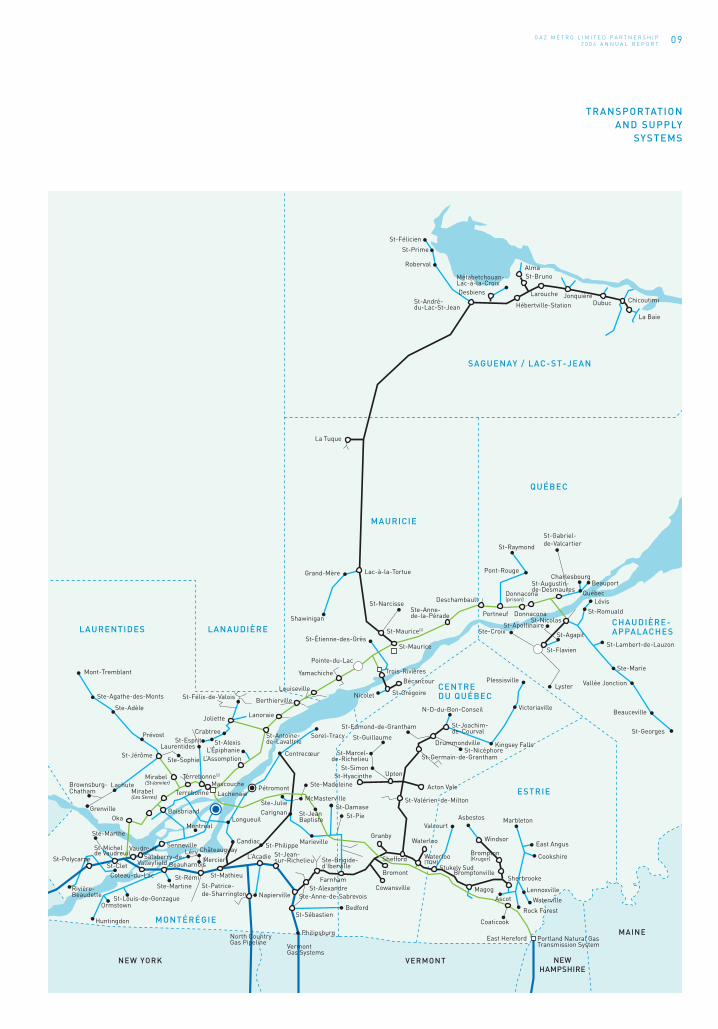
TRANSPORTATION AND SUPPLY SYSTEMS
Ottawa
CornwallIroquois
Gatineau
ONTARIO
ABITIBI-TÉMISCAMINGUE
Thorne
Témiscaming
Earlton
Rouyn-Noranda
Malartic
Amos
Val-d’OrLouvicourt
Map of the territory (not to scale) November 2004
Main distribution lines
Transportation system (TQM)
Transportation system (TCPL)
Distribution system (partial representation)
Champion Pipe Line
Compressor station
City gate station
Underground storage
Liquified natural gas plant
Intrafranchise gas supplier
Transportation system
Gazifère
09G A Z M É T R O L I M I T E D P A R T N E R S H I P
2 0 0 4 A N N U A L R E P O R T
TRANSPORTATION AND SUPPLY
SYSTEMS
St-Félicien
St-Prime
Roberval
St-André-du-Lac-St-Jean
La Tuque
Grand-Mère
Shawinigan
Lac-à-la-Tortue
St-Raymond
Pont-Rouge
Deschambault
Portneuf Donnacona
CharlesbourgBeauport
QuébecLévis
St-Romuald
St-Lambert-de-Lauzon
Ste-Marie
Vallée Jonction
Beauceville
St-Georges
St-Nicolas
St-Flavien
St-ApollinaireSte-Croix St-Agapit
LysterPlessisville
VictoriavilleN-D-du-Bon-Conseil
St-Joachim-de-Courval
St-GuillaumeSorel-Tracy
Contrecœur
Upton
Acton Vale
Valcourt
WaterlooGranby
CarignanLongueuil
Candiac
L’Acadie
St-Mathieu
St-PhilippeLéry
Beauharnois
Châteauguay
Mercier Salaberry-de- ValleyfieldSt-Clet
Ste-Marthe
St-Polycarpe
VaudreuilSt-Michel de Vaudreuil
Coteau-du-Lac
Ormstown
Huntingdon
St-Louis-de-GonzagueRivière-Beaudette
Senneville
St-RémiSte-Martine
NapiervilleSt-Patrice-de-Sharrington
St-Sébastien
Philipsburg
VermontGas Systems
North CountryGas Pipeline
Ste-Brigide-d’Iberville
St-Jean-sur-Richelieu
Marieville
McMasterville
Ste-Madeleine
St-DamaseSt-PieSt-Jean
Baptiste
Ste-Julie
Pétromont
Shefford
Bromont
CowansvilleSt-AlexandreFarnham
Bedford
Ste-Anne-de-Sabrevois
Waterloo(TQM)
Windsor
Brompton(Kruger)
Marbleton
Stukely Sud
Asbestos
East Angus
Cookshire
Lennoxville
Waterville
Rock Forest
Coaticook
AscotMagog
BromptonvilleSherbrooke
East Hereford Portland Natural GasTransmission System
St-Valérien-de-Milton
St-SimonSt-Hyacinthe
St-Marcel-de-Richelieu
St-Edmond-de-Grantham
Drummondville
St-Germain-de-Grantham
Kingsey FallsSt-Nicéphore
St-Augustin-de-Desmaures
Donnacona(prison)
Ste-Anne-de-la-Pérade
St-Narcisse
St-Maurice
St-Maurice(2)
St-Étienne-des-Grès
Pointe-du-Lac
Yamachiche Trois-RivièresBécancour
St-GrégoireNicoletLouiseville
Berthierville
St-Alexis
L’Assomption
Lachenaie
Joliette
CrabtreeSt-Esprit
Ste-Adèle
Ste-Agathe-des-Monts
Mont-Tremblant
Prévost
St-Jérôme
GrenvilleOka
Boisbriand
Montréal
Laurentides
Ste-Sophie
Mirabel(St-Janvier)
TerrebonneMascouche
Terrebonne(2)
St-Félix-de-Valois
Métabetchouan-Lac-à-la-CroixDesbiens
Hébertville-Station
AlmaSt-Bruno
Larouche JonquièreDubuc
La Baie
Chicoutimi
SAGUENAY / LAC-ST-JEAN
QUÉBEC
St-Gabriel-de-Valcartier
CHAUDIÈRE-APPALACHES
CENTRE DU QUÉBEC
MAINE
VERMONTNEW YORK
MAURICIE
LAURENTIDES LANAUDIÈRE
MONTÉRÉGIE
ESTRIE
Lanoraie
L’Épiphanie
St-Antoine-de-Lavaltrie
LachuteMirabel(Les Serres)
Brownsburg-Chatham
NEWHAMPSHIRE

10 G A Z M É T R O L I M I T E D P A R T N E R S H I P
2 0 0 4 A N N U A L R E P O R T
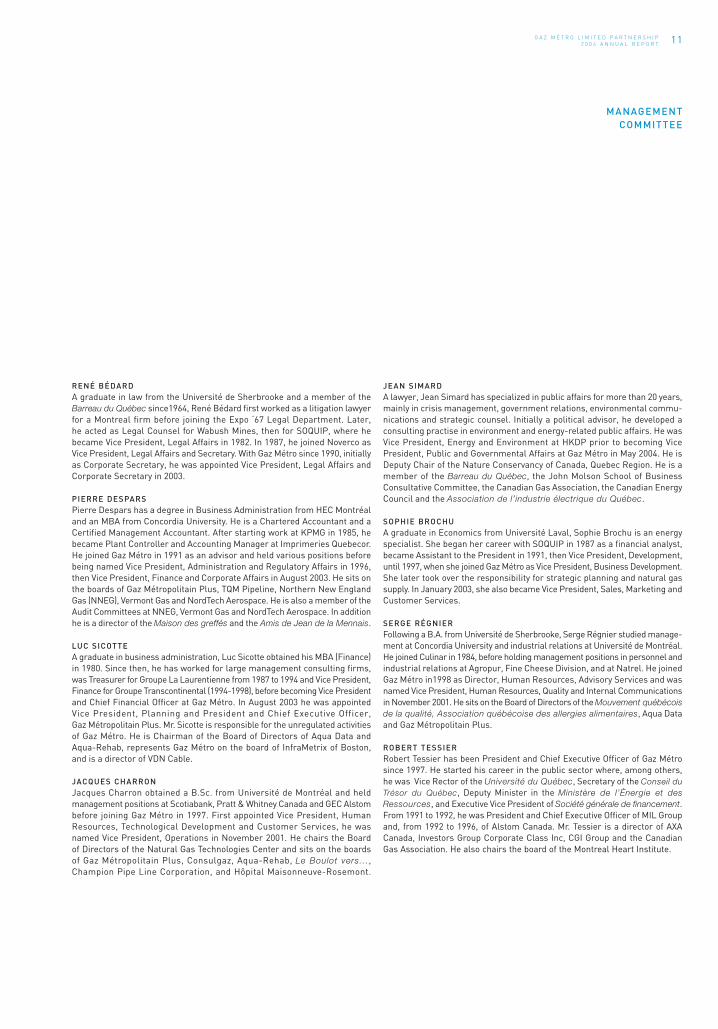
MANAGEMENTCOMMITTEE
RENÉ BÉDARDVice President, Legal Affairs
and Corporate Secretary
LUC SICOTTEVice President, Planning
Gaz Métro and President
and Chief Executive Officer,
Gaz Métropolitain Plus
JEAN SIMARDVice President, Public
and Governmental Affairs
SERGE RÉGNIERVice President, Human
Resources, Quality and
Internal Communications
PIERRE DESPARSVice President, Finance
and Corporate Affairs
JACQUES CHARRONVice President, Operations
SOPHIE BROCHUVice President, Customer
and Gas Supply
ROBERT TESSIERPresident and
Chief Executive Officer
Second row
First row
11G A Z M É T R O L I M I T E D P A R T N E R S H I P
2 0 0 4 A N N U A L R E P O R T
MANAGEMENTCOMMITTEE
RENÉ BÉDARDA graduate in law from the Université de Sherbrooke and a member of theBarreau du Québec since1964, René Bédard first worked as a litigation lawyerfor a Montreal firm before joining the Expo ‘67 Legal Department. Later, he acted as Legal Counsel for Wabush Mines, then for SOQUIP, where hebecame Vice President, Legal Affairs in 1982. In 1987, he joined Noverco asVice President, Legal Affairs and Secretary. With Gaz Métro since 1990, initiallyas Corporate Secretary, he was appointed Vice President, Legal Affairs andCorporate Secretary in 2003.
PIERRE DESPARSPierre Despars has a degree in Business Administration from HEC Montréaland an MBA from Concordia University. He is a Chartered Accountant and aCertified Management Accountant. After starting work at KPMG in 1985, hebecame Plant Controller and Accounting Manager at Imprimeries Quebecor.He joined Gaz Métro in 1991 as an advisor and held various positions beforebeing named Vice President, Administration and Regulatory Affairs in 1996,then Vice President, Finance and Corporate Affairs in August 2003. He sits onthe boards of Gaz Métropolitain Plus, TQM Pipeline, Northern New EnglandGas (NNEG), Vermont Gas and NordTech Aerospace. He is also a member of theAudit Committees at NNEG, Vermont Gas and NordTech Aerospace. In additionhe is a director of the Maison des greffés and the Amis de Jean de la Mennais.
LUC SICOTTEA graduate in business administration, Luc Sicotte obtained his MBA (Finance)in 1980. Since then, he has worked for large management consulting firms,was Treasurer for Groupe La Laurentienne from 1987 to 1994 and Vice President,Finance for Groupe Transcontinental (1994-1998), before becoming Vice Presidentand Chief Financial Officer at Gaz Métro. In August 2003 he was appointed Vice President, Planning and President and Chief Executive Officer, Gaz Métropolitain Plus. Mr. Sicotte is responsible for the unregulated activities of Gaz Métro. He is Chairman of the Board of Directors of Aqua Data andAqua-Rehab, represents Gaz Métro on the board of InfraMetrix of Boston, and is a director of VDN Cable.
JACQUES CHARRONJacques Charron obtained a B.Sc. from Université de Montréal and held management positions at Scotiabank, Pratt & Whitney Canada and GEC Alstombefore joining Gaz Métro in 1997. First appointed Vice President, HumanResources, Technological Development and Customer Services, he was named Vice President, Operations in November 2001. He chairs the Board of Directors of the Natural Gas Technologies Center and sits on the boards of Gaz Métropolitain Plus, Consulgaz, Aqua-Rehab, Le Boulot vers..., Champion Pipe Line Corporation, and Hôpital Maisonneuve-Rosemont.
JEAN SIMARDA lawyer, Jean Simard has specialized in public affairs for more than 20 years,mainly in crisis management, government relations, environmental commu-nications and strategic counsel. Initially a political advisor, he developed aconsulting practise in environment and energy-related public affairs. He wasVice President, Energy and Environment at HKDP prior to becoming VicePresident, Public and Governmental Affairs at Gaz Métro in May 2004. He isDeputy Chair of the Nature Conservancy of Canada, Quebec Region. He is amember of the Barreau du Québec, the John Molson School of BusinessConsultative Committee, the Canadian Gas Association, the Canadian EnergyCouncil and the Association de l’industrie électrique du Québec.
SOPHIE BROCHUA graduate in Economics from Université Laval, Sophie Brochu is an energyspecialist. She began her career with SOQUIP in 1987 as a financial analyst,became Assistant to the President in 1991, then Vice President, Development,until 1997, when she joined Gaz Métro as Vice President, Business Development.She later took over the responsibility for strategic planning and natural gassupply. In January 2003, she also became Vice President, Sales, Marketing andCustomer Services.
SERGE RÉGNIERFollowing a B.A. from Université de Sherbrooke, Serge Régnier studied manage-ment at Concordia University and industrial relations at Université de Montréal.He joined Culinar in 1984, before holding management positions in personnel andindustrial relations at Agropur, Fine Cheese Division, and at Natrel. He joinedGaz Métro in1998 as Director, Human Resources, Advisory Services and wasnamed Vice President, Human Resources, Quality and Internal Communicationsin November 2001. He sits on the Board of Directors of the Mouvement québécoisde la qualité, Association québécoise des allergies alimentaires, Aqua Dataand Gaz Métropolitain Plus.
ROBERT TESSIERRobert Tessier has been President and Chief Executive Officer of Gaz Métrosince 1997. He started his career in the public sector where, among others,he was Vice Rector of the Université du Québec, Secretary of the Conseil duTrésor du Québec, Deputy Minister in the Ministère de l’Énergie et desRessources, and Executive Vice President of Société générale de financement.From 1991 to 1992, he was President and Chief Executive Officer of MIL Groupand, from 1992 to 1996, of Alstom Canada. Mr. Tessier is a director of AXACanada, Investors Group Corporate Class Inc, CGI Group and the CanadianGas Association. He also chairs the board of the Montreal Heart Institute.

12 G A Z M É T R O L I M I T E D P A R T N E R S H I P
2 0 0 4 A N N U A L R E P O R T
NEW CORPORATE FAMILY
The past year saw major changes in the shareholdings of Noverco,the sole shareholder of Gaz Métro inc., which owns 74.7% of the unitsof Gaz Métro Limited Partnership for which it is the General Partner.Capital Infragaz s.e.c. (now Trencap s.e.c.), a newly formed limitedpartnership, became a shareholder of Noverco, joining Enbridgeand Gaz de France, whose ownership interests remain unchanged.
Through Trencap and Noverco, Gaz Métro acquired new soliddiverse investors, namely: Caisse de dépôt et placement du
Québec, SNC-Lavalin, the Fonds de solidarité FTQ, British ColumbiaInvestment Management Corporation, the Régime des rentes du
mouvement Desjardins and, just recently, the Régime de retraite
de l’Université du Québec. We would like to welcome theseorganizations to our corporate family, as well as the new membersof the Board of Directors. Furthermore, with the purchase of$10,5 million of units on October 21, 2003 by the underwriters of the successful September 30, 2003 $70,0 million unit issue, thepublic increased its interest in the Partnership to 25.3%. Theseinvestments by professional investors and the general publicspeak to the confidence investors have in our organization andprovide us with an incentive to excel.
The second phase of the advertising campaign to promoteGaz Métro’s new corporate image, which is a reflection of a newcorporate vision, was again enthusiastically received by the generalpublic. This year, the Partnership is continuing its transformationby focusing on the functional aspects of gas appliances. Thecampaign bolsters the ongoing efforts of the organization and itsbusiness partners to develop and retain its clientele.
The new corporate image is more than just an image. It reflectsprofound changes in the organization’s culture. All of our personnelhave had to adapt their approaches in order to achieve the ambi-tious objectives set in an energy context that will not stand still.
We are proud that this cultural change, which focuses on qualityand aims to ensure customers, investors and employees are satisfied,is well underway, if not already a fait accompli. The Partnershipexpresses its sincere thanks to its employees and business partnersfor their open-mindedness, efforts and accomplishments.
RESULTS
In spite of adverse factors that reduced income by $6.3 million,Partners’ income in 2004 is up by 4.6% to $160.4 million. Partnersreceived distributions of $154.3 million, i.e. $1.36 per unit. Partners’income per unit of $1.40 is up by $0.01 over the 2003 fiscal year.
The adverse factors that had to be offset in order to achieve thisgrowth are the impact of a further reduction in the corporate taxrate, which, among other things, reduces the income tax expenserecovered from Gaz Métro’s customers in Quebec, and the impactof a stronger Canadian dollar in relation to its U.S. counterpart onthe results for Vermont Gas Systems and Portland Natural GasTransmission System. Income per unit was also affected by the factthere were 3.6% more weighted average number of outstandingunits in 2004 than in 2003.
The Partnership also invested $2.8 million in a proposed LNGterminal (“Rabaska”) and, in accordance with our developmentexpense policy, charged this amount to income.
The increase in Partners’ income is attributable to a largerownership interest in PNGTS and improved profitability in theEnergy Services and Other sector. Income from the distributionactivity is virtually the same as last year. Details of the results forthese three sectors are described further on.
PERFORMANCE OF UNIT
As mentioned above, distributions totalled $1.36 per unit, an increase of $0.02 over the 2003 fiscal year. The price of the
report to partners

13G A Z M É T R O L I M I T E D P A R T N E R S H I P
2 0 0 4 A N N U A L R E P O R T
REPORT TO
PARTNERS
unit was up by 3.7% from $20.28 as at September 30, 2003to $21.04 as at September 30, 2004. As the return on distri-butions ($1.36/$20.28) is 6.7%, the total return on the unit was 10.4% in 2004.
For the 11 years since the initial public offering of the Partnership’sunits, the total annualized return on the unit is 14.8%.
DISTRIBUTION
The distribution of natural gas generated 85.9% of the Partners’income for its 2004 fiscal year. Income from this sector was$137.7 million for the year, i.e. $0.3 million lower than in 2003. A weaker U.S. dollar in relation to the Canadian dollar reducedincome reported for Vermont Gas Systems. In addition, as indicatedin last year’s Report, income was hit by a further reduction in thefederal corporate tax rate, which had a negative impact on Partners’income from the Quebec distribution activity, which is beforeincome taxes.
Furthermore, the base rate of return authorized by the Régie de
l’énergie was lower than the previous year. Nevertheless, a totalreturn of 11.47% was realized, compared to 11.05% in 2003, dueto the sharing of productivity gains and overearnings with customers.
Normalized volumes (for temperatures, in Quebec) sold were 5,789 million cubic metres, 1.3% more than the previous year. All of the markets contributed to this increase. Even more impor-tantly, a record 7,759 new contracts were signed in Quebec in 2004,and penetration of the new construction market continues to grow.
Gaz Métro’s customers are being well taken care of as tightly controlled costs, orderly development and higher volumes madeit possible to reduce distribution rates by an average of 3% for the2005 year. Distribution is the only service that is fully controlledby Gaz Métro.
For the 2005 fiscal year, the Régie de l’énergie approved a rate ofreturn, after deemed income taxes, of 11.64% on Partners’ equityallocated to the Quebec distribution activity. This includes an incen-tive return of 1.95% due to realized and anticipated productivitygains under a regulatory framework that has enabled customers,environmental groups and Partners to all come out winners sinceit was introduced in 2001.
TRANSPORTATION
Except for the two pipelines owned by Champion Pipe Line, awholly-owned subsidiary that supplies Gaz Métro’s system in Abitibiand Témiscamingue, Gaz Métro’s investments in the transpor-tation sector are limited to ownership interests in two pipelines inwhich TransCanada PipeLines is a co-owner. The sector contributed$22.5 million, or 14.0%, to consolidated income. The most noteworthy events in 2004 were the increase in the ownershipinterest in Portland Natural Gas Transmission System from 26.9%to 38.3% on November 17, 2003 and the restructuring of themanagement of PNGTS, with the positive impacts to be feltespecially starting in 2006.
TQM Pipeline continues to perform well and is getting readyto respond to greater demand from Gaz Métro, among others, tosupply cogeneration plants like the TransCanada Energy plantin Bécancour.
ENERGY SERVICES AND OTHER
A turnaround in this sector generated income of $2.8 million, i.e.1.7% of consolidated income, compared to a loss of $0.2 millionin 2003, primarily on account of restructuring costs. Aqua Data andAqua-Rehab Group, in which the Partnership owned 50% interestsfor a number of years, are now wholly-owned subsidiaries. Thisexplains in large part why total revenues for the sector were up by12.0% in 2004 to $68.2 million.

14 G A Z M É T R O L I M I T E D P A R T N E R S H I P
2 0 0 4 A N N U A L R E P O R T
REPORT TO PARTNERS
CURRENT PROJECT
The proposed Rabaska LNG terminal, in which Gaz Métro isworking with strategic partners, i.e. Gaz de France and Enbridge,continues to evolve. Gaz Métro spent $2.8 million to develop thisproject in 2004. While there were a number of setbacks before theconsultation process had been completed, the Partnership and itspartners continue to evaluate the project’s feasibility. The LNGterminal, which could receive annual volumes equivalent toQuebec’s current consumption, would provide Gaz Métro andEnbridge, and their customers, with a welcome diversification oftheir gas supply. International LNG trade has an enviablereputation in terms of safety and reliability.
BUSINESS OPPORTUNITIES AND OUTLOOK
In August 2004, the Régie de l’énergie authorized the repeal ofHydro-Québec’s commercial dual energy rate as of April 2006.The Partnership plans to seize the business opportunities thatwill arise as a result of this decision and is proposing efficientnatural gas solutions to businesses that have to make the tran-sition. At the end of the 2004 fiscal year, we had already startedto take advantage of this new potential.
Hydro-Québec Distribution issued a new call for tenders for elec-tricity produced by cogeneration plants. This should provide oppor-tunities for Gaz Métro either as a distributor, a developer or both.
Following its ratification by Russia in October 2004, the KyotoProtocol will come into force next year. In this context, naturalgas is more than ever an effective environmental solution for
industries to reduce their greenhouse gas emissions (GGEs). It is worth mentioning that, in February 2004, the Government of Quebec recognized the Partnership’s performance in terms ofprocesses and results in reducing GGEs.
There was a great deal of discussion during the first half of 2004about Quebec’s energy needs and what should be done to meetthem. This discussion should continue unabated over the nextfew months with a parliamentary commission hearing on Quebec’senergy future. Gaz Métro intends to capitalize on this opportunity,which should see the formulation of a new energy policy, to pro-mote a vision of responsible sustainable energy development inwhich natural gas should assume its rightful place because of the advantages it has over other forms of energy.
At the Board of Directors meeting today, the Board announcedthat the Partnership’s quarterly income distribution has beenmaintained at $0.34 per unit.
CHANGES TO THE BOARD OF DIRECTORS
There have been a number of changes to the Board of Directorssince last year’s Report to Partners, in particular, following the changein the shareholdings of Noverco. Pierre Anctil, Ghislain Gauthier andPierre Michaud replaced Hélène de Kovachich and Yvon Lamontagne(who had in turn replaced Jacques Laurent and Thierry Vandal), andGaston LongVal. In addition, Jean Abiteboul and Mel F. Belich replacedDidier Holleaux and J. Richard Bird respectively. The Board would liketo express its appreciation for the contribution of the Directors whosemandates have ended.
ROBERT PARIZEAUChairman of the Board
ROBERT TESSIERPresident and Chief Executive Officer
Gaz Métro inc.
in its capacity as General Partner
November 18, 2004

15G A Z M É T R O L I M I T E D P A R T N E R S H I P
2 0 0 4 A N N U A L R E P O R T
MISSION, OBJECTIVE AND
THE PARTNERSHIP
MISSION
Gaz Métro transports and distributes natural gas in Quebec and inthe northeastern portion of North America. It also sells goods andservices ancillary to its main activity. It makes use of its know-howto pursue activities that are related or similar to its core business.
OBJECTIVE
Gaz Métro’s financial objective is to provide its Partners with a stable,predictable return, accompanied by growth in value over the years.From a business perspective, the Partnership intends to provide itscustomers with high-quality energy services at the lowest possiblecost, through policies and programs aimed at motivating its employ-ees and business partners.
THE PARTNERSHIP
Gaz Métro’s core business is the distribution of natural gas. The Partnership delivers approximately 97% of the natural gasconsumed in Quebec. Vermont Gas Systems, Inc., a wholly-ownedsubsidiary, is the sole gas distributor in Vermont.
Gaz Métro also owns significant financial interests in two natural gastransportation companies, including a 50% interest in TQM Pipelineand Company, Limited Partnership, which operates a gas pipeline thatconnects upstream with that of TransCanada PipeLines and down-stream with that of Portland Natural Gas Transmission System. Thepipeline owned by PNGTS, in which Gaz Métro holds a 38.3% interest,originates at the Quebec border and extends to the suburbs ofBoston. In addition, a wholly-owned subsidiary of the Partnershipoperates two gas pipelines that cross the Ontario border to supplyGaz Métro’s distribution system in northwestern Quebec.
In addition to these activities and major ownership interests, thePartnership sells goods and services, through subsidiaries and affiliates, in the energy related business, and in water, wastewater and fibre optics networks.

16 G A Z M É T R O L I M I T E D P A R T N E R S H I P
2 0 0 4 A N N U A L R E P O R T
CORPORATE STRUCTURE(NOVEMBER 18, 2004)
CAISSE(General Partner)
50.99%
RÉGIMEDES RENTESDU MOUVEMENTDESJARDINS
8.33%
RÉGIME DERETRAITE DEL’UNIVERSITÉ DU QUÉBEC
1.79 %
BC INVESTMENTMANAGEMENTCORPORATION
11.11%
SNC-LAVALIN INC.
11.11%
SOLIDARITYFUND QFL
16.67%
TRENCAP S.E.C.
50.38%
GAZ DE FRANCE
17.56%
ENBRIDGE
32.06%
NOVERCO INC.
100%
GMi(General Partner)
74.7%
PUBLIC(Limited Partners)
25.3%
GMLP GMiGaz Métro inc.
GMLPGaz Métro Limited Partnership
CAISSECaisse de dépôt et placement du Québec andCapital d’Amérique CDPQ Inc. (General Partner)
BC INVESTMENT MANAGEMENT CORPORATIONTwo trust members of the group owning respectively 9.44% (bcIMC (PPSAF) Investment Trust No.1) and 1.67% (bcIMC (WCBAF-PPSAF)Investment Trust No.1) of the ownership interest
DISTRIBUTIONOF NATURAL GAS
ENERGY SERVICESGaz Métropolitain PlusCCUM Servitech
OTHER ACTIVITIESVDN Cable Aqua DataAqua-RehabTeldig
TRANSPORTATIONOF NATURAL GAS

17G A Z M É T R O L I M I T E D P A R T N E R S H I P
2 0 0 4 A N N U A L R E P O R T
the yearin review
RECORD NEW SALES BREAKTHROUGH IN QUEBEC CITY AWARDS FOR “LIFE IN BLUE” CAMPAIGN OPENING OF NEW BUSINESS
OFFICES CONTINUES OPERATION SHIELD MEETINGS –A SUCCESS TO BE REPEATED FIXED-PRICE GAS FOR COMMERCIAL
AND INSTITUTIONAL CUSTOMERS GAZ MÉTRO –FINALIST IN THE COMMERCE KORN/FERRY CONTEST INFRASTRUCTURE
REHABILITATION –A PROMISING FUTURE FIBRE OPTICS –RACING AHEAD!

18 G A Z M É T R O L I M I T E D P A R T N E R S H I P
2 0 0 4 A N N U A L R E P O R T
THE YEAR IN REVIEW
BREAKTHROUGH IN QUEBEC CITY
Gaz Métro made a significant breakthrough in the residential market in Quebec City.Until quite recently, it connected no more than 30 new houses a year; however, by theend of 2004, 205 new homes will be supplied with natural gas, exceeding the objectiveset. Natural gas is now available in 14 residential subdivisions as well as in apartmentbuildings in Quebec City. In addition, most of the new condos in the region are nowequipped with natural gas fireplaces and other appliances. This breakthrough augurswell for the future in this developing market.
OPERATION SHIELD MEETINGS – A SUCCESS TO BE REPEATED
Operation Shield is a major initiative aimed at retaining commercial and industrialcustomers who consume 75,000 m3 or more of natural gas per year. To get closer tothese customers, 14 meetings were organized in five regions and involved discussionswith almost 400 people from more than 265 companies about trends in energy, hownatural gas prices are set, and energy efficiency. Gaz Métro specialists were able tospot business opportunities as well as promote high energy-efficient equipment.
GEOMARKETING SYSTEM – TO BETTER TARGET THE MARKET
To better focus its sales efforts, Gaz Métro introduced an efficient geomarketingsystem that helps it track the evolution of activities in geographic, demographic andsocioeconomic terms, as well as access to needed information in a timely fashion. Thisinnovative solution helps target potential business customers in order to develop appro-priate commercial strategies and better plan the extension of its distribution system.
ZOOM CLIENT – A CONTINUING SUCCESS
For the third year, the Zoom Client program has enabled Gaz Métro to increase its contactswith small and medium-sized commercial and industrial customers. Most of the partici-pants received a “health bulletin” to help them compare their energy consumption withother businesses in the same field of activity. More than 200 had their installationsinspected by a technician, who made recommendations on energy efficiency. Membersof the Zoom Client program were also invited to three information sessions this yearwhere they were able to talk about energy with various specialists in the field.
Last year, the Energy Planning Network in the United States awarded Gaz Métro its“Best CRM Solutions for C&I” award for its Zoom Client program.
TRANSCANADA ENERGY : GAZ METRO’S LARGEST CUSTOMER EVER
The environmental assessment process for the proposed construction of a natural gaspipeline to supply the TransCanada Energy cogeneration plant at Bécancour has beensuccessfully completed. This included two series of consultations with the Bureau
d’audiences publiques sur l’environnement (BAPE). Gaz Métro was able to satisfactorily
7,759NEW CUSTOMERS
RECORD NEW SALES
7,759 businesses and homeowners chose
Gaz Métro in 2004, beating the previous
year’s record for the number of new customers
and volumes. The residential sector posted
exceptional results, with agreements to
connect 981 existing homes (782 in 2003),
and 4,362 newly built houses (3,467 a year
earlier), to the natural gas system.
19G A Z M É T R O L I M I T E D P A R T N E R S H I P
2 0 0 4 A N N U A L R E P O R T
THE YEAR IN REVIEW
respond to questions from the public about the environment and public safety sincethe BAPE report, made public in September 2004, concluded that the project wasjustified. With an expected cost in the order of $54 million, the pipeline, which will passunder the river to link the two shores of the St. Lawrence, will be one of the largestsystem extensions in the history of Gaz Métro. The cogeneration plant will have a capacity of 507 MW and consume 926 cubic metres (33 Bcf ) of natural gas. Thisrepresents approximately one third of the present volumes delivered to the Quebecindustrial market.
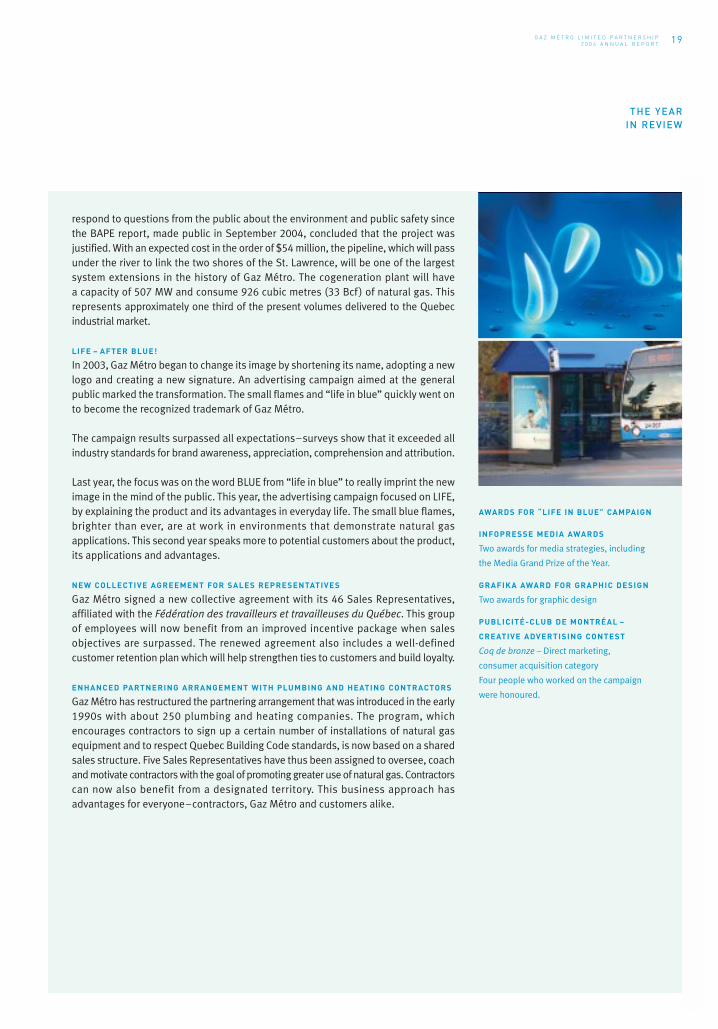
LIFE – AFTER BLUE!
In 2003, Gaz Métro began to change its image by shortening its name, adopting a newlogo and creating a new signature. An advertising campaign aimed at the generalpublic marked the transformation. The small flames and “life in blue” quickly went onto become the recognized trademark of Gaz Métro.
The campaign results surpassed all expectations–surveys show that it exceeded allindustry standards for brand awareness, appreciation, comprehension and attribution.
Last year, the focus was on the word BLUE from “life in blue” to really imprint the newimage in the mind of the public. This year, the advertising campaign focused on LIFE, by explaining the product and its advantages in everyday life. The small blue flames,brighter than ever, are at work in environments that demonstrate natural gasapplications. This second year speaks more to potential customers about the product,its applications and advantages.
NEW COLLECTIVE AGREEMENT FOR SALES REPRESENTATIVES
Gaz Métro signed a new collective agreement with its 46 Sales Representatives,affiliated with the Fédération des travailleurs et travailleuses du Québec. This groupof employees will now benefit from an improved incentive package when salesobjectives are surpassed. The renewed agreement also includes a well-definedcustomer retention plan which will help strengthen ties to customers and build loyalty.
ENHANCED PARTNERING ARRANGEMENT WITH PLUMBING AND HEATING CONTRACTORS
Gaz Métro has restructured the partnering arrangement that was introduced in the early1990s with about 250 plumbing and heating companies. The program, whichencourages contractors to sign up a certain number of installations of natural gasequipment and to respect Quebec Building Code standards, is now based on a sharedsales structure. Five Sales Representatives have thus been assigned to oversee, coachand motivate contractors with the goal of promoting greater use of natural gas. Contractorscan now also benefit from a designated territory. This business approach hasadvantages for everyone–contractors, Gaz Métro and customers alike.
AWARDS FOR “LIFE IN BLUE” CAMPAIGN
INFOPRESSE MEDIA AWARDS
Two awards for media strategies, including
the Media Grand Prize of the Year.
GRAFIKA AWARD FOR GRAPHIC DESIGN
Two awards for graphic design
PUBLICITÉ-CLUB DE MONTRÉAL –
CREATIVE ADVERTISING CONTEST
Coq de bronze – Direct marketing,
consumer acquisition category
Four people who worked on the campaign
were honoured.
20 G A Z M É T R O L I M I T E D P A R T N E R S H I P
2 0 0 4 A N N U A L R E P O R T
THE YEAR IN REVIEW
TEGA PROJECT – NEW TECHNOLOGY TAKES MARKET BY STORM
Gaz Métro struck a good deal when it collaborated with TEGA to develop new natural gas duct heaters for the industrial, commercial and institutional sectors. This partnership, which includes the Natural Gas Technologies Center–Gaz Métro is oneof the Center’s sponsors–developed a patented device that adapts to all sizes of existingair ducts and improves energy efficiency. The new duct heaters were a commercial andtechnical success right from day one.
SUCCESSION PLANNING – PREPARING FOR THE FUTURE
Gaz Métro has set up a succession program to fill management positions in theOperations sector, where about 60% of all employees work. Under this ongoingprogram, employees can follow a personalized development plan that opens the doorto an eventual career in management. The program’s integrated approach links acandidate’s potential in terms of abilities, development of managerial skills, as wellas operating knowledge and abilities, with Gaz Métro’s future needs.
OPENING OF NEW BUSINESS OFFICES CONTINUES
The construction boom in the Laurentians, along with Gaz Métro’s marketing initiatives,have led to a growth in demand for natural gas, with the result that approximately 50 employees in this regional business office have now moved into new, more suitablepremises to better serve their growing clientele.
The Quebec City business office and the Eastern Quebec regional division office alsohave a new address. The new building in the Quebec City industrial park now housesabout 50 employees. Besides space for Administration and Sales, the building also has a showroom for natural gas technologies and a very modern videocon-ference room, which one user in particular, the École de technologie gazière, will usefor training students in the region. Gaz Métro manages this training center, which is basedin Boucherville.
SATISFYING CUSTOMERS
Gaz Métro very much wants to satisfy its customers and the community at large.However, just like any other enterprise, it makes occasional mistakes and so itsometimes receives complaints and comments. To handle them better, it has introduceda customer satisfaction management policy, along with an information system that centralizes the management of problem cases and instantly transmits the variouscommunications to the appropriate person in the organization. This has helped reduce handling time by more than 60%. The new procedure also permits a moredetailed analysis of complaints and comments received in less time and, to the extentpossible, to take the necessary steps to correct the cause of the dissatisfaction.
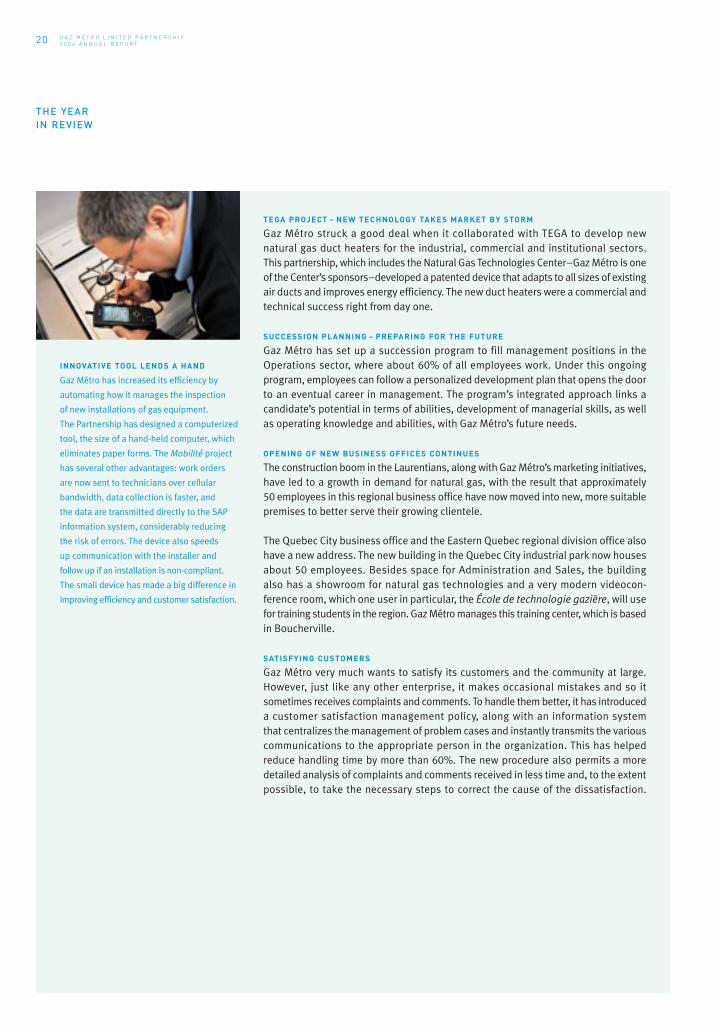
INNOVATIVE TOOL LENDS A HAND
Gaz Métro has increased its efficiency by
automating how it manages the inspection
of new installations of gas equipment.
The Partnership has designed a computerized
tool, the size of a hand-held computer, which
eliminates paper forms. The Mobilité project
has several other advantages: work orders
are now sent to technicians over cellular
bandwidth, data collection is faster, and
the data are transmitted directly to the SAP
information system, considerably reducing
the risk of errors. The device also speeds
up communication with the installer and
follow up if an installation is non-compliant.
The small device has made a big difference in
improving efficiency and customer satisfaction.

21G A Z M É T R O L I M I T E D P A R T N E R S H I P
2 0 0 4 A N N U A L R E P O R T
THE YEAR IN REVIEW
IMPROVED PROCESSES
With the growing number of residential and commercial customers, the Groupe
d’amélioration des processus et des pratiques d’affaires (GAPP) turned its attentionto simplifying and streamlining the steps between signing a contract and billing a newcustomer. GAPP also modified certain business practices, for example, by modifyingthe procedure for collecting overdue accounts during the winter. Now, besides writingletters, we communicate in person or by telephone with residential customers to agree,if possible, on ways of paying the amount owing. More businesslike and more flexible,this approach has also turned out to be advantageous for customers and Gaz Métro.
PUBLIC INFORMATION SESSION ON MAJOR INDUSTRIAL RISKS –
A NEW WAY OF PLANNING INDUSTRIAL DEVELOPMENT ON THE TERRITORY
In February 2004, Gaz Métro took part in a public information day organized by theComité mixte municipal industriel (CMMI) in Montreal East. The objective was toinform the residents of this district about the risks presented by the industriesconcentrated there and the measures to be taken to mitigate their risks in the eventof a serious incident. Gaz Métro prepared a leaflet for the occasion on the LNG Plant,where natural gas is stored in liquefied form to meet peak-period demand. The morethan 500 people who attended greatly appreciated this communication operation, a first in Quebec. Gaz Métro’s participation attests to the company’s responsible andtransparent management and its willingness to work together with the community.
VERMONT GAS SYSTEMS
Vermont Gas Systems connected 1,373 new customers to its system in 2004, hittinga new five-year peak. Compared with the previous fiscal year, new sales in terms ofanticipated volumes increased by 38%, including a 126% increase in the commercialmarket. To serve its customers better, Vermont Gas added 4 km to its distributionsystem and 53 km to its main gas lines.
Vermont Gas energy efficiency programs were recognized by two national organi-zations: the American Council for an Energy–Efficient Economy and Energy Star Homes.
FOR SMALL BUSINESS OWNERS – A SIMPLE AND QUICK FINANCING PROGRAM
In partnership with Scotiabank, Gaz Métro has introduced a new financing programfor small business owners. With its very competitive rates and simplified applicationprocess, the program facilitates the purchase of new natural gas equipment. Thecustomer just has to complete a one-page form and submit it to Scotiabank, along withan estimate from an installer. The bank’s response is given within 48 hours followingreceipt of the application.
INNOVATIVE PROGRAM TO STABILIZE SYSTEM GAS COSTS
Gaz Métro’s financial derivatives program, approved by the Régie de l’énergie, has notonly reduced fluctuations in natural gas prices by more than 60%, it also reducedthe cost of system gas supply by 1.2%. When prices were climbing and customers couldhave expected a higher bill, instead they saw a reduction that represents about$7 million. The kind of “insurance policy” the organization has put in place is one ofthe most avant-garde of all financial derivatives programs to be found among naturalgas utilities in North America.
FIXED-PRICE GAS FOR COMMERCIAL
AND INSTITUTIONAL CUSTOMERS
On October 1, 2003, with the approval of
the Régie de l’énergie, Gaz Métro launched
a new fixed-price gas service for small
businesses and institutions, i.e., customers
who consume between 7,500 m3 and
1,168,000 m3 of natural gas per year.
Since then, suppliers and brokers have
shown increased interest in this new supply
program and a growing number of customers
have opted for the service.

22 G A Z M É T R O L I M I T E D P A R T N E R S H I P
2 0 0 4 A N N U A L R E P O R T
THE YEAR IN REVIEW
LEAP FORWARD IN QUALITY
Gaz Métro exceeded the objective it had set itself before the external audit thatassessed its quality performance in September 2004. In 2001, it obtained 379 pointson the Qualimètre–the diagnostic tool developed by the Mouvement québécois de la
qualité. This year, Gaz Métro was awarded 534 points! According to the auditor, thisis an exceptional result in both progress and score achieved. The auditor also remarkedon the cooperation received from all the employees–more than 300 from all levels ofthe organization–who took part in the very rigorous evaluation process.
RESCHEDULING WORKING HOURS – AN IDEA WHOSE TIME HAS COME
After the introduction of a four-day workweek for unionized employees, the Partnershipdecided to look at the work schedule for managers and specialized personnel. Theseemployees have been offered a proposal that includes formulae and criteria to help themachieve a better work-family balance, so long as the needs of the organization are met.
VERSATILITY PROGRAM A HIT
The versatility program, which stemmed from the introduction of a shorter workweekfor Gaz Métro’s blue-collar employees, led about 200 of them to the doors of theÉcole de technologie gazière in the past year for training to develop their multi-skillknowledge. Versatility is essential to the smooth running of the new work schedule,which came into effect in January 2004, and all the Operations’ technicians are now multi-skilled.
A CULTURE OF HEALTH AND SAFETY IN THE WORKPLACE
In order to instill a genuine culture of prevention, Gaz Métro has drawn up an actionplan that will lead to establishing a new policy on workplace health and safety. By getting not only the Joint Committees but all personnel involved in the plan, Gaz Métro is clearly demonstrating that it wants prevention to be a daily concernthroughout the organization.
GAZ MÉTRO – FINALIST IN THE COMMERCE KORN/FERRY CONTEST
In January 2004, Gaz Métro was among the four finalists in the Grandes entreprises
category for the Commerce Korn/Ferry Grand Prize in the second edition of this contestthat recognizes excellence in corporate governance. Gaz Métro was in competition with National Bank, Industrial Alliance and SNC-Lavalin. In the end, SNC-Lavalin tookfirst prize.
The contest criteria include: having a head office in Quebec, being listed on the stockexchange for five years or more, and posting annual performance above the TSX index.
MEASURING BUSINESS SKILLS
To ensure the development of a business
culture, Gaz Métro has introduced a new
performance-appraisal process for its
approximately 400 managers and specialized
personnel. The process evaluates individual
performance by measuring five skills:
collaboration, rigour, business sense,
flexibility and action-orientation.

23G A Z M É T R O L I M I T E D P A R T N E R S H I P
2 0 0 4 A N N U A L R E P O R T
THE YEAR IN REVIEW
SUBSIDIARIES OF ENERGY SERVICES AND OTHER SECTOR PERFORMED WELL
Net income from Energy Servicesand Other Sector is $2.8 million in 2004, compared to a net loss of $0.2 million in 2003.
FLEXIBILITY AND QUALITY OF SERVICE – KEY FACTORS IN BUILDING LOYALTY
In the energy services area, GMP has renewed several large contracts, including onewith the Office municipal de l’habitation de Montréal (OMHM). Over the next three years, GMP will continue to take care of boiler room maintenance in 400 buildingsthat house more than 10,000 apartments. This renewal is evidence of OMHM’ssatisfaction with the only company in Quebec that can offer 24/7 service, for which80 hours a week are at regular rates.
GMP sold the assets of Option Gaz, a subsidiary that specialized in equipment distri-bution, in order to concentrate on the maintenance and servicing of heating equipment.
INFRASTRUCTURE REHABILITATION – A PROMISING FUTURE
Requiring no street or sidewalk excavation, the interior structural casing procedure isa novel solution that helps prolong the useful life of water and wastewater pipes by40 years at a cost that is as much as 50% less than traditional replacement techniques.The procedure also minimizes inconvenience for traffic, since no trenches are required,and so helps eliminate the social costs of conventional infrastructure-replacementwork. The future looks promising, especially given the infrastructure work municipal-ities will be undertaking in the next few years.
75SCHOOLS
FIBRE OPTICS – RACING AHEAD!
VDN Cable has the wind in its sails.
Revenues were up in 2004, positively
affecting the company’s bottom line. The
subsidiary recently won a call for tender
by the Pointe-de-l’Île school board to link
75 schools through its high-speed bandwidth
service. The Grande Bibliothèque de Montréal
will also be connected to this metropolitan
network. With the convergence of telecom-
munications and IT, it’s full speed ahead
in the fibre optics sector!

24 G A Z M É T R O L I M I T E D P A R T N E R S H I P
2 0 0 4 A N N U A L R E P O R T
social and environmentalreport
EVEN MORE COMMITTED
At Gaz Métro, achieving excellence also means improving the quality of life of the community
and safeguarding the environment. Every day, the men and women who work for Gaz Métro take
concrete steps to assure the future for tomorrow’s generation. By choosing business practices
inspired by sustainable development, supporting almost 300 non-profit organizations every year,
and by showing leadership on environmental matters, the Partnership and its employees are
keeping this promise to our children.

25G A Z M É T R O L I M I T E D P A R T N E R S H I P
2 0 0 4 A N N U A L R E P O R T
SOCIAL AND ENVIRONMENTAL
REPORT
LENDING A HELPING HAND TO PROMISING ARTISTS
Gaz Métro is helping up-and-coming artists by contributing to the successof a few selected events. For the last five years, Gaz Métro has been apartner of the Festiblues international de Montréal and in 2004 supportedthe Relève en blues concert for the third consecutive year. About 100,000people saw the Festiblues, a musical festival with considerable social andcommunity benefits.
FIRE DANCING ON WATER
Gaz Métro was involved in the development of Place Jean-Paul-Riopelle,inaugurated in June 2004 in Montreal’s International District. The focalpoint of this magnificent public square is La Joute, a sculpture-fountainby the celebrated artist. Surrounded by a circle of natural gas flamesdancing on a pool of water, the installation fulfills the wishes of Riopelle.Gaz Métro contributed to several facets of the project, including the designof the development by the Natural Gas Technologies Center, the realizationof the project, and the creation of a fund to ensure the integrity of the work.
LIFE IN BLUE–SYMBOL OF SUSTAINABLE DEVELOPMENT
“Life in blue,” the new corporate signature, calls to mind the Blue Planetby promoting natural gas as a source of energy that fosters environmentalprotection. This stance is in line with the Policy Statement by the Montreal
Community regarding Sustainable Development that Gaz Métro signed,along with the Ville de Montréal and 70 other signatories. This actionplan is aimed at consolidating achievements, changing old habits andrevising practices from a sustainable development perspective throughoutthe Ville de Montréal territory.
HELPING PEOPLE WHO HELP PEOPLE
This year, Gaz Métro and its employees contributed some $180,000to the annual Centraide campaign.
OVERVIEW
The Partnership has operations in nine regions of Quebec and redistributes
a portion of its revenues in grants to organizations in the territory served by
its system. In line with the policy that governs the selection and management
of its contributions, the Partnership concentrates its philanthropic efforts in the
following areas: health, education (university level), culture and socio-community
development. In 2004, the Partnership contributed more than $1,200,000 to
these causes.
Gaz Métro is also committed to demonstrating leadership, rigour and
determination in pursuing its environmental activities, both as a natural gas
distributor and with its customers. The ISO 14001 certificate it has held since
October 2000 was re-registered in 2004, reflecting the quality of the work of
its personnel and Gaz Métro’s determination to continue to improve its ways
of doing business in order to meet the “green challenge” every single day.
26 G A Z M É T R O L I M I T E D P A R T N E R S H I P
2 0 0 4 A N N U A L R E P O R T
SOCIAL AND ENVIRONMENTAL REPORT
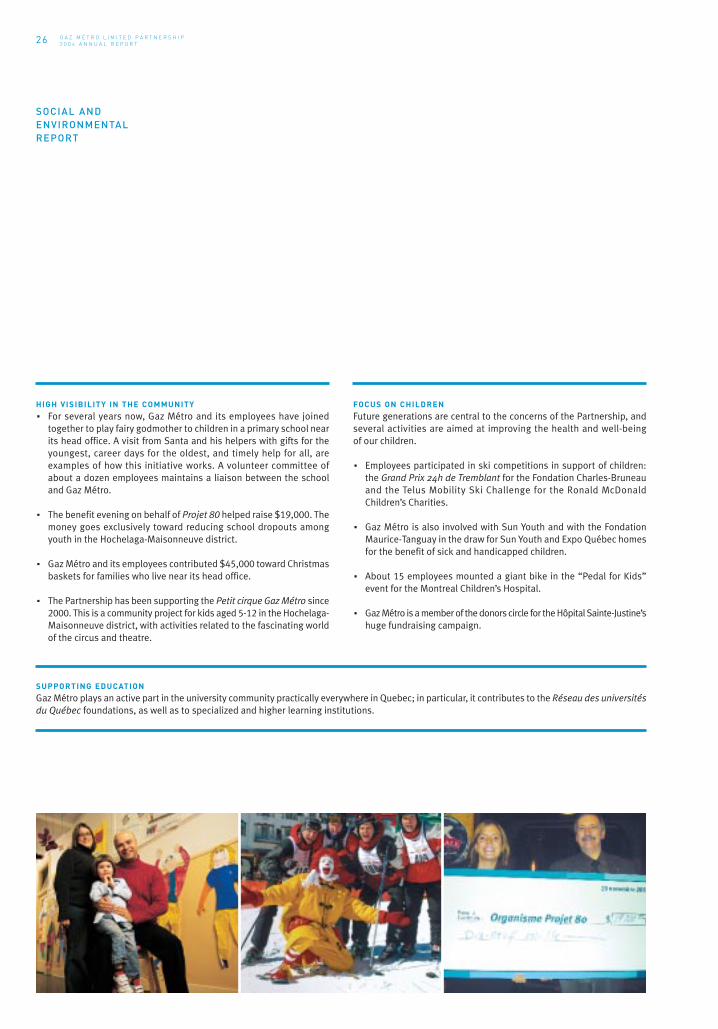
HIGH VISIBILITY IN THE COMMUNITY
For several years now, Gaz Métro and its employees have joinedtogether to play fairy godmother to children in a primary school nearits head office. A visit from Santa and his helpers with gifts for theyoungest, career days for the oldest, and timely help for all, areexamples of how this initiative works. A volunteer committee of about a dozen employees maintains a liaison between the schooland Gaz Métro.
The benefit evening on behalf of Projet 80 helped raise $19,000. Themoney goes exclusively toward reducing school dropouts amongyouth in the Hochelaga-Maisonneuve district.
Gaz Métro and its employees contributed $45,000 toward Christmasbaskets for families who live near its head office.
The Partnership has been supporting the Petit cirque Gaz Métro since2000. This is a community project for kids aged 5-12 in the Hochelaga-Maisonneuve district, with activities related to the fascinating worldof the circus and theatre.
FOCUS ON CHILDREN
Future generations are central to the concerns of the Partnership, andseveral activities are aimed at improving the health and well-being of our children.
Employees participated in ski competitions in support of children:the Grand Prix 24h de Tremblant for the Fondation Charles-Bruneauand the Telus Mobility Ski Challenge for the Ronald McDonaldChildren’s Charities.
Gaz Métro is also involved with Sun Youth and with the FondationMaurice-Tanguay in the draw for Sun Youth and Expo Québec homesfor the benefit of sick and handicapped children.
About 15 employees mounted a giant bike in the “Pedal for Kids”event for the Montreal Children’s Hospital.
Gaz Métro is a member of the donors circle for the Hôpital Sainte-Justine’shuge fundraising campaign.
SUPPORTING EDUCATION
Gaz Métro plays an active part in the university community practically everywhere in Quebec; in particular, it contributes to the Réseau des universités
du Québec foundations, as well as to specialized and higher learning institutions.
27G A Z M É T R O L I M I T E D P A R T N E R S H I P
2 0 0 4 A N N U A L R E P O R T
SOCIAL AND ENVIRONMENTAL
REPORT
RECONCILING THE ENVIRONMENT, PROFITABILITY AND SOCIAL
CONCERNS–THE RESULTS SPEAK FOR THEMSELVES
The agreement on the regulatory framework setting rates has enabledGaz Métro and its customers to benefit from the productivity gainsachieved. The results speak for themselves: as of October 1, 2004,customers saw a 3% reduction in distribution rates, and a better rate ofreturn was authorized for Gaz Métro as a result of sharing these produc-tivity gains.
Gaz Métro functions within a regulatory framework that is unique inCanada, the result of a unanimous agreement with representatives of its customers and environmental groups. The agreement negotiated in 2003 and approved by the Régie de l’énergie will be in effect for five years from October 1, 2004, replacing the agreement in effect sinceOctober 1, 2000. It reconciles respect for the environment with the socialand economic interests of customers and Partners. For example, theagreement stipulates that the productivity gains achieved will be used,in certain proportions, to reduce natural gas rates, finance the EnergyEfficiency Fund and improve the rate of return for the Partners.
The Energy Efficiency Fund, managed by a committee made up of represen-tatives of customers and environmental groups, will give priority to projectswith low-income residential customers or with a social or communityobjective. The fact that the agreement was accepted by all interested partiesand approved by the Régie is also a reflection of the quality of the relationsthat prevail between Gaz Métro and its business Partners.
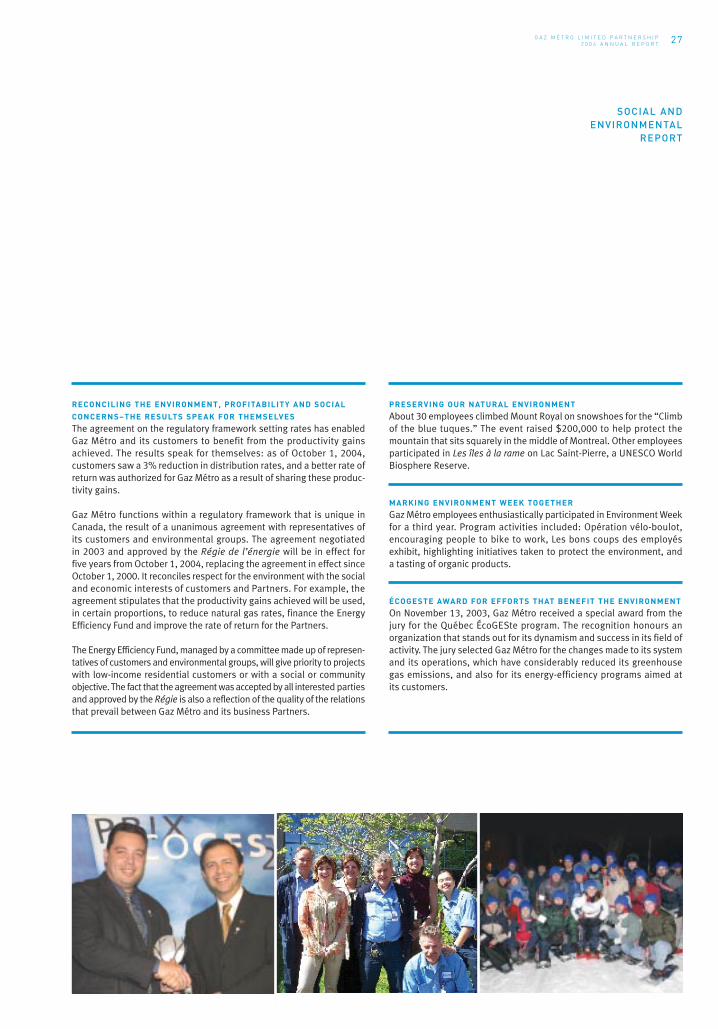
PRESERVING OUR NATURAL ENVIRONMENT
About 30 employees climbed Mount Royal on snowshoes for the “Climbof the blue tuques.” The event raised $200,000 to help protect themountain that sits squarely in the middle of Montreal. Other employeesparticipated in Les îles à la rame on Lac Saint-Pierre, a UNESCO WorldBiosphere Reserve.
MARKING ENVIRONMENT WEEK TOGETHER
Gaz Métro employees enthusiastically participated in Environment Weekfor a third year. Program activities included: Opération vélo-boulot,encouraging people to bike to work, Les bons coups des employésexhibit, highlighting initiatives taken to protect the environment, and a tasting of organic products.
ÉCOGESTE AWARD FOR EFFORTS THAT BENEFIT THE ENVIRONMENT
On November 13, 2003, Gaz Métro received a special award from the jury for the Québec ÉcoGESte program. The recognition honours anorganization that stands out for its dynamism and success in its field ofactivity. The jury selected Gaz Métro for the changes made to its systemand its operations, which have considerably reduced its greenhousegas emissions, and also for its energy-efficiency programs aimed at its customers.

28 G A Z M É T R O L I M I T E D P A R T N E R S H I P
2 0 0 4 A N N U A L R E P O R T
SOCIAL AND ENVIRONMENTAL REPORT
DEVELOPING BIOGAS OPENS UP NEW AVENUES
Intersan has developed a process to capture the gas produced by thebiological decomposition of non-recyclable waste at its landfill site inSainte-Sophie. Gaz Métro ships this gas via a 13-kilometer pipeline tothe Cascades fine paper plant in Saint-Jérôme. This innovative initiative,approved by the Régie de l’énergie, will meet a large part of Cascades’energy needs for the next 10 years. The decomposition of waste in anairless environment generates biogas, which is high in methane, theprincipal component of natural gas. The development of biogas hasattractive commercial potential, as well as being an important steptoward sustainable development. With unique expertise in this field inQuebec, Gaz Métro is actively working on other projects of this kind thatopen up new avenues for energy and the environment.
ENERGY EFFICIENCY–REDUCTIONS EQUAL TO CONSUMPTION
BY 7,000 HOMES
Gaz Métro’s Energy Efficiency Plan has enabled its customers to achievesavings of 20,435,328 m3 of natural gas and to reduce their emissionsby about 37,000 tonnes of carbon dioxide, which is more than what7,000 single-family homes would have consumed or produced.
Energy efficiency has been part of the corporate culture at Gaz Métro formany years. In 1999, it tabled its first Energy Efficiency Plan with the Régie
de l’énergie. The Plan includes a total of 15 programs for residentialand business markets, including large companies.
RECOGNITION FOR GAZ MÉTRO’S ENERGY EFFICIENCY PLAN
Two residential programs under Gaz Métro’s Energy Efficiency Plan (EEP) won a Best Practice Award from the American Council for an Energy-EfficientEconomy. This recognition honours the best energy-efficiency program offered by North American natural gas distributors. Gaz Métro is the onlydistributor in Canada to have won this prize to date.
Gaz Métro was also a Natural Resources Canada 2004 ENERGY STAR Market Transformation Award Winner for raising its standards for the certification of residential appliances eligible for its EEP programs.

29G A Z M É T R O L I M I T E D P A R T N E R S H I P
2 0 0 4 A N N U A L R E P O R T
management’sdiscussionand analysisManagement’s Discussion & Analysis (“MD&A”) should be read in conjunction with theconsolidated financial statements of Gaz Métro Limited Partnership (“Gaz Métro” or the“Partnership”) included in the 2004 Annual Report. Those consolidated financial statementshave been prepared in accordance with Canadian generally accepted accounting principles.All amounts in that Report are in millions of Canadian dollars, unless otherwise indicated.
FORWARD-LOOKING STATEMENTS
To enable investors to better understand the Partnership’s outlook for the future and make more informed investment decisions, the matters discussed
herein may contain forward-looking information about Gaz Métro’s objectives, strategies, financial condition, operating results and activities. Such infor-
mation expresses, as of the date hereof, the estimates, forecasts, projections, expectations or opinions of the Partnership concerning future events or
results. Actual results may differ materially from the results anticipated herein and, consequently, we cannot guarantee that any forward-looking state-
ment will materialize. Forward-looking information does not take account of the impact transactions or non-recurring matters announced or arising after
the statements have been made might have on the Partnership’s results.
The risks and uncertainties that could cause actual results and future events to differ materially from current expectations are described herein,
in particular under Risks.
Gaz Métro does not propose nor does it commit to update forward-looking information, even if new information becomes available as a result of future
events, or for any other reason.
30 mission, objectives and activities
31 performance summary
33 financial results analysis
35 liquidity and capital structure
39 risks
40 recent accounting changes
40 additional information

30 G A Z M É T R O L I M I T E D P A R T N E R S H I P
2 0 0 4 A N N U A L R E P O R T
MISSION, OBJECTIVES AND ACTIVITIESMISSION
Gaz Métro transports and distributes natural gas in Quebec and the northeastern portion of the continent. It also sells goods and servicesancillary to its main activity. It makes use of its know-how to pursue activities that are related or similar to its core business.
OBJECTIVES
Gaz Métro’s financial objective is to provide its Partners with a stable predictable return accompanied by growth in value over the years.From a business perspective, the Partnership intends to provide its customers with high-quality energy services at the lowest possiblecost, through policies and programs aimed at motivating its employees and business partners.
DISTRIBUTION
Gaz Métro’s core business is the distribution of natural gas. The Partnership delivers approximately 97% of the natural gas consumed in Quebec while Vermont Gas Systems (“VGS”), a wholly-owned subsidiary, is the sole gas distributor in Vermont.
The Quebec distribution activities are regulated by the Régie de l’énergie (“Régie”), which sets distribution rates and supervises andmonitors operating activities and development of the gas system. VGS is regulated by the Vermont Public Service Board in the United States.
In the Partnership’s view, the combined effect of its marketing efforts, higher electricity and fuel oil prices, and the increased acceptanceof “the right energy in the right place” concept should generate larger market shares for natural gas in years to come. In addition, the construction of certain gas-fired power plants, in particular cogeneration plants, should increase deliveries and therefore have a positive impact on future results.
TRANSPORTATION
Gaz Métro owns significant financial interests in two natural gas transportation enterprises. The first is a 50% interest in TQM Pipelineand Company, Limited Partnership (“TQM”), which operates a gas pipeline in Quebec that connects upstream with that of TransCanadaPipeLines and downstream with those of Portland Natural Gas Transmission System (“PNGTS”) and Gaz Métro. The pipeline owned byPNGTS, in which Gaz Métro owns a 38.3% interest, originates at the Quebec border and extends to the suburbs of Boston. In addition,a wholly-owned subsidiary of the Partnership operates two gas pipelines that cross the Ontario border to supply Gaz Métro’s distributionsystem in northwestern Quebec. In Canada, transportation activities are regulated by the National Energy Board (“NEB”). In the UnitedStates they are regulated by the Federal Energy Regulatory Commission (“FERC”).
No major investments have been made in the TQM and PNGTS systems for a few years. This erodes the rate base used to calculate theauthorized return, which in turn reduces earnings. TQM and PNGTS have therefore to remain on the lookout for potential additionalinvestments in these two systems, and, particularly in the case of PNGTS, to control operating costs in order to maximize income.
In 2004, PNGTS undertook a major rationalization of its operating costs which should have a positive impact on results starting in 2006.
ENERGY SERVICES AND OTHER
The Partnership sells goods and services, through subsidiaries, joint ventures and companies subject to significant influence, in the energybusiness and in water, wastewater and fibre optics networks.
The past two years have seen a refocusing of activities, downsizing of operations and restructuring of management. The energy-relatedactivities are now focused on the maintenance and repair of residential, commercial and industrial equipment, and on the heating andcooling of large buildings in the vicinity of the Climatisation et Chauffage Urbain de Montréal plant.
Growth of the water and wastewater activities will likely accelerate in the future as integrated water distribution and wastewater collectionsystems master plans become mandatory in Quebec. At the same time, Aqua Data Inc., a wholly-owned subsidiary of Gaz Métro, is makingan effort to penetrate the U.S. market through a joint venture with a large U.S. environmental engineering firm.
MANAGEMENT’S DISCUSSION AND ANALYSIS
31G A Z M É T R O L I M I T E D P A R T N E R S H I P
2 0 0 4 A N N U A L R E P O R T
The investment in shares and convertible debentures of Cable VDN is performing as expected. Cable VDN’s higher sales, combined withtight control over operating costs, should allow it to become profitable starting in 2005.
DEVELOPMENT PROJECTS AND POTENTIAL ACQUISITIONS
In 2004, the Partnership and its partners, Enbridge Inc. (“Enbridge”) and Gaz de France, devoted considerable time and effort to an LNG terminal project called Rabaska. In light of the anticipated evolution of gas production in North America, the project’s partners believethat Lévis on the St. Lawrence River is an excellent port of entry for natural gas from overseas. As distributors, Enbridge and Gaz Métrowould get part of their supply from Rabaska.
However, local municipal authorities have opposed the project from the start of consultations, which were conducted in accordance withthe process established by the NEB. Other local and regional stakeholders have since expressed interest in pursuing the review of theproject. Rabaska’s developers are therefore now considering the alternatives available to them under the circumstances.
In terms of potential acquisitions, Gaz Métro is keeping its eyes open for opportunities that are in line with the Partnership’s missionand that would immediately create value so as not to have to reduce Partner distributions.
PERFORMANCE INDICATORS
Gaz Métro’s core business is the distribution of natural gas in Quebec, with its some 1,300 employees and all of the challenges that involves.In the pursuit of excellence with its suppliers and business partners, the Partnership developed indicators for measuring the organization’sperformance in relation to objectives set at the beginning of the year.
The indicators include:profitability;customer satisfaction;sales growth and new customers;budget versus actual;work atmosphere and performance;occupational health and safety;etc.
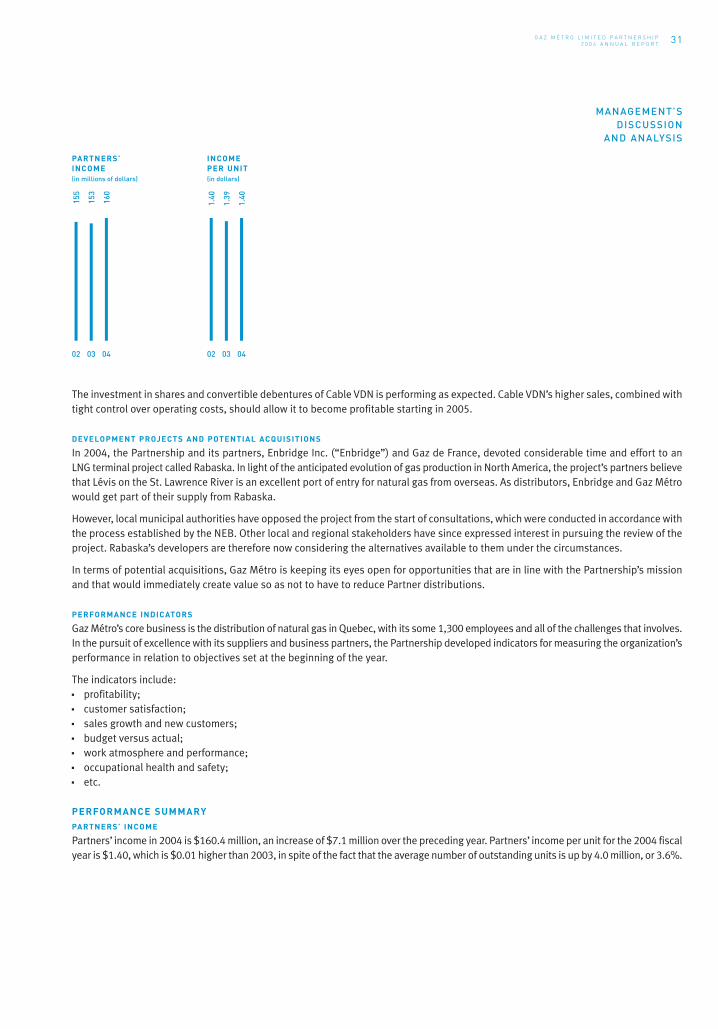
PERFORMANCE SUMMARYPARTNERS’ INCOME
Partners’ income in 2004 is $160.4 million, an increase of $7.1 million over the preceding year. Partners’ income per unit for the 2004 fiscalyear is $1.40, which is $0.01 higher than 2003, in spite of the fact that the average number of outstanding units is up by 4.0 million, or 3.6%.
MANAGEMENT’S DISCUSSION
AND ANALYSIS
155
02
PARTNERS’ INCOME(in millions of dollars)
153
03
160
04
INCOME PER UNIT(in dollars)
1.40
02
1.39
03
1.40
04

32 G A Z M É T R O L I M I T E D P A R T N E R S H I P
2 0 0 4 A N N U A L R E P O R T
This growth can be explained primarily by additional income from the Partnership’s investment in PNGTS, following the increase of itsownership interest from 20.7% to 26.9% on September 30, 2003, and to 38.3% on November 17, 2003, as well as improved profitabilityof the Energy Services and Other Sector in 2004.
Partners’ income is up in spite of the negative impacts of:the 2% reduction in the federal tax rate applicable to the calculation of the Partnership’s deemed income tax cost included in its Quebecdistribution rates (negative impact of approximately $4.1 million);a stronger Canadian dollar in relation to the U.S. dollar (negative impact of $2.2 million); anddevelopment costs of $2.8 million on the Rabaska project.
REVENUES AND GROSS MARGIN
Consolidated revenues for the year ended September 30, 2004 are up by $26.4 million, or 1.5%, to $1,782.9 million compared to$1,756.5 million the preceding year. This increase can be explained primarily by an increase in the average selling price of natural gasand higher transportation, load-balancing and distribution rates. In Quebec, natural gas supply, transportation and load-balancing servicesare billed to customers at their cost to the Partnership and, therefore, have no impact on gross margin or Partners’ income.
Normalized deliveries (for temperatures in Quebec) during the 2004 year are 5,789 million cubic metres of natural gas, an increase of1.3% over 2003. All of the markets contributed to the increase.
Consolidated gross margin is down by 2.4%, or $13.9 million, from the preceding year to $555.0 million. The decrease is mainlyattributable to the fact that the Partnership’s share of PNGTS’ gross margin has not been recorded since November 17, 2003, as a resultof the change in the method of accounting for Gaz Métro’s investment in this enterprise. If the new method had been adopted at the samedate the previous year, gross margin for 2003 would have been $16.5 million lower and gross margin for 2004 would therefore have been$2.6 million higher than the previous year.
LIQUIDITY
Cash flows from operating activities, before changes in non-cash working capital items in 2004, are down $5.6 million to $350.7 million,compared to $356.3 million the preceding year.
The debt/invested capital ratio is 58.3% as at September 30, 2004, compared to 60.1% at the same date the previous year. The decreasecan be explained primarily by a lower debt load attributable to the fact that, as the Partnership has not had joint control of PNGTS since November 17, 2003, it no longer records its share of the items in PNGTS’ balance sheet. This change in accounting methodremoved long-term debt of $97.8 million from Gaz Métro’s balance sheet.
MANAGEMENT’S DISCUSSION AND ANALYSIS
1,60
8
02
1,75
7
03
1,78
3
04
NORMALIZED VOLUMES (millions of cubic metres)
5,92
1
025,
717
035,
789
04
GROSS MARGIN(in millions of dollars)
556
02
569
03
555
04
TOTALASSETS(in millions of dollars)
2,33
7
02
2,43
1
03
2,36
1
04
REVENUES(in millions of dollars)

33G A Z M É T R O L I M I T E D P A R T N E R S H I P
2 0 0 4 A N N U A L R E P O R T
OTHER HIGHLIGHTS
On June 30, 2004, there were changes in the shareholdings of Noverco Inc., the sole shareholder of GMi (parent company of Gaz Métro).Capital Infragaz s.e.c. (now Trencap s.e.c.) acquired the shares owned by Hydro-Québec, National Bank Financial and the Caisse de dépôt et placement du Québec. These shares represented 50.38% of the total issued shares. The interests of Enbridge and Gaz de Franceremained the same.
A noteworthy event in 2004 was the renewal until 2009 of the performance incentive mechanism whereby productivity gains generatedby the Quebec distribution activity are shared by the Partnership and its customers. Introduced in 2001, following an agreement withthe intervenors before the Régie and ratified by it, this regulatory framework is considered a model by the industry. This incentivemechanism provides an effective stimulus for penetrating new markets and increasing profitability through the sharing of productivitygains by the Partnership and its customers.
A total of 7,759 new customers chose Gaz Métro in 2004, a record. The penetration rate in the new residential construction sector hasbeen growing steadily for the past few years and, with 14.7% new dwellings in the Montreal area, 2004 was no exception. A major invest-ment in an advertising campaign promoting a new corporate image was no doubt partially responsible for this success.
In spite of the pressures the significant number of new customers placed on the organization in 2004, the new customer satisfactionrate of 91% this year is in line with previous years.
The results of the organizational performance survey based on an external audit in 2004 show that the Partnership is making substantialprogress in its pursuit of excellence, an initiative that involves employees and their unions. The impact is being felt of the investmentsmade in work organization, management, training and the enterprise resource planning (ERP) system.
FINANCIAL RESULTS ANALYSISDISTRIBUTION SECTOR
The Partnership benefits from a revenue normalization mechanism that is a function of normal temperatures for the distribution of naturalgas in Quebec. Gaz Métro normalizes deliveries (for temperatures) and reflects the adjustment in its revenues through rate stabilizationaccounts. During the 2003 and 2004 fiscal years, temperatures were colder than normal, which resulted in changes of $11.7 million in2003 and $2.3 million in 2004 in the stabilization accounts in Quebec. The regulatory mechanism provides that the Partnership will adjustits annual rates to return these amounts to customers over a period of five years, starting in the second subsequent year.
As already explained, because the Partnership’s revenues reflect its cost of purchasing the natural gas sold by the Distribution Sector, thishas no impact on Gaz Métro’s results in Quebec and analyzing revenues does not provide a clear picture of the evolution of the Sector’s activities.
MANAGEMENT’S DISCUSSION
AND ANALYSISLONG-TERMDEBT(in millions of dollars)
1,24
1
02
1,28
9
03
1,20
9
04
DISTRIBUTIONS PAID PER UNIT(in dollars)
1.28
02
1.34
03
1.36
04
OPERATING CASH FLOWS BEFORE WORKING CAPITAL
(in millions of dollars)
286
0235
603
351
04
IND
US
TRIA
L
CONSOLIDATED NORMALIZED VOLUMES(millions of cubic metres)
3,07
1
03
3,12
0
04
CO
MM
ER
CIA
L
1,90
5
03
1,91
7
04
RE
SID
EN
TIA
L
741
03
752
04
TOTA
L V
OL
UM
E
5,71
7
03
5,78
9
04

34 G A Z M É T R O L I M I T E D P A R T N E R S H I P
2 0 0 4 A N N U A L R E P O R T
Gross margin provides a clearer picture of how the Sector is doing. It is up by $2.2 million, or 0.4%, to $487.9 million in 2004 from $485.7 million the preceding year. Apart from the 1.3% increase in normalized volumes, this can be explained primarily by the increasein the rate of return authorized by the Régie on Partners’ equity allocated to the Quebec distribution activity from 10.34% in 2003to 10.96% in 2004, partially offset by the 2% decrease in the federal income tax rate, which had a negative impact of approximately $4.1 million.
In 2004, the Quebec distribution activity earned $14.0 million ($13.2 million in 2003) more than the return authorized by the Régie. Underthe terms of the performance incentive sharing mechanism, the Partnership therefore included in revenues for the year its $4.7 million($4.4 million in 2003) share as an incentive return and will return the balance to customers in the 2006 fiscal year, primarily in the form of rate reductions.
Operations and maintenance expenses for the Distribution Sector increased by $4.5 million, or 2.9%, to $158.9 million. This can beexplained primarily by amounts spent on the advertising campaign launched in the fall of 2003 as well as a larger contribution to oneof Gaz Métro’s employee pension plans.
Amortization related to fixed assets and deferred charges is down by $4.2 million in 2004, compared to 2003, to $114.8 million. The decreaseis due to the mechanism for returning to customers their share of the excess returns earned by the Partnership in prior years. Gaz Métropresents the amount it has to return to customers in a particular year as a reduction of amortization expense. The amount to be returnedin 2004 is higher than in 2003.
Interest expense is up by $5.2 million, primarily due to an increase in the average debt load of the Quebec distribution activity in 2004,as well as an increase in the weighted average cost of this debt over the preceding year.
Partners’ income from the Distribution Sector’s activities is $137.7 million, which is slightly less than the $138.0 million for the precedingyear. The stronger Canadian dollar in relation to its U.S. counterpart in 2004 had a negative effect on the Sector’s income as part of thedistribution activities are in U.S. dollars. Had it not been for the foreign exchange impact, income would have been $0.9 million higher in 2004.
TRANSPORTATION SECTOR
On November 17, 2003, the Partnership increased its investment interest in PNGTS from 26.9% to 38.3% for $26.1 million (US$19.9 million)cash. Since that time, Gaz Métro no longer jointly controls the activities of PNGTS because another partner (TCPL Portland Inc.) now owns61.7%, which gives it control under the terms of the Partnership Agreement. The change in control required a change in the method ofaccounting for Gaz Métro’s investment in PNGTS, which resulted in the removal of Gaz Métro’s share of PNGTS’ assets and liabilities andthe transfer of the net value of the investment interest to “Investments and other” in the balance sheet. The share of PNGTS’ revenuesand expenses is now presented under “Share of income of companies subject to significant influence” in the Statement of Income. However,income taxes on the share of PNGTS’ income continue to be shown separately by Gaz Métro, since these expenses are recorded in NorthernNew England Gas Corporation (NNEG), a wholly-owned subsidiary of Gaz Métro. The change in accounting method reduced the amountshown for certain items as follows–Property, plant and equipment–$158.6 million; Long-term debt–$97.8 million; Deferred charges–$8.6 million; Cash–$4.6 million; and other net working capital items of $3.2 million. These reductions were offset by a $70.8 millionincrease in Investments.
In our view, given these circumstances, a comparison of each of the items in the Transportation Sector with the preceding year is neithermeaningful nor useful, as the differences are mainly attributable to the aforementioned situation.
MANAGEMENT’S DISCUSSION AND ANALYSIS

35G A Z M É T R O L I M I T E D P A R T N E R S H I P
2 0 0 4 A N N U A L R E P O R T
However, as explained under Performance Summary, the $5.9 million increase in the Transportation Sector’s $22.5 million contributionto income in 2004 is primarily due to the increase in Gaz Métro’s investment interest in PNGTS. Had it not been for the impact of theexchange rate, income would have been $1.3 million higher in 2004.
ENERGY SERVICES AND OTHER SECTOR
Revenues of the Energy Services and Other Sector are up by 12.0%, or $7.3 million, to $68.2 million. This can be explained primarily bythe increase in Gaz Métro’s investments over the past 16 months in its subsidiaries in the water and wastewater areas (Aqua Data Inc.and Aqua-Rehab Inc. Group). Gaz Métro used to hold a 50% interest in these companies, which are now wholly-owned by the Partnership.
Gross margin is up by $0.8 million to $22.2 million for the same reasons.
Operations and maintenance expenses are nevertheless down by $2.1 million to $13.7 million. The decrease can be explained by thesubstantial restructuring costs in 2003.
There was a significant improvement in overall profitability. The contribution to Partners’ income is $2.8 million in 2004, compared to aloss of $0.2 million in the previous year. As already explained, this improvement is attributable to the restructuring costs incurred the yearbefore and an increase in the income of Gaz Métropolitain Plus Limited Partnership.
UNALLOCATED EXPENSES
Net expenses not allocated to a particular Sector are composed primarily of development costs incurred by Gaz Métro, which are $1.5 millionhigher in 2004 than last year. This increase can be explained by our share of the amounts invested in Rabaska during the year.
Expenses incurred to date ($2.8 million) on the project are on budget and were fully written off in 2004. Gaz Métro will continue to followthis policy until it has reasonable assurance the project will generate future benefits. Reasonable assurance, which was originallyexpected to be achieved within the next 24 months when the required permits had been obtained, might be delayed due to the complicationssurrounding the site selection. Notwithstanding the potential costs related to this problem, the additional expenses required beforeachieving this assurance are estimated to be approximately $7.0 million, spread over two years. Whether this money will actually bespent will depend on how events unfold.
INCOME TAXES
Partners’ income for a limited partnership does not take account of income taxes, which have to be paid by each Partner. Accordingly,consolidated expenses reflect income taxes of the subsidiaries and companies subject to significant influence of Gaz Métro that areincorporated entities.
LIQUIDITY AND CAPITAL STRUCTUREThis section discusses financial position, cash flows and liquidity.
2004 HIGHLIGHTS
At the end of the 2004 fiscal year, Gaz Métro had:generated cash flows from operating activities, before non-cash working capital items, of $350.7 million;a debt load of $1,237.5 million;a debt/invested capital ratio of 58.3%; andthrough its General Partner, Gaz Métro inc., maintained its credit ratings.
MANAGEMENT’S DISCUSSION
AND ANALYSIS

36 G A Z M É T R O L I M I T E D P A R T N E R S H I P
2 0 0 4 A N N U A L R E P O R T
CASH FLOW SUMMARY 2004 2003
Cash flows related to operating activities, before change
in non-cash working capital items $ 350.7 $356.3
Purchases of property, plant and equipment (124.4) (105.7)
Deferred charges (65.9) (129.7)
Distributions to Partners (154.3) (148.0)
6.1 (27.1)
Other investing activities (31.9) (25.6)
Unit issues 10.6 66.7
Other financing activities 22.0 42.4
Change in non-cash working capital items (9.8) (57.3)
Decrease in cash and cash equivalents $ (3.0) $ (0.9)
CASH FLOWS FROM OPERATING ACTIVITIES
Cash flows from operating activities, before non-cash working capital items are down by $5.6 million from the preceding year. The decrease can be explained by a colder winter in 2003 than in 2004, which, as can be seen from the evolution of the rate stabilizationaccounts, results in more surplus funds to be returned to customers last year.
ACQUISITIONS OF PROPERTY, PLANT AND EQUIPMENT
The level of capital expenditures is primarily a reflection of extensions and improvements to the gas distribution system in Quebec. They amounted to $124.4 million in 2004, $18.7 million more than in 2003. The increase can be explained primarily by higher expenditureson the development of the distribution system in 2004 as well as the fact no government subsidies were received during the year ($9.5 million in 2003).
DEFERRED CHARGES
Amounts of $65.9 million invested in deferred charges during the 2004 fiscal year are primarily composed of natural gas-related costs($28.4 million) that are recoverable over the next 12 months, subsidies paid to Gaz Métro customers to convert their equipment to naturalgas and information technology development. In 2003, they totalled $129.7 million, primarily for the same uses, including $94.1 millionfor natural gas-related costs.
DEFERRED CHARGES Normalization Increase Reduction AmortizationAt the rate stab. deferred charges related deferred Non-cash
beginning accounts charges to natural gas charges adjustments At the end
Rate stabilization accounts $ 76.1 $(2.3) $ – $ – $(29.2) $ – $ 44.6Development of information technology 59.7 – 10.3 – (9.7) 0.1 60.4Expenses related to natural gas costs 71.2 – 28.4 (53.1) (0.1) (0.2) 46.2Financing costs 15.1 – 2.9 – (2.3) (8.7) (1) 7.0Expenses related to
financial instruments – – – – – (110.0) (2) (110.0)Customer share in overearnings (20.0) – (7.1) – 13.8 – (13.3)Natural gas conversion grants 62.6 – 21.1 – (10.7) (0.3) 72.7Other 15.8 – 10.3 – (6.6) (0.1) 19.4
$280.5 $(2.3) $65.9 $(53.1) $(44.8) $(119.2) $ 127.0
(1) Including removal of share of PNGTS’ deferred charges of $8.6 million.(2) Net impact of recording financial instruments related to distribution activities in Quebec, in 2004.
MANAGEMENT’S DISCUSSION AND ANALYSIS

37G A Z M É T R O L I M I T E D P A R T N E R S H I P
2 0 0 4 A N N U A L R E P O R T
PARTNER DISTRIBUTIONS
In keeping with its policy of distributing virtually all of its income, Gaz Métro distributed 96.2% of its income, i.e. $154.3 million, to itsPartners in 2004, compared to 96.5%, or $148.0 million, last year. This is an annual distribution of $1.36 per unit in 2004, compared to$1.34 in 2003, an increase of 1.5%. The Partnership expects to be able to maintain the amount of the distribution per unit during the2005 fiscal year.
OTHER INVESTING ACTIVITIES
As has already been indicated, the largest portion of the other investments relates to the increase of Gaz Métro’s investment interestin PNGTS on November 17, 2003 when it paid $26.1 million (US$19.9 million) cash to increase its ownership from 26.9% to 38.3%.
CAPITAL STRUCTURE 2004 2003
Short-term debt $ 28.5 $ 30.8
Debt maturing within one year 46.2 16.7
Long-term debt 1,162.8 1,271.9
Total debt 1,237.5 1,319.4
Partners’ equity 884.9 876.0
Total capitalization $2,122.4 $2,195.4
Debt/invested capital ratio 58.3% 60.1%
Debt decreased by a net amount of $81.9 million from the previous year’s level to $1,237.5 million, primarily due to:a $125.0 million first mortgage bond issue on October 31, 2003;the removal of Gaz Métro’s $97.8 million share of PNGTS’ debt on November 17, 2003, as previously explained; andrepayments of the term loan, bank borrowings and other long-term debt in the amounts of $96.3 million, $2.3 million and $4.5 million respectively.
Partners’ equity increased by $8.9 million in 2004 to $884.9 million, primarily due to:Partners’ income that was $6.0 million higher than distributions paid;a net $10.0 million issue of units on October 21, 2003 to the underwriters of the September 30, 2003 unit issue;stock options exercised during the year for $0.6 million; anda $7.7 million reduction in Partners’ equity as a result of a translation adjustment of Gaz Métro’s U.S. dollar investments in subsidiaries.
DEBT/INVESTED CAPITAL RATIO
The debt/invested capital ratio was 58.3% as at September 30, 2004, compared to 60.1% at the same date the previous year. This improvement reflects a net reduction in debt and an increase in Partners’ equity.
CREDIT RATINGS
The Partnership continues to get good credit terms and conditions due to the fact that it was able to maintain its favourable credit ratingsin 2004, as shown in the following table.
CREDIT RATINGS 2004 2003
Long-term bonds (S&P/DBRS) (1) A/A A/A
Commercial paper (S&P/DBRS) (1) A-1(low)/R-1(low) A-1(low)/R-1(low)
Stability of distributions (S&P/DBRS) SR-1/STA-1(low) SR-1/STA-1(low)
(1) Through its General Partner, Gaz Métro inc.
MANAGEMENT’S DISCUSSION
AND ANALYSIS

38 G A Z M É T R O L I M I T E D P A R T N E R S H I P
2 0 0 4 A N N U A L R E P O R T
CASH AND FINANCING REQUIREMENTS
In 2005, the Partnership expects to require funds to finance:capital expenditures, which, in the normal course of business, could be between $140.0 million and $160.0 million in 2005;the current portion of long-term debt, including first mortgage bonds of $42.5 million; andworking capital requirements.
Financing is expected to come from:cash flows relating to operating activities;credit lines currently available for new capital expenditures and working capital; andlong-term financing to cover the $42.5 million first mortgage bond repayment due in 2005.
As Gaz Métro’s policy is to distribute virtually all of its income, it has to turn to the capital markets to raise any financing it needs for majorinvestment projects that are not part of its ongoing business requirements. In these cases, the Partnership usually issues debt and/oradditional units in order to maintain to the extent possible an average capital structure of 56% debt and 44% equity (initiated directly byGaz Métro) as authorized by the Régie. On a consolidated basis, the Partnership strives to keep its debt/invested capital ratio below 60%.Normally, Gaz Métro does not have any problem in raising financing, nor does it expect any problem in this regard in the future.
UNUSED CREDIT FACILITIES
The Partnership has bank loans totalling $374.7 million and various operating credit lines totalling $195.3 million to finance currentactivities. As at September 30, 2004, borrowings under these facilities are $256.2 million.
OFF-BALANCE SHEET ARRANGEMENTS
Securitization Program
The Partnership has signed an agreement for the regular transfer of receivables to a securitization trust. The $85.0 million maximumauthorized was negotiated with the financial institution, which has no recourse against the Partnership in the event debtors fail to payamounts owing when due. As at September 30, 2004, the amount of the receivables transferred, net of the subordinated rights retainedby Gaz Métro, amounts to $42.5 million.
Guarantees
Gaz Métro is not authorized by the Régie to give guarantees in the normal course of business to counter parties in order to minimizethe potential risks under these agreements. The Partnership has therefore not paid anything under these agreements in the past and doesnot expect to do so in the future.
Commitments
The following table presents a summary, as at September 30, 2004, of the commitments for the next five years and thereafter.
COMMITMENTS 2005 2006 2007 2008 2009 After Total
First mortgage bonds $45.5 $27.0 $75.0 $ – $150.0 $675.0 $ 972.5
Capital leases 0.4 1.0 – – – – 1.4
Term loans – 41.3 7.0 – – 166.0 214.3
Other long-term debt 0.3 0.2 0.1 – – 20.1 20.7
46.2 69.5 82.1 – 150.0 861.1 1,208.9
Operating leases 1.0 0.9 0.7 0.6 0.6 2.7 6.5
TOTAL $47.2 $70.4 $82.8 $0.6 $150.6 $863.8 $1,215.4
MANAGEMENT’S DISCUSSION AND ANALYSIS

39G A Z M É T R O L I M I T E D P A R T N E R S H I P
2 0 0 4 A N N U A L R E P O R T
The Partnership’s policy is to fix the rate on approximately 75% of its long-term debt and leave the balance at floating rates. As at September 30, 2004, 82% of long-term debt is at fixed rates.
In addition to the aforementioned commitments, the Partnership has signed supply, transportation and storage contracts for periodsup to March 2013. The costs relating to these contracts will be included in rates in the corresponding periods.
FINANCIAL INSTRUMENTS
The Partnership uses derivative financial instruments to reduce or eliminate the risk inherent in certain transactions that arise in the normalcourse of business. These inherent risks arise from fluctuations in natural gas prices, and interest and exchange rates. Gaz Métro doesnot hold or use derivative financial instruments for speculative purposes and only concludes hedge transactions with major financialinstitutions that meet its credit evaluation standards.
Gaz Métro mainly uses derivative financial instruments to manage its exposure to the volatility of natural gas prices for system gascustomers. The Partnership has to respect temporal, volumetric and financial limits approved by the Régie in connection with its Quebecdistribution activities, or by management for other activities. Gains or losses attributable to these instruments for Gaz Métro’s system gasare included in the costs related to the supply of gas as these costs are recognized. These costs are reimbursed or recovered throughthe supply rate in accordance with the method approved by the Régie.
As at September 30, 2004, the total fair value of the instruments held by the Partnership was $122.6 million, of which $110.0 millionis reflected in the balance sheet of Gaz Métro. This portion constitutes the value of the instruments related to the Quebec distributionactivities for which the Partnership does not use hedge accounting and which are, therefore, recorded in the balance sheet.
OUTSTANDING UNITS
As at September 30, 2004, consolidated Partners’ equity includes 114.5 million units issued for $895.5 million.
RISKSThis section describes the main general risks likely to affect the results and financial condition of Gaz Métro.
Economy and Markets
Gaz Métro’s activities are affected by general economic conditions. A poor economy will have a negative impact on demand by its industrialand commercial customers, and therefore the demand for natural gas. A significant reduction in demand at a time when it is increasinglydifficult to reduce expenses relating to the Quebec distribution activity would push rates up and could therefore adversely affect thePartnership’s competitiveness.
Regulation
Decisions rendered by regulatory bodies, and in particular, because of the importance of the distribution activity in Quebec, those renderedby the Régie with respect to rates and the authorized return on Partner’s equity allocated to those activities, can affect Gaz Métro’s financialresults. However, the Partnership operates within a regulatory framework that has been established for the next five years, whichreduces this risk substantially.
Gas Supply
Gaz Métro depends on various suppliers, including carriers and storage operators among others, for its natural gas supply, whichcomes primarily from western Canada. The failure of one of these parties to deliver the commodity and supply the services could havea negative impact on the Partnership.
MANAGEMENT’S DISCUSSION
AND ANALYSIS
40 G A Z M É T R O L I M I T E D P A R T N E R S H I P
2 0 0 4 A N N U A L R E P O R T
Competition
Gaz Métro’s ability to achieve sound financial results is dependent on the competitiveness of natural gas in relation to other energy sources,such as fuel oil and electricity. In Quebec, electricity has the largest share of the residential market but natural gas and fuel oil are equallycompetitive when high-quality modern equipment is used. In the commercial sector, natural gas is generally competitive. The large industrialinterruptible service market currently prefers heavy fuel oil. For firm service, i.e. when energy is required for industrial processes, largecompanies generally select natural gas, because it is easier to use and respects the environment.
Financing and Control of Subsidiaries
Gaz Métro finances the development of certain subsidiaries and companies subject to significant influence, even though it does nothave to. If the Partnership were to discontinue financing one of these enterprises and the enterprise did not have alternative financing,it could have a negative impact on the value of these investments and, therefore, on the Partnership’s results.
Continuity of Activities
Ensuring the distribution activity’s operations are not interrupted depends on the ability to protect the gas distribution systems andequipment, and the information stored in data centres from damage due to fire, natural disasters, power outages, break-ins, computerviruses, acts of war or terrorism and other similar situations. Any one of these events could interrupt service at any time, with repercussionson customers and operating results.
RECENT ACCOUNTING CHANGESNote 3 to the consolidated financial changes provides details of the accounting policies adopted in 2004 as a result of the following newaccounting standards:
impairment of long-lived assets;hedging relationships; andgenerally accepted accounting principles.
Hedging Relationships
Prior to 2004, the fair value of the financial instruments used in connection with Gaz Métro’s Quebec distribution activities was presentedin the notes to the financial statements, not in the balance sheet.
On October 1, 2003, the Partnership adopted the accounting method in a new Accounting Guideline dealing with hedging relationshipsand started to record the fair value of financial instruments used in connection with the Quebec distribution activity in the balance sheet.The related consideration is included in deferred charges in accordance with the regulatory treatment for such items and therefore hasno impact on Partners’ income.
As at September 30, 2004, this meant:assets include financial instruments having a value of $112.0 million;liabilities include financial instruments having a value of $(2.0) million; anddeferred charges have been reduced by a credit of $(110.0) million.
Regulatory Accounting
The Canadian Institute of Chartered Accountants is in the process of considering more specific rules for the presentation, disclosure andother matters for, in particular, rate-regulated enterprises like Gaz Métro. The Partnership does not expect any new standards wouldhave a significant impact on its financial statements.
ADDITIONAL INFORMATION RELATED PARTY TRANSACTIONS
During the year, in the normal course of business, the Partnership paid gas storage costs totalling $18.1 million to a company ownedby two enterprises, one of which is an ultimate shareholder of Gaz Métro inc. These transactions were authorized by the Régie and theamounts paid were determined in accordance with the terms of the contracts signed by the parties establishing the value of the servicesrendered at the exchange amount.
MANAGEMENT’S DISCUSSION AND ANALYSIS

41G A Z M É T R O L I M I T E D P A R T N E R S H I P
2 0 0 4 A N N U A L R E P O R T
LAWSUITS
The Partnership is cited in claims and lawsuits in the normal course of its activities. In the opinion of management, these claims andlawsuits are, for the most part, covered by appropriate insurance coverage and the overall amount of the contingent liability is not material.
VGS, the subsidiary of NNEG, has been cited in a lawsuit, jointly with others, as being potentially responsible for polluting substanceson land it once owned for a brief period of time during the 1960s. The investigation by the U.S. Environmental Protection Agency hasnot been completed and NNEG is unable to predict the outcome of the lawsuit at this time. In the event a claim arises, an applicationwill be filed with the Vermont regulatory body to recover this amount through the rates of VGS. Moreover, an agreement was reached,in 1994, between NNEG and a third party limiting the maximum amount payable by NNEG. In the opinion of management, any costsresulting from this claim would not be significant for the Partnership.
Upon completion of the construction of the TQM pipeline extension to the U.S. border, the project manager lodged a claim against TQM forreimbursement of the contractor’s cost overruns. He also registered a legal hypothec on TQM’s pipeline, the result of which depends onthe merits of the claim and the non-payment of the debt by TQM. The arbitrator evaluating the merits and quantum of the claim rendereda decision in September 2004 stating that TQM had to pay $10.6 million to the project manager. As at September 30, 2004, TQM thereforerecorded a liability and a deferred charge because of the probability it will receive the approval of the National Energy Board to recoverthese costs through its rates in the future. The project manager has 90 days from the date of the decision, i.e. until December 21, 2004,to appeal. GMLP does not expect the outcome of this matter will have a significant impact on TQM’s profitability or on the Partnership’soverall financial situation.
HIGHLIGHTS OF QUARTERLY RESULTS
QUARTERLY CONSOLIDATED FINANCIAL INFORMATION (1) (2) 2004Years ended September 30, 1st 2nd 3rd 4th Year
Revenues $ 525 $ 712 $ 313 $ 233 $1,783Gross margin $ 172 $ 204 $ 108 $ 71 $ 555Partners’ income $ 72 $ 107 $ 9 $ (28) $ 160Basic and diluted Partners’ income
per unit (in dollars) $ 0.63 $ 0.93 $ 0.08 $ (0.24) $ 1.40Distributions paid (in dollars) $ 0.34 $ 0.34 $ 0.34 $ 0.34 $ 1.36Partners’ equity per unit (in dollars) $ 8.00 $ 8.61 $ 8.37 $ 7.73 $ 7.73Market prices on Toronto Stock
Exchange (in dollars):
High $22.25 $22.73 $21.23 $22.08 $22.73Low $20.15 $20.62 $19.40 $20.99 $19.40Close $22.20 $21.25 $21.00 $21.04 $21.04
Number of outstanding units (in millions) 114.5 114.5 114.5 114.5 114.5
20031st 2nd 3rd 4th Year
Revenues $ 502 $ 704 $ 335 $ 216 $ 1,757
Gross margin $ 172 $ 207 $ 111 $ 79 $ 569
Partners’ income $ 71 $ 100 $ 9 $ (27) $ 153
Basic and diluted Partners’ income
per unit (in dollars) $ 0.64 $ 0.91 $ 0.08 $ (0.24) $ 1.39
Distributions paid (in dollars) $ 0.32 $ 0.34 $ 0.34 $ 0.34 $ 1.34
Partners’ equity per unit (in dollars) $ 7.76 $ 8.25 $ 7.91 $ 7.69 $ 7.69
Market prices on Toronto Stock
Exchange (in dollars):
High $ 19.05 $ 19.05 $19.70 $ 20.86 $20.86
Low $ 17.50 $ 17.94 $17.95 $ 19.62 $17.50
Close $ 18.95 $ 18.04 $19.56 $ 20.28 $20.28
Number of outstanding units (in millions) 110.5 110.5 110.5 113.9 113.9
(1) Unaudited quarterly data.(2) Seasonal temperature fluctuations affect GMLP’s quarterly financial results, as the following charts show.
MANAGEMENT’S DISCUSSION
AND ANALYSIS

42 G A Z M É T R O L I M I T E D P A R T N E R S H I P
2 0 0 4 A N N U A L R E P O R T
OUTLOOK
The challenge for the current and future years will be to continue the profitable development of the distribution activity in Quebec byincreasing the customer base in the commercial and residential markets, controlling costs and ensuring the gas system is safe and reliable.Financial results are heavily dependent on the state of the economy and the demand for natural gas. In Vermont, where natural gas ismuch less expensive than electricity and the competition comes from fuel oil, VGS expects to continue to grow.
The Partnership does not foresee any major issues in the transportation sector next year. In the energy services sector, Gaz MétropolitainPlus will continue its efforts to improve profitability by consolidating activities and increasing sales.
Gaz Métro will continue to look for investment opportunities in the energy and infrastructures sectors that will enable it to increase itsprofitability without affecting its risk profile.
MANAGEMENT’S DISCUSSION AND ANALYSIS
T H I S M A N A G E M E N T ’ S D I S C U S S I O N A N D A N A LY S I S H A S B E E N P R E PA R E D A S O F N O V E M B E R 1 5 , 2 0 0 4 . A D D I T I O N A L I N FO R M AT I O N A B O U TG A Z M É T R O L I M I T E D P A R T N E R S H I P , I N C L U D I N G I T S A U D I T E D C O N S O L I D AT E D F I N A N C I A L S TAT E M E N T S F O R T H E F I S C A L Y E A R E N D E D S E P T E M B E R 3 0 , 2 0 0 4 , A N D E V E N T U A L LY I T S 2 0 0 4 A N N U A L I N FO R M AT I O N FO R M , C A N B E FO U N D O N S E D A R AT W W W. S E D A R . C O M
PARTNERS’ INCOME(millions of dollars)
72
1st 2nd 3rd 4th
71 107
100 9 9
(28)
(27)
Quarter
20042003YTD 2004YTD 2003
179 18
8
160
153
180
171
72 71
PARTNERS’ INCOME PER UNIT(In dollars)
0.63
1st 2nd 3rd 4th
0.64
0.93
0.91
0.08
0.08
(0.2
4)(0
.24)
Quarter
20042003YTD 2004YTD 2003
1.56 1.
64
1.40
1.39
1.63
1.55
0.63
0.64

43G A Z M É T R O L I M I T E D P A R T N E R S H I P
2 0 0 4 A N N U A L R E P O R T
consolidated financial statements
44 management’s report
and auditors’ report
45 consolidated income
45 consolidated partners’ equity
46 consolidated balance sheets
47 consolidated cash flows
48 notes to consolidated
financial statements
67 five-year review—consolidated
operating data
68 ten-year review—consolidated
financial information
70 board of directors
72 board of directors’ statement
on corporate governance practices
75 directors and officers
76 offices
77 information for partners
FOR THE YEARS ENDED SEPTEMBER 30, 2004 AND 2003

44 G A Z M É T R O L I M I T E D P A R T N E R S H I P
2 0 0 4 A N N U A L R E P O R T
MANAGEMENT’S REPORT AND AUDITORS’ REPORT
MANAGEMENT’S REPORT
On the Consolidated Financial Statements of Gaz Métro Limited Partnership
The consolidated financial statements of Gaz Métro Limited Partnership and all of the information in this report are the responsibilityof the management of Gaz Métro inc., acting in its capacity as General Partner of Gaz Métro Limited Partnership. It is management’sresponsibility to select the appropriate accounting policies and to exercise its best judgement in determining reasonable and fairestimates based on Canadian generally accepted accounting principles and decisions from the Régie de l’énergie with respect to thenatural gas distribution activity in Quebec. Financial information found elsewhere in this report is consistent with the consolidated financialstatements. This information and the consolidated financial statements are published with the Board of Directors’ approval.
Management maintains accounting and internal control systems that are designed to provide reasonable assurance that accounting recordsare reliable and assets are safeguarded.
The Board of Directors assumes its responsibilities for the financial statements primarily through the Audit Committee, made up solelyof outside directors. The Audit Committee has reviewed all of the information in this report as well as the annual financial statements andhas recommended they be approved by the Board. The Audit Committee also examines on a continuous basis the quarterly financial results,the results of internal and external audits of accounting methods and the system of internal controls. The Audit Committee also recommendsto the Board the choice of external auditors. The external and internal auditors are free to communicate with the Audit Committee.
The firm of Raymond Chabot Grant Thornton LLP, Chartered Accountants, has been given the mandate to audit the consolidated financialstatements of Gaz Métro Limited Partnership in accordance with Canadian generally accepted auditing standards. Their audit includedthe tests and other procedures they deemed necessary under the circumstances. Their independent opinion on the financial statementsis presented hereinafter.
ROBERT TESSIER PIERRE DESPARS, CAPresident and Chief Executive Officer Vice President, Finance and Corporate Affairs
Gaz Métro inc. Gaz Métro inc.
Montréal, Canada
November 15, 2004
AUDITORS’ REPORT
To the Partners of Gaz Métro Limited Partnership
We have audited the consolidated balance sheets of Gaz Métro Limited Partnership as at September 30, 2004 and 2003, and the consolidated statements of income, Partners’ equity and consolidated cash flows for the years then ended. These financial statementsare the responsibility of the management of Gaz Métro inc., acting in its capacity as General Partner of the Partnership. Our responsibilityis to express an opinion on these financial statements based on our audits.
We conducted our audits in accordance with Canadian generally accepted auditing standards. Those standards require that we plan and perform an audit to obtain reasonable assurance whether the financial statements are free of material misstatement. An audit includesexamining, on a test basis, evidence supporting the amounts and disclosures in the financial statements. An audit also includesassessing the accounting principles used and significant estimates made by management, as well as evaluating the overall financialstatement presentation.
In our opinion, these consolidated financial statements present fairly, in all material respects, the financial position of the Partnershipas at September 30, 2004 and 2003, and the results of its operations and its cash flows for the years then ended in accordance withCanadian generally accepted accounting principles.
RAYMOND CHABOT GRANT THORNTON LLPChartered Accountants
Montréal, Canada
November 15, 2004
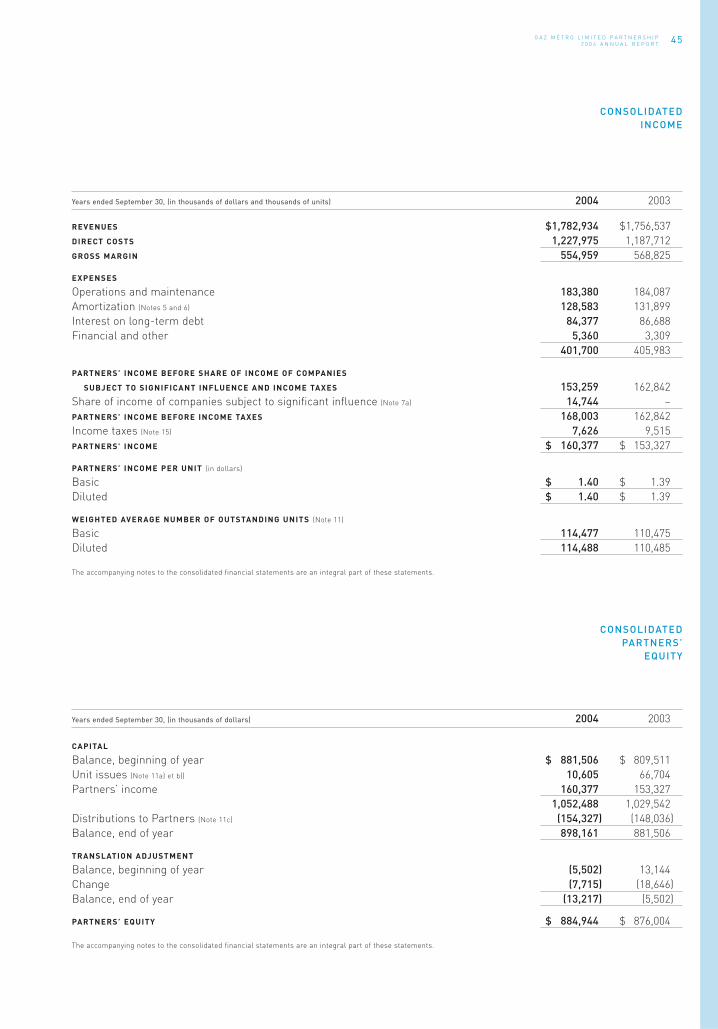
45G A Z M É T R O L I M I T E D P A R T N E R S H I P
2 0 0 4 A N N U A L R E P O R T
Years ended September 30, (in thousands of dollars) 2004 2003
CAPITAL
Balance, beginning of year $ 881,506 $ 809,511
Unit issues (Note 11a) et b)) 10,605 66,704
Partners’ income 160,377 153,327
1,052,488 1,029,542
Distributions to Partners (Note 11c) (154,327) (148,036)
Balance, end of year 898,161 881,506
TRANSLATION ADJUSTMENT
Balance, beginning of year (5,502) 13,144
Change (7,715) (18,646)
Balance, end of year (13,217) (5,502)
PARTNERS’ EQUITY $ 884,944 $ 876,004
The accompanying notes to the consolidated financial statements are an integral part of these statements.
CONSOLIDATED INCOME
CONSOLIDATED PARTNERS’
EQUITY
Years ended September 30, (in thousands of dollars and thousands of units) 2004 2003
REVENUES $1,782,934 $1,756,537
DIRECT COSTS 1,227,975 1,187,712
GROSS MARGIN 554,959 568,825
EXPENSES
Operations and maintenance 183,380 184,087
Amortization (Notes 5 and 6) 128,583 131,899
Interest on long-term debt 84,377 86,688
Financial and other 5,360 3,309
401,700 405,983
PARTNERS’ INCOME BEFORE SHARE OF INCOME OF COMPANIES
SUBJECT TO SIGNIFICANT INFLUENCE AND INCOME TAXES 153,259 162,842
Share of income of companies subject to significant influence (Note 7a) 14,744 –
PARTNERS’ INCOME BEFORE INCOME TAXES 168,003 162,842
Income taxes (Note 15) 7,626 9,515
PARTNERS’ INCOME $ 160,377 $ 153,327
PARTNERS’ INCOME PER UNIT (in dollars)
Basic $ 1.40 $ 1.39
Diluted $ 1.40 $ 1.39
WEIGHTED AVERAGE NUMBER OF OUTSTANDING UNITS (Note 11)
Basic 114,477 110,475
Diluted 114,488 110,485
The accompanying notes to the consolidated financial statements are an integral part of these statements.
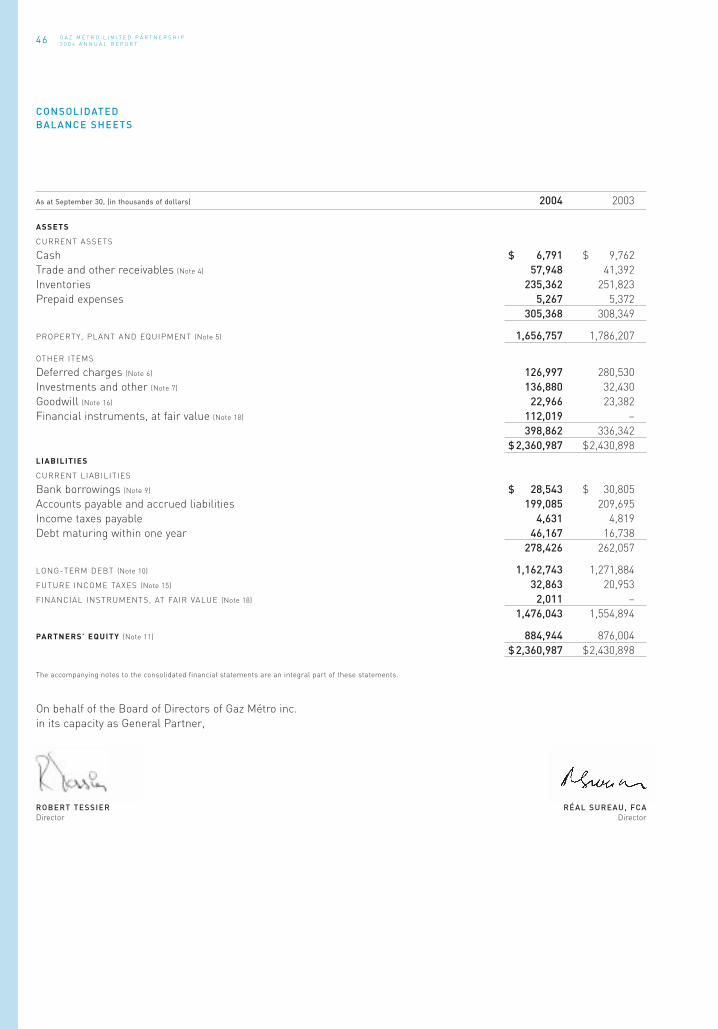
46 G A Z M É T R O L I M I T E D P A R T N E R S H I P
2 0 0 4 A N N U A L R E P O R T
As at September 30, (in thousands of dollars) 2004 2003
ASSETS
CURRENT ASSETS
Cash $ 6,791 $ 9,762
Trade and other receivables (Note 4) 57,948 41,392
Inventories 235,362 251,823
Prepaid expenses 5,267 5,372
305,368 308,349
PROPERTY, PLANT AND EQUIPMENT (Note 5) 1,656,757 1,786,207
OTHER ITEMS
Deferred charges (Note 6) 126,997 280,530
Investments and other (Note 7) 136,880 32,430
Goodwill (Note 16) 22,966 23,382
Financial instruments, at fair value (Note 18) 112,019 –
398,862 336,342
$ 2,360,987 $2,430,898
LIABILITIES
CURRENT LIABILITIES
Bank borrowings (Note 9) $ 28,543 $ 30,805
Accounts payable and accrued liabilities 199,085 209,695
Income taxes payable 4,631 4,819
Debt maturing within one year 46,167 16,738
278,426 262,057
LONG-TERM DEBT (Note 10) 1,162,743 1,271,884
FUTURE INCOME TAXES (Note 15) 32,863 20,953
FINANCIAL INSTRUMENTS, AT FAIR VALUE (Note 18) 2,011 –
1,476,043 1,554,894
PARTNERS’ EQUITY (Note 11) 884,944 876,004
$ 2,360,987 $2,430,898
The accompanying notes to the consolidated financial statements are an integral part of these statements.
On behalf of the Board of Directors of Gaz Métro inc.
in its capacity as General Partner,
ROBERT TESSIER RÉAL SUREAU, FCADirector Director
CONSOLIDATED BALANCE SHEETS

47G A Z M É T R O L I M I T E D P A R T N E R S H I P
2 0 0 4 A N N U A L R E P O R T
Years ended September 30, (in thousands of dollars) 2004 2003
OPERATING ACTIVITIES
Partners’ income $ 160,377 $ 153,327
Distributions received from a company subject to significant influence 10,849 –
Non-cash items:
Amortization of property, plant and equipment 86,091 84,468
Amortization of deferred charges and financing costs 44,787 50,370
Reduction in deferred charges related to cost of natural gas 53,148 49,291
Rate stabilization accounts 2,311 11,680
Share of income of companies subject to significant influence (14,744) –
Write-off of goodwill 409 –
Future income taxes 7,463 7,130
350,691 356,266
Change in non-cash working capital items (Note 12a) (9,790) (57,333)
CASH FLOWS RELATED TO OPERATING ACTIVITIES 340,901 298,933
INVESTING ACTIVITIES
Purchases of property, plant and equipment (124,381) (105,659)
Deferred charges (65,900) (129,737)
Investments and other 890 (8,488)
Ownership interest in companies subject
to significant influence (joint ventures in 2003) (Note 7a) (30,747) (13,853)
Acquisition of a subsidiary (Note 8 (1) ) (1,994) (3,237)
CASH FLOWS RELATED TO INVESTING ACTIVITIES (222,132) (260,974)
FINANCING ACTIVITIES
Change in bank borrowings (2,262) 738
Change in term loans (96,281) (40,318)
Other long-term debt:
Issues 125,035 86,730
Repayments (4,510) (4,655)
Unit issues 10,605 66,704
Distributions to Partners (154,327) (148,036)
CASH FLOWS RELATED TO FINANCING ACTIVITIES (121,740) (38,837)
DECREASE IN CASH AND CASH EQUIVALENTS (2,971) (878)
CASH AND CASH EQUIVALENTS, BEGINNING OF YEAR 9,762 10,640
CASH AND CASH EQUIVALENTS, END OF YEAR $ 6,791 $ 9,762
The accompanying notes to the consolidated financial statements are an integral part of these statements.
CONSOLIDATED CASH FLOWS

48 G A Z M É T R O L I M I T E D P A R T N E R S H I P
2 0 0 4 A N N U A L R E P O R T
1. CHANGE OF NAMEOn November 18, 2003, the name of Gaz Métropolitain and Company, Limited Partnership was changed to Gaz Métro Limited Partnership.
2. SUMMARY OF SIGNIFICANT ACCOUNTING POLICIESThe consolidated financial statements of Gaz Métro Limited Partnership (hereinafter the “Partnership” or “GMLP”) are prepared in accordance with Canadian generally accepted accounting principles. In preparing the consolidated financial statements, the Partnership’s management has to make estimates and assumptions that have an impact on the assets and liabilities shown in thebalance sheet, the contingent liabilities noted as at the date of the financial statements and on the revenues and expenses presentedin the Statement of Income for the year. Actual results may differ from these estimates.
PRINCIPLES OF CONSOLIDATION
The consolidated financial statements of the Partnership include the accounts of GMLP and its subsidiaries. In addition, the investmentsin joint ventures are accounted for under the proportionate consolidation method. Investments in companies subject to significantinfluence are recorded at equity value. Other investments are recorded at cost.
REGULATION
GMLP is engaged primarily in the distribution of natural gas by pipeline in Quebec, a “regulated” activity (hereinafter “GMLP-QDA”). Thedistribution rates are fixed by the Régie de l’énergie (hereinafter the “Régie”) and the system development and marketing activities aresubject to its supervision and control.
The Act respecting the Régie de l’énergie provides that the natural gas supply rate must reflect the actual acquisition cost of thedistributor as well as any other supply condition allowed by suppliers. In Decision D-95-44, the Régie approved a periodic adjustmentmechanism to the price of gas. In Decision D-90-42, the Régie approved an automatic rate adjustment mechanism, upward or downwardas necessary, that allows the distributor to reflect cost variations arising from changes to the rates of its transportation and storage servicesuppliers and to the cost of compression gas.
The Act respecting the Régie de l’énergie also provides that distribution rates are set to enable the distributor to recover the cost of providing the service, to obtain a reasonable return on the rate base recognized by the Régie and to improve its performance by providing incentives.
In Decision D-90-75 issued on December 19, 1990, as part of the corporate reorganization of August 12, 1991, the Régie determinedthat the rate of return on the rate base would be set using an “adjusted” capital structure. With this structure, Partners’ equity allocatedto the Quebec distribution activity is in the order of 46.0%, including 38.5% that is compensated on the same basis as corporatecommon shares and 7.5% on the same basis as preferred shares. For regulatory purposes, GMLP-QDA’s operating expenses include deemedcurrent income taxes, large corporations tax and capital tax. These deemed taxes are calculated as if GMLP was a taxable Canadiancorporation, notwithstanding the tax status and the tax rate of the Partners.
In addition, the Régie, in exercising its powers, renders decisions with respect to the use by GMLP-QDA of certain accounting practiceswhich differ from those otherwise applied in unregulated businesses, in particular with respect to certain deferred charges includingcertain items related to natural gas costs and the rate stabilization accounts, property, plant and equipment and their related amortization,income taxes and employee future benefits.
Finally, certain activities of subsidiaries, joint ventures and companies subject to significant influence are regulated by bodies such asthe National Energy Board (hereinafter “NEB”), the Federal Energy Regulatory Commission and the Vermont Public Service Board.
CASH AND CASH EQUIVALENTS
Cash and cash equivalents consist of cash and very liquid short-term investments with a maturity of three months or less when purchased.
INVENTORIES
Natural gas held in storage by GMLP-QDA is carried at average cost using the monthly adjustment method, approved by the Régie, whichprovides for the total cost to be charged to customers. Inventories of materials and supplies are carried at the lower of average cost andreplacement value.
NOTES TO CONSOLIDATED FINANCIAL STATEMENTS(all tabular amounts are in thousands of dollars)

49G A Z M É T R O L I M I T E D P A R T N E R S H I P
2 0 0 4 A N N U A L R E P O R T
PROPERTY, PLANT AND EQUIPMENT
Acquisitions, replacements and improvements are recorded at cost, including direct costs, general and administrative expenses and anallowance on funds used for certain construction projects as accepted by regulatory authorities. The historical cost of retired propertiesrelated to the distribution system and the retirement costs are applied against accumulated amortization when the properties are retired.Under this method, no gain or loss on disposal of assets is realized.
Amortization is calculated using mainly the straight-line method based on the residual useful lives of the existing assets. The rates areperiodically revised and approved by the Régie and include recovery of the unamortized cost of existing assets, estimates of the futurecosts of retiring the properties and the profit and loss upon disposal of properties already retired.
DEFERRED CHARGES
GMLP defers certain charges that are amortized and recovered in its rates over various periods not exceeding ten years depending onthe nature of such charges.
Pursuant to Decision D-2000-183 of the Régie with respect to the performance incentive mechanisms, GMLP-QDA includes the customers’share of a portion of overearnings in deferred charges. This amount is returned to customers in the form of a rate reduction the year afterthe regulatory report is approved by the Régie.
To mitigate the impact of significant fluctuations in gas supply rates, which must include the actual purchase cost, the Régie hasauthorized GMLP-QDA to use different mechanisms to defer the differences between actual costs, including the impact of derivatives,and anticipated supply costs billed to customers. These amounts are returned to or recovered from customers in the form of rate adjustmentsover periods of 12 to 48 months.
To alleviate the effect of unpredictable and uncontrollable factors on its operations, in particular the impact of temperature fluctuationson its revenues, GMLP-QDA is authorized by the Régie to maintain various rate stabilization accounts. Beginning in the second subsequentyear, annual fluctuations are amortized over five years and recovered in rates.
GOODWILL
Goodwill represents the excess of the cost over the net amount of the values assigned to the assets acquired and liabilities assumedwhen an enterprise is acquired. Goodwill, which is not amortized, is subject to an annual impairment test. Such tests are also performedif events have occurred or circumstances changed indicating that there may be an impairment loss. The impairment test compares thecarrying amount and the fair value of the Partnership’s reporting units. If the carrying amount of a reporting unit is greater than its fairvalue, amortization of goodwill is measured on the basis of the excess of the carrying amount of goodwill over its fair value. The fair valueof a reporting unit is calculated based on discounted cash flows or external valuations.
DEVELOPMENT ACTIVITIES
The costs related to development activities are capitalized except in cases where GMLP does not have reasonable assurance that thesecosts will be recovered in the future.
FOREIGN CURRENCY TRANSLATION
Long-term debt payable in foreign currency is translated into Canadian dollars at the rate of exchange prevailing at the balance sheet date.Gains and losses arising from translation are included in the results for the current year.
The assets and liabilities of foreign subsidiaries that are self-sustaining with respect to financing and operations are translated intoCanadian dollars at the rate of exchange prevailing at the balance sheet date. Revenues and expenses are translated at the average rateprevailing during the fiscal year. Gains and losses are shown under the caption “Translation adjustment” in the consolidated Partners’ equity.
REVENUES
Revenues are recognized when the commodities are delivered and include estimated volumes of natural gas delivered by distributorsbut not billed at the end of the year, as well as the impact of rate stabilization accounts of GMLP-QDA resulting from temperaturefluctuations. GMLP-QDA customers’ share, including the amounts transferred to the Energy Efficiency Fund, of any overearnings isdeducted from revenues.

50 G A Z M É T R O L I M I T E D P A R T N E R S H I P
2 0 0 4 A N N U A L R E P O R T
INCOME TAXES
GMLP as well as its subsidiaries and joint ventures formed as limited partnerships do not show income tax expense since under existinglegislation, it is the Partners who are taxable.
Subsidiaries and joint ventures formed as corporations use the tax liability method to record income taxes.
EMPLOYEE FUTURE BENEFITS
GMLP-QDA recognizes the costs related to pension contributions and post-employment benefits in income as the amounts are disbursedin accordance with actuarial valuations based on the most probable assumptions with respect to the forecast return on the plan’sassets, salary increases and retirement age.
GMLP’s subsidiaries and joint ventures record post-employment benefits in accordance with the accounting practices prescribed by theCanadian Institute of Chartered Accountants (hereinafter “CICA”). The pension costs for defined contribution plans correspond to the amount of the contributions. The pension costs for defined benefit plans and other post-employment benefits is determined by actuarialcalculation based on a projected benefit method prorated according to eligible years of service and is expensed as the services are renderedby the employees.
DERIVATIVE FINANCIAL INSTRUMENTS
The Partnership uses derivative financial instruments to reduce or eliminate the risk inherent in certain transactions and identifiablebalances that arise in the normal course of business. These inherent risks arise from fluctuations in natural gas prices, and interest andexchange rates. Accordingly, the Partnership uses derivative financial instruments to ensure that unfavourable variations in cash flows asa result of such transactions and balances are offset by fluctuations in the cash flows of the derivative financial instruments. The Partnershipdoes not hold or use derivative financial instruments for speculative purposes.
The Partnership uses derivative financial instruments to manage its exposure to the volatility of natural gas prices for its system gascustomers. The prices paid are based on monthly floating indices. The instruments used make it possible to fix, or define, the price of naturalgas based on temporal, volumetric and financial limits approved by the Régie for the activities of GMLP-QDA, or by management for otheractivities. The gains or losses on these instruments are included in gas supply costs as these costs are recognized. In addition, in the caseof GMLP-QDA, these costs are reimbursed or recovered through the gas supply rate in accordance with the method approved by the Régie.
The Partnership uses interest rate swaps to fix interest rates on a portion of variable rate borrowings. This results in the periodic swapof interest payments without any swap of the notional amount on which the payments are based and are recorded as an adjustment ofinterest receivable on the hedged borrowing instrument. The corresponding amount of interest payable to or receivable from counterparties is periodically included as an adjustment of accrued interest.
The Partnership also uses swaps and currency swaps to manage its exchange risk exposure with respect to certain foreign currency debtsor to protect cash flows in a foreign currency other than the measurement currency. The gains and losses attributable to these financialinstruments are deferred and recognized in income under the revenue and expense items relating to the corresponding positions coveredfor the hedge period of the items covered.
If the contracts are cancelled before the date initially designated, the gain or loss is recognized as a deferred gain or loss and recognizedover the same period as the item originally covered. All of the aforementioned financial instruments other than those of GMLP-QDA are recordedat cost (see Note 3B).
UNIT OPTION PLAN
GMLP offers a unit option plan to named executives. Since October 1, 2002, the Partnership has been recording attributions using the fair value method whereby the compensation cost is measured at the date of attribution based on its fair value and is expensed overthe period of service.
INCOME PER UNIT
Income per unit is calculated on the basis of the weighted average number of outstanding units. The treasury stock method is used todetermine the dilutive effect of outstanding unit options.
NOTES TO CONSOLIDATED FINANCIAL STATEMENTS(all tabular amounts are in thousands of dollars)
2. SUMMARY OF SIGNIFICANT ACCOUNTING POLICIES (CONTINUED)

51G A Z M É T R O L I M I T E D P A R T N E R S H I P
2 0 0 4 A N N U A L R E P O R T
3. CHANGES IN ACCOUNTING POLICIESAPPLIED IN 2004
A) IMPAIRMENT OF LONG-LIVED ASSETS
On October 1, 2003, the Partnership adopted the new recommendations in Section 3063, Impairment of Long-lived Assets, of the Handbookof the Canadian Institute of Chartered Accountants (hereinafter “CICA Handbook”). Among other things, the Section establishes the recognition, measurement and reporting standards with respect to the impairment of long-lived assets held for use. Pursuant to therecommendations, a loss of value should be recognized when the carrying amount of a long-lived asset is not recoverable and exceedsits fair value. The adoption of these recommendations did not have any impact on the financial statements of the Partnership.
B) HEDGING RELATIONSHIPS
On October 1, 2003, the Partnership adopted the new Accounting Guideline AcG-13, Hedging Relationships. Among other things, AcG-13 establishes the standards for the identification, designation, documentation and effectiveness of hedging relationships for thepurposes of hedge accounting. It also covers the discontinuance of hedge accounting and sets down the requisite conditions. Wherethe Partnership uses hedge accounting, every hedging relationship will be subject to a periodic test to reasonably determine whetherit will continue to be effective. According to the standards, any derivative instrument that does not meet the hedge accounting conditionswill be charged to income at market value. The Partnership applies hedge accounting to all of its financial instruments, except those relatedto the activities of GMLP-QDA, for which specific regulatory treatment applies.
Because hedge accounting is not applied to the derivative financial instruments of GMLP-QDA, they are recorded in the balance sheet.The related consideration (($110,008,000) as at September 30, 2004) is included in deferred charges, in accordance with the regulatorytreatment for such items (see Note 2, Deferred charges). Accordingly, there is no impact on Partners’ income.
C) GENERALLY ACCEPTED ACCOUNTING PRINCIPLES
On October 1, 2003, the Partnership adopted the new recommendations in Section 1100 of the CICA Handbook, Generally Accepted
Accounting Principle (hereinafter “GAAP”). This Section establishes standards for financial reporting in accordance with GAAP. It describes what constitutes GAAP and its sources and states that non-rate regulated entities should apply every primary source of GAAPthat deals with the accounting and reporting in financial statements of transactions or events encountered by them. Where applicable,it also requires rate-regulated entities to disclose how the accounting policies adopted by them differ from the primary sources of GAAP.The adoption of these recommendations did not have any impact on the financial statements presentation and on Partners’ income.
APPLIED IN 2003
D) STOCKED-BASED COMPENSATION AND OTHER STOCK-BASED PAYMENTS
On October 1, 2002, the Partnership adopted the new recommendations in Section 3870 of the CICA Handbook, Stock-based Compensation
and Other Stock-based Payments. Among other things, the Section establishes the recognition, measurement and reporting standardsfor stock-based compensation and other stock-based payments. It recommends a recognition method based on fair value under whichthe compensation cost should be measured at the date of attribution based on its fair value and should be recognized over the periodof service. The adoption of these recommendations did not have any impact on the financial statements of the Partnership.
E) DISCLOSURE OF GUARANTEES
In February 2003, the Partnership adopted new Accounting Guideline AcG-14, Disclosure of Guarantees, dealing with the presentationrequirements for guarantees. AcG-14 requires presentation of significant information on certain types of guarantees that provide forpayments for certain types of future events. These recommendations had no significant impact on the Partnership’s financial statements.
F) DISPOSAL OF LONG-LIVED ASSETS AND DISCONTINUED OPERATIONS
On May 1, 2003, the Partnership adopted the new recommendations in Section 3475 of the CICA Handbook, Disposal of Long-lived Assets
and Discontinued Operations. Among other things, this Section establishes the recognition, measurement and disclosure standards forthe presentation of information on the disposal of long-lived assets. The recommendations require a long-lived asset classified as heldfor sale to be valued at the lesser of its carrying amount or its fair value, net of selling costs. They also require that such assets not beamortized. Amortization estimates for long-lived assets to be disposed of other than by sale, i.e. abandoned, before the end of theirpreviously estimated useful life should be revised based on their shortened useful life. The standard also requires the results of operationsof a component of an enterprise that has been disposed of (by sale, abandonment or spin-off ) to be reported in discontinued operations.The Section also specifies the treatment for regulated activities, which corresponds to GMLP’s treatment of the activities of GMLP-QDA.The adoption of these recommendations did not have any impact on the financial statements of GMLP.
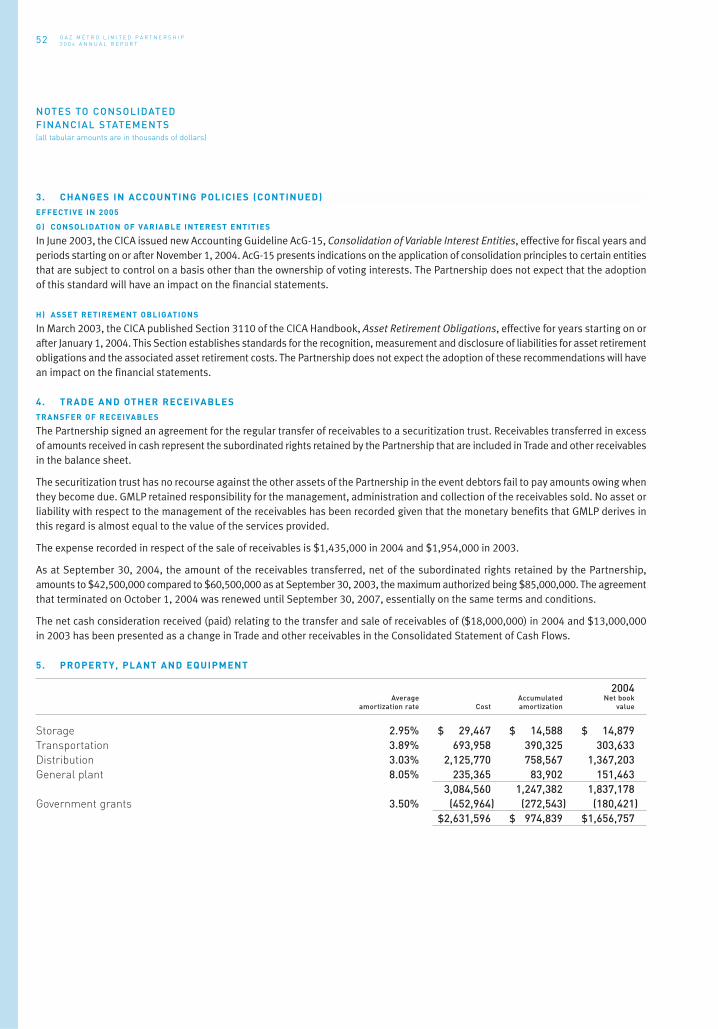
52 G A Z M É T R O L I M I T E D P A R T N E R S H I P
2 0 0 4 A N N U A L R E P O R T
EFFECTIVE IN 2005
G) CONSOLIDATION OF VARIABLE INTEREST ENTITIES
In June 2003, the CICA issued new Accounting Guideline AcG-15, Consolidation of Variable Interest Entities, effective for fiscal years andperiods starting on or after November 1, 2004. AcG-15 presents indications on the application of consolidation principles to certain entitiesthat are subject to control on a basis other than the ownership of voting interests. The Partnership does not expect that the adoptionof this standard will have an impact on the financial statements.
H) ASSET RETIREMENT OBLIGATIONS
In March 2003, the CICA published Section 3110 of the CICA Handbook, Asset Retirement Obligations, effective for years starting on orafter January 1, 2004. This Section establishes standards for the recognition, measurement and disclosure of liabilities for asset retirementobligations and the associated asset retirement costs. The Partnership does not expect the adoption of these recommendations will havean impact on the financial statements.
4. TRADE AND OTHER RECEIVABLESTRANSFER OF RECEIVABLES
The Partnership signed an agreement for the regular transfer of receivables to a securitization trust. Receivables transferred in excessof amounts received in cash represent the subordinated rights retained by the Partnership that are included in Trade and other receivablesin the balance sheet.
The securitization trust has no recourse against the other assets of the Partnership in the event debtors fail to pay amounts owing whenthey become due. GMLP retained responsibility for the management, administration and collection of the receivables sold. No asset orliability with respect to the management of the receivables has been recorded given that the monetary benefits that GMLP derives inthis regard is almost equal to the value of the services provided.
The expense recorded in respect of the sale of receivables is $1,435,000 in 2004 and $1,954,000 in 2003.
As at September 30, 2004, the amount of the receivables transferred, net of the subordinated rights retained by the Partnership,amounts to $42,500,000 compared to $60,500,000 as at September 30, 2003, the maximum authorized being $85,000,000. The agreementthat terminated on October 1, 2004 was renewed until September 30, 2007, essentially on the same terms and conditions.
The net cash consideration received (paid) relating to the transfer and sale of receivables of ($18,000,000) in 2004 and $13,000,000in 2003 has been presented as a change in Trade and other receivables in the Consolidated Statement of Cash Flows.
5. PROPERTY, PLANT AND EQUIPMENT
2004Average Accumulated Net book
amortization rate Cost amortization value
Storage 2.95% $ 29,467 $ 14,588 $ 14,879Transportation 3.89% 693,958 390,325 303,633Distribution 3.03% 2,125,770 758,567 1,367,203General plant 8.05% 235,365 83,902 151,463
3,084,560 1,247,382 1,837,178Government grants 3.50% (452,964) (272,543) (180,421)
$2,631,596 $ 974,839 $1,656,757
NOTES TO CONSOLIDATED FINANCIAL STATEMENTS(all tabular amounts are in thousands of dollars)
3. CHANGES IN ACCOUNTING POLICIES (CONTINUED)

53G A Z M É T R O L I M I T E D P A R T N E R S H I P
2 0 0 4 A N N U A L R E P O R T
2003Average Accumulated Net book
amortization rate Cost amortization value
Storage 2.79% $ 28,103 $ 13,773 $ 14,330
Transportation 3.89% 869,101 382,178 486,923
Distribution 3.07% 2,047,990 703,823 1,344,167
General plant 8.34% 225,580 88,496 137,084
3,170,774 1,188,270 1,982,504
Government grants 3.53% (452,964) (256,667) (196,297)
$ 2,717,810 $ 931,603 $ 1,786,207
Amortization is $86,091,000 in 2004 and $84,468,000 in 2003.
6. DEFERRED CHARGES
2004 2003
Rate stabilization accounts $ 44,642 $ 76,169
Development of information technology 60,439 59,700
Expenses related to natural gas costs 46,208 71,191
Financing costs 6,952 15,107
Costs related to financial instruments (Note 18) (110,008) –
GMLP-QDA overearnings (customer share) (13,275) (20,017)
Natural gas conversion grants 72,658 62,592
Other 19,381 15,788
$ 126,997 $280,530
Amortization of deferred charges is $42,492,000 in 2004 and $47,431,000 in 2003 and the amortization of financing costs included ininterest on long-term debt is $2,295,000 in 2004 and $2,939,000 in 2003. The reduction in deferred charges related to natural gas costs,including transportation and storage, is $53,148,000 in 2004 and $49,291,000 in 2003.
7. INVESTMENTS AND OTHER
2004 2003
Interest of 38.3% in a company subject to significant influence–
Portland Natural Gas Transmission System (hereinafter “PNTGS”) (a) $105,055 $ –
Cable VDN Inc.
Investment in common shares (20.6% in 2004 and 2003) 4,565 4,565
Convertible debentures (b) 13,003 13,000
Investment in preferred shares of Gaz Métropolitain Plus Inc.,
a subsidiary of Gaz Métro inc. (Note 10g) 7,396 7,396
Grants receivable in eight equal payments up to 2013 6,861 7,469
$136,880 $32,430
a) On November 17, 2003, the Partnership paid $26,096,000 (US$19,881,000) cash to increase its ownership interest in PNGTS from26.9% to 38.3%. Since that date, the Partnership no longer has joint control over the activities of PNGTS because one of its partnersnow owns 61.7%, which gives it control under the terms and conditions of the Partnership Agreement. This change in control requireda change in the method of accounting for GMLP’s investment in PNGTS, which no longer qualifies as an investment in a joint venture.Until November 17, 2003, this investment was accounted for using the proportionate consolidation method. Since that time, it isaccounted for using the equity method. As a result, the amounts shown for certain items were reduced as follows–Property, Plantand Equipment–$158.6 million; Long-term debt–$97.8 million; Deferred charges–$8.6 million; Cash–$4.6 million and other negative
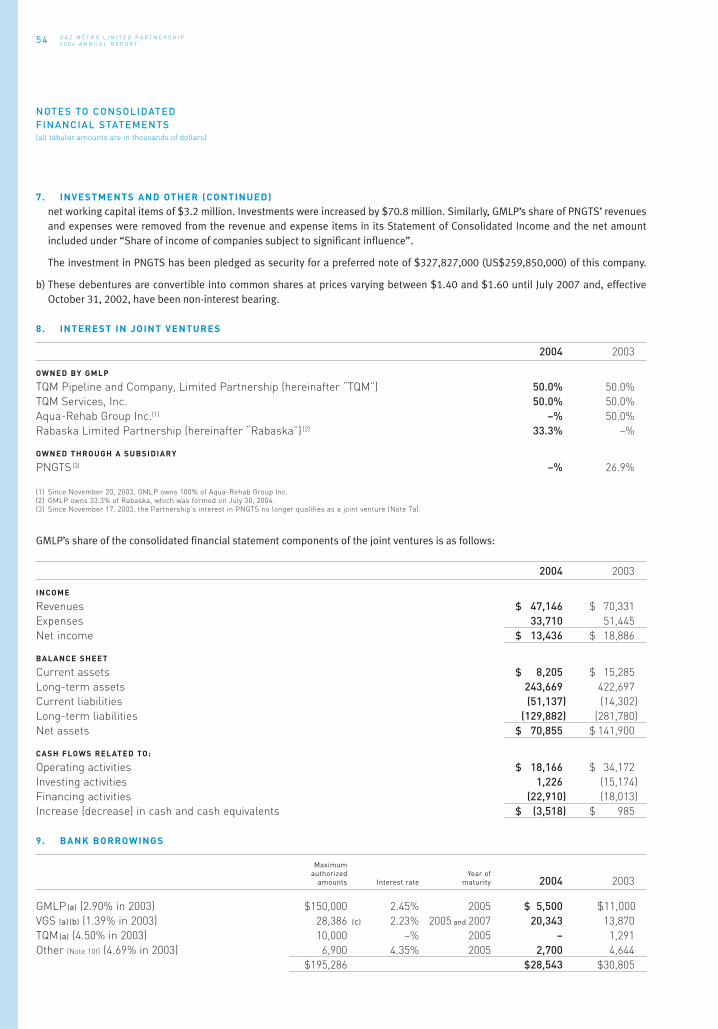
54 G A Z M É T R O L I M I T E D P A R T N E R S H I P
2 0 0 4 A N N U A L R E P O R T
net working capital items of $3.2 million. Investments were increased by $70.8 million. Similarly, GMLP’s share of PNGTS’ revenuesand expenses were removed from the revenue and expense items in its Statement of Consolidated Income and the net amountincluded under “Share of income of companies subject to significant influence”.
The investment in PNGTS has been pledged as security for a preferred note of $327,827,000 (US$259,850,000) of this company.
b) These debentures are convertible into common shares at prices varying between $1.40 and $1.60 until July 2007 and, effectiveOctober 31, 2002, have been non-interest bearing.
8. INTEREST IN JOINT VENTURES
2004 2003
OWNED BY GMLP
TQM Pipeline and Company, Limited Partnership (hereinafter “TQM”) 50.0% 50.0%
TQM Services, Inc. 50.0% 50.0%
Aqua-Rehab Group Inc.(1) –% 50.0%
Rabaska Limited Partnership (hereinafter “Rabaska”) (2) 33.3% –%
OWNED THROUGH A SUBSIDIARY
PNGTS(3) –% 26.9%
(1) Since November 20, 2003, GMLP owns 100% of Aqua-Rehab Group Inc.(2) GMLP owns 33.3% of Rabaska, which was formed on July 30, 2004.(3) Since November 17, 2003, the Partnership’s interest in PNGTS no longer qualifies as a joint venture (Note 7a).
GMLP’s share of the consolidated financial statement components of the joint ventures is as follows:
2004 2003
INCOME
Revenues $ 47,146 $ 70,331
Expenses 33,710 51,445
Net income $ 13,436 $ 18,886
BALANCE SHEET
Current assets $ 8,205 $ 15,285
Long-term assets 243,669 422,697
Current liabilities (51,137) (14,302)
Long-term liabilities (129,882) (281,780)
Net assets $ 70,855 $ 141,900
CASH FLOWS RELATED TO:
Operating activities $ 18,166 $ 34,172
Investing activities 1,226 (15,174)
Financing activities (22,910) (18,013)
Increase (decrease) in cash and cash equivalents $ (3,518) $ 985
9. BANK BORROWINGS
Maximumauthorized Year of
amounts Interest rate maturity 2004 2003
GMLP (a) (2.90% in 2003) $150,000 2.45% 2005 $ 5,500 $11,000
VGS (a) (b) (1.39% in 2003) 28,386 (c) 2.23% 2005 and 2007 20,343 13,870
TQM (a) (4.50% in 2003) 10,000 –% 2005 – 1,291
Other (Note 10f) (4.69% in 2003) 6,900 4.35% 2005 2,700 4,644
$195,286 $28,543 $30,805
NOTES TO CONSOLIDATED FINANCIAL STATEMENTS(all tabular amounts are in thousands of dollars)
7. INVESTMENTS AND OTHER (CONTINUED)

55G A Z M É T R O L I M I T E D P A R T N E R S H I P
2 0 0 4 A N N U A L R E P O R T
a) The borrowings are unsecured.
b) An interest rate swap for a portion of the authorized borrowing, i.e. $3,154,000 (US$2,500,000), fixes the rate at 3.10% from October 17, 2003 until June 30, 2007.
c) The maximum authorized amount under the short-term credit lines of Vermont Gas Systems (hereinafter “VGS”), a wholly-ownedsubsidiary of Northern New England Gas Corporation (hereinafter “NNEG”), which is in turn wholly-owned by GMLP, is US$22,500,000.
Under the terms of the various short-term credit lines, certain subsidiaries and joint ventures have to comply with certain covenantsconcerning financial ratios and other conditions at all times.
10. LONG-TERM DEBT
Interest rate Year of maturity 2004 2003
GMLP (a)
First mortgage bonds
Series 11.75% 2006 $ 30,000 $ 33,000
Series 10.75% 2007 75,000 75,000
Series “D” (b) 10.45% 2017 125,000 125,000
Series “E” (b) 9.00% 2025 100,000 100,000
Series “F” (b) 7.20% 2028 50,000 50,000
Series “H” (b) 6.05% 2009 100,000 100,000
Series “H” (b) 6.95% 2010 100,000 100,000
Series “I” (b) 7.05% 2031 125,000 125,000
Series “I” (b) 6.30% 2034 125,000 –
830,000 708,000
Term loan (2.96% in 2003) (c) 2.28% 2010 165,951 255,812
Other (3.38% in 2003) 2.96% 2006 1,436 2,538
997,387 966,350
NNEG
Unsecured preferred note of VGS
(US$10,000) 7.62% 2028 12,615 13,499
Secured term note of PNGTS (Note 7a)
(US$73,317 in 2003) – 98,971
12,615 112,470
TQM
First mortgage bonds (d)
Series “G” 8.51% 2005 42,500 42,500
Series “H” 6.50% 2009 50,000 50,000
Series “I” 7.05% 2010 50,000 50,000
142,500 142,500
Term loan (3.54% in 2003) (e) 2.75% 2006 29,150 35,300
171,650 177,800
OTHER
Non-recourse term loan and other
(3.75% in 2003) (f) 3.33% 2006 and 2007 19,892 24,636
Preferred units (g) 7,366 7,366
27,258 32,002
1,208,910 1,288,622
CURRENT PORTIONS 46,167 16,738
$1,162,743 $1,271,884
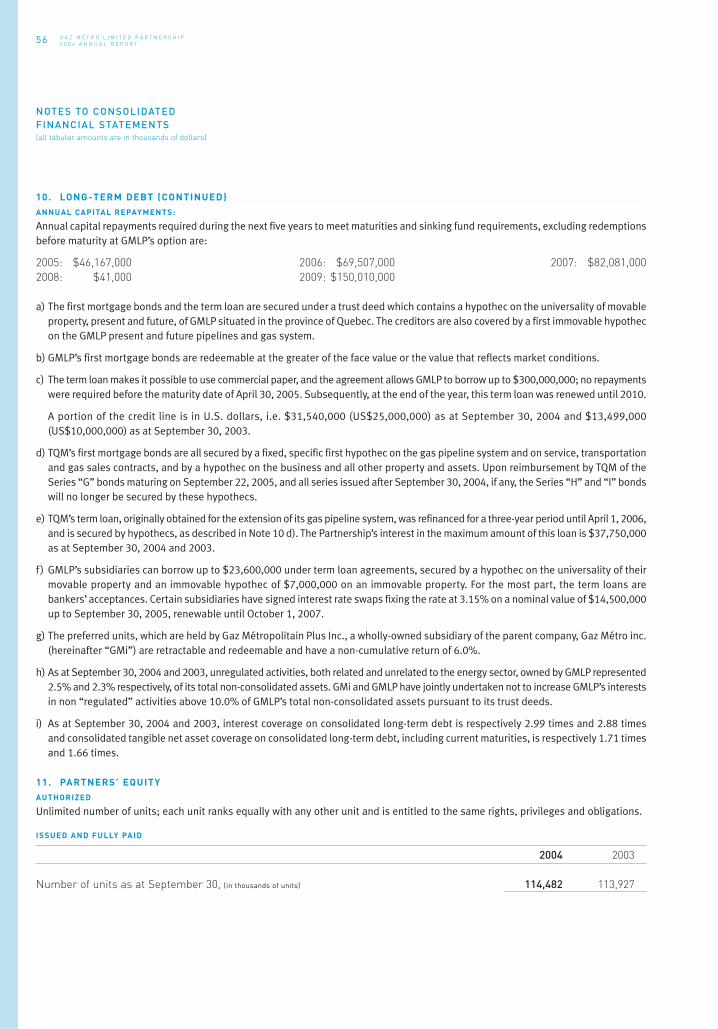
56 G A Z M É T R O L I M I T E D P A R T N E R S H I P
2 0 0 4 A N N U A L R E P O R T
ANNUAL CAPITAL REPAYMENTS:
Annual capital repayments required during the next five years to meet maturities and sinking fund requirements, excluding redemptionsbefore maturity at GMLP’s option are:
2005: $46,167,000 2006: $69,507,000 2007: $82,081,000
2008: $41,000 2009: $150,010,000
a) The first mortgage bonds and the term loan are secured under a trust deed which contains a hypothec on the universality of movableproperty, present and future, of GMLP situated in the province of Quebec. The creditors are also covered by a first immovable hypothecon the GMLP present and future pipelines and gas system.
b) GMLP’s first mortgage bonds are redeemable at the greater of the face value or the value that reflects market conditions.
c) The term loan makes it possible to use commercial paper, and the agreement allows GMLP to borrow up to $300,000,000; no repaymentswere required before the maturity date of April 30, 2005. Subsequently, at the end of the year, this term loan was renewed until 2010.
A portion of the credit line is in U.S. dollars, i.e. $31,540,000 (US$25,000,000) as at September 30, 2004 and $13,499,000(US$10,000,000) as at September 30, 2003.
d) TQM’s first mortgage bonds are all secured by a fixed, specific first hypothec on the gas pipeline system and on service, transportationand gas sales contracts, and by a hypothec on the business and all other property and assets. Upon reimbursement by TQM of theSeries “G” bonds maturing on September 22, 2005, and all series issued after September 30, 2004, if any, the Series “H” and “I” bondswill no longer be secured by these hypothecs.
e) TQM’s term loan, originally obtained for the extension of its gas pipeline system, was refinanced for a three-year period until April 1, 2006,and is secured by hypothecs, as described in Note 10 d). The Partnership’s interest in the maximum amount of this loan is $37,750,000as at September 30, 2004 and 2003.
f ) GMLP’s subsidiaries can borrow up to $23,600,000 under term loan agreements, secured by a hypothec on the universality of theirmovable property and an immovable hypothec of $7,000,000 on an immovable property. For the most part, the term loans arebankers’ acceptances. Certain subsidiaries have signed interest rate swaps fixing the rate at 3.15% on a nominal value of $14,500,000up to September 30, 2005, renewable until October 1, 2007.
g) The preferred units, which are held by Gaz Métropolitain Plus Inc., a wholly-owned subsidiary of the parent company, Gaz Métro inc.(hereinafter “GMi”) are retractable and redeemable and have a non-cumulative return of 6.0%.
h) As at September 30, 2004 and 2003, unregulated activities, both related and unrelated to the energy sector, owned by GMLP represented2.5% and 2.3% respectively, of its total non-consolidated assets. GMi and GMLP have jointly undertaken not to increase GMLP’s interestsin non “regulated” activities above 10.0% of GMLP’s total non-consolidated assets pursuant to its trust deeds.
i) As at September 30, 2004 and 2003, interest coverage on consolidated long-term debt is respectively 2.99 times and 2.88 times and consolidated tangible net asset coverage on consolidated long-term debt, including current maturities, is respectively 1.71 timesand 1.66 times.
11. PARTNERS’ EQUITYAUTHORIZED
Unlimited number of units; each unit ranks equally with any other unit and is entitled to the same rights, privileges and obligations.
ISSUED AND FULLY PAID
2004 2003
Number of units as at September 30, (in thousands of units) 114,482 113,927
NOTES TO CONSOLIDATED FINANCIAL STATEMENTS(all tabular amounts are in thousands of dollars)
10. LONG-TERM DEBT (CONTINUED)

57G A Z M É T R O L I M I T E D P A R T N E R S H I P
2 0 0 4 A N N U A L R E P O R T
As at September 30, 2004 and 2003, Consolidated Partners’ Equity includes 114,481,751 units and 113,926,612 units issued for$895,498,000 and $884,893,000 respectively.
a) In 2004, GMLP issued 37,639 units at $15.04 per unit under the unit option plan for cash consideration of $566,000. During the 2003year, 8,000 units at $15.04 per unit were issued for cash consideration of $120,000.
b) On October 21, 2003, the option given to the underwriters in respect of the September 30, 2003 unit issue was exercised in full.Accordingly, GMLP issued 517,500 additional units at $20.30 per unit for cash consideration of $10,505,000 less issue expenses of$466,000. On September 30, 2003, GMLP issued 3,450,000 units at $20.30 per unit, for cash consideration of $70,035,000 less issueexpenses of $3,451,000.
c) The agreements relating to the various long-term debt trust deeds provide that GMLP will not make a distribution to its Partners if long-term debt exceeds 75% of total capitalization. The agreements also provide that GMLP will not issue any new long-term debtif such debt would exceed 65% of total capitalization. GMLP is in compliance with these covenants as at September 30, 2004 and 2003.
UNIT OPTION PLAN
The Partnership has reserved 1,000,000 units for a unit option plan for named senior executives. During the year, 37,639 options(Note 11a) were exercised (8,000 in 2003) and 8,190 options were granted (none in 2003). Options cannot be exercised before the firstanniversary of a grant unless the Board of Directors determines otherwise when an option is granted. Options can be exercised at acumulative rate of 25% on each of the anniversaries of the grant. Options expire seven years after the grant date.
As at September 30, 2004 and 2003 respectively, there were 67,284 options and 96,733 options outstanding at a weighted average exerciseprice of $15.82 and $15.20. The remaining weighted average contract term is 3.6 years as at September 30, 2004 and 4.2 years as atSeptember 30, 2003. During the year, no options were cancelled in respect of employees who left (27,707 options in 2003).
Of the total outstanding options, 35,059 options and 50,405 could be exercised as at September 30, 2004 and 2003 respectively at aweighted average exercise price of $15.26 and $15.12.
12. CASH FLOWSa) Change in non-cash working capital items:
2004 2003
Trade and other receivables $(17,937) $ (6,464)
Inventories 16,594 (35,292)
Prepaid expenses (82) 1,169
Accounts payable and accrued liabilities (8,177) (19,976)
Income taxes payable (188) 3,230
$ (9,790) $(57,333)
b) Other information:
2004 2003
Interest received $ 3,574 $ 3,797
Interest paid $ 82,349 $ 87,543
Income taxes paid (received) $ 351 $ (845)
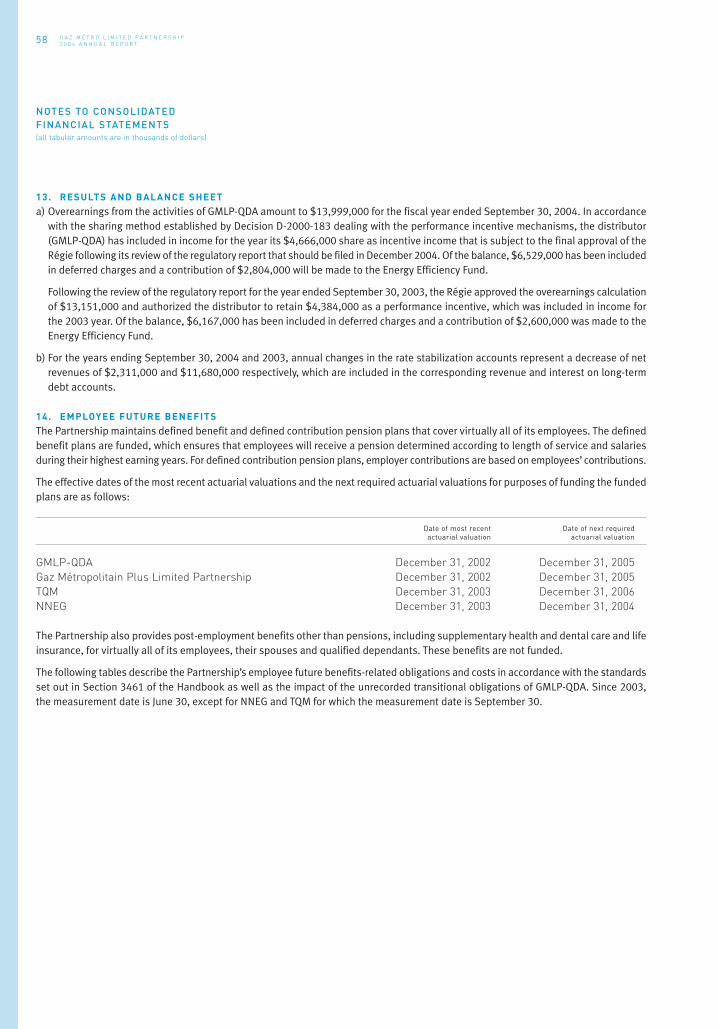
58 G A Z M É T R O L I M I T E D P A R T N E R S H I P
2 0 0 4 A N N U A L R E P O R T
13. RESULTS AND BALANCE SHEETa) Overearnings from the activities of GMLP-QDA amount to $13,999,000 for the fiscal year ended September 30, 2004. In accordance
with the sharing method established by Decision D-2000-183 dealing with the performance incentive mechanisms, the distributor(GMLP-QDA) has included in income for the year its $4,666,000 share as incentive income that is subject to the final approval of theRégie following its review of the regulatory report that should be filed in December 2004. Of the balance, $6,529,000 has been includedin deferred charges and a contribution of $2,804,000 will be made to the Energy Efficiency Fund.
Following the review of the regulatory report for the year ended September 30, 2003, the Régie approved the overearnings calculationof $13,151,000 and authorized the distributor to retain $4,384,000 as a performance incentive, which was included in income for the 2003 year. Of the balance, $6,167,000 has been included in deferred charges and a contribution of $2,600,000 was made to theEnergy Efficiency Fund.
b) For the years ending September 30, 2004 and 2003, annual changes in the rate stabilization accounts represent a decrease of netrevenues of $2,311,000 and $11,680,000 respectively, which are included in the corresponding revenue and interest on long-termdebt accounts.
14. EMPLOYEE FUTURE BENEFITSThe Partnership maintains defined benefit and defined contribution pension plans that cover virtually all of its employees. The definedbenefit plans are funded, which ensures that employees will receive a pension determined according to length of service and salariesduring their highest earning years. For defined contribution pension plans, employer contributions are based on employees’ contributions.
The effective dates of the most recent actuarial valuations and the next required actuarial valuations for purposes of funding the fundedplans are as follows:
Date of most recent Date of next requiredactuarial valuation actuarial valuation
GMLP-QDA December 31, 2002 December 31, 2005
Gaz Métropolitain Plus Limited Partnership December 31, 2002 December 31, 2005
TQM December 31, 2003 December 31, 2006
NNEG December 31, 2003 December 31, 2004
The Partnership also provides post-employment benefits other than pensions, including supplementary health and dental care and lifeinsurance, for virtually all of its employees, their spouses and qualified dependants. These benefits are not funded.
The following tables describe the Partnership’s employee future benefits-related obligations and costs in accordance with the standardsset out in Section 3461 of the Handbook as well as the impact of the unrecorded transitional obligations of GMLP-QDA. Since 2003, the measurement date is June 30, except for NNEG and TQM for which the measurement date is September 30.
NOTES TO CONSOLIDATED FINANCIAL STATEMENTS(all tabular amounts are in thousands of dollars)

59G A Z M É T R O L I M I T E D P A R T N E R S H I P
2 0 0 4 A N N U A L R E P O R T
COMPONENTS OF ACCRUED BENEFIT ASSET (OBLIGATION)
2004 2003 2004 2003Other post- Other post-
Pension Pension employment employmentplans plans benefits benefits
ACCRUED BENEFIT OBLIGATION
BALANCE, BEGINNING OF YEAR $266,401 $268,019 $ 30,159 $ 28,639
Decrease due to change in measurement date – (2,132) – (320)
ADJUSTED BEGINNING BALANCE 266,401 265,887 30,159 28,319
Current service cost 7,599 7,841 1,091 903
Interest cost 17,381 17,349 1,971 1,843
Employee contributions 1,913 1,795 – –
Other contributions and employee transfers (825) 270 – –
Benefits paid (15,290) (15,210) (1,404) (1,186)
Plan amendments 56 128 – –
Actuarial losses (gains) 2,075 (10,261) 2,865 280
Foreign exchange variations (635) (1,398) – –
BALANCE AS AT MEASUREMENT DATE 278,675 266,401 34,682 30,159
PLAN ASSETS AT FAIR VALUE
BALANCE, BEGINNING OF YEAR 254,599 257,465 – –
Increase due to change in measurement date – 6,991 – –
ADJUSTED BEGINNING BALANCE 254,599 264,456 – –
Actual return on plan assets 34,614 (1,705) – –
Employer contributions 7,845 6,015 1,404 1,186
Employee contributions 1,913 1,795 – –
Other contributions and employee transfers (825) 270 – –
Benefits paid (15,290) (15,210) (1,404) (1,186)
Foreign exchange variations (443) (1,022) – –
BALANCE AS AT MEASUREMENT DATE 282,413 254,599 – –
SURPLUS (DEFICIENCY) OF ASSETS VERSUS OBLIGATIONS 3,738 (11,802) (34,682) (30,159)
Unamortized past service costs 19,616 21,462 – –
Unamortized net actuarial losses 39,933 56,733 2,976 43
Unamortized transitional obligation (asset) (58,084) (63,904) 16,632 18,485
ACCRUED BENEFIT ASSET (OBLIGATION)
AS AT MEASUREMENT DATE 5,203 2,489 (15,074) (11,631)
Employer contributions between
measurement date and year-end 1,934 1,900 360 356
ACCRUED BENEFIT ASSET (OBLIGATION) END OF YEAR $ 7,137 $ 4,389 $(14,714) $(11,275)
Representing:
Accrued benefit asset (obligation) of GMLP-QDA unrecognized $ 13,167 $ 9,658 $(13,015) $ (9,779)
Accrued benefit obligation recognized and included
in accounts payable and accrued liabilities (6,030) (5,269) (1,699) (1,496)
$ 7,137 $ 4,389 $(14,714) $(11,275)
The following table shows the allocation of the pension plan assets at the measurement date:
2004 2003
ASSET CATEGORY
Money market 1.8% 5.8%
Bonds 37.6% 40.6%
Shares 60.6% 53.6%
100.0% 100.0%

60 G A Z M É T R O L I M I T E D P A R T N E R S H I P
2 0 0 4 A N N U A L R E P O R T
COMPONENTS OF GMLP’S DEFINED BENEFIT COST FOR THE 12-MONTH PERIOD ENDED AT THE MEASUREMENT DATE
2004 2003 2004 2003Other post- Other post-
Pension Pension employment employmentplans plans benefits benefits
Current service cost $ 7,599 $ 7,841 $ 1,091 $ 903
Interest cost 17,381 17,349 1,971 1,843
Actual return on plan assets (34,614) 1,705 – –
Actuarial losses (gains) 2,075 (10,261) 2,865 280
Plan amendments 56 128 – –
Cost before adjustments to recognize the long-term
nature of employee future benefit (7,503) 16,762 5,927 3,026
Difference between expected return
and actual return on plan assets for period 16,350 (20,597) – –
Difference between actuarial losses (gains) recognized
for period and actual actuarial losses (gains)
on accrued benefit obligation for period 236 12,598 (2,932) (423)
Difference between amortization of past service
costs for period and plan amendments for period 1,844 1,858 – –
Amortization of transitional obligation (asset) (5,820) (5,768) 1,852 1,876
Defined benefit cost $ 5,107 $ 4,853 $ 4,847 $4,479
Representing:
Unrecognized cost (revenue) of GMLP-QDA $ (3,802) $ (1,447) $ 3,563 $3,326
Recognized cost 8,909 6,300 1,284 1,153
$ 5,107 $ 4,853 $ 4,847 $4,479
GMLP-QDA’s defined benefits cost recognized for pension plans is $7,661,000 in 2004 and $4,932,000 in 2003 and, for other post-employment benefits, is $1,121,000 in 2004 and $1,030,000 in 2003.
The cost recognized for defined contribution and other pension plans is $273,000 in 2004 and $369,000 in 2003.
MAIN ACTUARIAL ASSUMPTIONS
2004 2003 2004 2003Other post- Other post-
Pension Pension employment employmentplans plans benefits benefits
ACCRUED BENEFIT OBLIGATION RECOGNIZED
AT THE MEASUREMENT DATE
Discount rate 6.50% 6.50% 6.50% 6.50%
Rate of compensation increase 3.50% 3.50% 3.50% 3.50%
BENEFIT COSTS FOR 12-MONTH PERIOD ENDED
AT THE MEASUREMENT DATE
Discount rate 6.50% 6.50% 6.50% 6.50%
Expected long-term rate of return on plan assets 7.25% 7.25% –% –%
Rate of compensation increase 3.50% 3.50% 3.50% 3.50%
NOTES TO CONSOLIDATED FINANCIAL STATEMENTS(all tabular amounts are in thousands of dollars)
14. EMPLOYEE FUTURE BENEFITS (CONTINUED)
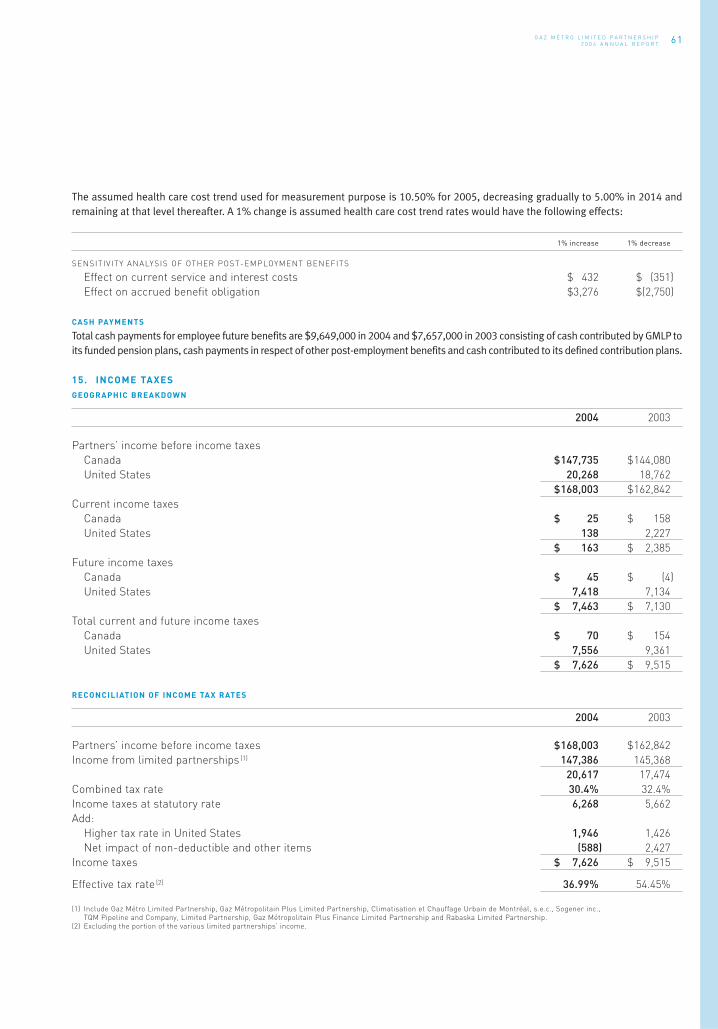
61G A Z M É T R O L I M I T E D P A R T N E R S H I P
2 0 0 4 A N N U A L R E P O R T
The assumed health care cost trend used for measurement purpose is 10.50% for 2005, decreasing gradually to 5.00% in 2014 andremaining at that level thereafter. A 1% change is assumed health care cost trend rates would have the following effects:
1% increase 1% decrease
SENSITIVITY ANALYSIS OF OTHER POST-EMPLOYMENT BENEFITS
Effect on current service and interest costs $ 432 $ (351)
Effect on accrued benefit obligation $3,276 $(2,750)
CASH PAYMENTS
Total cash payments for employee future benefits are $9,649,000 in 2004 and $7,657,000 in 2003 consisting of cash contributed by GMLP toits funded pension plans, cash payments in respect of other post-employment benefits and cash contributed to its defined contribution plans.
15. INCOME TAXES GEOGRAPHIC BREAKDOWN
2004 2003
Partners’ income before income taxes
Canada $147,735 $144,080
United States 20,268 18,762
$168,003 $162,842
Current income taxes
Canada $ 25 $ 158
United States 138 2,227
$ 163 $ 2,385
Future income taxes
Canada $ 45 $ (4)
United States 7,418 7,134
$ 7,463 $ 7,130
Total current and future income taxes
Canada $ 70 $ 154
United States 7,556 9,361
$ 7,626 $ 9,515
RECONCILIATION OF INCOME TAX RATES
2004 2003
Partners’ income before income taxes $168,003 $162,842
Income from limited partnerships (1) 147,386 145,368
20,617 17,474
Combined tax rate 30.4% 32.4%
Income taxes at statutory rate 6,268 5,662
Add:
Higher tax rate in United States 1,946 1,426
Net impact of non-deductible and other items (588) 2,427
Income taxes $ 7,626 $ 9,515
Effective tax rate (2) 36.99% 54.45%
(1) Include Gaz Métro Limited Partnership, Gaz Métropolitain Plus Limited Partnership, Climatisation et Chauffage Urbain de Montréal, s.e.c., Sogener inc., TQM Pipeline and Company, Limited Partnership, Gaz Métropolitain Plus Finance Limited Partnership and Rabaska Limited Partnership.
(2) Excluding the portion of the various limited partnerships’ income.
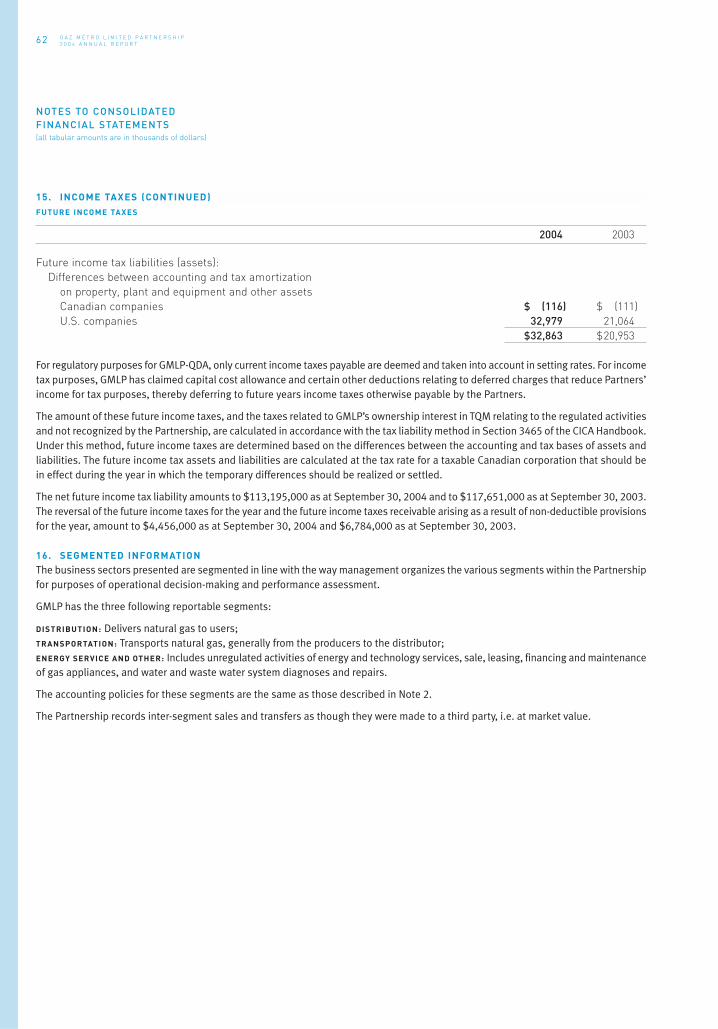
62 G A Z M É T R O L I M I T E D P A R T N E R S H I P
2 0 0 4 A N N U A L R E P O R T
FUTURE INCOME TAXES
2004 2003
Future income tax liabilities (assets):
Differences between accounting and tax amortization
on property, plant and equipment and other assets
Canadian companies $ (116) $ (111)
U.S. companies 32,979 21,064
$32,863 $20,953
For regulatory purposes for GMLP-QDA, only current income taxes payable are deemed and taken into account in setting rates. For incometax purposes, GMLP has claimed capital cost allowance and certain other deductions relating to deferred charges that reduce Partners’income for tax purposes, thereby deferring to future years income taxes otherwise payable by the Partners.
The amount of these future income taxes, and the taxes related to GMLP’s ownership interest in TQM relating to the regulated activitiesand not recognized by the Partnership, are calculated in accordance with the tax liability method in Section 3465 of the CICA Handbook.Under this method, future income taxes are determined based on the differences between the accounting and tax bases of assets andliabilities. The future income tax assets and liabilities are calculated at the tax rate for a taxable Canadian corporation that should bein effect during the year in which the temporary differences should be realized or settled.
The net future income tax liability amounts to $113,195,000 as at September 30, 2004 and to $117,651,000 as at September 30, 2003.The reversal of the future income taxes for the year and the future income taxes receivable arising as a result of non-deductible provisionsfor the year, amount to $4,456,000 as at September 30, 2004 and $6,784,000 as at September 30, 2003.
16. SEGMENTED INFORMATIONThe business sectors presented are segmented in line with the way management organizes the various segments within the Partnershipfor purposes of operational decision-making and performance assessment.
GMLP has the three following reportable segments:
DISTRIBUTION: Delivers natural gas to users;TRANSPORTATION: Transports natural gas, generally from the producers to the distributor;ENERGY SERVICE AND OTHER: Includes unregulated activities of energy and technology services, sale, leasing, financing and maintenanceof gas appliances, and water and waste water system diagnoses and repairs.
The accounting policies for these segments are the same as those described in Note 2.
The Partnership records inter-segment sales and transfers as though they were made to a third party, i.e. at market value.
NOTES TO CONSOLIDATED FINANCIAL STATEMENTS(all tabular amounts are in thousands of dollars)
15. INCOME TAXES (CONTINUED)

63G A Z M É T R O L I M I T E D P A R T N E R S H I P
2 0 0 4 A N N U A L R E P O R T
2004Energy Non-allocated services expenses and
Distribution Transportation and Other eliminations Total
Customer revenues $1,671,942 $ 45,839 $60,247 $ – $1,778,028Inter-segment revenues 709 764 6,401 (7,874) –Interest income (a) 3,988 – 1,581 (663) 4,906Total revenues 1,676,639 46,603 68,229 (8,537) 1,782,934Direct costs 1,188,725 – 46,065 (6,815) 1,227,975Gross margin 487,914 46,603 22,164 (1,722) 554,959Operations and maintenance expenses 158,937 7,169 13,656 3,618 183,380Earnings before interest,
taxes and amortization (EBITA) 328,977 39,434 8,508 (5,340) 371,579Amortization 114,805 10,439 3,339 – 128,583Interest expense 73,553 14,239 2,375 (430) 89,737Share of income of companies subject
to significant influence – (14,724) (20) – (14,744)Income taxes 2,907 6,979 12 (2,272) 7,626Partners’ income $ 137,712 $ 22,501 $ 2,802 $(2,638) $ 160,377
Assets $1,911,035 $358,151 $93,861 $(2,060) $2,360,987Additions to
Property, plant and equipment $ 121,199 $ 281 $ 2,901 $ – $ 124,381Deferred charges 59,744 5,755 401 – 65,900
$ 180,943 $ 6,036 $ 3,302 $ – $ 190,281Goodwill
Balance, beginning $ 8,019 $ 7,596 $ 7,767 $ – $ 23,382Translation adjustment (524) – – – (524)Acquisitions – – 108 – 108Balance, end $ 7,495 $ 7,596 $ 7,875 $ – $ 22,966
2003Energy Non-allocated services expenses and
Distribution Transportation and Other eliminations Total
Customer revenues $ 1,633,641 $ 63,018 $53,753 $ – $ 1,750,412
Inter-segment revenues 991 583 5,914 (7,488) –
Interest income (a) 5,632 – 1,272 (779) 6,125
Total revenues 1,640,264 63,601 60,939 (8,267) 1,756,537
Direct costs 1,154,526 – 39,618 (6,432) 1,187,712
Gross margin 485,738 63,601 21,321 (1,835) 568,825
Operations and maintenance expenses 154,390 12,103 15,732 1,862 184,087
Earnings before interest,
taxes and amortization (EBITA) 331,348 51,498 5,589 (3,697) 384,738
Amortization 119,006 9,994 2,899 – 131,899
Interest expense 68,390 19,383 2,784 (560) 89,997
Share of income of companies subject
to significant influence – – – – –
Income taxes 5,977 5,503 77 (2,042) 9,515
Partners’ income $ 137,975 $ 16,618 $ (171) $ (1,095) $ 153,327
Assets $ 1,903,415 $ 437,088 $94,951 $ (4,556) $ 2,430,898
Additions to
Property, plant and equipment $ 93,319 $ 4,944 $ 7,396 $ – $ 105,659
Deferred charges 118,810 10,282 645 – 129,737
$ 212,129 $ 15,226 $ 8,041 $ – $ 235,396
Goodwill
Balance, beginning $ 9,429 $ 7,596 $ 6,038 $ – $ 23,063
Translation adjustment (1,410) – – – (1,410)
Acquisitions – – 1,729 – 1,729
Balance, end $ 8,019 $ 7,596 $ 7,767 $ – $ 23,382

64 G A Z M É T R O L I M I T E D P A R T N E R S H I P
2 0 0 4 A N N U A L R E P O R T
Only the Distribution Sector includes significant items other than amortization that have no impact on cash flows, i.e. rate stabilizationaccounts and reduction in deferred charges related to cost of natural gas as specifically shown in the cash flow statement.
a) Distribution Sector interest income arises from, among other things, interest on overdue accounts receivable and the capitalized returnon assets not included in the rate base in accordance with regulatory provisions.
GEOGRAPHIC INFORMATION
2004 2003Property, plant, Property, plant,
equipment equipmentRevenues and goodwill Revenues and goodwill
Canada $1,683,740 $1,584,919 $1,641,156 $1,556,967
United States 99,194 94,804 115,381 252,622
Total $1,782,934 $1,679,723 $1,756,537 $1,809,589
17. RELATED PARTIESDuring the year, GMLP concluded the following transactions with related parties in the normal course of business, as authorized by theRégie. The amounts received from or paid to related parties are determined based on contracts between the parties and in which thevalue of the services rendered has been established at the exchange amount:
2004 2003
Storage service owned in part by one of the ultimate shareholders of GMi $18,093 $15,994
As at September 30, 2004 and 2003, transactions with GMi, and companies owned by its ultimate shareholder represent respectivelyan amount payable of $725,000 and $3,311,000 included in accounts payable and accrued liabilities. Under the partnership agreement,GMLP pays management fees of $50,000 annually to GMi.
18. FINANCIAL INSTRUMENTSThe Partnership applies hedge accounting to all of its financial instruments, except those related to the activities of GMLP-QDA, for whichspecific regulatory treatment applies. Because hedge accounting is not applied to the financial instruments of GMLP-QDA, they havebeen recorded in the balance sheet since October 1, 2003, the effective date of new Accounting Guideline AcG-13 (see Note 3B).
The fair value of the financial instruments represents the estimated amounts that the Partnership would receive or pay to cancel thesefinancial instruments as at the date of the financial statements.
FINANCIAL INSTRUMENTS INCLUDED IN BALANCE SHEET
Cash, trade and other receivables, bank borrowings as well as accounts payable and accrued liabilities are short-term financialinstruments whose fair value approximates the carrying amount given that they will mature shortly.
The fair value of other investments in private companies cannot be easily determined because the securities are not traded.
FAIR VALUE OF LONG-TERM DEBT
The fair value of the long-term debt, including current instalments, is calculated using stock exchange prices at the end of the year ordiscounted cash flows using interest rates which GMLP, its subsidiaries and its joint ventures could have obtained as at the balance sheetdate for loans with similar terms, conditions and maturity dates.
NOTES TO CONSOLIDATED FINANCIAL STATEMENTS(all tabular amounts are in thousands of dollars)
16. SEGMENTED INFORMATION (CONTINUED)

65G A Z M É T R O L I M I T E D P A R T N E R S H I P
2 0 0 4 A N N U A L R E P O R T
2004 2003Carrying Fair Carrying Fair
amount value amount value
LONG-TERM DEBT
GMLP $ 997,387 $1,145,891 $ 966,350 $1,101,335
NNEG 12,615 15,422 112,470 116,599
TQM 171,650 183,430 177,800 189,542
OTHER 27,258 27,258 32,002 32,002
$1,208,910 $1,372,001 $1,288,622 $1,439,478
FAIR VALUE DERIVATIVES INSTRUMENTS – BALANCE SHEET AND OFF-BALANCE SHEET
The Partnership obtains an independent valuation of the fair value of the financial instruments used to stabilize the cost of gas and swapsused to hedge against fluctuations in interest and exchange rates. The valuation is based on published indices at the closing date, volatilityand expiration dates.
2004 2003Fair value Fair valuereceivable receivable
(payable) (payable)
Balance Off-balance Off-balance sheet sheet Total sheet(1)
Swaps (a) $ – $ 156 $ 156 $ 18
Forward (b) $ – $ 2,315 $ 2,315 $ 2,584
Instruments related to natural gas (c)
“Swaps” $ 67,027 $12,600 $ 79,627 $(10,274)
“Calls” 31,088 – 31,088 (31,245)
“Collars” 2,119 – 2,119 –
“Three-way collars” 9,774 – 9,774 2,626
$110,008 $12,600 $122,608 $(38,893)
Portion presented in assets $112,019Portion presented in liabilities $ (2,011)
Volumes covered by natural gas contracts (in thousands of gigajoules) 112,020 8,071 120,091 122,945
(1) None of these instruments were accounted for in the balance sheet on September 30, 2003 (See Note 3B).
a) These instruments, which are sensitive to interest rates, fix interest rates on certain floating rate long-term debt (Notes 9b) and 10f )).
b) These instruments, which are sensitive to exchange rates, allow the Partnership to manage a portion of its Canadian dollar gaspurchases for VGS. These instruments mature in 2005 and 2006. The nominal value of forward contracts is $32,975,000 as atSeptember 30, 2004 and $30,725,000 as at September 30, 2003.
c) Maturity of instruments related to natural gas:
2005 2006 2007 Total
Fair value $80,548 $38,155 $ 3,905 $122,608
Volumes hedged (in thousands of gigajoules) 65,828 37,055 17,208 120,091

66 G A Z M É T R O L I M I T E D P A R T N E R S H I P
2 0 0 4 A N N U A L R E P O R T
CREDIT RISK
The Partnership is exposed to the credit risk of its derivative financial instrument counterparties that do not meet their obligations. To minimize this risk, the Partnership only concludes off-balance sheet hedge transactions with major financial institutions that meetits credit evaluation standards.
As at September 30, 2004, the Partnership is not planning to cancel any financial instruments before the maturity date.
Management considers that these derivative financial instruments do not present any unusual risk and does not expect any significantgain or loss as a result of these transactions.
19. COMMITMENTS, GUARANTEES AND CONTINGENCIESa) In the normal course of business, the Partnership signed supply, transportation and storage contracts for periods up to 2013. The costs
relating to these contracts will be included in rates in the corresponding periods.
b) GMLP has issued letters of credit for $5,017,000 to guarantee a portion of the supplemental post-employment benefits.
c) GMLP is cited in claims and lawsuits in the normal course of its activities. In the opinion of management, these claims and lawsuitsare, for the most part, covered by appropriate insurance coverage and the overall amount of the contingent liability relating to theseclaims and lawsuits is not material.
d) The NNEG subsidiary has been cited in a lawsuit, jointly with others, following the discovery of polluting substances on land it onceowned for a brief period of time during the 1960s. The investigation by the U.S. Environmental Protection Agency has not beencompleted and NNEG is unable to predict the outcome of the lawsuit at this time. In the event a claim arises, an application will befiled with the Vermont Public Service Board to seek recovery through the rates of VGS. Moreover, an agreement was reached, in 1994,between NNEG and a third party limiting the maximum amount payable by NNEG. In the opinion of management, any costs resultingfrom this claim would not be significant for the Partnership.
e) Upon completion of the construction of the TQM pipeline extension to the U.S. border, the project manager of the construction worklodged a claim against TQM for reimbursement of the contractor’s cost overruns. The contractor also registered a legal hypothec onTQM’s pipeline, the result of which depends on the merits of the claim and the non-payment of the debt by TQM. The arbitratorevaluating the merits and quantum of the claim rendered a decision in September 2004 stating that TQM had to pay $10.6 million tothe project manager. As at September 30, 2004, TQM therefore recorded a liability and included the offset in deferred chargesbecause of the probability it will receive the approval of the National Energy Board to recover these costs through its rates in the future.The project manager has 90 days from the date of the decision, i.e. until December 21, 2004, to appeal. GMLP does not expect theoutcome of this matter will have a significant impact on the pipeline’s profitability or on the Partnership’s overall financial situation.
20. SUBSEQUENT EVENTSDistributions totalling $38,924,000 or $0.34 per unit, were paid on October 1, 2004 to Partners of record as of September 15, 2004.
21. COMPARATIVE DATACertain comparative figures have been reclassified to conform to the financial statement presentation adopted in the current year.
NOTES TO CONSOLIDATED FINANCIAL STATEMENTS(all tabular amounts are in thousands of dollars)
18. FINANCIAL INSTRUMENTS (CONTINUED)

67G A Z M É T R O L I M I T E D P A R T N E R S H I P
2 0 0 4 A N N U A L R E P O R T
FIVE-YEAR REVIEW –CONSOLIDATED OPERATING DATA (1)
Years ended September 30, 2004 2003 2002 2001 2000
NORMALIZED VOLUME (106m3) (2)
DISTRIBUTION
IndustrialFirm service 2,335 2,337 2,194 2,182 2,377Interruptible service 785 734 1,072 841 1,414
Commercial 1,917 1,905 1,916 1,910 1,986Residential 752 741 739 743 782Total (106m3) 5,789 5,717 5,921 5,676 6,559Total (Bcf) 204 202 209 200 232
NATURAL GAS DELIVERIES (106m3)
DISTRIBUTION
Total (106m3) 5,795 5,728 5,680 5,639 6,348Total (Bcf) 205 202 200 199 224TRANSPORTATION (3) (4)
Total (106m3) 6,711 6,321 6,439 6,023 5,855Total (Bcf) 237 223 227 213 207
CUSTOMERS (DISTRIBUTION)Industrial 2,341 2,280 2,173 2,109 2,038Commercial 48,300 47,254 46,655 45,860 45,307Residential 143,204 139,182 137,972 136,520 136,117Total 193,845 188,716 186,800 184,489 183,462
SYSTEM DATALength of pipelines (in km)
DISTRIBUTION
Canada 9,516 9,318 9,166 8,999 8,775United States 988 935 895 853 828Total 10,504 10,253 10,061 9,852 9,603
TRANSPORTATION (4)
Canada 670 670 670 670 670United States 489 489 489 489 489Total 1,159 1,159 1,159 1,159 1,159
Gross property, plant and equipment(in millions of dollars) 2,632 2,718 2,636 2,556 2,477
Net property, plant and equipment(in millions of dollars) 1,657 1,786 1,759 1,751 1,741
Additions to property, plant, equipment and deferred charges(in millions of dollars) 190 235 107 253 139
NUMBER OF EMPLOYEES (4)
DISTRIBUTION
GMLP 1,310 1,256 1,194 1,182 1,300NNEG 111 112 112 108 147
1,421 1,368 1,306 1,290 1,447TRANSPORTATION
TQM 4 5 60 60 70PNGTS 11 32 32 31 29
15 37 92 91 99ENERGY SERVICES AND OTHER
AQUA DATA 78 81 63 61 57AQUA-REHAB 35 51 32 33 29 CCUM 17 18 19 16 24 CONSULGAZ 1 2 6 3 4 GAZ MÉTROPOLITAIN PLUS 109 106 102 92 89OPTION GAZ 1 10 18 17 18 SERVITECH COMBUSTION 56 56 70 – – SOFAME 14 10 18 18 22 SOGENER 1 2 15 14 11TELDIG 15 13 12 12 8
327 349 355 266 262
(1) Unaudited data.(2) Normalized volumes based on normal temperature for natural gas distribution in Quebec.(3) Includes volumes transported and delivered by TQM to the distribution sector (GMLP) and PNGTS.(4) Data not adjusted for GMLP’s percentage interest in the subsidiaries and joint ventures.
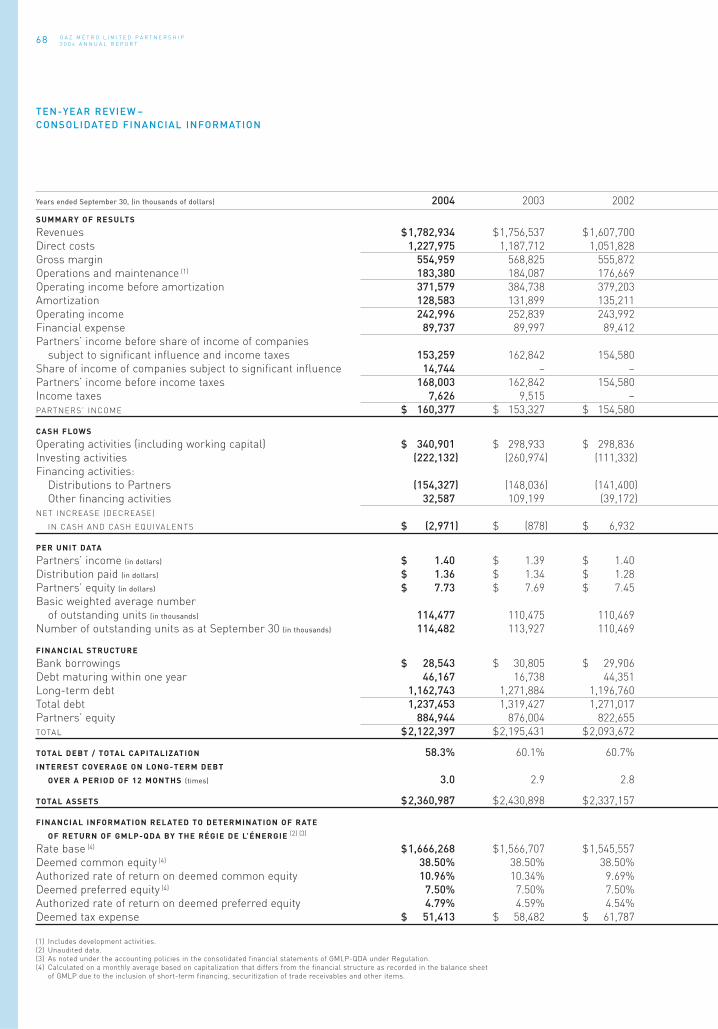
68 G A Z M É T R O L I M I T E D P A R T N E R S H I P
2 0 0 4 A N N U A L R E P O R T
Years ended September 30, (in thousands of dollars) 2004 2003 2002
SUMMARY OF RESULTS
Revenues $1,782,934 $1,756,537 $1,607,700
Direct costs 1,227,975 1,187,712 1,051,828
Gross margin 554,959 568,825 555,872
Operations and maintenance (1) 183,380 184,087 176,669
Operating income before amortization 371,579 384,738 379,203
Amortization 128,583 131,899 135,211
Operating income 242,996 252,839 243,992
Financial expense 89,737 89,997 89,412
Partners’ income before share of income of companies
subject to significant influence and income taxes 153,259 162,842 154,580
Share of income of companies subject to significant influence 14,744 – –
Partners’ income before income taxes 168,003 162,842 154,580
Income taxes 7,626 9,515 –
PARTNERS’ INCOME $ 160,377 $ 153,327 $ 154,580
CASH FLOWS
Operating activities (including working capital) $ 340,901 $ 298,933 $ 298,836
Investing activities (222,132) (260,974) (111,332)
Financing activities:
Distributions to Partners (154,327) (148,036) (141,400)
Other financing activities 32,587 109,199 (39,172)
NET INCREASE (DECREASE)
IN CASH AND CASH EQUIVALENTS $ (2,971) $ (878) $ 6,932
PER UNIT DATA
Partners’ income (in dollars) $ 1.40 $ 1.39 $ 1.40
Distribution paid (in dollars) $ 1.36 $ 1.34 $ 1.28
Partners’ equity (in dollars) $ 7.73 $ 7.69 $ 7.45
Basic weighted average number
of outstanding units (in thousands) 114,477 110,475 110,469
Number of outstanding units as at September 30 (in thousands) 114,482 113,927 110,469
FINANCIAL STRUCTURE
Bank borrowings $ 28,543 $ 30,805 $ 29,906
Debt maturing within one year 46,167 16,738 44,351
Long-term debt 1,162,743 1,271,884 1,196,760
Total debt 1,237,453 1,319,427 1,271,017
Partners’ equity 884,944 876,004 822,655
TOTAL $2,122,397 $2,195,431 $2,093,672
TOTAL DEBT / TOTAL CAPITALIZATION 58.3% 60.1% 60.7%
INTEREST COVERAGE ON LONG-TERM DEBT
OVER A PERIOD OF 12 MONTHS (times) 3.0 2.9 2.8
TOTAL ASSETS $2,360,987 $2,430,898 $2,337,157
FINANCIAL INFORMATION RELATED TO DETERMINATION OF RATE
OF RETURN OF GMLP-QDA BY THE RÉGIE DE L’ÉNERGIE (2) (3)
Rate base (4) $1,666,268 $1,566,707 $1,545,557
Deemed common equity (4) 38.50% 38.50% 38.50%
Authorized rate of return on deemed common equity 10.96% 10.34% 9.69%
Deemed preferred equity (4) 7.50% 7.50% 7.50%
Authorized rate of return on deemed preferred equity 4.79% 4.59% 4.54%
Deemed tax expense $ 51,413 $ 58,482 $ 61,787
(1) Includes development activities.(2) Unaudited data.(3) As noted under the accounting policies in the consolidated financial statements of GMLP-QDA under Regulation.(4) Calculated on a monthly average based on capitalization that differs from the financial structure as recorded in the balance sheet
of GMLP due to the inclusion of short-term financing, securitization of trade receivables and other items.
TEN-YEAR REVIEW –CONSOLIDATED FINANCIAL INFORMATION

69G A Z M É T R O L I M I T E D P A R T N E R S H I P
2 0 0 4 A N N U A L R E P O R T
2001 2000 1999 1998 1997 1996 1995
$ 2,069,977 $ 1,633,736 $ 1,339,022 $ 1,216,923 $ 1,197,742 $1,117,600 $ 1,088,164
1,532,916 1,100,310 841,367 736,063 722,052 643,278 628,196
537,061 533,426 497,655 480,860 475,690 474,322 459,968
167,500 176,109 164,556 159,246 158,369 145,171 149,464
369,561 357,317 333,099 321,614 317,321 329,151 310,504
127,111 120,797 106,834 100,788 92,358 87,634 82,006
242,450 236,520 226,265 220,826 224,963 241,517 228,498
101,286 92,798 90,493 80,080 86,256 95,689 93,490
141,164 143,722 135,772 140,746 138,707 145,828 135,008
– – – – – – –
141,164 143,722 135,772 140,746 138,707 145,828 135,008
– – – – – – –
$ 141,164 $ 143,722 $ 135,772 $ 140,746 $ 138,707 $ 145,828 $ 135,008
$ 323,018 $ 190,003 $ 246,539 $ 231,691 $ 246,294 $ 298,436 $ 253,324
(257,893) (142,657) (242,372) (265,771) (118,823) (145,530) (241,226)
(140,295) (136,981) (134,748) (138,459) (142,200) (141,666) (132,893)
74,797 84,513 111,620 198,432 17,000 (18,240) 120,489
$ (373) $ (5,122) $ (18,961) $ 25,893 $ 2,271 $ (7,000) $ (306)
$ 1.28 $ 1.30 $ 1.25 $ 1.32 $ 1.30 $ 1.36 $ 1.30
$ 1.27 $ 1.24 $ 1.25 $ 1.30 $ 1.33 $ 1.33 $ 1.34
$ 7.35 $ 7.30 $ 7.21 $ 6.93 $ 6.85 $ 6.87 $ 6.83
110,469 110,469 108,671 106,918 106,918 106,918 104,215
110,469 110,469 110,469 106,918 106,918 106,918 106,918
$ 38,441 $ 33,216 $ 45,779 $ 45,010 $ 45,777 $ 20,982 $ 38,414
3,099 3,722 11,321 10,053 26,023 12,071 81,300
1,267,225 1,189,766 1,082,376 1,034,770 819,829 841,934 767,467
1,308,765 1,226,704 1,139,476 1,089,833 891,629 874,987 887,181
811,845 805,960 796,823 740,943 732,148 734,903 730,329
$ 2,120,610 $ 2,032,664 $ 1,936,299 $ 1,830,776 $ 1,623,777 $1,609,890 $ 1,617,510
61.7% 60.3% 58.8% 59.5% 54.9% 54.4% 54.8%
2.5 2.7 2.6 2.9 2.7 2.7 2.5
$ 2,349,696 $ 2,262,939 $ 2,137,998 $ 2,017,255 $ 1,775,254 $1,749,361 $ 1,760,611
$ 1,545,839 $ 1,486,889 $ 1,413,245 $ 1,397,303 $ 1,352,240 $1,340,108 $ 1,318,244
38.50% 38.50% 38.50% 38.53% 39.39% 38.14% 37.99%
10.38% 9.72% 9.64% 10.75% 11.50% 12.00% 12.00%
7.17% 7.45% 7.50% 7.50% 7.64% 7.60% 7.40%
5.37% 5.61% 5.88% 5.63% 5.36% 6.43% 6.74%
$ 60,350 $ 63,890 $ 55,716 $ 56,817 $ 56,954 $ 59,100 $ 45,322
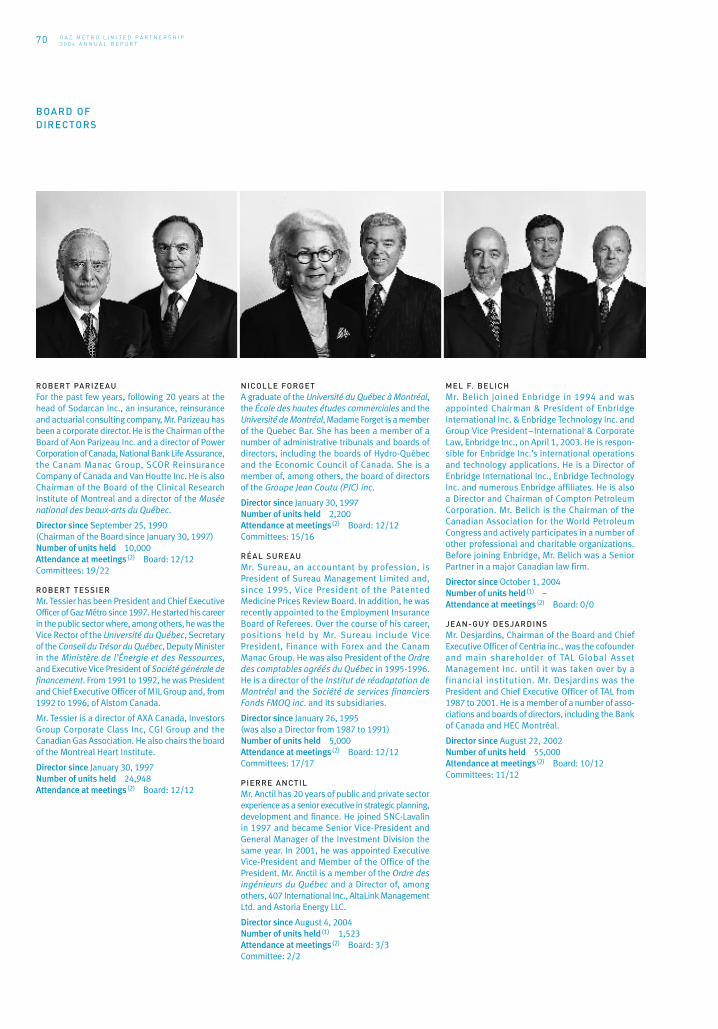
70 G A Z M É T R O L I M I T E D P A R T N E R S H I P
2 0 0 4 A N N U A L R E P O R T
ROBERT PARIZEAU For the past few years, following 20 years at thehead of Sodarcan Inc., an insurance, reinsuranceand actuarial consulting company, Mr. Parizeau hasbeen a corporate director. He is the Chairman of theBoard of Aon Parizeau Inc. and a director of PowerCorporation of Canada, National Bank Life Assurance,the Canam Manac Group, SCOR ReinsuranceCompany of Canada and Van Houtte Inc. He is alsoChairman of the Board of the Clinical ResearchInstitute of Montreal and a director of the Musée
national des beaux-arts du Québec.
Director since September 25, 1990(Chairman of the Board since January 30, 1997)Number of units held 10,000Attendance at meetings(2) Board: 12/12Committees: 19/22
ROBERT TESSIER Mr. Tessier has been President and Chief ExecutiveOfficer of Gaz Métro since 1997. He started his careerin the public sector where, among others, he was theVice Rector of the Université du Québec, Secretaryof the Conseil du Trésor du Québec, Deputy Ministerin the Ministère de l’Énergie et des Ressources, and Executive Vice President of Société générale de
financement. From 1991 to 1992, he was Presidentand Chief Executive Officer of MIL Group and, from1992 to 1996, of Alstom Canada.
Mr. Tessier is a director of AXA Canada, InvestorsGroup Corporate Class Inc, CGI Group and theCanadian Gas Association. He also chairs the boardof the Montreal Heart Institute.
Director since January 30, 1997Number of units held 24,948Attendance at meetings(2) Board: 12/12
NICOLLE FORGET A graduate of the Université du Québec à Montréal,the École des hautes études commerciales and theUniversité de Montréal, Madame Forget is a memberof the Quebec Bar. She has been a member of anumber of administrative tribunals and boards ofdirectors, including the boards of Hydro-Québecand the Economic Council of Canada. She is amember of, among others, the board of directors of the Groupe Jean Coutu (PJC) inc.
Director since January 30, 1997Number of units held 2,200Attendance at meetings(2) Board: 12/12Committees: 15/16
RÉAL SUREAU Mr. Sureau, an accountant by profession, isPresident of Sureau Management Limited and,since 1995, Vice President of the PatentedMedicine Prices Review Board. In addition, he wasrecently appointed to the Employment InsuranceBoard of Referees. Over the course of his career,positions held by Mr. Sureau include VicePresident, Finance with Forex and the CanamManac Group. He was also President of the Ordre
des comptables agréés du Québec in 1995-1996.He is a director of the Institut de réadaptation de
Montréal and the Société de services financiers
Fonds FMOQ inc. and its subsidiaries.
Director since January 26, 1995(was also a Director from 1987 to 1991)Number of units held 5,000Attendance at meetings(2) Board: 12/12Committees: 17/17
PIERRE ANCTILMr. Anctil has 20 years of public and private sectorexperience as a senior executive in strategic planning,development and finance. He joined SNC-Lavalinin 1997 and became Senior Vice-President andGeneral Manager of the Investment Division thesame year. In 2001, he was appointed ExecutiveVice-President and Member of the Office of thePresident. Mr. Anctil is a member of the Ordre des
ingénieurs du Québec and a Director of, amongothers, 407 International Inc., AltaLink ManagementLtd. and Astoria Energy LLC.
Director since August 4, 2004Number of units held(1) 1,523Attendance at meetings(2) Board: 3/3Committee: 2/2
MEL F. BELICHMr. Belich joined Enbridge in 1994 and wasappointed Chairman & President of EnbridgeInternational Inc. & Enbridge Technology Inc. andGroup Vice President–International & CorporateLaw, Enbridge Inc., on April 1, 2003. He is respon-sible for Enbridge Inc.’s international operationsand technology applications. He is a Director ofEnbridge International Inc., Enbridge TechnologyInc. and numerous Enbridge affiliates. He is alsoa Director and Chairman of Compton PetroleumCorporation. Mr. Belich is the Chairman of theCanadian Association for the World PetroleumCongress and actively participates in a number ofother professional and charitable organizations.Before joining Enbridge, Mr. Belich was a SeniorPartner in a major Canadian law firm.
Director since October 1, 2004Number of units held(1) –Attendance at meetings(2) Board: 0/0
JEAN-GUY DESJARDINS Mr. Desjardins, Chairman of the Board and ChiefExecutive Officer of Centria inc., was the cofounderand main shareholder of TAL Global AssetManagement Inc. until it was taken over by afinancial institution. Mr. Desjardins was thePresident and Chief Executive Officer of TAL from1987 to 2001. He is a member of a number of asso-ciations and boards of directors, including the Bankof Canada and HEC Montréal.
Director since August 22, 2002Number of units held 55,000Attendance at meetings(2) Board: 10/12Committees: 11/12
BOARD OF DIRECTORS

71G A Z M É T R O L I M I T E D P A R T N E R S H I P
2 0 0 4 A N N U A L R E P O R T
BOARD OF DIRECTORS
LOUIS P. GIGNAC Mr. Gignac has been the President and ChiefExecutive Officer of Cambior Inc. since 1986.Cambior produces gold and niobium in Quebec andSouth America. The Company has approximately2,800 employees. Mr. Gignac, who holds a doctoratein mining engineering, is also a director of Domtarand The Mining Association of Canada.
Director since September 25, 1990Number of units held 2,000Attendance at meetings(2) Board: 10/12Committees: 8/8
PIERRE MICHAUDSince 2003, following more than 30 years at thehelm of retail businesses (Groupe Val Royal andRéno-Dépôt), Mr. Michaud has focused on his otherprofessional activities. He is a corporate director,and has been Chairman of the Board of Provigo sinceJune 1993. Mr. Michaud is also Deputy Chairman of the Board of the Laurentian Bank of Canada anda director of Bombardier Produits récréatifs, TheLoblaw Limited Companies, Mont-TremblantAdvisory Committee, Laurentian Trust of Canada andthe Old Port of Montreal Corporation.
Director since August 4, 2004Number of units held 13,000Attendance at meetings(2) Board: 2/3Committee: 0/0
STEPHEN J.J. LETWIN Before joining Enbridge, Mr. Letwin was, amongothers, Senior Vice President and Chief FinancialOfficer with TransCanada PipeLines and, prior tothat, President and Chief Financial Officer of NumacOil & Gas. In 1999, he was appointed President andChief Operating Officer of Energy Services Enbridgeuntil 2000 when he was appointed Group VicePresident, Distribution and Services of Enbridge Inc.In 2003, Mr. Letwin was appointed Group VicePresident, Gas Strategy & Corporate Development.
Director since February 7, 2001Number of units held(1) –Attendance at meetings(2) Board: 6/12Committees: 3/6
PHILIPPE HOCHART Presently Gaz de France’s Representative for NorthAmerica, Mr. Hochart has been with the organi-zation since 1980 where he has held executivepositions in the distribution, rate setting, gassupply, transportation, finance and treasurysectors, as well as natural gas trading.
Director since February 6, 2002Number of units held(1) –Attendance at meetings(2) Board: 10/12Committees: 4/6
GHISLAIN GAUTHIERA graduate in administration from the Université du
Québec à Chicoutimi, Mr.Gauthier is also a CharteredFinancial Analyst. Following a few years with theBusiness Development Bank of Canada and ExportDevelopment Canada, Mr. Gauthier joined the Caisse
de dépôt et placement du Québec in 1982 wherehe worked primarily in private placements and stockmarkets. He is currently responsible for the manage-ment and growth of a substantial North Americanportfolio of medium and large company securities inthe energy, infrastructure and services sector. He isalso in charge of the European investment team.
Director since August 4, 2004Number of units held(1) –Attendance at meetings(2) Board: 3/3Committee: 0/0
JEAN ABITEBOULA graduate engineer, Mr. Abiteboul has beenInternational Executive Vice President with Gaz de France since 2003. He joined Électricité deFrance/Gaz de France in 1975 where he held a num-ber of management positions in the distribution,transportation, contracts, international and majorproject divisions. From 1994 to 1997, Mr. Abiteboulwas the President and General Manager of Novergazin Montreal. When he returned to France in 1998, he was put in charge of Gas Supply and, in 2002, of Gaz de France Trading.
Director since February 19, 2004(was also a Director from 1994 to 1999)Number of units held(1) –Attendance at meetings(2) Board: 4/6
EMMANUEL HEDDEMr. Hedde is Vice President, Projects and BusinessDevelopment Division for the Gaz de France Group.He had held management positions in a company inthe mechanical industry and then, for 13 years, in afinance firm. He joined the Subsidiaries and FinancialInterests Division of Gaz de France in 1993. From2000 to 2003, he was the Executive Vice President of the Finance Division. He is a director of otherindustrial or service companies.
Director since May 23, 2002Number of units held(1) –Attendance at meetings(2) Board: 9/12
(1) Directors who do not personally receive compensation for their service as directors are not required to own units of the Partnership.(2) Meetings during fiscal year 2004.

72 G A Z M É T R O L I M I T E D P A R T N E R S H I P
2 0 0 4 A N N U A L R E P O R T
Gaz Métro inc. (the “Company”) is essentially devoted to managing the affairs
of Gaz Métro Limited Partnership (the “Partnership”) as its General Partner.
The terms “Company” and “Partnership” are used interchangeably hereinafter.
It is as part of this responsibility, and in accordance with the requirements of
the Toronto Stock Exchange on which the Partnership’s units are traded, that
the Board of Directors summarizes in the following text its corporate governance
policies and practices in relation to the Stock Exchange guidelines (summarized
below and shown in bold). This statement, which was revised on November 18, 2004,
satisfies the Stock Exchange guidelines.
The Company, which holds 74.7% of the units of the Partnership, is a wholly-
owned subsidiary of Noverco Inc., a private company whose shareholders are
Trencap s.e.c., Enbridge and Gaz de France.
1. THE BOARD OF DIRECTORS OF EVERY CORPORATION SHOULD EXPLICITLY
ASSUME RESPONSIBILITY FOR THE STEWARDSHIP OF THE CORPORATION.
The Board is responsible for supervising the management of the business of the
Partnership with the objective of ensuring that its resources and potential
are used and exploited in such a way as to create value for the Partners,
in accordance with applicable laws, standards and social responsibility.
This growth objective includes protecting the value of the business against the
main risks it faces.
In addition to the responsibilities discussed in greater detail below, the Board
is also responsible, among other things for the:
approval of the annual and quarterly financial statements;
declaration of dividends payable by the Company and income distributions
by the Partnership;
approval of budgets;
approval of acquisitions or major investments;
approval of major reorganizations; and
hiring, compensation and performance appraisals of senior executives.
The Board met 12 times during the 2004 year.
MORE PARTICULARLY, THE BOARD SHOULD ASSUME RESPONSIBILITY FOR:
A) ADOPTION OF A STRATEGIC PLANNING PROCESS.
Every two years, a multi-year strategic plan is prepared by management and
submitted to the Board for discussion and approval. The plan is monitored
periodically by comparing results with the strategies adopted. If appropriate,
the strategies are adapted.
B) THE IDENTIFICATION OF THE PRINCIPAL RISKS OF THE CORPORATION’S
BUSINESS AND ENSURING THE IMPLEMENTATION OF APPROPRIATE SYSTEMS
TO MANAGE THESE RISKS.
The Board ensures, particularly through its Audit Committee, that management
identifies the risks to which the Partnership is exposed and takes the necessary
steps to manage such risks if they cannot be eliminated.
C) SUCCESSION PLANNING, INCLUDING APPOINTING, TRAINING AND
MONITORING SENIOR MANAGEMENT.
The Human Resources Committee is responsible for reviewing candidates for the
position of President and Chief Executive Officer and the senior executive
appointments proposed by the latter. This responsibility involves monitoring
the performance and development of the incumbents and ensuring that there
is an adequate succession plan.
D) A COMMUNICATION POLICY FOR THE CORPORATION.
The Board, in particular the Audit Committee, ensures that the financial
information for the Partners and the investing public is complete and objective,
and that it is communicated within the timeframe established by the Canadian
Securities Administrators and the Stock Exchange. To discharge this responsibility,
the Audit Committee reviews the annual and quarterly reports and related press
releases, the annual information form and prospectuses.
Financial information is disclosed through the normal channels and can be found
in the “Investors’ Sheet” section on the Partnership’s Internet site. Any Partner
wishing to ask the Partnership for additional information or provide it with
comments can contact the Coordinator, Investor Relations, the Treasurer or the
Vice President, Finance and Corporate Affairs.
The Board also ensures that management maintains transparent communications
with credit rating agencies, financial analysts and other financial market inter-
venors in order to fairly present the Partnership’s situation. A financial information
disclosure policy approved by the Board provides management with guidance
in this regard.
E) THE INTEGRITY OF THE CORPORATION’S INTERNAL CONTROL AND MANAGEMENT
INFORMATION SYSTEM.
A primary responsibility given to the Audit Committee by the Board is to satisfy itself
as to the adequacy of the Partnership’ internal controls and the processes for
presenting financial information. To discharge this responsibility, the Committee
receives periodic reports from the internal and external auditors after it has
approved the annual audit plans.
2. THE BOARD OF DIRECTORS SHOULD BE CONSTITUTED WITH A MAJORITY OF
INDIVIDUALS WHO QUALIFY AS “UNRELATED DIRECTORS”.
A majority of the directors are “unrelated”, i.e. they are independent of
management and are free from any interest or other relationship, other than
a shareholder relationship, which could materially interfere with their ability
to act in the best interests of the Partnership.
3. THE APPLICATION OF THE DEFINITION OF “UNRELATED DIRECTOR”
TO THE CIRCUMSTANCES OF EACH INDIVIDUAL DIRECTOR SHOULD BE THE
RESPONSIBILITY OF THE BOARD, WHICH WILL BE REQUIRED TO DISCLOSE
ON AN ANNUAL BASIS WHETHER THE BOARD HAS A MAJORITY OF UNRE-
LATED DIRECTORS.
The Corporate Governance Committee, which is composed of unrelated outside
directors, is responsible for reviewing the composition of the Board based on the
definition of unrelated director. This enables the Board to ensure that it satisfies
the requirements of Guideline 2.
4. THE BOARD SHOULD APPOINT A COMMITTEE OF DIRECTORS COMPOSED
EXCLUSIVELY OF OUTSIDE DIRECTORS, A MAJORITY OF WHOM ARE UNRELATED
DIRECTORS, WITH THE RESPONSIBILITY FOR PROPOSING TO THE FULL BOARD
NEW NOMINEES TO THE BOARD AND FOR ASSESSING DIRECTORS ON AN
ONGOING BASIS.
Directors are appointed either directly by the sole shareholder, or by the Board
with the consent of the sole shareholder if a vacancy arises between two annual
meetings. The Corporate Governance Committee reviews the composition
of the Board and provides the sole shareholder with its opinion on candidates
proposed by the sole shareholder or on individuals who should be considered
in the Committee’s view.
BOARD OF DIRECTORS’ STATEMENT ON CORPORATE GOVERNANCE PRACTICES

73G A Z M É T R O L I M I T E D P A R T N E R S H I P
2 0 0 4 A N N U A L R E P O R T
From time to time, the Chairman of the Board, who also chairs the Corporate
Governance Committee, discusses the individual contribution of directors with
the President and Chief Executive Officer.
During the past fiscal year, director attendance at Board and committee meetings
was 86.8 %, i.e. 184 attendances out of a potential 212 for 34 meetings.
5. THE BOARD SHOULD IMPLEMENT A PROCESS TO BE CARRIED OUT BY
THE NOMINATING COMMITTEE OR OTHER APPROPRIATE COMMITTEE FOR
ASSESSING THE EFFECTIVENESS OF THE BOARD AS A WHOLE, THE COMMITTEES
OF THE BOARD AND THE CONTRIBUTION OF INDIVIDUAL DIRECTORS.
The Board has delegated to the Corporate Governance Committee the respon-
sibility for reviewing the methods used by the Board and its Committees for
overseeing the affairs of the Company, assessing the effectiveness of the Board
and its Committees in this regard and making recommendations to the Board
for any improvements that could be made to corporate governance practices.
To discharge this responsibility, the Committee sends self-assessment
questionnaires to directors and committee members concerning their per-
formance with respect to corporate governance matters. Directors are also asked
for their comments and suggestions and for their opinions about the performance
of the Chairman of the Board. The results are communicated to all of the Directors,
reviewed by each committee as well as the Board, which is provided with
comments and recommendations by the Corporate Governance Committee. This
process is carried out every two years.
6. EVERY CORPORATION SHOULD PROVIDE AN ORIENTATION AND EDUCATION
PROGRAM FOR NEW RECRUITS TO THE BOARD.
Every new director is provided with a manual that includes a description of
the Company and the Partnership, a summary of the duties, obligations
and responsibilities of a director as well as a copy of the mandates of the Board
and its committees. Every new director is also invited to meet with senior
executives in order to acquire an understanding of each sector of activity and
to get to know the executives.
In addition, management ensures, by means of Board meeting presentations, that
directors are familiar with the business of the Partnership and the industry.
Management is also always available to hold information sessions for directors.
7. EVERY BOARD SHOULD EXAMINE ITS SIZE AND, WITH A VIEW TO DETER-
MINING THE IMPACT OF THE NUMBER UPON EFFECTIVENESS, UNDERTAKE
WHERE APPROPRIATE, A PROGRAM TO REDUCE THE NUMBER OF DIRECTORS TO
A NUMBER WHICH FACILITATES MORE EFFECTIVE DECISION-MAKING.
The Board is made up of 14 directors, 7 of whom are officers of companies
that are direct or indirect shareholders of Noverco. In view of the foregoing and
the effort made to have directors who are independent of the sole shareholder,
the size of the Board appears appropriate and provides an optimal range
of competencies and diverse experience.
The Corporate Governance Committee, through its Chairman, who is also the
Chairman of the Board, provides the sole shareholder with his opinion about the
number of directors and the composition of the Board.
8. THE BOARD SHOULD REVIEW THE ADEQUACY AND FORM OF THE COMPENSA-
TION OF DIRECTORS AND ENSURE THE COMPENSATION REALISTICALLY REFLECTS
THE RESPONSIBILITIES AND RISK INVOLVED IN BEING AN EFFECTIVE DIRECTOR.
The Corporate Governance Committee periodically reviews director compensation
in light of the practices in comparable businesses and makes recommendations
to the Board in this regard. (Information about Director compensation is reported
in the Company’s Annual Information Form in the absence of a Partnership’s
Information Circular).
Directors who receive director compensation in a personal capacity are currently
required to own at least 2,000 units of the Partnership.
9. COMMITTEES OF THE BOARD OF DIRECTORS SHOULD GENERALLY BE COM-
POSED OF OUTSIDE DIRECTORS, A MAJORITY OF WHOM ARE UNRELATED DIRECTORS.
Except for the Executive Committee, which has the President and Chief Executive
Officer as a member, the Board’s committees are made up solely of outside
unrelated directors.
10. EVERY BOARD OF DIRECTORS SHOULD EXPRESSLY ASSUME RESPON-
SIBILITY FOR, OR ASSIGN TO A COMMITTEE OF DIRECTORS, THE GENERAL
RESPONSIBILITY FOR DEVELOPING THE CORPORATION’S APPROACH TO
GOVERNANCE ISSUES. THIS COMMITTEE WOULD, AMONGST OTHER THINGS, BE
RESPONSIBLE FOR THE CORPORATION’S RESPONSE TO THE TORONTO STOCK
EXCHANGE GUIDELINES.
The Corporate Governance Committee is responsible for reviewing practices
followed by the Board and its committees in overseeing the management of the
Company’s affairs, assessing Board effectiveness in this regard and making
recommendations to the Board for improvements to corporate governance
practices. The Committee met 4 times during the 2004 year.
11. A) THE BOARD OF DIRECTORS, TOGETHER WITH THE CEO, SHOULD
DEVELOP POSITION DESCRIPTIONS FOR THE BOARD AND THE CEO, INVOLVING
THE LIMITS TO MANAGEMENT’S RESPONSIBILITIES.
The Board adopted a written mandate which sets forth the responsibilities
it reserves to itself as well as the main responsibilities delegated to the President
and Chief Executive Officer. In addition, the Board has approved a written mandate
for each of its committees. These mandates are part of the Directors’ Manual.
The mandates of the Corporate Governance Committee and the Audit Committee
are set out in the comments on the policies and practices with respect to the
Guidelines. The mandates of the other committees can be summarized as follows:
The Executive Committee exercises all of the powers of the Board, subject
to restrictions imposed by law or by the Board from time to time. There were
no meetings of the Executive Committee during 2004.
The Human Resources Committee reviews all human resources matters for which
the Board is responsible and makes the financial decision with respect to certain
of these matters. The Committee met 4 times during the 2004 year. (The Committee’s
report on senior executive compensation is published in the Company’s Annual
Information Form in the absence of a Partnership’s Information Circular).
The Pension Fund Committee has a twofold mandate. It oversees pension fund
management, which is looked after by the pension committees created by law.
These committees have delegated their responsibilities with respect to the
investment policy of the pension fund to the Committee as well as the selection
and monitoring of fund managers. The Committee met 8 times during the 2004 year.
BOARD OF DIRECTORS’ STATEMENT ON CORPORATE
GOVERNANCE PRACTICES
74 G A Z M É T R O L I M I T E D P A R T N E R S H I P
2 0 0 4 A N N U A L R E P O R T
B) THE BOARD SHOULD APPROVE OR DEVELOP THE CORPORATE OBJECTIVES
WHICH THE CEO IS RESPONSIBLE FOR MEETING.
Every year, the Human Resources Committee reviews the performance of
the Partnership and the President and Chief Executive Officer in terms of the
annual and multi-year corporate and personal objectives agreed upon between
him, the Committee and the Board. The results of the Committee’s review are
communicated to the Board, which also makes an overall assessment of the
performance of the Partnership and the President and Chief Executive Officer.
12. A) EVERY BOARD OF DIRECTORS SHOULD HAVE IN PLACE APPROPRIATE
STRUCTURES AND PROCEDURES TO ENSURE THE BOARD CAN FUNCTION
INDEPENDENTLY OF MANAGEMENT. AN APPROPRIATE STRUCTURE WOULD
BE TO: (I) APPOINT A CHAIR OF THE BOARD WHO IS NOT A MEMBER OF
MANAGEMENT WITH RESPONSIBILITY TO ENSURE THE BOARD DISCHARGES
ITS RESPONSIBILITIES OR (II) ADOPT ALTERNATE MEANS SUCH AS ASSIGNING
THIS RESPONSIBILITY TO A COMMITTEE OF THE BOARD OR TO A DIRECTOR,
SOMETIMES REFERRED TO AS THE “LEAD DIRECTOR”.
Board independence is ensured by the fact that 13 out of 14 individuals are
outside unrelated directors. In addition, the Board is chaired by an outside director
and a written description of his responsibilities has been approved by the Board.
B) APPROPRIATE PROCEDURES MAY INVOLVE THE BOARD MEETING ON A
REGULAR BASIS WITHOUT MANAGEMENT PRESENT OR MAY INVOLVE
EXPRESSLY ASSIGNING THE RESPONSIBILITY FOR ADMINISTERING THE
BOARD’S RELATIONSHIP TO MANAGEMENT TO A COMMITTEE OF THE BOARD.
Outside directors hold closed-door sessions from time to time, for example,
following the presentation of a strategic plan or a budget.
In order for the Board to discharge its corporate governance responsibilities,
the Corporate Governance Committee periodically reviews with management the
mandates of the Board and its committees, their responsibilities, the quality
of the documentation provided, the organization and frequency of meetings,
follow-up of management decisions as well as communications between directors
and management.
13. A) THE AUDIT COMMITTEE OF EVERY BOARD OF DIRECTORS SHOULD BE
COMPOSED ONLY OF OUTSIDE DIRECTORS.
The Audit Committee is composed solely of outside directors. Their professional
education and experience provide all of the Committee’s members with the
necessary qualifications for dealing with financial information. The Chairman
of the Committee is a chartered accountant. Another member has an MBA
in Finance and is a certified general accountant.
B) THE ROLES AND RESPONSIBILITIES OF THE AUDIT COMMITTEE SHOULD BE
SPECIFICALLY DEFINED SO AS TO PROVIDE APPROPRIATE GUIDANCE TO AUDIT
COMMITTEE MEMBERS AS TO THEIR DUTIES. THE AUDIT COMMITTEE DUTIES
SHOULD INCLUDE OVERSIGHT RESPONSIBILITY FOR MANAGEMENT REPORTING
ON INTERNAL CONTROL. WHILE IT IS MANAGEMENT’S RESPONSIBILITY TO
DESIGN AND IMPLEMENT AN EFFECTIVE SYSTEM OF INTERNAL CONTROL, IT IS
THE RESPONSIBILITY OF THE AUDIT COMMITTEE TO ENSURE THAT MANAGE-
MENT HAS DONE SO.
The Committee is responsible for reviewing the financial information published
by the Company and the Partnership, as well as how the risks that may affect the
financial well-being of the organization are managed. It shall ensure that:
there is an adequate risk management program for protecting the
organization’s assets;
both the external and internal auditors are independent and that it has
approved their audit plans;
financial information transmitted to directors and the investing public is
complete and objective.
The Committee’s specific responsibilities are broken down into five areas;
namely, external audit and external auditors, financial information, internal audit
and risk management. The Committee met 6 times during the 2004 year. (The
Committee mandate will be part of the Company’s Annual information form.)
C) THE AUDIT COMMITTEE SHOULD HAVE DIRECT COMMUNICATION CHANNELS
WITH THE INTERNAL AND EXTERNAL AUDITORS TO DISCUSS AND REVIEW
SPECIFIC ISSUES AS APPROPRIATE.
The external auditors attend every Audit Committee meeting and, from time to
time, Committee members discuss specific matters with them in closed-door
sessions, i.e. without the presence of management representatives. This practice
is also be followed with the internal auditors, who make periodic reports to the
Committee. In addition, the Coordinator, Internal Audit Services has an individual
meeting each year with both the Chairman of the Audit Committee and the
Chairman of the Board.
14. THE BOARD OF DIRECTORS SHOULD IMPLEMENT A SYSTEM WHICH
ENABLES AN INDIVIDUAL DIRECTOR TO ENGAGE AN OUTSIDE ADVISER AT THE
EXPENSE OF THE CORPORATION IN APPROPRIATE CIRCUMSTANCES.
THE ENGAGEMENT OF THE OUTSIDE ADVISER SHOULD BE SUBJECT TO THE
APPROVAL OF AN APPROPRIATE COMMITTEE OF THE BOARD.
Should a director wish to engage an outside consultant at the Company’s
expense, he (she) may do so with the prior approval of the Board or the Executive
Committee or, in the case of an emergency, the Chairman of the Board.
BOARD OF DIRECTORS’ STATEMENT ON CORPORATE GOVERNANCE PRACTICES
75G A Z M É T R O L I M I T E D P A R T N E R S H I P
2 0 0 4 A N N U A L R E P O R T
DIRECTORS AND OFFICERS
BOARD OF DIRECTORS
JEAN ABITEBOULInternational Executive
Vice President
Gaz de France
PIERRE ANCTIL 3
Executive Vice President,
Office of the President
SNC-Lavalin Group Inc.
MEL F. BELICHGroup Vice President,
International and Corporate Law
Enbridge Inc.
JEAN-GUY DESJARDINS 4, 5
Chairman of the Board and Chief
Executive Officer
Centria inc.
NICOLLE FORGET 3, 5
Corporate Director
GHISLAIN GAUTHIER 1, 2
Senior Vice President, Investments
CDP Capital–Private Equity
LOUIS P. GIGNAC 1, 4, 5
President and Chief
Executive Officer
Cambior Inc.
EMMANUEL HEDDEVice President, Projects and
Business Development Division
Gaz de France
PHILIPPE HOCHART 1, 2
Representative for
North America
Gaz de France
STEPHEN J.J. LETWIN 1, 2
Group Vice President,
Gas Strategy and
Corporate Development
Enbridge Inc.
PIERRE MICHAUD 4
Chairman of the Board
Provigo inc.
ROBERT PARIZEAU 1, 2, 3, 4, 5
(Chairman of the Board)
Chairman of the Board
AON Parizeau Inc.
RÉAL SUREAU 2, 3
Corporate Director and
President of Sureau
Management Limited
ROBERT TESSIER 1
President and Chief
Executive Officer
Gaz Métro inc.
MANAGEMENT ROBERT TESSIERPresident and Chief Executive Officer
RENÉ BÉDARDVice President, Legal Affairs and
Corporate Secretary
SOPHIE BROCHUVice President, Customer
and Gas Supply
JACQUES CHARRONVice President, Operations
PIERRE DESPARSVice President, Finance
and Corporate Affairs
SERGE RÉGNIERVice President,
Human Resources,
Quality and Internal
Communications
LUC SICOTTEVice President, Strategic
Planning Gaz Métro
and President and
Chief Executive Officer of
Gaz Métropolitain Plus
JEAN SIMARDVice President, Public
and Governmental Affairs
1 Member of the Executive Committee 2 Member of the Audit Committee 3 Member of the Pension Fund Committee
4 Member of the Human Resources Committee 5 Member of the Corporate Governance Committee
76 G A Z M É T R O L I M I T E D P A R T N E R S H I P
2 0 0 4 A N N U A L R E P O R T
OFFICES
GAZ MÉTRO HEAD OFFICE1717 du Havre
Montreal, Quebec
H2K 2X3
(514) 598-3444
EASTERN MONTREAL11401 L.-J. Forget
Anjou, Quebec
H1J 2Z8
(514) 356-8777
WESTERN MONTREAL2200 de Cannes-Brûlées
Lasalle, Quebec
H8N 2Z2
(514) 367-6800
ABITIBI-TÉMISCAMINGUE145 Quebec Blvd.
Rouyn-Noranda, Quebec
J9X 6M8
(819) 797-2111
EASTERN TOWNSHIPS240 Léger
Sherbrooke, Quebec
J1L 1M1
(819) 564-1311
LAURENTIANS1230 Michèle-Bohec
Blainville, Quebec
J7C 5S4
(450) 434-4091
MAURICIE929 Père-Daniel
Trois-Rivières, Quebec
G9A 2W9
(819) 372-1242
MONTÉRÉGIE4305 Lapinière
Brossard, Quebec
J4Z 3H8
(450) 443-7001
QUEBEC CITY2388 Einstein
Quebec, Quebec
G1P 3S2
(418) 577-5500
SAGUENAY-LAC ST-JEAN1100 Bersimis
Chicoutimi, Quebec
G7K 1A1
(418) 696-2231
SUBSIDIARIES AND AFFILIATES
GAZ MÉTROPOLITAIN PLUS INC .
1350 Nobel
Boucherville, Quebec
J4B 5H3
(450) 641-6300
Luc Sicotte
President and Chief
Executive Officer
CONSULGAZ INC.1350 Nobel
Boucherville, Quebec
J4B 5H3
(450) 641-6300
Luc Sicotte
President and Chief
Executive Officer
CLIMATISATION ET CHAUFFAGE URBAINS DE MONTRÉAL, S.E.C.1350 Nobel
Boucherville, Quebec
J4B 5H3
(450) 641-6300
Luc Sicotte
President and Chief
Executive Officer,
Gaz Métropolitain Plus Inc.
SOGENER INC.1350 Nobel
Boucherville, Quebec
J4B 5H3
(450) 641-6300
Luc Sicotte
President and Chief
Executive Officer
VDN CABLE INC.2600 Ontario Street East
Suite 152
Montreal, Quebec
H2K 4K4
(514) 522-1590
Philip Gale
President
TELDIG SYSTEMS INC.575 Saint-Joseph East
Quebec, Quebec
G1K 3B7
(418) 948-1314
1 800 501-5554
Jacques Therrien
President
TRANS QUEBEC & MARITIMESPIPELINE INC.6300 Auteuil
Suite 525
Brossard, Quebec
J4Z 3P2
(450) 462-5300
Réjean Laforge
President
VERMONT GAS SYSTEMS, INC.85 Swift Street
South Burlington,
Vermont 05403 USA
(802) 863-4511
A. Donald Gilbert, Jr.
President and Chief
Executive Officer
AQUA-REHAB, INC.2145 Michelin
Laval, Quebec
H7L 5B8
(450) 687-3472
Georges Dorval
President
AQUA DATA INC.95–5th Avenue
Pincourt, Quebec
J7V 5K8
(514) 425-1010
Gordon Halliday
President
CHAMPION PIPE LINE CORPORATION LIMITED1717 du Havre
Montreal, Quebec
H2K 2X3
(514) 598-3444
Jacques Charron
President
PORTLAND NATURAL GASTRANSMISSION SYSTEMOne Harbour Place
Suite 375
Portsmouth,
New Hampshire 03801 USA
(603) 559-5501
Richard H. Leehr
President
M.S.C. RÉHABILITATION INC.2145 Michelin
Laval, Quebec
H7L 5B8
(450) 661-1672
Sylvain Comeau
General Manager
SERVITECH COMBUSTION INC.12020 Albert-Hudon
Montréal-Nord, Quebec
H1G 3K7
(514) 353-6732
Luc Sicotte
President and Chief
Executive Officer
77G A Z M É T R O L I M I T E D P A R T N E R S H I P
2 0 0 4 A N N U A L R E P O R T
INFORMATION FOR PARTNERS
PARTNERSHIP’S UNITS
Listed on the Toronto Stock Exchange under the symbol GZM.UN.
Unit prices for the last two fiscal years ended September 30:
2004 2003
High $22.73 $20.86
Low $19.40 $17.50
114.5 million outstanding units with a fair value of $2.4 billion as at
September 30, 2004. At the same date, the market value of the 29.0 million
units held by the public was $609.4 million.
UNIT TAX FEATURES
Since January 1, 1999, the Partnership’s units have been excluded from
the definition of foreign property and have therefore been an eligible
investment for RRSP purposes without any foreign property restrictions.
The Income Tax Act requires the Partnership to allocate Partners their share
of the Limited Partnership’s taxable income. Under the terms of Gaz Métro’s
Partnership Agreement, this allocation is made on a pro rata basis in accordance
with distributions received by each Partner.
The taxable income allocated to each Partner is primarily considered as
business income. However, other types of income may be earned and allocated
to Partners. Additional information is available under the “Income Distributions”
heading of the “Investor Relations” section of Gaz Métro’s Internet site.
A Partner who was allocated a share of the Partnership’s taxable income has
to file both Quebec and federal income tax returns regardless of his/her
province or country of residence because the taxable income allocated is
business income earned in Quebec. The taxable income allocated to each
Partner will be shown on the T5013 (federal) and Relevé 15 (Quebec) slips.
A Partner who owns the Partnership’s units in a non-taxable vehicle, such as
a RRSP, will not receive the T5013 and Relevé 15 slips since the income
earned in these vehicles is taxable only when it is withdrawn from the plan.
The Partnership’s taxable income differs from accounting income due to
differences between the federal and Quebec tax legislation and generally
accepted accounting principles. Since 1993, taxable income has, on average,
exceeded distributions by 7.6% for federal purposes and 6.9% for Quebec
purposes. Historically, the spreads have been as high as +26.8% (unfavourable
spread for a taxable Partner) and as low as -18.1% (favourable spread for a
taxable Partner). For the fiscal year ended September 30, 2004, taxable
income exceeded distributions by 3.2% for federal purposes and 4.2% for
Quebec purposes.
When a Partner sells his/her units, the amount by which the taxable income
exceeds the distributions received will increase the adjusted cost base
(“ACB”), thereby decreasing the capital gain or increasing the capital loss,
depending on the selling price. To calculate the ACB, a Partner will have to add
to his/her purchase cost the taxable income allocated to him/her every year
and deduct the total distributions received.
Under the terms of Gaz Métro’s Partnership Agreement, a Partner who is
a “non-resident” of Canada can be required by the Partnership to sell his/her
units to a person who is not a “non-resident” for purposes of the Income
Tax Act (Canada).
The income of a limited Partner who does not participate actively in the
Partnership’s business is not self-employment income subject to Quebec
Pension Plan contributions.
INCOME DISTRIBUTIONS
Policy is to distribute virtually all of the income in each fiscal year.
Quarterly distributions are paid on the first Gaz Métro working day following
the end of a calendar quarter, i.e. the first working day of January, April, July
and October. They are paid to Partners of record at the close of business on
December 15, March 15, June 15 and September 15 or, if the Toronto Stock
Exchange is not open that day, the first day on which it is.
The Partnership approved a quarterly distribution of $0.34 per unit payable
on January 5, 2005.
Partners may request that their income distributions be deposited directly
into a Canadian bank account. This rapid, reliable and convenient service is
offered by most banks and other financial institutions. To take advantage of
this direct deposit service, contact CIBC Mellon at 1-800-387-0825.
TRANSFER AGENT
CIBC Mellon
ANNUAL MEETING
The Partnership’s annual meeting of Partners will be held at 2:00 p.m.,
Wednesday, February 2, 2005, at Mount-Royal Center, 2200, Mansfield Street,
Salon International I and II, Montreal, Quebec.
PUBLICATION OF RESULTS
Following approval by the Board of Directors, the quarterly results will be
published around the following dates:
1st quarter: February 2, 2005 3rd quarter: August 3, 2005
2nd quarter: May 5, 2005 4th quarter: November 22, 2005
INVESTOR RELATIONS
1717 du Havre, Montreal, Quebec, H2K 2X3
Telephone: (514) 598-3324 or (514) 598-3534
Fax: (514) 521-8168
E-mail: [email protected]
Ce document est disponible en français.DES
IGN
:W
WW
.NO
LIN
.CA
Prin
ted
in C
anad
a
Photographers: Yves Beaulieu, Manon Boyer
Quarterly reports, annual report and press releases are accessible through
our Internet site: www.gazmetro.com

GA
Z MÉ
TRO
LIMITE
D PA
RTN
ER
SH
IP2004 A
NN
UA
L RE
PO
RT