2003 wireless lan benefits study -...
TRANSCRIPT

Cisco Systems, Inc.All contents are Copyright © 1992–2003 Cisco Systems, Inc. All rights reserved. Important Notices and Privacy Statement.
Page 1 of 28
Benefits Study
2003
Wireless LAN
Benefits Study
Conducted by NOP World Technology on Behalf of Cisco Systems
November, 2003
Executive Summary
While the horizontal deployment of
wireless LANs within mid-size and large
organizations (100+ employees) has not yet
been fully realized, the 2003 Wireless LAN
Benefits Study points to significant rates of
penetration in sectors such as education,
government, manufacturing, and
healthcare. There is also greater production
roll-out within these key sectors and an
expectation of even more widespread
deployment in the next two years—an
acknowledgement of the value of wireless
LANs.
Although the positive benefits of wireless
LANs may appear to be logical—even
common-sense—the findings of this
research indicate that work still needs to be
done in educating the market on the
benefits of the technology
post-implementation
. In particular,
communicated benefits tend to focus on the
extent to which wireless LANs make users'
life at work easier—without
communicating the f
inancial benefit to the
organization
of increased productivity. This
quantitative study, conducted for Cisco
Systems by independent research firm NOP
World Technology, was designed to do just
this.
Highlights of the study findings include the
following:
• Among the most significant results
revealed by end users was that using
wireless LANs gives them the
opportunity to be connected to the
network, on average, over 3.5 more
hours per day—up from 1.75 hours in
2001. With the additional connection
time provided by the freedom and
mobility of wireless LANs, end users
reported they are as much as 27 percent
more productive than they would
otherwise be.
• Wireless LANs are increasing employee
productivity by enabling users to do
their work when and where it is
convenient for them—whether at work,
at home, or on the road. The 2003 study
points to increasing business
implementation of wireless networks in
employees’ homes, as well as significant
hot spot usage while on the move (in
airport lounges, coffee shops, and
hotels). The ability to conduct business
whenever the employee requires it and
wherever the employee may be located
has contributed to a reported time
savings of almost 90 minutes per
employee per workday—an increase of
almost half an hour per day over 2001.

Cisco Systems, Inc.All contents are Copyright © 1992–2003 Cisco Systems, Inc. All rights reserved. Important Notices and Privacy Statement.
Page 2 of 28
• Study findings also show that organizations realize greater financial returns as wireless LAN technology is rolled
out to more users and departments within organizations. Almost a quarter of employees within mid-size and large
organizations access the wireless LAN today, growing from 16% in 2001. This increase in deployment, plus the
reported additional time savings, has resulted in the rise in annual dollar value of time saved per employee to
almost $14K today, up from just over $7K in 2001. With IT respondents predicting that 50% of their employees
will have access to the wireless LAN in the next two years, their organizations can expect to realize even greater
financial returns in the very near future.
• An added benefit of wireless LAN use revealed by the NOP study is greater accuracy in everyday tasks, with
nearly two thirds of end user respondents reporting that their accuracy was improved. The average gain in
accuracy by those who reported an improvement was estimated at 41 percent. For respondents from healthcare
organizations, 70 percent felt the improvement in accuracy was noticeable—the “anytime, anywhere” aspect of
wireless communications helps medical staff ensure patient health and safety by being able to access and record
patient information at the point of care.
• This study further validates findings that other studies have shown—that the propensity for increased WLAN
deployment is tied to the adoption of portable devices (80% of WLAN users in this study use laptop PCs). And,
as these devices increasingly come with an embedded WLAN capability, it will be easier for organizations to
deploy this technology. Results from the study indicate that 50% of PDA users access the wireless LAN using
embedded 802.11 technology, and 20% of IT respondents say that all of the notebooks they purchased in the
past year came with an embedded WLAN capability.
1.0 Introduction
1.1 Project Background
While the ubiquitous implementation of networking products in U.S. organizations, as well as the continued
development of the Internet as a business tool, represent robust declarations of the benefits of shared information
resources, the role of technology in driving forward core business lines has been lost over the course of the last couple
of years, in a difficult economy.
This has led to organizations having an increasingly difficult time identifying the benefits of implementing many
technology products and services. In addition, and given uncertainty in global markets, there is a sense of trepidation
with regard to the adoption of many new technologies, however innovative they may appear to be. While technology
was once viewed as “a must” in order to maintain competitive advantage, there is now a real sense that investment
must be justified—and that benefits must be more clear-cut than they have been in the past.
While wireless LANs have been postulated to represent a major area for potential growth, widespread deployment
has yet to be realized. There remains a need to quantify the benefits offered by their implementation (including
increased flexibility, productivity, and cost savings). This research has been designed to provide the required
substantiation, within the parameters of the detailed objectives outlined below.

Cisco Systems, Inc.All contents are Copyright © 1992–2003 Cisco Systems, Inc. All rights reserved. Important Notices and Privacy Statement.
Page 3 of 28
1.2 Objectives
In 2001, Cisco Systems and NOP World Technology conducted a benchmark study, designed to assess the benefits
realized—and expected—from the deployment of wireless LANs.
Objectives for the 2001 study included the following:
• To obtain a more thorough understanding of how wireless LANs are being implemented in the U.S. marketplace,
corroborating and enhancing previous research conducted by Cisco Systems
• To provide in-depth insight into the perceived benefits of wireless LAN implementation
• To offer input into the challenges experienced by organizations who have deployed wireless LANs
• To provide detailed evidence of cost savings and/or benefit associated with the deployment of wireless LAN
technologies
Two years after this original study, Cisco decided to update this piece of work, in order to determine how the market
has changed in terms of:
• Level of deployment
• Implementation drivers (and barriers)
• Usage patterns
• Benefits experienced
• Brands installed
Taking the above into account, Cisco Systems and NOP World Technology defined an appropriate quantitative
methodology to provide for the most consummate insight into the market possible. This is outlined in Section 1.3.
1.3 Methodology
In view of the primary objective being a sound, representative update of changes in the marketplace since 2001, a
quantitative, telephone-based survey was decided as being the best approach for identifying the key benefits of
wireless LANs in the U.S. market.
As with the previous wave of WLAN research, there was a requirement to speak to both corporate IT managers with
responsibility for making strategic networking decisions, as well as end users of the WLAN. Typically, the former
consist of IT/MIS Managers/Directors with the key qualification criteria that the individual would have some level
of involvement in the purchase decision-making process for wireless LANs. The latter respondent type was to be
represented by a wide range of functional areas, with the minimum requirement that they use the wireless LAN at
least once a week.
The interviewing distribution consisted of 400+ mid-size and large organizations, sampled on a representative basis
from the US population of 100+ employee organizations. From this total number of organizations, 403 IT/MIS staff
were interviewed, with an additional 200 end users interviewed within the same organizations.
All sample was sourced from the Harte-Hanks database.

Cisco Systems, Inc.All contents are Copyright © 1992–2003 Cisco Systems, Inc. All rights reserved. Important Notices and Privacy Statement.
Page 4 of 28
2.0 Wireless LAN Users
As a starting point in understanding the continued growth in wireless LAN uptake in the U.S., it is essential that an
understanding of exactly who is using the technology is furthered. Intuitively, and according to previous research
conducted, this comprises three primary components: the types of organizations and departments implementing
wireless LANs, the employee functions most likely to use the technology, and the number of users of notebook or
other portable devices.
2.1 Firmographic Typology of Organizations Deploying WLANs
Figure 1
WLAN Penetration
While the overall penetration of wireless LANs has not significantly accelerated since 2001, a continued trend
towards rapid implementation in several vertical markets is seen. In particular, the manufacturing sector is rapidly
adopting the technology (23% compared to 10% in 2001). Education continues to have the highest WLAN
penetration (at 29%), followed by the healthcare and government sectors, with around 12 to 13% penetration.
Beyond these, most other sectors tend to be implementing wireless LANs at a relatively laggard pace (with an average
6% penetration).
On an overall level, there is not a great deal of difference between mid-size (100-999) and large (1000+) organizations
in terms of implementation rates (both around 12%).
Given there are not particularly well-defined differences by company size in terms of penetration, a fairly even spread
of 100+ employee organizations was surveyed.
12%
12%
12%
29%
23%
13%
12%
6%
Education
OVERALL
Healthcare/Medical
Government
OTHER SECTORS
Manufacturing
Base: All Respondents (603)
Total Respondents (603)
1,000+ Emps
100-999 Emps

Cisco Systems, Inc.All contents are Copyright © 1992–2003 Cisco Systems, Inc. All rights reserved. Important Notices and Privacy Statement.
Page 5 of 28
Figure 2
Size of Companies Surveyed
While a good range of employee sizes qualified for interview based on wireless LAN penetration, a full 14% of
organizations had more than 10,000 employees. Indeed, the interviewing distribution is skewed towards large
organizations in general—this is to be expected as many large organizations tend to adopt new technologies such as
wireless LANs.
6%
9%
12%
21%
17%
20%
17%
7%
9%
13%
22%
17%
16%
10%
4%
10%
12%
20%
19%
27%
14%
•
Q: Can you tell me approximately how many employees are in your company world-wide?Base: All Respondents (603)
10,000+
500–999
1,000–1,999
2,000–4,999
5,000–9,999
250–499
100–249
IT/MIS (403)End-Users (200)
Total Respondents (603)
Of the 403 IT/MIS respondents, 55% worked for organizations with 100-999 employees, and 45% for organizations with more than 1,000employees

Cisco Systems, Inc.All contents are Copyright © 1992–2003 Cisco Systems, Inc. All rights reserved. Important Notices and Privacy Statement.
Page 6 of 28
2.2 Functional Areas Using Wireless LANs
Within mid-size and large organizations that have implemented wireless LAN technology, IT/MIS respondents
estimate that
22% of employees on average have access to the technology, up from 16% in 2001
. The percentage of
WLAN users rises to as high as 33% of employees in the education sector, up from 20% in 2001, and to around 20%
in manufacturing, healthcare and government spheres.
The percentage of employees with access to wireless LANs is anticipated to continue to rise, with the education sector
continuing to take the lead. In a year’s time, education organizations in the US anticipate that over 50% of users will
have access to the wireless LAN and that almost two-thirds will have access in 2 years time. Strong growth in the
number of employees accessing the WLAN is also anticipated in the healthcare sector.
Figure 3
Percentage of Employees Accessing WLAN
Q: What proportion of employees at your company currently has access to the wireless LAN?
Q: What proportion do you think will have access to the WLAN in a year‘s time? Two year‘s time?
Base: All IT/MIS Respondents (2003: 403, 2001: 244)
Currently have Access
Access in 2 year‘s timeAccess in 1 year‘s time
21%
23%
17%
22%
18%
34%
40%
22%
33%
37%
28%
28%
36%
51%
44%
46%
63%
37%
53%
45%
37%
Education
Healthcare/Medical
Government
Manufacturing
TotalRespondents
Base:
179
126
75
66
(78)
(57)
(34)
(28)
403(244)
*NOTE: Figures are mean
1000+ Emps
100–999 Emps222(116)
181(128)
Cisco Systems, Inc.All contents are Copyright © 1992–2003 Cisco Systems, Inc. All rights reserved. Important Notices and Privacy Statement.
Page 7 of 28
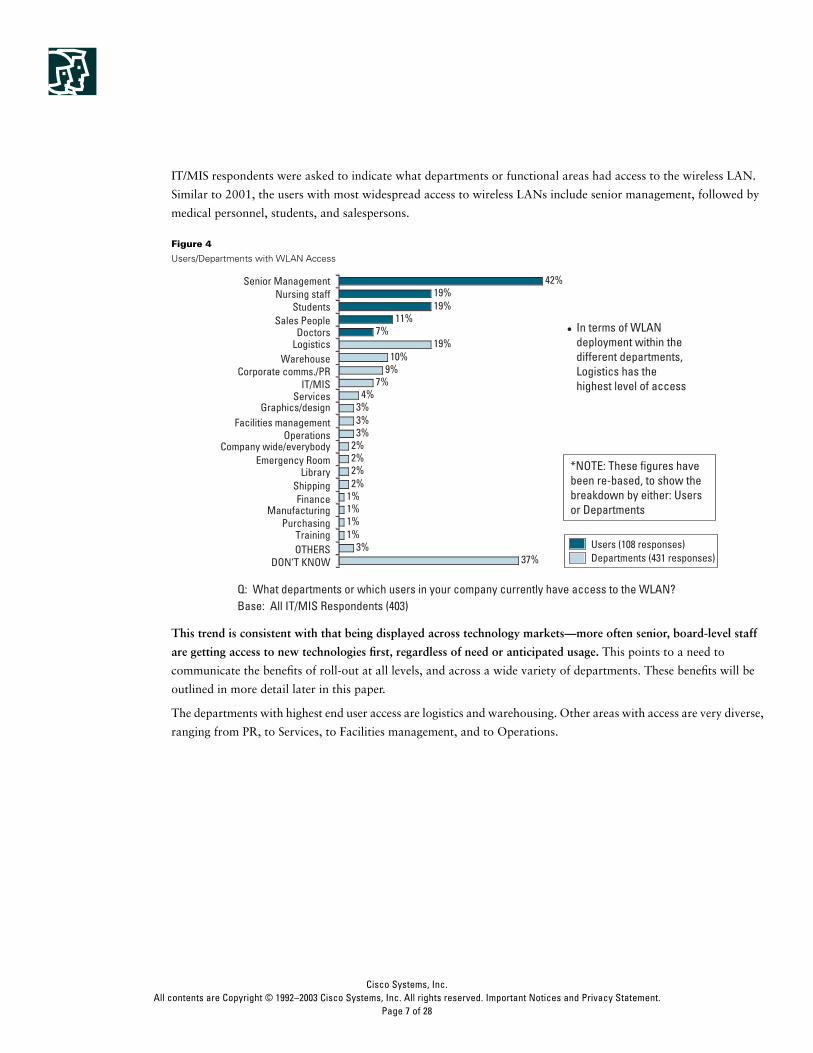
IT/MIS respondents were asked to indicate what departments or functional areas had access to the wireless LAN.
Similar to 2001, the users with most widespread access to wireless LANs include senior management, followed by
medical personnel, students, and salespersons.
Figure 4
Users/Departments with WLAN Access
This trend is consistent with that being displayed across technology markets—more often senior, board-level staff
are getting access to new technologies first, regardless of need or anticipated usage.
This points to a need to
communicate the benefits of roll-out at all levels, and across a wide variety of departments. These benefits will be
outlined in more detail later in this paper.
The departments with highest end user access are logistics and warehousing. Other areas with access are very diverse,
ranging from PR, to Services, to Facilities management, and to Operations.
42%19%19%
11%7%
19%10%
9%7%
4%3%3%3%
2%2%2%2%
1%1%1%1%
3%37%
•
Q: What departments or which users in your company currently have access to the WLAN? Base: All IT/MIS Respondents (403)
Senior Management
Logistics
Nursing staff
Operations
Sales People
Services
Warehouse
Users (108 responses)Departments (431 responses)
Corporate comms./PR
Graphics/designFacilities management
Company wide/everybody
Doctors
Students
Training
IT/MIS
FinanceManufacturing
Purchasing
OTHERSDON‘T KNOW
LibraryEmergency Room
Shipping
In terms of WLAN deployment within the different departments, Logistics has the highest level of access
*NOTE: These figures have been re-based, to show the breakdown by either: Users or Departments

Cisco Systems, Inc.All contents are Copyright © 1992–2003 Cisco Systems, Inc. All rights reserved. Important Notices and Privacy Statement.
Page 8 of 28
3.0 Use of Wireless LANs
Overall, 51% of respondents interviewed are using the WLAN either constantly (8%) or on a daily basis (43%). End
users are actually more likely to be using wireless LANs on a constant or daily basis than IT/MIS. This continues a
trend exhibited in the 2001 research.
Figure 5
Personal WLAN Usage
There are no particular patterns in usage frequency by vertical market or company size; however, the more staff that
have access to the WLAN, and the longer access structures have been in place, the more reliant respondents tend to
be on the technology.
22%
9%
5%
6%
6%
43%
8%
33%
7%
5%
5%
5%
37%
14%
4%
8%
8%
57%
10%7%
0%Less than once
a week
More than three timesa week (not daily)
Twice a week
Three times a week
Once a week
Constantly using
Daily
• Usage patterns aresimilar to thosereported in 2001
Q: On average, how many times per week would you say you personally use the wireless LAN?
Base: All Respondents (603)
IT/MIS (403)End-Users (200)
Total Respondents (603)

Cisco Systems, Inc.All contents are Copyright © 1992–2003 Cisco Systems, Inc. All rights reserved. Important Notices and Privacy Statement.
Page 9 of 28
3.1 Stages of Development
Overall,
almost 75% of organizations interviewed
have progressed with wireless LAN implementation to the stage
that the technology is i
n a production setting or being rolled out
on a wider basis. This is up from 60% in 2001. A
further 17% of companies interviewed are currently piloting wireless LANs within the organization, while only 9%
are still at the “beta test” stage, prior to a more comprehensive pilot.
Figure 6
Stage of WLAN Deployment
15%
9%
15%
9%
15%
8%
10%
9%
21%
6%
14%
10%
15%
25%
30%
19%
14%
19%
17%
21%
21%
26%
74%
73%
60%
77%
64%
9% 17%
20%
16%
18%
27%
69%
59%
77%
66%75%
55%
73%
60%
63%
• Overall, almost three-quarters (74%) of industriesare deploying the wireless LAN in production orwider roll-out format, compared to 60% in 2001.
Q: How are you deploying wireless LANs in your company?Base: All IT/MIS Respondents (2003: 403, 2001: 244)
Healthcare
Government
Manufacturing
Education 2003(2001)
2003(2001)
2003(2001)
2003(2001)
Base:
117
93
48
52
(78)
(57)
(34)
(28)
Total IT/MIS 2003(2001)
403(244)
1000+ 2003(2001)
100 - 999 2003(2001)
181(128)222
(116)
Beta Test
Pilot Program
In Production
Cisco Systems, Inc.All contents are Copyright © 1992–2003 Cisco Systems, Inc. All rights reserved. Important Notices and Privacy Statement.
Page 10 of 28
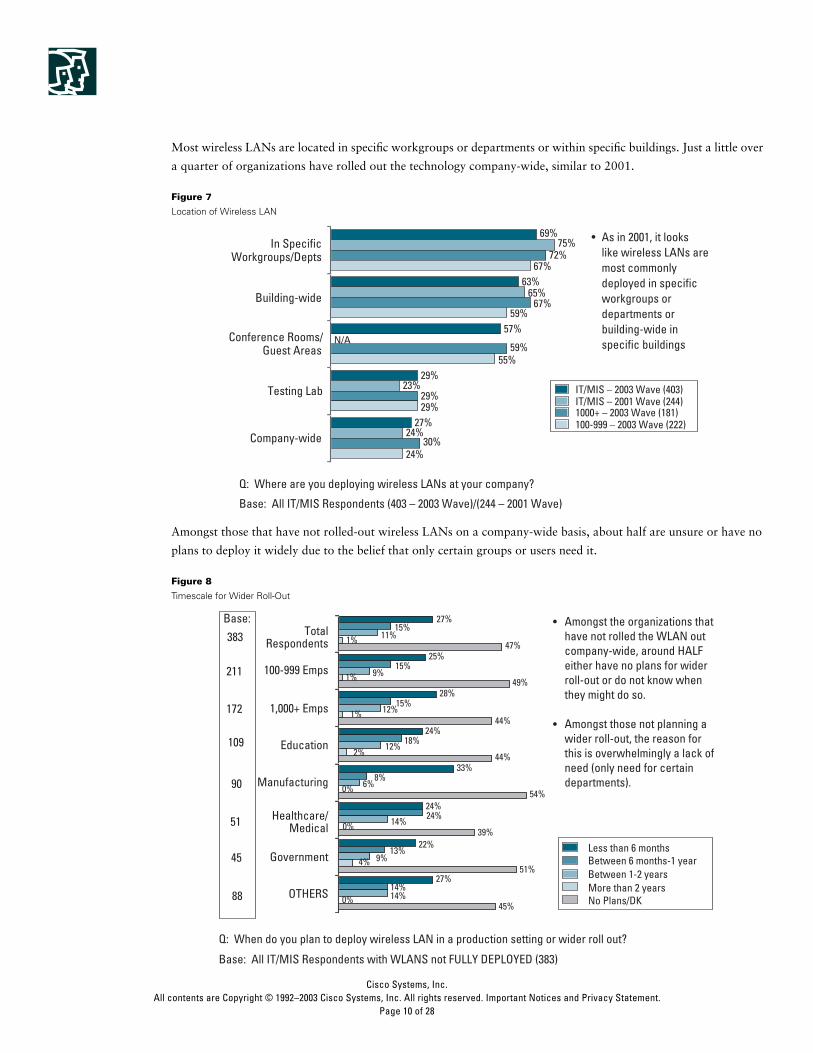
Most wireless LANs are located in specific workgroups or departments or within specific buildings. Just a little over
a quarter of organizations have rolled out the technology company-wide, similar to 2001.
Figure 7
Location of Wireless LAN
Amongst those that have not rolled-out wireless LANs on a company-wide basis, about half are unsure or have no
plans to deploy it widely due to the belief that only certain groups or users need it.
Figure 8
Timescale for Wider Roll-Out
69%
63%
57%
29%
27%
75%
65%
23%
24%
72%
67%
59%
29%
30%
67%
59%
55%
29%
24%
Testing Lab
Company-wide
In SpecificWorkgroups/Depts
Building-wide
Conference Rooms/Guest Areas
IT/MIS – 2003 Wave (403)IT/MIS – 2001 Wave (244)
N/A
• As in 2001, it lookslike wireless LANs aremost commonlydeployed in specificworkgroups ordepartments orbuilding-wide inspecific buildings
Q: Where are you deploying wireless LANs at your company?
Base: All IT/MIS Respondents (403 – 2003 Wave)/(244 – 2001 Wave)
1000+ – 2003 Wave (181)100-999 – 2003 Wave (222)
Q: When do you plan to deploy wireless LAN in a production setting or wider roll out?
Base: All IT/MIS Respondents with WLANS not FULLY DEPLOYED (383)
25%
28%
33%
24%
22%
27%
1%
0%
0%
47%
49%
44%
44%
54%
39%
51%
45%
27%
24%
14%
24%
15%
15%
8%
13%
15%
18%
9%
12%
12%
6%
14%
11%
14%
9%
1%
1%
2%
0%
4%
Education
Healthcare/Medical
Government
Manufacturing
•
•
Less than 6 months
More than 2 yearsBetween 1-2 yearsBetween 6 months-1 year
TotalRespondents
Base:
90
51
45
383
No Plans/DK
109
OTHERS
1,000+ Emps
100-999 Emps211
172
88
Amongst the organizations that have not rolled the WLAN out company-wide, around HALF either have no plans for wider roll-out or do not know when they might do so.
Amongst those not planning a wider roll-out, the reason for this is overwhelmingly a lack of need (only need for certain departments).

Cisco Systems, Inc.All contents are Copyright © 1992–2003 Cisco Systems, Inc. All rights reserved. Important Notices and Privacy Statement.
Page 11 of 28
Since 2001, length of wireless LAN use has matured significantly, especially in the education and government sectors.
Figure 9
Length of WLAN Use
Q: How long [has your company] have you been using a wireless LAN?
Base: All Respondents (2003: 603, 2001: 404) TOP BASE: 2003, BOTTOM: 2001
17%
16%
24%
23%
6%
19%
17%
33%
17%
8%
23%
21%
23%
21%
19%
30%
35%
38%
30%
32%
33%
32%
24%
29%
25%
34%
27%
39%
Education
Healthcare/Medical
Government
Manufacturing
Less than 6 months
More than 2 yearsBetween 1-2 yearsBetween 6 months-1 year
TotalRespondents
Base:
179
126
75
66
(78)
(57)
(34)
(28)
603*(404)
1000+ Emps
100-999 Emps
251(188)
352(216)
*NOTE: Figures for ‘Others’ are not shown

Cisco Systems, Inc.All contents are Copyright © 1992–2003 Cisco Systems, Inc. All rights reserved. Important Notices and Privacy Statement.
Page 12 of 28
3.2 Devices Used to Access Wireless LANs and Areas Where Used
Overall, over 80% of organizations with wireless LANS are using notebook or laptop computers as the primary
network access platform. This is on par with 2001 figures, indicating that notebooks/laptops still form the most
important means of access.
Notebooks/laptops are followed by desktops (at 41%—down from 47% in 2001) and PDAs or hand-held computers
(at 35%—up from 31% in 2001). This growth in PDA usage is being driven by sectors requiring high levels of
mobility, e.g. healthcare organizations and logistics/distribution environments in manufacturing organizations.
Figure 10
Device Used to Access WLAN
The percentage of laptop/notebook PCs installed in companies today is at about 20%, compared to 80% desktop
PCs. One could surmise that as portable PC purchases increase, and as these portable devices increasingly come with
an embedded WLAN capability, that more widespread deployment of wireless LANs will occur. Twenty percent of
IT/MIS respondents say that all of the laptops they bought last year came with an embedded WLAN capability. They
also reported that 50% of their PDA users connect to the wireless LAN using the embedded wireless LAN capability
in the PDA.
41%
35%
42%
83%
88%
41%
74%
24%
39%Desktop PCs
PDA/HandheldDevice
Notebooks /Laptop PCs
•
Q: What types of [client] devices do you personally use [are used] to access the wireless LAN [at your company]? Base: All Respondents (603)
IT/MIS (403)End-Users (200)
Total Respondents (603)
Using Desktop PCs is now less common, for both respondent-types, while use of PDAs has increased, particularly amongst IT managers in large companies

Cisco Systems, Inc.All contents are Copyright © 1992–2003 Cisco Systems, Inc. All rights reserved. Important Notices and Privacy Statement.
Page 13 of 28
IT/MIS respondents continue to tend to underestimate the extent to which the wireless LAN is actually accessed from
individual offices and cubicles by end users (as they did in 2001), believing that usage is slightly more disparate than
it actually is. Almost half of end users indicate that they access the wireless LAN from individual offices or cubicles,
compared to the IT estimate of 31%. Ten percent of end users also report using a wireless LAN at home.
Figure 11
Areas Where WLAN is Used
Differences by sector tend to only be marked for obvious differentiators; classrooms are obviously of particular
relevance for the education sector, and inventory areas/manufacturing floor environments tend to be of more specific
focus for manufacturing organizations.
31%
23%
47%
24%
33%
7%
14% 14%14%12%15%
7%11%
13%
8% 7%8%4% 4%5%
1%4% 3%4% 4%
1%
10%
3%4%2%
Q: Where do you personally [employees generally] use the wireless LAN?Base: All Respondents (603)
BuildingLobbies
Classrooms InventoryArea(s)
TrainingRoom(s)
Conference/MeetingRooms
Ind.Offices/Cubicles
ShippingAreas
WorkingOutdoors
Working atHome
IT/MIS (403)End-Users (200)
Total Respondents (603)
All Depts/Areas

Cisco Systems, Inc.All contents are Copyright © 1992–2003 Cisco Systems, Inc. All rights reserved. Important Notices and Privacy Statement.
Page 14 of 28
3.3 Key Wireless LAN Applications
Both IT/MIS and end user respondents were asked which key applications are used on the wireless LAN. While e-mail
and the Internet remain the key applications, custom applications in particular are of increasing significance.
Figure 12
Applications Used Over WLAN
The growth in use of custom applications points to the fact that manufacturing and healthcare organizations are
using wireless LANs to meet mobility requirements; for these organizations, there is not a single ‘killer application’
that is driving usage. Rather, these organizations are using applications that are customized for their industry.
IT/MIS respondents were asked what applications they thought end users might be making the most use of over the
wireless LAN; although they tend to slightly underestimate usage of all applications over the wireless LAN, their
perceptions of usage closely mirror actual application practice.
4%3%3%3%4%4%
5%4%4%
11%9%9%
11%21%
18%
34%26%28%
39%44%
42%43%
49%47%
Q: Which types of applications are [you] the employees at your company using over the WLAN?
Base: All Respondents (603)
•
MS Office files
Specialized/custom Apps.
Databaseapplications
Internet
Scheduling/calendars
Billing/inventorymanagement
Internal e-business
IT/MIS (403)End-Users (200)
Total Respondents (603)
The use of specialized or custom applications has grown considerably over 2001, particularly in manufacturing and healthcare industries (using PDAs)

Cisco Systems, Inc.All contents are Copyright © 1992–2003 Cisco Systems, Inc. All rights reserved. Important Notices and Privacy Statement.
Page 15 of 28
3.4 Brand of WLAN Access Point Installed
Almost half of the organizations surveyed report having Cisco wireless LAN access points installed, followed by 17%
reporting having Linksys, and 7% having 3Com and D-Link.
Figure 13
Brand of WLAN Access Points Used
Q: Which brand(s) of wireless LAN access points do you currently use at your site?Base: All IT/MIS Respondents (403)
IT/MIS–1000+ (181)
Total IT/MIS (403)IT/MIS–100-999 (222)
17%
7%
5%
5%
3%
19%
7%
3%
4%1%
5%
6%
47%
7%
9%
8%
4%
38%
8%
14%
5%
6%
3%
3%
59%
7%
7%
3Com
Enterasys/Cabletron
D-Link
Symbol
Cisco/Aironet
Apple/Airport
Linksys
Intermec
Agere/Lucent/Orinoco

Cisco Systems, Inc.All contents are Copyright © 1992–2003 Cisco Systems, Inc. All rights reserved. Important Notices and Privacy Statement.
Page 16 of 28
4.0 Familiarity/Usage of “Hot Spots” and Outdoor Wireless Bridges
4.1
Familiarity/Usage of Hot Spots
77% of respondents are familiar with the concept of “hot spots,”
defined as areas outside of the office (or home) that
allow users access to the company network or the Internet. This compares to 61% who were aware in 2001. As might
be expected, this figure remains higher for IT/MIS respondents—although around 65% of end users are aware of hot
spots. This awareness tends to be consistent regardless of any other demographic or firmographic attributes.
Almost a third of respondent organizations have staff utilizing wireless LANs in these “hot spots,” up from 13% in
2001, exhibiting significant growth. This usage figure is fairly consistent across all sizes of company.
Figure 14
Hot Spot Familiarity/Usage
Among end users aware of hot spots, but not yet using them, 61% are interested in taking advantage of the capability
(up from 54% in 2001). Almost two-thirds of IT/MIS respondents think end users would be interested in using hot
spots. End users in the manufacturing sector appear to be most interested in the technology (74%), despite lack of
regular experience of an “off-campus environment.”
Airport lounges (66%), coffee shops (33%) and various hotel environments are the most frequently used hot
spots—the need for access while traveling is therefore driving this usage. Over 75% of respondent organizations
provide the technology for their staff to access these hot spots.
4.2 Familiarity/Usage of Outdoor Wireless Bridges
Two-thirds of IT/MIS respondents are aware of the concept of outdoor wireless bridges, with awareness as high as
85% amongst education organizations.
Q: To what extent do wireless LANs provide the following benefits?Base: All End-Users (200)
31%32%
36%39%
42%43%43%
48%50%
63%82%
85%
87%Convenience
Time savings
MobilityFlexibility
Better workgroup collaborationBetter responsiveness
Increased competitive advantage
Productivity gains
Better customer/patient care
Guest internet accessReducing errors
Quicker decision-making
Improved company image
All respondents answering 8-10
NOTE: This chart is based on a scale of 1 to 10, where 1=‘Has no impact whatsoever’ and 10=‘Has a significant impact’.

Cisco Systems, Inc.All contents are Copyright © 1992–2003 Cisco Systems, Inc. All rights reserved. Important Notices and Privacy Statement.
Page 17 of 28
Figure 15
Outdoor Wireless Bridge Awareness
Overall, amongst those aware of outdoor bridges, around a third have already deployed them (31% overall)—and
as many as 50% of government organizations have done so.
Q: Have you heard of outdoor wireless bridges?
Base: All IT/MIS Respondents (403)
15%85%
42%58%
32%
68%
28%72%
32%
68%
Education
Healthcare/Medical
Government
Manufacturing
•
•
•
Base:
117
93
52
48
OVERALL403
NoYes
About 2 out of 3 IT respondents are aware of outdoor wireless bridges.
There is greater awareness within the Government sector, with 85% of IT/MIS respondents saying they are aware of them
No significantdifferences by company size (100-999 – 70%), (1000+ – 66%).

Cisco Systems, Inc.All contents are Copyright © 1992–2003 Cisco Systems, Inc. All rights reserved. Important Notices and Privacy Statement.
Page 18 of 28
Figure 16
Stage of Outdoor Bridge Deployment
5.0 Benefits of Wireless LANs
A primary objective of the 2003 Wireless LAN Benefits research revolved around ascertaining the
perceived
benefits
of wireless LAN use. Initially, respondents were asked for their “top-of-mind,” un-prompted insight into what they
view as the primary benefits of wireless LAN implementation.
Education
Healthcare/Medical
Government
Manufacturing
29%
33%
33%
24%
49%
30%
2%
13%
19%
20%
38%
42%
33%
30%
51%
17%
37%
31% 2%
1%
3%
2%
14%
15%
13%
15%
17%
15%
7%
20%
19%
13%
15%
Investigating them or
planning to investigate
No plans to
evaluate/ investigate
Have deployed
Actively piloting
Evaluating them
Q: Which one of the following describes where your organization is in regard to deploying wireless bridges?
Base: All IT/MIS Respondents aware of wireless outdoor bridges (276)
OVERALLBase:
120
63
30
41
276
100-999 Emps
1,000+ Emps
84
156
Note: About 21% of organizations with WLANs have deployed wireless bridges.

Cisco Systems, Inc.All contents are Copyright © 1992–2003 Cisco Systems, Inc. All rights reserved. Important Notices and Privacy Statement.
Page 19 of 28
5.1 Un-prompted Benefits of Wireless LANs
An initial appraisal of respondent perception points to the fact that aspects of
mobility
and the convenience it
provides come to the forefront as the most important benefits of wireless LANs.
Figure 17
Main Benefits of WLAN—Unaided
This is consistent with the 2001 findings, with the lack of need for cabling again mentioned as significant by both IT/
MIS and end user respondents (possibly for different reasons).
Examples of some un-prompted respondent feedback on the benefits of wireless LANs from the 2003 study are as
follows:
“Being able to connect whenever and not having to be at your work station to connect.”
IT/MIS Respondent
“In the warehouse, we can do transactions on the forklift rather than on a PC. A lot more mobile.”
IT/MIS
Respondent
“Freedom to move around the classroom—not to be tethered by wired LAN.”
End user Respondent
“Flexibility of equipment placement and, being in the healthcare industry, the fact that they can go wherever we need
them to.”
IT/MIS Respondent
“Convenience, easy to configure and move from one point to another within a building.”
IT/MIS Respondent
“Mobility—I can be in a patient room or in another unit and still have access to the computer.”
End user Respondent
“Increased productivity and accuracy.”
End user Respondent
“No more documents on paper, we went to wireless because of lack of space, and ease of accessibility.”
End user
Respondent.
2%6%
5%11%
6%8%8%9%9%
14%10%
11%19%
11%13%
5%14%
11%22%
21%21%
37%49%
45%Mobility/Freedom
Cheaper/Cost effective
Ease of installation
No wires
Flexibility
Portability
Ease of access
Convenience
Q: What do you think are the main benefits of wireless LANs? (unaided)Base: All Respondents (603)
IT/MIS (403)End-Users (200)
Total Respondents (603)

Cisco Systems, Inc.All contents are Copyright © 1992–2003 Cisco Systems, Inc. All rights reserved. Important Notices and Privacy Statement.
Page 20 of 28
“I think the main benefits of wireless LAN has been speed and its accuracy.”
End user Respondent.
Cost savings (primarily as a result of lower cabling/installation costs) are also key benefits as perceived by IT/MIS
respondents:
“I think the main benefit for wireless LAN is the cost factor—believe me, it's cheaper.”
IT/MIS Respondent
“Gets me out of the costs of cabling.”
IT/MIS Respondent
All of these topline, general benefits are viewed as important across all sectors, with few significant differences across
vertical markets—or, indeed, company sizes.
5.2 End User Perception of Wireless LAN Benefits
Following on from an initial, unprompted appraisal of the perceived benefits of wireless LANs, end user respondents
were asked to rate a series of key potential benefits. Issues surrounding
convenience, flexibility and mobility again
came to the forefront
as the essential benefits of wireless LAN implementation, with 80% or more of end user
respondents rating these as “important” (8-10 on a 10-point rating scale).
Figure 18
Extent of Benefits (End-Users)
A large percentage of end users also perceive
time savings
(due to improved efficiency) and productivity gains as
integral benefits (63% and 50%, respectively).
Other benefits include:
• Better responsiveness (48%)
• Better workgroup collaboration (43%)
Q: To what extent do wireless LANs provide the following benefits?Base: All End-Users (200)
31%32%
36%39%
42%43%43%
48%50%
63%82%
85%
87%Convenience
Time savings
MobilityFlexibility
Better workgroup collaborationBetter responsiveness
Increased competitive advantage
Productivity gains
Better customer/patient care
Guest internet accessReducing errors
Quicker decision-making
Improved company image
All respondents answering 8-10
NOTE: This chart is based on a scale of 1 to 10, where 1=‘Has no impact whatsoever’ and 10=‘Has a significant impact’.

Cisco Systems, Inc.All contents are Copyright © 1992–2003 Cisco Systems, Inc. All rights reserved. Important Notices and Privacy Statement.
Page 21 of 28
• Better customer / patient care (43%)
• Improved company image (42%)
• Increased competitive advantage (39%)
• Quicker decision-making (36%)
• Reduced errors (32%)
• Guest Internet access (31%)
5.3 IT/MIS Perception of Wireless LAN Benefits
When prompted as to the potential benefits of wireless LAN implementation, IT/MIS users were as likely as the end
users to view issues surrounding mobility, convenience and flexibility as being of paramount importance.
Differences start to arise, however, once the more “obvious” benefits have been established. Rather than viewing time
savings and productivity as key benefits (as end users do), I
T/MIS respondents are more likely
to view key benefits
as including
easier set-up and lower cabling costs
(as one might expect—both respondent types MOST readily
noticing benefits that impact their working lives).
Figure 19
Extent of Benefits (IT/MIS)
Other benefits cited by IT/MIS respondents include:
• Easier adds, moves, changes (49%)
• Productivity gains (38%)
• Time saving (38%)
• Better customer or patient care (31%)
Q: To what extent do wireless LANs provide the following benefits?
Base: All IT/MIS Respondents (403)
18%19%20%20%
25%27%28%29%30%31%
38%38%
49%58%60%62%
69%72%
80%Convenience
Easier to set-up temp. offices
Mobility
Flexibility
Improved company imageMore efficient use of office space
Reducing errors
Easier adds, moves, changes
Better responsiveness
Lower maintenance costsQuicker decision-making
Increased competitive advantage
Better workgroup collaboration
All respondents answering 8-10
•
Time-savingBetter customer or patient care
Guest internet access
Lower cabling costs
Productivity gains
Easier to set-up temp. networksAs with the 2001 study, Mobility, Convenience, and Flexibility are the highest-scoring benefits provided by wireless LANs (in terms of the amount of impact they carry). There are no differences by company size.
NOTE: This chart is based on a scale of 1 to 10, where 1=‘Has no impact whatsoever’ and 10=‘Has a significant impact’.

Cisco Systems, Inc.All contents are Copyright © 1992–2003 Cisco Systems, Inc. All rights reserved. Important Notices and Privacy Statement.
Page 22 of 28
• Guest Internet access (30%)
• More efficient use of office space (29%)
• Improved company image (28%)
• Better responsiveness (27%)
• Better workgroup collaboration (25%)
• Reduced errors (20%)
• Increased competitive advantage (20%)
• Quicker decision-making (19%)
• Lower maintenance costs (18%)
5.4 Benefit Perception of End Users Compared to IT/MIS Staff
Although both end users and IT/MIS staff agree that convenience, flexibility and mobility are the primary benefits
associated with wireless LAN implementation, key differences do exist in their perception of other benefits. As briefly
touched on before,
end users tend to focus on the time savings and productivity gains
brought about by the freedom
offered by a wireless LAN, while
IT/MIS users focus on logistical aspects of installation, as well as cost savings
achieved
.
Given the financial benefit of productivity/efficiency gains to the organization (see Section 7.0),
IT/MIS departments
need to be more aware of not only how wireless LANs make their jobs easier, but also the extent to which WLAN
usage drives financial gain
at an organizational level. This is of increasing significance to business decision makers,
given more limited opportunity at savings given cost-cutting measures over the past couple of years—productivity
and efficiency is the new cost-cutting. This should represent a significant selling point for IT/MIS departments to
convince board-level staff of the attractiveness of the technology.
6.0 Challenges of Wireless LAN Deployment
When asked about any particular challenges, problems or issues presented by the implementation of wireless LANs,
it is worthy to note that
a quarter of all respondents had experienced no issues whatsoever
, with this figure rising to
over a third for end users.

Cisco Systems, Inc.All contents are Copyright © 1992–2003 Cisco Systems, Inc. All rights reserved. Important Notices and Privacy Statement.
Page 23 of 28
Figure 20
Problems/Issues with WLAN
The primary concern of respondents revolves around security. This represents a change from 2001, when speed and
range of coverage issues were paramount. While the security issue is a more significant one for IT/MIS respondents,
the increased incidence of concerns in this area points to fears not being allayed as they might be.
However, much of
this concern around security is perception—or a result of stringent standards not being implemented (three-quarters
of organizations still rely on WEP, rather than more secure protocols).
7.0 Productivity Increases
The 2003 study focused in on the benefits realized through the implementation of wireless LANs. Aspects of these
benefits include increased connectivity, time savings, and increased accuracy, all of which contribute to increased
productivity.
Q: What problems or issues do you have with wireless LANs?Base: All Respondents (603)
•
34%21%
25%7%
9%8%
1%2%2%
1%2%2%
3%7%
6%17%
12%14%
15%14%14%
13%16%
15%20%
37%31%
Security
Range of coverage
NO PROBLEMS
Speed/throughput
Loss of connectivity/drop-outs
IT/MIS (403)End-Users (200)
Total Respondents (603)
Inoperability withother WLAN
DON’ T KNOW
Costs
Interference
The issue of Security is clearly a big concern amongst IT/MIS respondents, having increased from 18% in 2001 to 37% in 2003. A larger percentage of Government respondents rate this as an issue compared to other industry sectors.

Cisco Systems, Inc.All contents are Copyright © 1992–2003 Cisco Systems, Inc. All rights reserved. Important Notices and Privacy Statement.
Page 24 of 28
7.1 Increased Connectivity
On average, respondents estimate that
having access to the wireless LAN means that they are able to be connected
,
on average, over
3.5 hours more per day
. This view is consistent across IT/MIS respondents and end users, though it
is particularly high in government and healthcare sectors. This represents a significant rise from 2001, where the
figure was just under 2 hours.
Figure 21
Extra Connection (mean hours)
7.2 Time Savings
Respondents were asked how much time is saved per work day using the wireless LAN versus the wired LAN. The
results indicate a significant amount of time saved for employees—estimated at over an hour a day by IT/MIS
respondents, and as much as 1 1/2 hours by end users. Time savings are greatest in the healthcare industry, where the
average time savings is almost 2 hours.
OVERALL
End-Users
IT/MIS
Government
Manufacturing
Healthcare
Education
3.36
3.51
4.38
4.51
3.76
3.55
3.64
Q: How much more time per day [is the average employee] are you now able to be connected the network as a result of using a wireless LAN compared to using a wired LAN?
Base: All who agree (rating of 7-10) that ‘WLANs give users more opportunities…’ (296)

Cisco Systems, Inc.All contents are Copyright © 1992–2003 Cisco Systems, Inc. All rights reserved. Important Notices and Privacy Statement.
Page 25 of 28
Figure 22
Time Saved (mean hours)
Given a reported average salary of $80,000 (up from $64K in 2001), and taking into account the increase in time
saved, the
annual cost savings can be estimated at almost $14K per user
(up from $7K in 2001). The greatest savings
experienced is in the healthcare sector, with per employee savings estimated at over $17K.
1.07
1.21
1.31
1.82
1.46
1.20
1.29
Base: All Respondents (603)
OVERALL
End-Users
IT/MIS
Government
Manufacturing
Healthcare
Education
• The overall mean number of hours saved per day by using the wireless LAN has increased from 1.02 in 2001, to 1.29 in 2003, with increases experienced across all four main industry sectors
Q: How much time, on average, would you say [you save] the average employee saves in [your] their workday when [you] they use the WLAN versus the traditional wired LAN?

Cisco Systems, Inc.All contents are Copyright © 1992–2003 Cisco Systems, Inc. All rights reserved. Important Notices and Privacy Statement.
Page 26 of 28
Figure 23
Annual $ Savings Per Employee
This significant time savings is estimated to, on average, represent 17% of user working days (based on an eight-hour
day). This relates almost directly to productivity—on average, end users say they are as much as 27% more
productive on the wireless LAN versus the wired LAN. The healthcare industry experienced the greatest gain in
productivity, with an average 30% increase in employee productivity as a result of wireless LAN use.
Figure 24
Increase in Productivity (mean)
$13,802
$13,619
$14,064
$9,079
$12,368
$17,379
$14,507
Education
OVERALL
Healthcare /Medical
Government
Manufacturing
Base: All Respondents (603)
1,000+ Emps
100-999 Emps
Q: How much more productive do you think [you are] the average employee is versus using the wired LAN?
Base: All Respondents (603)
16%
20%
20%
30%
27%
18%
21%OVERALL
End-Users
IT/MIS
Government
Manufacturing
Healthcare
Education
• End-Users have witnessed the biggest (mean) increases in productivity, from 23% in 2001 to 27% in 2003. There are no differences by company size.

Cisco Systems, Inc.All contents are Copyright © 1992–2003 Cisco Systems, Inc. All rights reserved. Important Notices and Privacy Statement.
Page 27 of 28
7.3 Increased Accuracy
Overall, just over half of respondents believe that the wireless LAN improves the accuracy of everyday tasks
(22%
report a significant improvement, 29% a slight improvement)—
with 60% of end users believing that the technology
minimizes potential errors
. As many as three-quarters of healthcare staff feel that their accuracy is significantly
better—a crucial benefit being the ability to access and record patient information at the point of care. Over 60% of
those in the manufacturing sector also cite increased accuracy—one of the key benefits being the ability to track
inventory and work-in-progress in real-time via automated data capture rather than manual entry).
Figure 25
Extent of Accuracy Increase
•
•
Q: To what extent do you think the wireless LAN improves the accuracy of everyday tasks?
Base: All Respondents (603)
IT/MIS
End-Users
18%
30%
43%
25%
17%
8%
22% 29% 49%OVERALL
Manufacturing
Government
Healthcare
Education
Significant
improvement
Slight improvement
No difference
Overall, just over half (51%) of all the respondents interviewed believe that the wireless LAN improves the accuracy of everyday tasks, to some degree.In Healthcare, considerably more respondents report that WLANs significantly improve accuracy.
28%
20%
63%
29%
30%
38%
28%
53%
41%
29%
37%
64%

Corporate Headquarters
Cisco Systems, Inc.170 West Tasman DriveSan Jose, CA 95134-1706USAwww.cisco.comTel: 408 526-4000
800 553-NETS (6387)Fax: 408 526-4100
European Headquarters
Cisco Systems International BVHaarlerbergparkHaarlerbergweg 13-191101 CH AmsterdamThe Netherlandswww-europe.cisco.comTel: 31 0 20 357 1000Fax: 31 0 20 357 1100
Americas Headquarters
Cisco Systems, Inc.170 West Tasman DriveSan Jose, CA 95134-1706USAwww.cisco.comTel: 408 526-7660Fax: 408 527-0883
Asia Pacific Headquarters
Cisco Systems, Inc.Capital Tower168 Robinson Road#22-01 to #29-01Singapore 068912www.cisco.comTel: +65 6317 7777Fax: +65 6317 7799
Cisco Systems has more than 200 offices in the following countries and regions. Addresses, phone numbers, and fax numbers are listed on the
C i s c o W e b s i t e a t w w w . c i s c o . c o m / g o / o f f i c e s
Argentina • Australia • Austria • Belgium • Brazil • Bulgaria • Canada • Chile • China PRC • Colombia • Costa Rica • CroatiaCzech Republic • Denmark • Dubai, UAE • Finland • France • Germany • Greece • Hong Kong SAR • Hungary • India • Indonesia • IrelandIsrael • Italy • Japan • Korea • Luxembourg • Malaysia • Mexico • The Netherlands • New Zealand • Norway • Peru • Philippines • PolandPortugal • Puerto Rico • Romania • Russia • Saudi Arabia • Scotland • Singapore • Slovakia • Slovenia • South Africa • Spain • SwedenSwitzer land • Taiwan • Thai land • Turkey • Ukraine • United Kingdom • United States • Venezuela • Vietnam • Zimbabwe
All contents are Copyright © 1992–2003 Cisco Systems, Inc. All rights reserved. CCIP, CCSP, the Cisco Arrow logo, the Cisco
Powered
Network mark, Cisco Unity, Follow Me Browsing, FormShare, and StackWise aretrademarks of Cisco Systems, Inc.; Changing the Way We Work, Live, Play, and Learn, and iQuick Study are service marks of Cisco Systems, Inc.; and Aironet, ASIST, BPX, Catalyst, CCDA, CCDP, CCIE, CCNA, CCNP,Cisco, the Cisco Certified Internetwork Expert logo, Cisco IOS, the Cisco IOS logo, Cisco Press, Cisco Systems, Cisco Systems Capital, the Cisco Systems logo, Empowering the Internet Generation, Enterprise/Solver,EtherChannel, EtherSwitch, Fast Step, GigaStack, Internet Quotient, IOS, IP/TV, iQ Expertise, the iQ logo, iQ Net Readiness Scorecard, LightStream, MGX, MICA, the Networkers logo, Networking Academy, NetworkRegistrar,
Packet
, PIX, Post-Routing, Pre-Routing, RateMUX, Registrar, ScriptShare, SlideCast, SMARTnet, StrataView Plus, Stratm, SwitchProbe, TeleRouter, The Fastest Way to Increase Your Internet Quotient,TransPath, and VCO are registered trademarks of Cisco Systems, Inc. and/or its affiliates in the U.S. and certain other countries.
All other trademarks mentioned in this document or Web site are the property of their respective owners. The use of the word partner does not imply a partnership relationship between Cisco and any other company.(0304R) ETMG 203180—JS11/03
Among those that feel that the implementation of wireless LANs makes everyday tasks more accurate,
it is estimated that individuals are as
much as 41% more accurate on average
(46% end users, 37% IT/MIS). Although this figure is a respondent estimate of increased accuracy,
it is significant in its size; 40% increased accuracy among individual users has the potential to save a lot of time and effort across a company.
Staff in the healthcare sector again lead the field here—respondents say they are almost 50% more accurate in their everyday tasks.
These
figures are consistent with findings from 2001.
Figure 26
Accuracy Increase (mean)
Q: If you could attach a percentage increase in the accuracy of everyday tasks enabled by WLANS, what would that be?
•
34%
37%
39%
50%
46%
37%
41%OVERALL
End-Users
IT/MIS
Government
Manufacturing
Healthcare
Education
Overall, respondents have noticed an average increase of 41% in the accuracy of everyday tasks—this is similar to 2001 findings.
Base: All who say that ‘the WLAN makes a slight /significant improvement to the accuracy of everyday tasks’ (308)