2003 anz annual report strong differ ent successful ... · $400m $0m return on equity maintained...
TRANSCRIPT

2003 ANZAnnual Report Strong
DifferentSuccessfulSustainable

The bank with a human face, easy to do business with, building enduring customer relationships
For our customers
A great company, with great people, great values, great opportunities
For our people
One of the most efficient, best managed, and most successful banks in the world
For our shareholders
Trusted. Making a sustainable contribution to society For our
community
Breakout. Bold, different, investing, partnering, growing For our
future
The ANZAgenda
1
Investor Snapshot
Chairman’s Report
Chief Executive Officer’s Report
Chief Financial Officer’s Review
Risk Management
A View from the CEO on Creating Sustainable Businesses
The National Bank of New Zealand
People
Personal and Rural Customers
Business Banking
Systems
Community and Environment
Leadership
Business Profiles
Board of Directors
Corporate Governance and the Board
Compensation
Guide to Concise Financial Report
Concise Financial Report
Directors’ Report
Directors’ Declaration
Auditors’ Report
Shareholder Information
Shareholder Feedback Form
Information for Shareholders
0204060812141618202224262830343843484951606162
Last PageInside Back Cover
Contents
Key terms
Cost to income ratio (CTI)A business efficiency measure. It is the ratio ofour expenses (excluding goodwill amortisation)to our income.
Credit ratingA measurement of the credit worthiness of abusiness. AAA is the top credit rating accorded by ratings agencies such as Moody’s InvestorServices and Standard & Poor’s. The better ourcredit rating, the cheaper we can borrow moneyfrom capital markets. ANZ’s long-term creditrating is AA-.
Dividend per share (DPS)The amount of the Company’s after tax earningsdeclared and paid to ordinary shareholders. It is usually expressed as a number of cents pershare, or as a dividend per share.
Earnings per share (EPS)The amount, in dollars, of earnings divided by the average number of ordinary shares. For example, if the earnings are $2 million and 1 million shares are outstanding, the earningsper share would be $2.00 ($2 million ÷ 1 millionshares = $2.00). The earnings figure is based onprofit after tax less preference share dividends.
Economic value added (EVATM)
A measure of risk-adjusted accounting profit. It is based on operating profit after tax, adjustedfor one-off items, the cost of capital, imputationcredits and economic credit costs.
Net profit after tax (NPAT)The Group’s net profit after all taxes, expensesand provisions have been deducted from theoperating income.
Return on equity (ROE)A calculation which shows the return the Company has made on the money ordinaryshareholders haveinvestedin ANZ. It isexpressed as a percentage.
Investor Snapshot 2003.The year at a glance
2
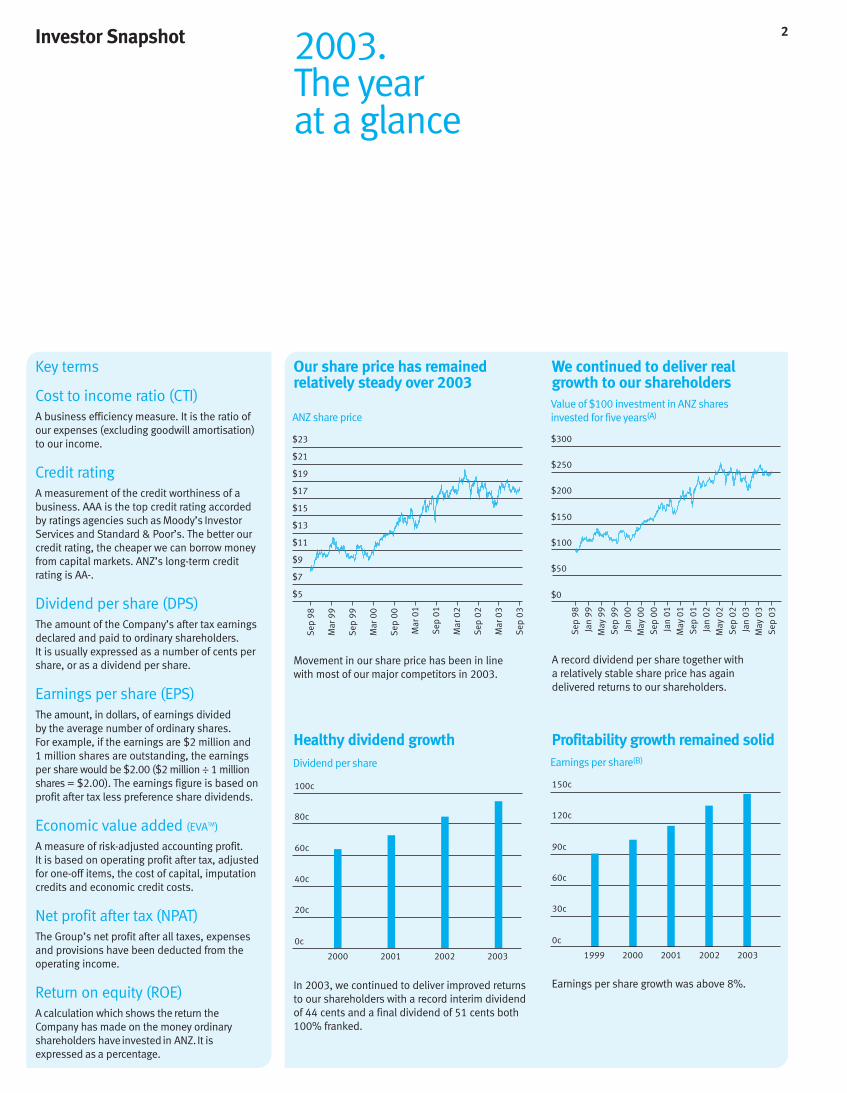
Movement in our share price has been in line with most of our major competitors in 2003.
In 2003, we continued to deliver improved returnsto our shareholders with a record interim dividendof 44 cents and a final dividend of 51 cents both100% franked.
Earnings per share growth was above 8%.
A record dividend per share together with a relatively stable share price has again delivered returns to our shareholders.
We continued to deliver realgrowth to our shareholders
ANZ share price
$23
$21
$19
$17
$15
$13
$11
$9
$7
$5
Sep
98
Mar
99
Sep
99
Mar
00
Sep
00
Mar
01
Sep
01
Mar
02
Sep
02
Mar
03
Sep
03
$300
$250
$200
$150
$100
$50
Value of $100 investment in ANZ shares invested for five years(A)
$0
Sep
98
May
99
Jan
99
Sep
99
Jan
00M
ay 0
0S
ep 0
0Ja
n 01
May
01
Sep
01
Jan
02M
ay 0
2S
ep 0
2Ja
n 03
May
03
Sep
03
2002 200320012000
Dividend per share
100c
0c
80c
60c
40c
20c
2002 2003200120001999
0c
150c
120c
90c
60c
30c
Earnings per share(B)
Our share price has remainedrelatively steady over 2003
Healthy dividend growth Profitability growth remained solid
For further information on financial terms, please refer to the Guide to Concise Financial Report on page 48
3
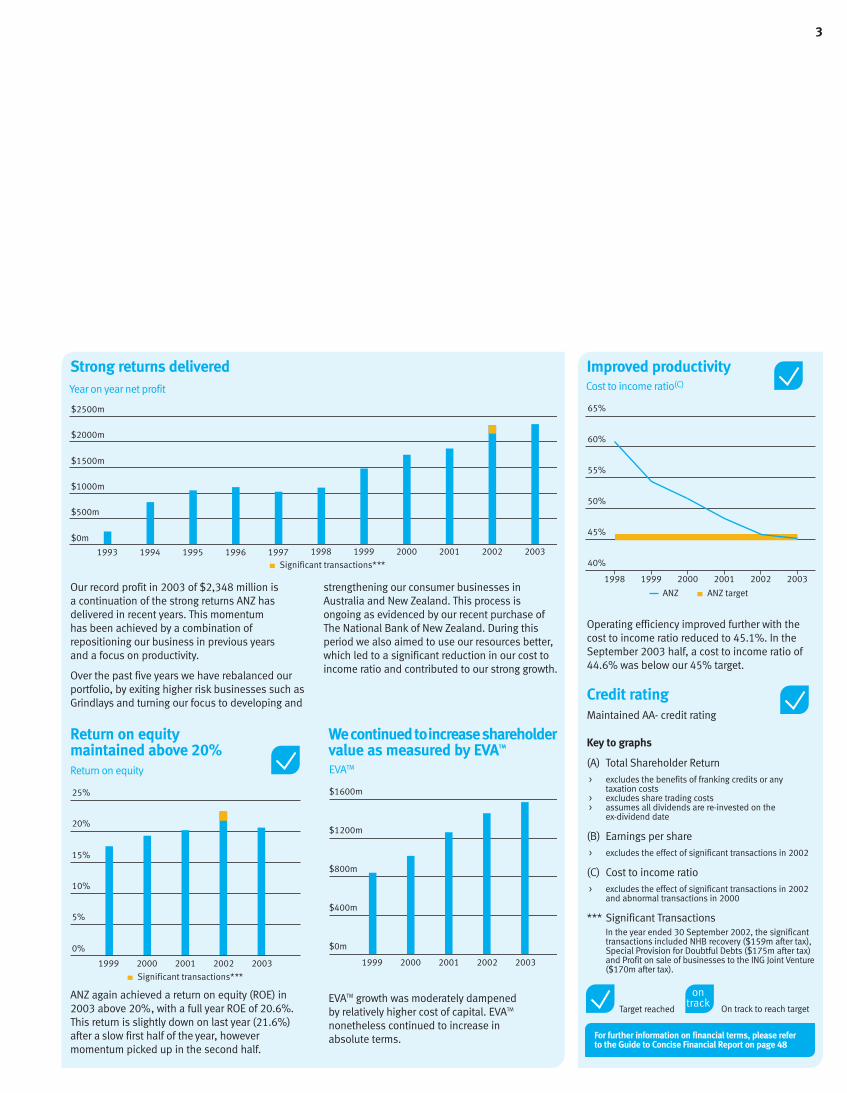
EVATM growth was moderately dampenedby relatively higher cost of capital. EVATM
nonetheless continued to increase inabsolute terms.
ANZ again achieved a return on equity (ROE) in2003 above 20%, with a full year ROE of 20.6%.This return is slightly down on last year (21.6%)after a slow first half of the year, howevermomentum picked up in the second half.
Operating efficiency improved further with thecost to income ratio reduced to 45.1%. In theSeptember 2003 half, a cost to income ratio of44.6% was below our 45% target.
Year on year net profit
$0m
$2500m
$2000m
$1500m
$1000m
$500m
1993 1994 1995 1996 1997 1998 1999 2000 2001 2002 2003
Significant transactions***
2002 2003200120001999
Return on equity
0%
25%
20%
15%
10%
5%
Significant transactions***
Cost to income ratio(C)
60%
65%
55%
50%
45%
40%
2002 20032001200019991998
ANZ ANZ target
2002 2003200120001999
EVATM
$1600m
$1200m
$800m
$400m
$0m
Return on equitymaintained above 20%
Wecontinuedtoincreaseshareholdervalue as measured by EVATM
Target reached On track to reach target
Improved productivity
Credit ratingMaintained AA- credit rating
Strong returns delivered
Our record profit in 2003 of $2,348 million isa continuation of the strong returns ANZ hasdelivered in recent years. This momentum has been achieved by a combination ofrepositioning our business in previous yearsand a focus on productivity.
Over the past five years we have rebalanced ourportfolio, by exiting higher risk businesses such asGrindlays and turning our focus to developing and
strengthening our consumer businesses inAustralia and New Zealand. This process isongoing as evidenced by our recent purchase ofThe National Bank of New Zealand. During thisperiod we also aimed to use our resources better,which led to a significant reduction in our cost toincome ratio and contributed to our strong growth.
Key to graphs
(A) Total Shareholder Return> excludes the benefits of franking credits or any
taxation costs> excludes share trading costs> assumes all dividends are re-invested on the
ex-dividend date
(B) Earnings per share> excludes the effect of significant transactions in 2002
(C) Cost to income ratio> excludes the effect of significant transactions in 2002
and abnormal transactions in 2000
*** Significant TransactionsIn the year ended 30 September 2002, the significanttransactions included NHB recovery ($159m after tax),Special Provision for Doubtful Debts ($175m after tax)and Profit on sale of businesses to the ING Joint Venture($170m after tax).

ANZ performed well in 2003. Profit after tax,excluding significant transactions in 2002,was up 8.3% this year, demonstrating theeffectiveness of our specialist business modelin delivering returns to shareholders. Thedirectors were pleased to increase the dividendper share by 11.8% to 95 cents fully franked.
Most of our businesses recorded solid growthwith some recording double-digit growth in earnings. These were partially offset by a one-off charge in our credit card business. We delivered solid financial performance byfocusing on organic growth, effective costcontrol and the management of risk.
The return on ordinary shareholders’ equitywas slightly down at 20.6%, although above our target of 20%. Our cost to income ratio of45.1% is the lowest of the major Australianbanks and places ANZ among the most efficientbanks in the world relative to business mix. Riskscontinue to be well managed. Specific provisionswere down by 28% to $527 million. Our capitalposition is strong, with the Group’s adjustedcommon equity ratio at 5.7%, which was at theupper end of our target range for 2003.
Significantly, we settled a long-running taxdispute with the Australian Taxation Office thisyear relating to equity product transactionsundertaken predominantly in the 1990s. Thesettlement of $262 million was met from ANZ’sexisting tax provisions.
Growth through specialisationANZ is focused on creating sustainable valuefor shareholders –now and in the longer term.
Much of this work involves building on thecompetitive advantages that exist in our specialistbusinesses. This year’s results reinforce thequality of each of these businesses. In manycases such as credit cards, corporate bankingand automobile and equipment leasing, ourbusiness is the market leader.
We believe our specialist business strategyis fundamental to sustaining and buildingleadership positions that help us to deliversuperior returns to shareholders and make adifference to our customers, community and staff.
Chairman’s Report A solidplatform forfuture growth
4
Charles GoodeChairman

5
Strategic expansionWe continually evaluate opportunities to expandin Australia, New Zealand and elsewhere in Asiaand the Pacific.
On 24 October 2003, we agreed to acquireThe National Bank of New Zealand from LloydsTSB for $4.915 billion at exchange rates on23 October 2003. The acquisition will makeus the largest bank in New Zealand and isconsistent with our strategic goal to havesustainable top three positions in each ofour core businesses and markets.
We have also taken steps to develop a smallportfolio of growth options in East Asia over the medium to long-term. This has involvedtwo relatively modest initiatives: signing amemorandum of understanding with theShanghai Rural Credit Cooperative Union – expected to become the Shanghai CooperativeBank – and a joint venture credit card businesswith Metrobank in the Philippines.
Our role in the communityWe continue to give high priority to creating a distinctive culture within ANZ as part of theGroup’s long-term competitive advantage.This involves reinforcing a performance cultureamong staff while unleashing their talents andenergy to expand the business for the benefitof shareholders, our customers and thecommunity we serve.
While we have a wide range of formal communityprograms in place in countries in which weoperate, being part of a community meansbeing able to respond quickly to urgent needs.
All of us at ANZ feel proud of the way our staff responded to the terrible bushfires thatdestroyed over 530 homes in Australia’s capital,Canberra in January. ANZ provided immediatecash assistance for its mortgage customerswhose primary residence had been affected bythe bushfires. The grants of $5,000 to $10,000were gifts and did not have to be repaid. Wealso offered a range of other measures and ourlocal staff worked hard to help customers andothers affected by the tragedy.
As part of the process to strengthen therelationships we have with our staff and thebroader community, we have been examiningour response to concerns about environmentaland social issues. This process has provided uswith the opportunity to re-examine our role asa bank and the contribution we make to societyas “the bank with a human face”.
Importance of our staffThe continuing strong performance of ANZ, its growth in returns to shareholders andincreasing responsiveness to customers and the community is the result of the hard workand commitment of our 23,137 staff. On behalfof the Board and shareholders, I thank them fortheir contribution.
Governance strengthenedThis year we have taken further steps tostrengthen our corporate governance anddisclosure standards. It has been a yearwhen regulatory emphasis has increasedsubstantially, both in Australia and overseas.While this interest on the part of regulators iswelcomed, so long as it focuses upon goodprocess and good governance, ANZ is itselfproactive in this area. Our belief is that goodcorporate governance is not only an ethical andstewardship responsibility; it can also give ANZa strong advantage.
We believe a strong focus on corporategovernance and transparency, combined withdelivering on our promises, makes ANZ bothmore attractive to investors and a moresustainable business.
This starts with regulatory compliance butsignificantly involves fostering an environmentin which open, well-informed and constructivediscussion is encouraged. This provides thebasis for actively monitoring the company’sactivities and creates an environment in whichintegrity is able to prevail at every level.
It also means a commitment to transparentreporting, timely and accurate disclosuresand management accountability. For some years ANZ has been recognised for its levelof transparency and disclosure to investors, not only in Australia, but globally.
The Board’s focus in 2003ANZ’s Board met 11 times during 2003, withadditional specific activities carried out by theBoard’s committees. This year some of the keyissues to engage the Board included strategicgrowth opportunities and their role in ANZ’sfuture success; strengthening operating riskmanagement including improved governanceassociated with technology changes; theimpending changes to international financialreporting standards and their impact on ANZ;and our approach to sustainability and how theGroup balances its obligations to shareholders,customers, staff and the community.
OutlookIn the year ahead, we expect the Australian and New Zealand economies to continue toperform relatively well and for overseas marketsto strengthen from their low base. Somechallenges are, however, posed by variousfactors including low interest rates andassociated margin pressure and the risingAustralian dollar.
Overall, ANZ is making good progress towardachieving its business priorities. We haveproduced a solid, consistent financialperformance and we are creating growthopportunities for the future. I am confidentthis will enable us to continue to deliver valuefor you, our shareholders.
Charles GoodeChairman
ANZ’s agenda is based on a strategy ofspecialisation that is well executed andconsistently delivers superior performance for our shareholders, staff, customers and the community we serve.
Overall, the 2003 financial result has beenreasonable in an environment that is beginning to be difficult for banks around the world. It’sthe power of our specialisation strategy and the quality of the teams that run our specialistbusinesses that has allowed us to reinvent ANZover the past five years as a low risk,well-managedcompany that consistently produces sound results.
Five years of achievementLast year I reported on the achievements we had made since 1997 making ANZ a very differentbank. These included:
> lowering risk
> balancing our business portfolio by growing our consumer businesses while maintaining our strong business banking franchise
> radically transforming our cost structure andbecoming one of the most efficient banksin the world
> reinvigorating our culture by tapping into the energy and passion of our staff.
In thinking about that transition – and what ANZis today – it is being the “bank with the humanface” which is the core of who we are and whatwe do at ANZ. Our objectives, strategy, tacticsand organisational structure are aligned totranslate the “bank with a human face” from a set of words into everyday actions.
Customer driven businessesAll businesses now operate in a customer-driveneconomy. This is particularly true in financialservices where there are more competitorspursuing a stable number of more sophisticated,better informed buyers. The Internet, consumeradvocate organisations and a critical mediaenable customers to find and analyse competingproducts and to make informed choices.
Many financial services offerings have becomecommodities where differentiation lies in theprovider’s service and reputation rather thanthe product itself. We believe that to competeand survive in the customer economy takesmore than simply improving customerrelationships. It is about the whole organisationevolving to put the customer at the centre.
Specialisation works forshareholders and customersWe set out on this path in 2000 recognising that over time specialist businesses, whichhave real capabilities, produce more sustainablevalue than generalists. Importantly, theyare better able to get close to customers,understand their real needs and delivermore valuable services and products. We have seen that through our Local CEOs andbranch staff, we are now much closer to thecommunities we serve. It reflects a reality thatour customers and our staff find it easier toidentify with a more agile, less bureaucraticorganisation. Customers identify with “their”branch or “their” relationship manager. Staffidentify with “their” team or “their” business.
At the same time, we began to show our staffand the rest of the community that ANZ was adifferent bank. We announced a moratorium onrural bank closures, offered to buy the branchesbeing closed by one of our major competitors,gave immediate “no strings attached” grants tocustomers whose houses had been destroyedby bushfires and started trialing a matchedsavings program for low income earners.
We also recognised that winning companiesare companies that can offer value to customersat lower cost. We radically changed our costbase which is now flowing through topropositions such as our low-cost personaltransaction accounts and the associatedgrowth in customer numbers that is part ofour “best deal with a human face” strategy forpersonal banking.
Winning through specialisationThrough specialisation, each of our businessesis now:
> more transparent
> more flexible and more responsive to itsstaff and customers
> easier to do business with
> offering more satisfying jobs with moreautonomy
> developing a culture of innovation, teamworkand shared responsibility
> making implementation easier
> able to grow faster.
All of this is a very different approach to anyother bank. Through it, we seek to deliver moreconsistent, sustainable returns to shareholders.
Focusing on sustainedperformance and growthWhile all we have achieved so far remainscentral to ANZ’s agenda, another measure ofour progress will be the management actionswe take in other areas to deliver continuedsuperior performance and growth over the comingyears. The reality is that there is more to ANZthan producing consistent short-term results.
We have reached agreement on acquiring TheNational Bank of New Zealand which givesus a leading position in New Zealand. It is a very different acquisition, one based onimproving customer service, satisfaction and growth by leveraging the strengths ofboth companies.
It demonstrates that we are in a transitionalphase, which means we will focus increasinglyon three strategic priorities in the years ahead:
> delivering sustainable performance and valuethrough a rich portfolio of strongly positionedbusinesses with best-practice cost andprocess leadership that allow us to achieveabove sector revenue and share growth.
Chief Executive Officer’s Report The ANZ
Agenda:achievingvalue throughspecialisation
6

7
> earning the respect of our stakeholders byconsistently producing superior financialresults through knowing the business andcustomers best, and creating a strong salesand service culture while developing realengagement with the community.
> creating a new future by leveraging specialisationas a distinctive approach and by beingdynamic, innovative and willing to experiment.
Creating more valueOur future is about delivering the best value forcustomers, performing and growing to createvalue for our shareholders, leading and inspiringeach other, earning the trust of the community,and being bold and having the courage to bedifferent. It’s why people come to work for ANZ– to be part of a company that is continuallyraising its energy levels to make a lasting impact and create something that matters forshareholders, customers and the communitywe serve.
By really being the “bank with a human face” to our customers, staff and community, andfocusing on these priorities, ANZ is stronger,more sustainable, more successful andvery different.
John McFarlaneChief Executive Officer
John McFarlaneChief Executive Officer
Chief FinancialOfficer’s Review Growth,
returnsand profit
8
Sep 02 excluding significant transactions(A)
$2500m
$2300m
$2100m
$1900m
$1700m
$1500m
Sep 02
2322
Sep 03
2348(154)
Sign
ifica
nt tr
ansa
ctio
ns
293
Net
Inte
rest
Inco
me
12
Non
Inco
me
Inte
rest
(75)
Expe
nses
(4)
Prov
isio
ning
(46)
Tax
& O
EI2168
NPAT increase NPAT decrease Prior period NPAT$0m
8%Institutional Financial ServicesChange
5%Personal Banking & Wealth Mgmt
9%Mortgages
12%Corporate
-4%Consumer Finance
8%New Zealand Banking
34%Asia Pacific
23%Esanda/UDC
-24%Treasury
$100m $200m $300m $400m $500m $600m $700m $800m
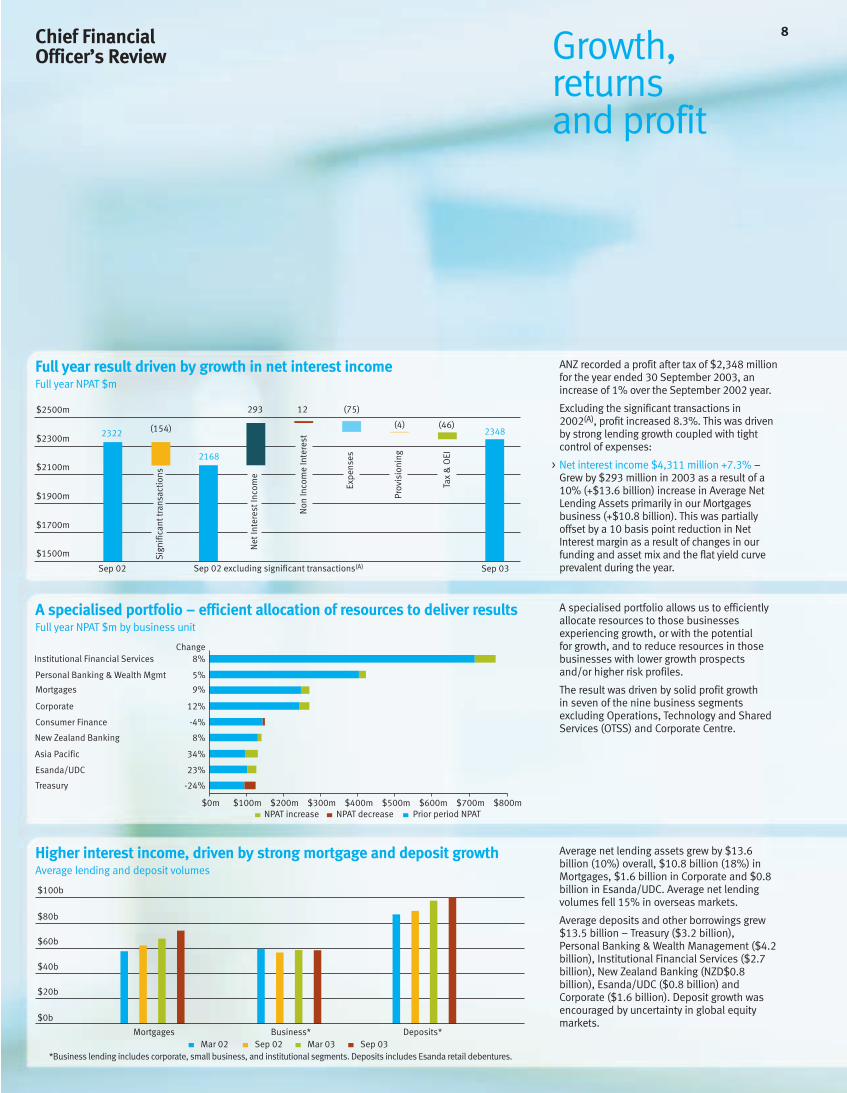
ANZ recorded a profit after tax of $2,348 millionfor the year ended 30 September 2003, anincrease of 1% over the September 2002 year.
Excluding the significant transactions in2002(A), profit increased 8.3%. This was drivenby strong lending growth coupled with tightcontrol of expenses:
> Net interest income $4,311 million +7.3% –Grew by $293 million in 2003 as a result of a10% (+$13.6 billion) increase in Average NetLending Assets primarily in our Mortgagesbusiness (+$10.8 billion). This was partiallyoffset by a 10 basis point reduction in NetInterest margin as a result of changes in ourfunding and asset mix and the flat yield curveprevalent during the year.
A specialised portfolio allows us to efficientlyallocate resources to those businessesexperiencing growth, or with the potentialfor growth, and to reduce resources in thosebusinesses with lower growth prospectsand/or higher risk profiles.
The result was driven by solid profit growth in seven of the nine business segmentsexcluding Operations, Technology and SharedServices (OTSS) and Corporate Centre.
Average net lending assets grew by $13.6billion (10%) overall, $10.8 billion (18%) inMortgages, $1.6 billion in Corporate and $0.8billion in Esanda/UDC. Average net lendingvolumes fell 15% in overseas markets.
Average deposits and other borrowings grew$13.5 billion – Treasury ($3.2 billion),Personal Banking & Wealth Management ($4.2billion), Institutional Financial Services ($2.7billion), New Zealand Banking (NZD$0.8billion), Esanda/UDC ($0.8 billion) andCorporate ($1.6 billion). Deposit growth wasencouraged by uncertainty in global equitymarkets.
Full year result driven by growth in net interest incomeFull year NPAT $m
A specialised portfolio – efficient allocation of resources to deliver resultsFull year NPAT $m by business unit
Deposits*Business*Mortgages
$0b
$100b
Mar 02 Sep 02 Sep 03Mar 03*Business lending includes corporate, small business, and institutional segments. Deposits includes Esanda retail debentures.
$80b
$60b
$40b
$20b
Higher interest income, driven by strong mortgage and deposit growthAverage lending and deposit volumes
9
> Non-Interest Income $2,808 million +0.4% –Reported growth was flat for the year. Afteradjusting for the sale of ANZ Funds Managementbusinesses to the ING Joint Venture and underaccrual of loyalty points cost on credit cards inprior periods, underlying growth was 5.2% drivenby higher lending fees in our Corporate Banking,Asset Finance and Institutional Bankingbusinesses, higher equity accounted profit fromour investment in PT Panin Bank and developmentproperty sales in Institutional Banking.
> Expenses $3,228 million +2.4% – Once again,tightly controlled across the Group. Higher stafflevels required to service increased lendingvolumes and an increase in software amortisationon system upgrades, were the main contributors
to the 2.4% increase in costs. Discretionarycosts were contained as the control ofexpenses remains a key aspect of our financialmanagement.
> Provisioning $614 million +0.7% – Asset qualityimproved with the Economic Loss Provision (ELP)rate down primarily due to a higher proportion ofmortgages. This lower rate offset the impactof increased lending volumes.
> Tax & Outside Equity Interests (OEI)$929 million +5.2% – Increase in profits causedthe higher tax expense in 2003, however, ahigher amount of equity accounted earningshas meant that the growth in tax expense wasbelow profit growth.
Strong results in Corporate (12%) andEsanda/UDC (23%) were driven by strongdomestic growth, while the 34% improvementin Asia Pacific resulted largely from higher equityaccounted earnings from PT Panin Bank, higherforeign exchange earnings and lending growth.
Profit in Mortgages grew 9% reflecting continuedgrowth in the Australian housing market whilethe 5% improvement in Personal Banking andWealth Management resulted largely fromincreased deposit volumes and increasedcommissions on mortgage sales. This waspartially offset by lower earnings from our INGJoint Venture.
TheInstitutional FinancialServices result increased8% with strong contributions from Capital Marketsand the Australasian operations of InstitutionalBanking. Contributions from Structured FinanceInternational and the offshore operations ofInstitutional Banking reduced following thedecision to reduce exposure to the US and UK markets.
New Zealand Banking results were flat afteradjusting for the impact of the appreciation in the exchange rate.
Consumer Finance was impacted by the underaccrual of loyalty expense, and mismatch earnings in Treasury reduced as high yieldinginvestments matured.
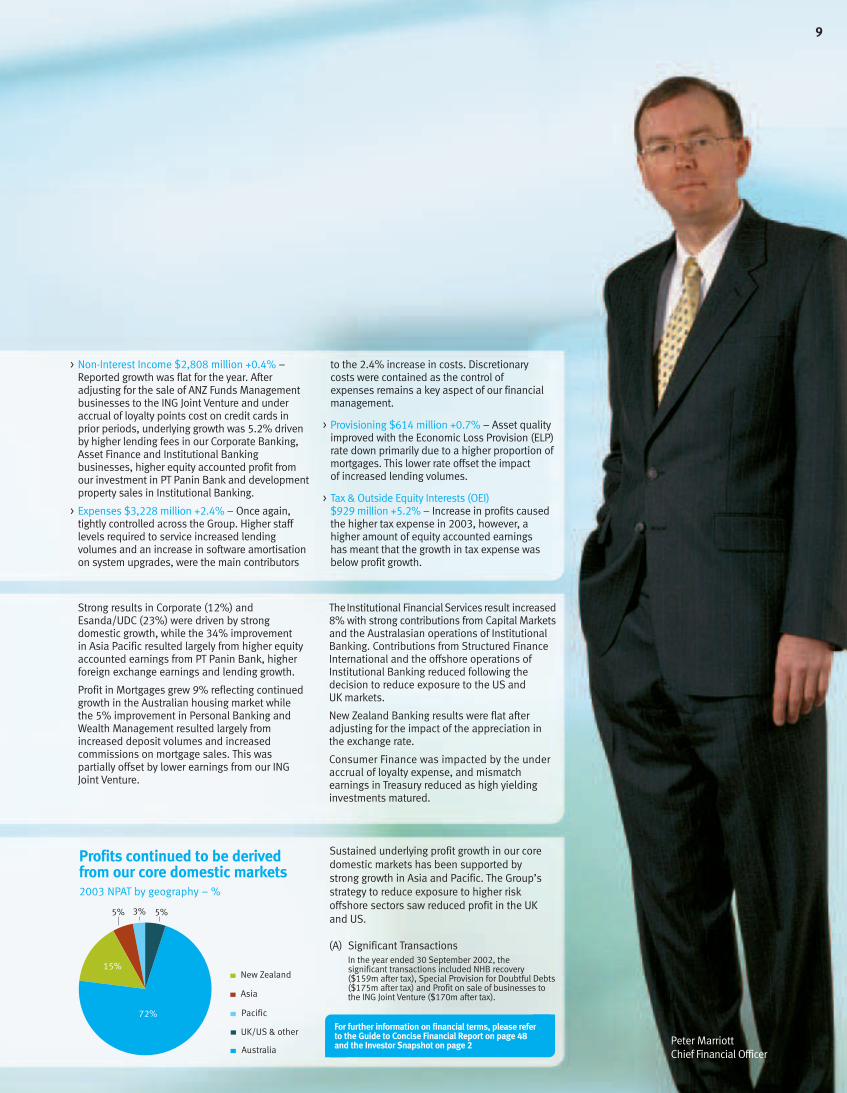
Peter MarriottChief Financial Officer
Sustained underlying profit growth in our coredomestic markets has been supported bystrong growth in Asia and Pacific. The Group’sstrategy to reduce exposure to higher riskoffshore sectors saw reduced profit in the UKand US.
Australia
UK/US & other
Pacific
New Zealand
Asia
72%
15%
5% 3% 5%
Profits continued to be derivedfrom our core domestic markets2003 NPAT by geography – %
(A) Significant TransactionsIn the year ended 30 September 2002, thesignificant transactions included NHB recovery($159m after tax), Special Provision for Doubtful Debts($175m after tax) and Profit on sale of businesses tothe ING Joint Venture ($170m after tax).
For further information on financial terms, please refer to the Guide to Concise Financial Report on page 48and the Investor Snapshot on page 2
10Chief FinancialOfficer’s Review
* Sep 02 excludes significant transactions** excludes volume impact and benefits from repricing
Und
erly
ing
grow
th
Cash
flow
impa
cton
trad
ing
secu
riti
es in
com
e
Pani
n bo
nd s
ales
$2900m
$2800m
$2700m
$2600m
$2500m
(71)
(20)
(37)(33)
Sep
03
Sep
02*
20
45
JV im
pact
Und
erst
atem
ent o
flo
yalt
y ex
pens
e in
200
2
Card
s un
der-a
ccru
al
Hig
her l
oyal
ty c
osts
**
Low
er S
FI in
com
e
(38)
28081462796
Lending fees increased $57 million due to strongvolume growth in Corporate, Asset Finance andInstitutional Banking in Australasia.
Non-lending feesreduced by $81millionprincipallybecause of a $38 million under accrual of loyaltypoints on co-branded credit cards in prior years,higher cost of loyalty points, the sale of ANZ’sFunds Management business to the ING JointVenture and reduced fee revenue from US and UKstructured finance operations.
Structured Finance International income reduced asa result of the re-weighting of the Group’s portfolioin both risk and geographic terms, foreign exchangerate movements and subdued market conditions.
Trading securities income growth included $45million from cash flow mismatches on swaps, whichhad an opposite impact on net interest income.
Non interest income impacted by the sale of ANZ Funds Management tothe ING Joint Venture, cards under-accrual and loyalty costs. Underlyinggrowth strongNon interest income $m
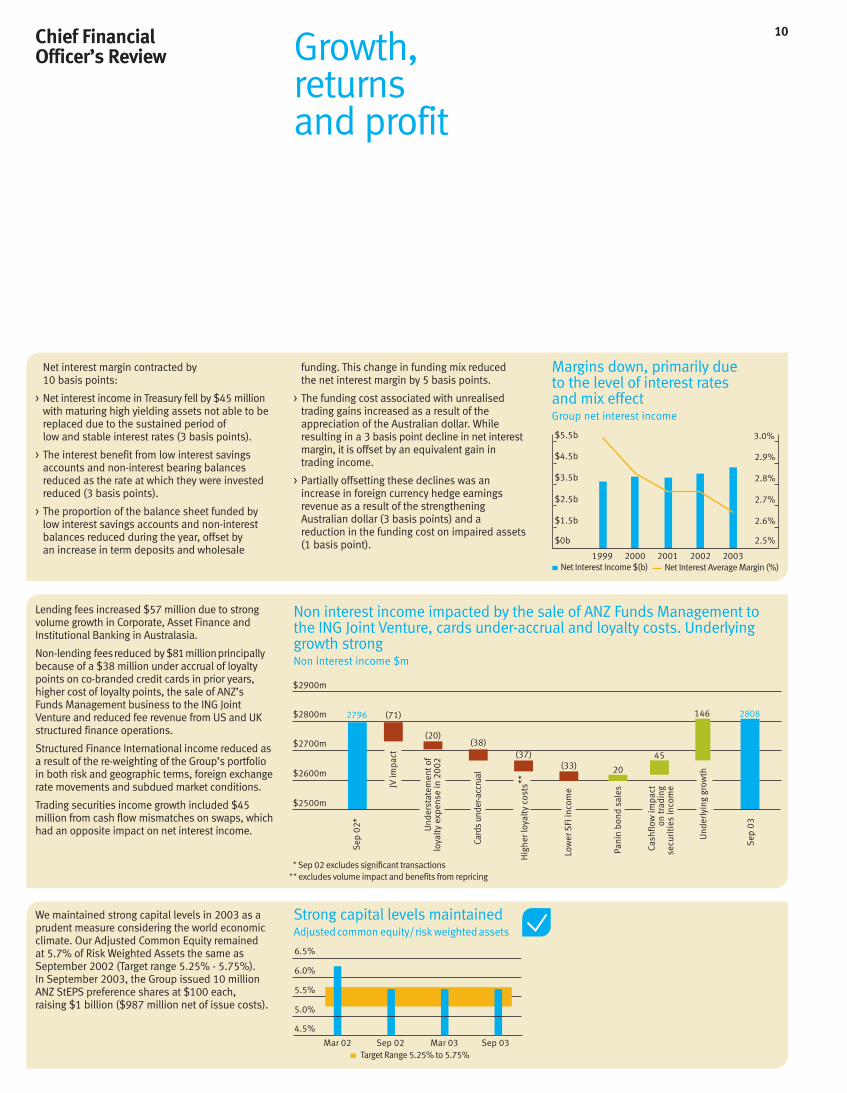
Net interest margin contracted by10 basis points:
> Net interest income in Treasury fell by $45 millionwith maturing high yielding assets not able to bereplaced due to the sustained period oflow and stable interest rates (3 basis points).
> The interest benefit from low interest savingsaccounts and non-interest bearing balancesreduced as the rate at which they were investedreduced (3 basis points).
> The proportion of the balance sheet funded bylow interest savings accounts and non-interestbalances reduced during the year, offset byan increase in term deposits and wholesale
$2.5b
$0b
$5.5b
$3.5b
$4.5b
$1.5b
2.5%
2.6%
2.7%
2.8%
2.9%
3.0%
Net Interest Income $(b) Net Interest Average Margin (%)2001 20021999 2000 2003
Margins down, primarily due to the level of interest ratesand mix effectGroup net interest income
Growth,returnsand profit
Mar 03 Sep 03Sep 02Mar 02
4.5%
5.0%
6.5%
6.0%
5.5%
Target Range 5.25% to 5.75%
funding. This change in funding mix reduced the net interest margin by 5 basis points.
> The funding cost associated with unrealisedtrading gains increased as a result of theappreciation of the Australian dollar. Whileresulting in a 3 basis point decline in net interestmargin, it is offset by an equivalent gain intrading income.
> Partially offsetting these declines was anincrease in foreign currency hedge earningsrevenue as a result of the strengtheningAustralian dollar (3 basis points) and areduction in the funding cost on impaired assets(1 basis point).
We maintained strong capital levels in 2003 as aprudent measure considering the world economicclimate. Our Adjusted Common Equity remainedat 5.7% of Risk Weighted Assets the same asSeptember 2002 (Target range 5.25% - 5.75%).In September 2003, the Group issued 10 millionANZ StEPS preference shares at $100 each,raising $1 billion ($987 million net of issue costs).
Strong capital levels maintained Adjusted common equity/risk weighted assets
11
2002 200320011998 1999 2000
$300m
$0m
$700m
$400m
$500m
$600m
$200m
$100m
Headline ELP (bps)
0 bps
80 bps
ELP charge*excludes the $250 million special provision in 2002
ELP adjustment
70 bps
60 bps
50 bps
40 bps
30 bps
20 bps
10 bps
2002 200320011999 2000
$900m
$0m
$1500m
$1200m
$600m
$300m
Aust/NZ UK/US Asia Other International
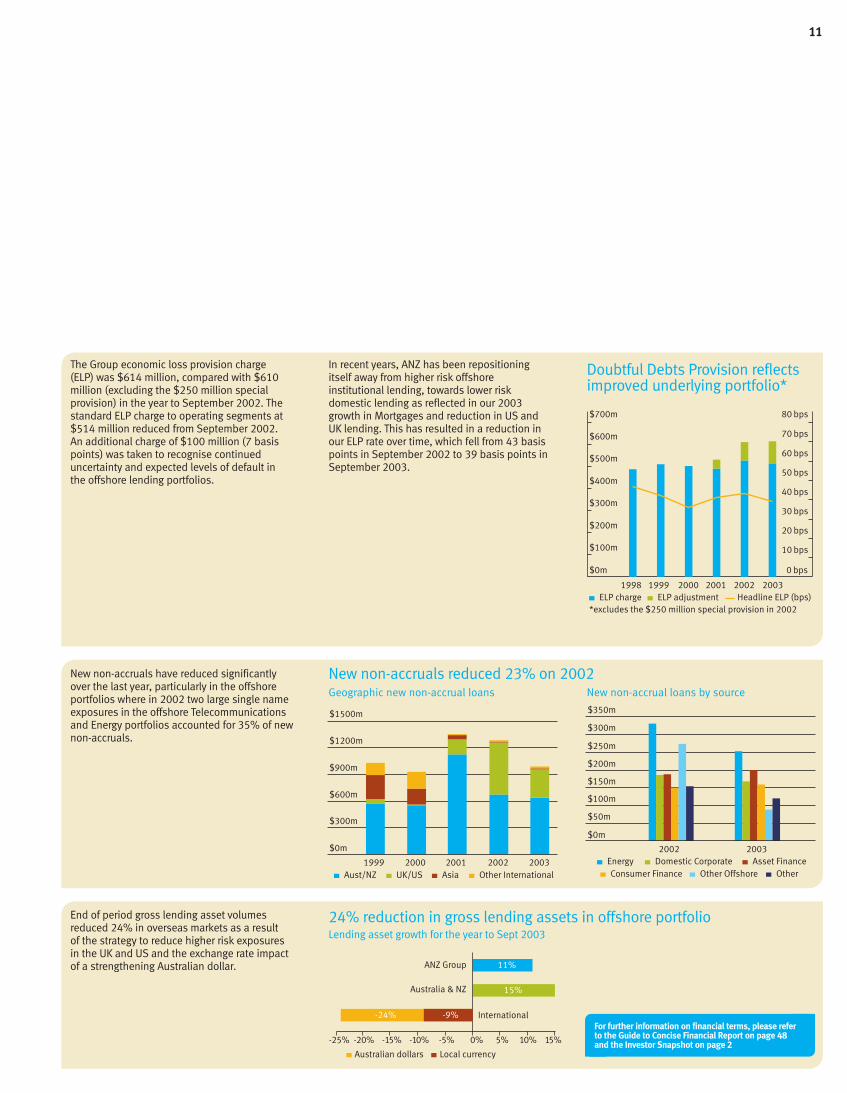
New non-accruals have reduced significantlyover the last year, particularly in the offshoreportfolios where in 2002 two large single nameexposures in the offshore Telecommunicationsand Energy portfolios accounted for 35% of newnon-accruals.
End of period gross lending asset volumesreduced 24% in overseas markets as a resultof the strategy to reduce higher risk exposuresin the UK and US and the exchange rate impactof a strengthening Australian dollar.
The Group economic loss provision charge(ELP) was $614 million, compared with $610million (excluding the $250 million specialprovision) in the year to September 2002. Thestandard ELP charge to operating segments at$514 million reduced from September 2002.An additional charge of $100 million (7 basispoints) was taken to recognise continueduncertainty and expected levels of default inthe offshore lending portfolios.
Geographic new non-accrual loans
20032002
$150m
$0m
$350m
$300m
$200m
$250m
$100m
$50m
Energy Domestic Corporate Asset FinanceConsumer Finance Other Offshore Other
New non-accrual loans by source
ANZ Group
Australia & NZ
International
-25% -20% -15% -10%
15%
11%
-5% 0% 5% 10% 15%
-24% -9%
Local currencyAustralian dollars
24% reduction in gross lending assets in offshore portfolioLending asset growth for the year to Sept 2003
Doubtful Debts Provision reflectsimproved underlying portfolio*
New non-accruals reduced 23% on 2002
In recent years, ANZ has been repositioningitself away from higher risk offshoreinstitutional lending, towards lower riskdomestic lending as reflected in our 2003growth in Mortgages and reduction in US andUK lending. This has resulted in a reduction inour ELP rate over time, which fell from 43 basispoints in September 2002 to 39 basis points inSeptember 2003.
For further information on financial terms, please refer to the Guide to Concise Financial Report on page 48and the Investor Snapshot on page 2

12Risk Management
Key TermsArrears – a contractually due and payable sum which remains overdue/unpaid.
Credit risk – the potential for loss arising from the failure of a customer or counter-party tomeet its contractual obligations.
Market risk – the potential loss the Group mayincur from changes in interest rates, foreignexchange rates or the prices of equity sharesand indices, commodities, debt securities andother financial contracts, including derivatives.It also includes the risk that the Group willincur increased interest expense arising fromfunding requirements during periods of poormarket liquidity.
Operational risk – the direct or indirect lossresulting from inadequate or failed internalprocesses, systems, or from external events.
Over the year, ANZ has remained vigilant inmonitoring and managing the Group’s global risksincluding:
> Credit risk – Overall credit quality remains sound;reduced level of defaults in the corporateportfolio; offshore credit exposures reduced to6% of our loan portfolio.
> Market risk – Levels remain low.
> Operational risk – Strengthened businesscontinuity and crisis management capabilities towithstand the emergence of new threats,including increased threats of terrorism and theSARS virus; enhanced technology riskmanagement processes with specific focus onnew software releases.
> Other risk – Increased focus on strategic andemerging risks; substantial progress made onBasel II (see page 38).
Offshore exposuresWe have reduced our offshore credit exposures,including to the power and telecommunicationsindustries.
> Telecommunications – Active portfoliomanagement of exposures to this sector resultedin a reduction in credit limits for offshoretelecommunications operators of 46%.
> Power –As expected, some further deteriorationin the Group’s US power portfolio over the lastyear was experienced, however, our US powerexposures have been managed down by 28% to $1.3 billion and any further losses which might result from this portfolio are expected to be manageable.
Australia and New Zealand marketThe Australian and New Zealand portfolio riskprofile has continued to improve over the yearwith strong mortgage growth and reduced highrisk exposures.
> Consumer portfolio – Arrears and loss rates arenow at or near historically low levels; low-riskpersonal business exposures now comprisetwo thirds of the Group’s loan portfolio.
> Residential property market – Adherence toconservative lending criteria, including allowingfor the likelihood of interest rate increases in
the assessment of borrowers’ capacity to makemortgage payments has ensured a robustmortgages portfolio; we also have conservativelending policies in place to ensure our riskexposure to inner-city apartment marketsacross Australia is minimised.
> Recent APRA stress-testing of our mortgagesportfolio confirms that we are well-placed towithstand a severe downturn in the Australianhousing market.
Large Individual Credit ExposuresOver the year to September 2003, ANZ hasmanaged down its large exposure risks andsignificantly reduced portfolio concentrations. To further reduce risk in the Group’s creditportfolio, our maximum limits applicable toexposures to individual customers have alsobeen reduced.
12
>BB-
B+ to CCCNon Accrual
5.7%1.5%
2.3%0.6%
BB-
BB+ to BB
BBB-
AAA toBBB 14.8% 12.8%
55.3%
15.3%
13.7%
41.5%
19.2%
17.3%
7.2% 2.9%
Sep 98 Sep 03
The Group’s credit risk profile, representing therisk of our customer lending portfolio, hasimproved over the last 5 years. This is evidentwith growth in our lower risk domestic portfolios(particularly mortgages in the BBB- category)and reductions in our high risk exposures.
*Internal credit ratings have been mapped to externalcredit grades
ANZ Group’s credit risk profile hasimproved over the last 5 years*

1313
Mark LawrenceChief Risk Officer
ANZ haslowered riskacross itsglobal portfolio
excludes non-recourse and uncommitted facilities
60%
90%
120%
150%
30%
0%
Sep 03Sep 02Sep 01
Australia Americas Asia NZ International
100%
0%
Sep 03Sep 96
15%
15%13%
6%
70% 81%
Pacific Europe
24%
35%
9%
32%
Personal business Corporate business
100%
0%
Sep 03Sep 97
54%66%
46%34%
In line with strategy, lower risk personalbusinesses now comprise two thirds of thecredit loan portfolio. This has been underpinnedby strong growth in the mortgages portfolio.
In line with ANZ’s lower risk strategies, offshorelending exposures have decreased as aproportion of total lending assets.
One measure of the concentration of largeexposures in the Group’s portfolio is theaggregate of the 10 largest committed corporateexposures as a percentage of adjusted commonequity (ACE). This is used as a measure of risk,hence the lower the ratio the lower theconcentration risk. This ratio has declinedsignificantly over the past 24 months.
Lower risk portfolio due to increasedproportion of personal businessesTop 10 exposures further reduced
ANZ portfolio moving toward lower risk domestic exposures
Based on the Group’s lending assets
For further information on financial terms, please refer to the Guide to Concise Financial Report on page 48and the Investor Snapshot on page 2
14
This year I discovered a surprising andinteresting statistic, which I have reflected onfrom an ANZ perpective.
Of the Top 20 companies by marketcapitalisation in Australia in 1980, only eightremained on the 1990 list, and five on the2000 list.
ANZ, I’m pleased to say, is one of those whichhas survived and thrived, albeit with some upsand downs, so that it is one of the five on boththe 1980 and 2000 Top 20 lists.
Our responsibility to deliverThe challenge for ANZ is to continue to createvalue by delivering strong and sustainableperformance and value to shareholders – notonly this year and next year, but over the longterm. While this is the responsibility of anymanagement team, it is particularly true of abank. That’s precisely why there is so muchmention of “sustainability” in this report.
The key to delivering sustainable performanceand value starts with the fundamentals – havinga genuine competitive advantage, ensuringflawless execution of strategy, no-surprisesmanagement and delivering on promises toshareholders.
In financial terms, value represents the capitalinvested in ANZ, plus a premium representingfuture earnings and value that the marketascribes to our expected future economic valueadded. In fact, this explains around 60% ofour share price. It takes into account ourunique specialisation strategy and growthopportunities, the talent of our staff, ourculture, the market positions and customerfranchises held by our specialist businesses,the strength of our brand and our reputationin the community.
While the value of investment represented bytangible net assets per share has risen byaround 9% a year since 1998, the valuerepresented by future economic value addedhas risen by about 21% a year. It’s a compellingstatistic that forces me, as Chief ExecutiveOfficer, to think about business differently.
Focus on long-term valueIt highlights that enduring success means morethan short-term performance. Sustainable valuetakes us beyond the traditional notion ofshareholder value as it has been conceivedand implemented over the past decade. It recognises that delivering sustainable valuein the long-term is, in essence, about restoringcustomer faith and building community trust byunderstanding that we do not serveshareholders exclusively, but others as well.
It is why being the “bank with the human face”has to be at the core of who we are and whatwe do at ANZ. It means we integrate economic,environmental and social factors, andbalance our obligations to different groupsof stakeholders and create value for allof them – shareholders, customers, staff andthe community.
It requires us to continually factor the long-terminto our decision-making.
Our societal purposeThis year we have developed a corporateresponse to environmental and social concernsexpressed by our key stakeholders. Many of ourstaff have been involved in an assessment ofour impact on society, contributing to definingANZ’s “Societal Purpose” and in developing a number of new initiatives to improve ourenvironmental and social performance. Ourparticular approach to sustainability is based on seeing our people, customers andcommunity as an integrated business system.It means embedding society’s environmentaland social concerns into our core businesspractices, products and services to ensure we stay aligned with the society in which we operate.
It formally acknowledges that we exist to meet the needs of shareholders and to do sosuccessfully in the long-term we must recognisethat society’s values and aspirations are marketforces, where people act on their beliefs asvoters, investors, employees and customers.
Building broader relationshipsBecoming a fully engaged, respectedparticipant in society is about building abroader, deeper set of relationships based on respect, trust and integrity. It’s clearlyunderstanding our purpose in society so thatwe have a framework for making decisions.
We believe a focus on sustainability will giveus a competitive advantage. While investorsand customers, governments and otherstakeholders are increasingly favouring thosecompanies whom they see as truly sustainable,we also believe sustainability has the potentialto create new value for shareholders through:
> increasing staff engagement and satisfactionleading to higher productivity and commitmentto ANZ’s success
> growing market share as a result of improvedbrand strength and customer satisfaction
> gains in productivity and lower costs throughimproved environmental, health and safety performance
> improving our lending risk profile throughsuperior understanding of social andenvironmental risks
> enhancing corporate governance by ensuringsystematic transparency and accountabilityin all aspects of our business.
A View from the CEO on Creating SustainableBusinesses
Deliveringsustainableperformanceand value

15
It is not a radical concept. It is why we take timeeach year in our Annual Report to explain not onlyour annual financial results but to report on whatwe are doing for staff, customers and thecommunity we serve.
Integrating sustainabilityThis more formal approach to sustainability,however, involves integrating the concept ofdelivering value to a broad range of stakeholdersinto our business strategies and the way weoperate, and to begin creating greater alignmentbetween the interests of shareholders and thoseof society, and to report transparently on ourprogress. It will mean seeking help from andcreating new relationships with groups from awide cross-section of society.
It is the focus on these themes that will allow usto continue to create value and to ensure ANZ isa leading company today and in 20 years time.
John McFarlaneChief Executive Officer
Sep 98
0
$2
$4
$6
$8
$10
$12
$14
$16
$18
$20
$22
Market expectations of future performance determine our current share price
$17.95
$9.02
Tangible net assets per share
$4.98
Expected future economic value added
$4.04
$7.49
$10.46
Compound growth 9%
Tangible net assets per share
Expected future economic value added
> Unique strategy> Sustainable leadership> Growth opportunities
> Strong brand> Talented people> Vibrant culture
Compound growth 21%
Sep 03
Serving different stakeholders
Shareholders own ANZ and appoint directors, therefore the directors’ focus is on shareholders
Directors have a duty to act in the best interests of ANZ
Sustainable performance…Growing acknowledgement that to protect the long-term value of ANZ, the needs of our customers, people, shareholders and community must be addressed

On 24 October 2003, ANZ announced it hadreached agreement with Lloyds TSB to acquireTheNational Bank ofNew Zealand for $4.915billion at exchange rates on 23 October 2003.
New Zealand’s best bankThe National Bank of New Zealand is one ofNew Zealand’s leading banks with net loansand advances of NZ$35 billion representingaround 23% of industry lending. It has strongmarket share in personal, rural, and smallbusiness banking including a national networkof 160 retail branches and 260 ATMs.
The National Bank of New Zealand alsoenjoys consistently high customer and staffsatisfaction levels. In the year to September2003, The National Bank of New Zealandmaintained its top position in the ACNielsenConsumer Finance Monitor with 71% of personalcustomers rating its service as excellent or verygood. This is coupled with leading levels of staffsatisfaction (85%).
The National Bank of New Zealand’s trackrecord of value creation is based on anefficient operating model, strong revenuegrowth with sound credit quality and high levelsof staff and customer satisfaction driven by astrong and experienced management team.
A strong existing businessANZ of course already has a strong business inNew Zealand that dates back to 1840. Today,ANZ has established its position among the topfive banks in New Zealand with over one millionpersonal customers and a leading position incorporate banking.
We have also taken a number of steps toinvigorate our existing business in New Zealandincluding more autonomy for New Zealandmanagement and a series of initiatives to improvecustomer satisfaction including introducing newproducts, opening branches and re-organisingour approach to personal banking.
Strategic milestoneThe acquisition is a significant strategicmilestone for ANZ. It is part of ANZ’s strategy todevelop leading positions in growth businessesin its home markets and clearly establishes ANZas New Zealand’s largest bank. It also reflectsour long-term confidence in New Zealand’seconomic prospects.
A different acquisitionFollowing completion of the acquisition of TheNational Bank of New Zealand in December2003, our combined business in New Zealandwill contribute as much as 30% of earnings in future years. Naturally, the significance of ourbusiness and of our presence in New Zealandwill necessitate a very different approach tothinking about our business in New Zealand, ourcustomers, staff and our role in New Zealand asthe largest provider of banking services.
We have already stated the acquisition willbe very different – one based on improvingcustomer service, satisfaction and growth.ANZ intends that both the ANZ and TheNational Bank of New Zealand brands, namesand branch networks will be retained for theforseeable future. By working together withThe National Bank of New Zealand andfocusing on the interests of our customers,staff and the community we can create a betterorganisation in the future for New Zealand andfor shareholders.
The National Bankof New Zealand
16

17
An acquisitionbased oncustomersatisfactionand growth

Sally Morgan enjoysthe flexibility ofworking part of herweek from home.This is another wayANZ is committed to life balance for its people
.
People 18

19
Better organisational leadership, talent and avibrant culture results in better performance forshareholders. It’s a big statement, but globallycompanies rated as being leaders in theirpeople practices produce, on average,significantly higher returns to shareholders thanindustry peers. It is easy then to understandwhy we have consistently placed so muchemphasis on creating a unique ANZ culture thatengages and involves everyone in the company.
Real progressWe survey all of our staff twice yearly to measureour progress. In 2000, when we started theprocess of systematically developing our cultureas a unique and competitive asset as part of ourspecialisation strategy, only 52% of staff weresatisfied working for ANZ. The top 10 values ofmanagement included bureaucracy, hierarchy,control and short-term focus.
Through the programs we have put in place,staff satisfaction now stands at more than 80%,and the values of the past have been replacedby customer focus, achievement, accountabilityand continuous improvement.
These programs involve our people at all levels.They help foster diversity, create opportunities,encourage ongoing learning through trainingand education, promote a healthy life balanceand build a distinctive culture. They aredesigned not only to nurture individual talentbut also to develop ANZ as an organisationbest able to meet the needs of customers,shareholders, staff and the community.
Cultural transformationSince 2000, over 13,000 of our peoplehave participated in a cultural transformationprogram called Breakout. Breakout emphasisesleadership, diversity, coaching and development.This program reflects today’s reality thateveryone in the organisation has to be a leader,whether it is at the moment of contact with thecustomer or at the moment of a decision in theirday-to-day role.
Creating opportunitiesTo support this transformation, we havedeveloped opportunities for our people toenrich their careers at ANZ and provide thenecessary skills required to meet businessneeds. For example, the Opportunities@ANZinitiative provides information and resourcesfor staff to develop their careers through shortand long-term job placements and professionaldevelopment programs.
We have made significant progress instrengthening our talent identification and this has profoundly improved the quality ofleadership succession, creating opportunitiesfor our talented people as well as bringing infresh talent from the market.
We are fostering diversity within ANZ through the establishment of diversity forums within our specialist businesses. Representation of females in ANZ management roles is aboveaverage for the banking and finance industry andwe are incrementally increasing representation– over 31% of middle management rolesare currently held by women. In executivemanagement, almost 17% are women and by 2005 our expectation is that women willfill 20% of executive roles.
Health and safetyANZ has a strong commitment to the health,safety and well-being of our people. We arecontinuously improving our managementsystem aligned with regulatory standards andannual external audit review. All reportedinjuries continue to trend downwards with a28% reduction in the incidence rate per 1000staff since 2000 in Australia and New Zealand.Recognising the importance of personalwellness we are actively looking at innovativeways to improve the overall well-being ofour people.
ANZ is a people and values orientedorganisation with a shared vision of becoming quite a different companyand realising the ability for each person tocontribute their very best. By doing this wecreate sustainable value for our shareholders,staff and the community we serve.
A more vibrantculture createsvalue forshareholders
2003200220012000
Staff satisfaction continues to rise ANZ overall satisfaction
20%
0%
50%
75%
100%
Australia and New Zealand staff
30
20
40
50
60
10
0
2003200220012000
28% reduction in reported injuries since 2000 All reported injury incidence rate per 1000 staff
managerssenior managersexecutives
ANZ expects to have 20% of executive positions held by women by 2005
15%
0%
20%
35%
25%
30%
10%
5%
2000 2001 2002 2003

The first step towards change is knowing thatyou need to change.
During the 1990s, ANZ followed most other banksin Australia. We introduced electronic transactionchannels and reduced the size of our branchnetwork. We improved our pricing disciplines andworked hard to reduce our processing costs. At thesame time, we invested in the development ofleading retail products. Our growth in creditcards and mortgages is evidence of our successin building strong specialist product businesses.
In financial terms, this strategy was verysuccessful for shareholders. But it was notsustainable for customers or the community. By closing branches we damaged our reputationwith the community and reduced our ability totalk to our customers about their needs and howwe could help meet them. Ultimately, a declinein staff and customer satisfaction will translateinto lower returns for shareholders.
We knew we had to change.
Re-energising our businessThe first decision we took, in 2000, was to stopclosing branches in rural Australia. This decisionremains in place and, in the past 12 months, wehave started to open new branches and add moreATMs. Being present where our customers wantus to be is a core part of our strategy – it is partof putting “retailing” back into retail banking.
Last year, we went one step further andestablished a program to reconnect with local communities. We did this by devolving our personal banking business into small,community-based businesses, each with a Local CEO in charge. Our local teams treat theirbusiness and the customers as their own. Theyhave their own profit and loss statement andincreasingly share in the local results they create.
In our Rural Banking business, the local businessmodel is best established. Here, our localteams look after all customers that live in thecommunity, including personal customers, smallbusinesses and agribusinesses. By giving ourpeople and customers the confidence that ANZwill be there for them come rain or shine, we arebeing rewarded with higher productivity andmore business.
Investing in branchesTo deliver a professional retailing environmentwe need to invest in our branch network. Duringthe year, we have refurbished more than 100branches and increased the focus on salestraining and merchandising. We have developeda new telling platform, which will be rolled outto all branches in the 2004 financial year.
This strategy of investment and growth hasre-energised our network and our people.Things have started to change.
The market is recognising our progress. In 2003,Personal Investor magazine named us BankingInstitution of the Year, Savings Institution of theYear and Agri Lender of the Year in Australia.
Winning new customersWe are confident the investments we are making in our product businesses and indistribution will translate into higher customersatisfaction and market share. We continue to grow our credit card and mortgagebusinesses, and in the last 18 months, wehave made good progress in building ourposition in transaction banking and deposits.In 2002, we introduced two new, lower costtransaction accounts and, since then, wehave added approximately 100,000 newcustomers to ANZ.
We have also improved access to bankingservices for those on low incomes andpensions. Our Access Basic Account provideseffectively fee-free banking for customerswith a health care card.
Personal and Rural Customers Getting on
with a newapproach
20
Acting to fix problemsMeanwhile, we know that things don’t alwaysgo the way we plan. And when they do gowrong, we sometimes take too long to fix theissues for our customers. Addressing this hasbecome a top priority.
We have started by setting ourselves targetsaround problem and complaint resolution, andmade these part of our Customer Charter.We have appointed a Customer Advocate toensure that more protracted complaints areresolved fairly, and that we report each year onour progress.
We are also trying to improve the understandingof financial services in Australia. We have taken the lead by commissioning Australia’sfirst comprehensive study on financial literacy,supported by a range of initiatives to assistcustomers with their financial literacy needs(see page 26).
Anyone who has stood in a queue, waited forsomeone to answer the phone or thought aboutapproaching a competitor after a poor experienceknows we still have much to do. We mustmake the transition if we are going to create a sustainable business for our shareholders,customers and the community we serve.
The strategy for our Personal Banking businessis simple. Our aim is to provide our customerswith market leading products, reliable serviceand someone local to turn to. It’s about beingthe “bank with the human face” and being easyto do business with; part of our journey towardshaving the customer at the centre of everythingwe do.
21
Dairy farmer, Mark Disisto,finds ANZ’s flexiblefinancial solutionsmeet his personaland business needs
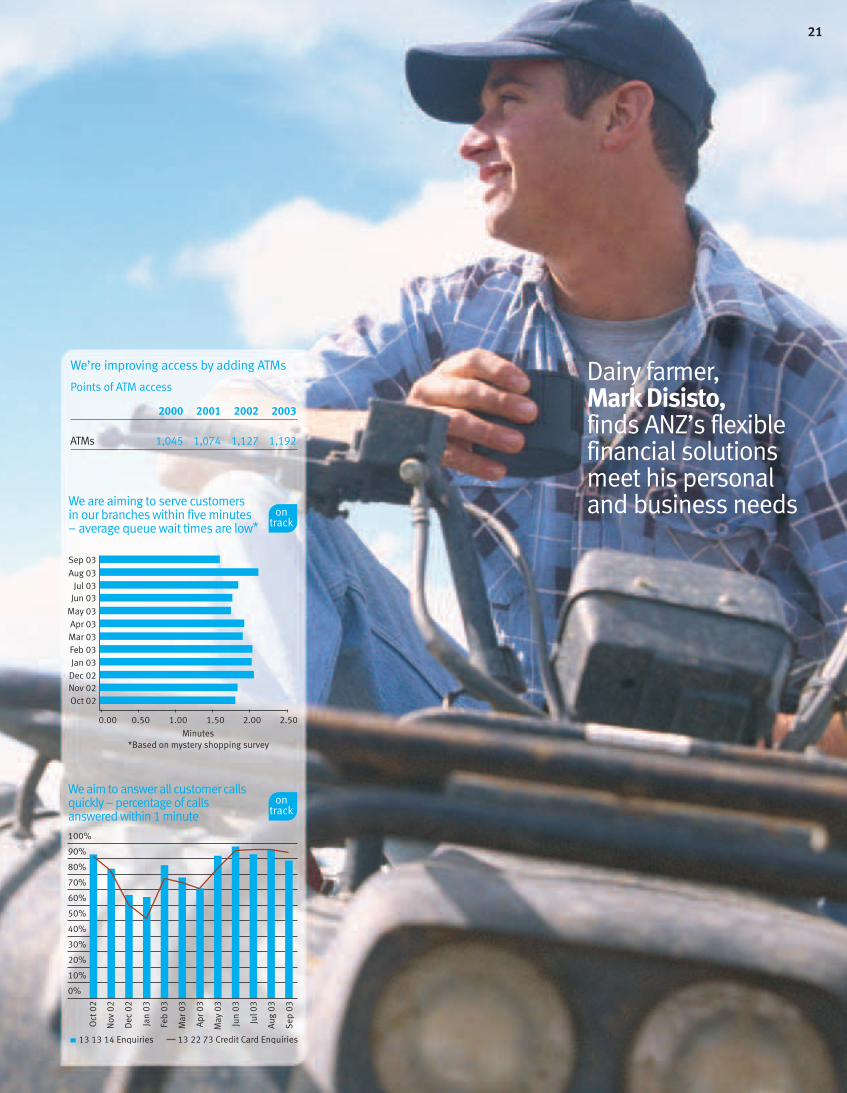
We aim to answer all customer calls quickly – percentage of calls answered within 1 minute100%
90%
80%
70%
60%
50%
40%
30%
20%
10%
0%
Oct
02
Nov
02
Dec
02
Jan
03
Feb
03
Mar
03
Apr
03
May
03
Jun
03
Jul 0
3
Aug
03
Sep
03
13 13 14 Enquiries 13 22 73 Credit Card Enquiries
We are aiming to serve customers in our branches within five minutes – average queue wait times are low*
0.00
Sep 03
Aug 03Jul 03
Jun 03
May 03Apr 03Mar 03Feb 03Jan 03
Dec 02Nov 02Oct 02
0.50 1.00 1.50 2.00 2.50
Minutes*Based on mystery shopping survey
2000 2001 2002 2003
ATMs 1,045 1,074 1,127 1,192
We’re improving access by adding ATMs
Points of ATM access

Ray’s Outdoors hasgrown from a smallGeelong-based retailstore to a 17-locationoperation. Ray Frost,Managing Director, has made his dream a reality – ANZ hasbeen there to assist
Business Banking 22
23
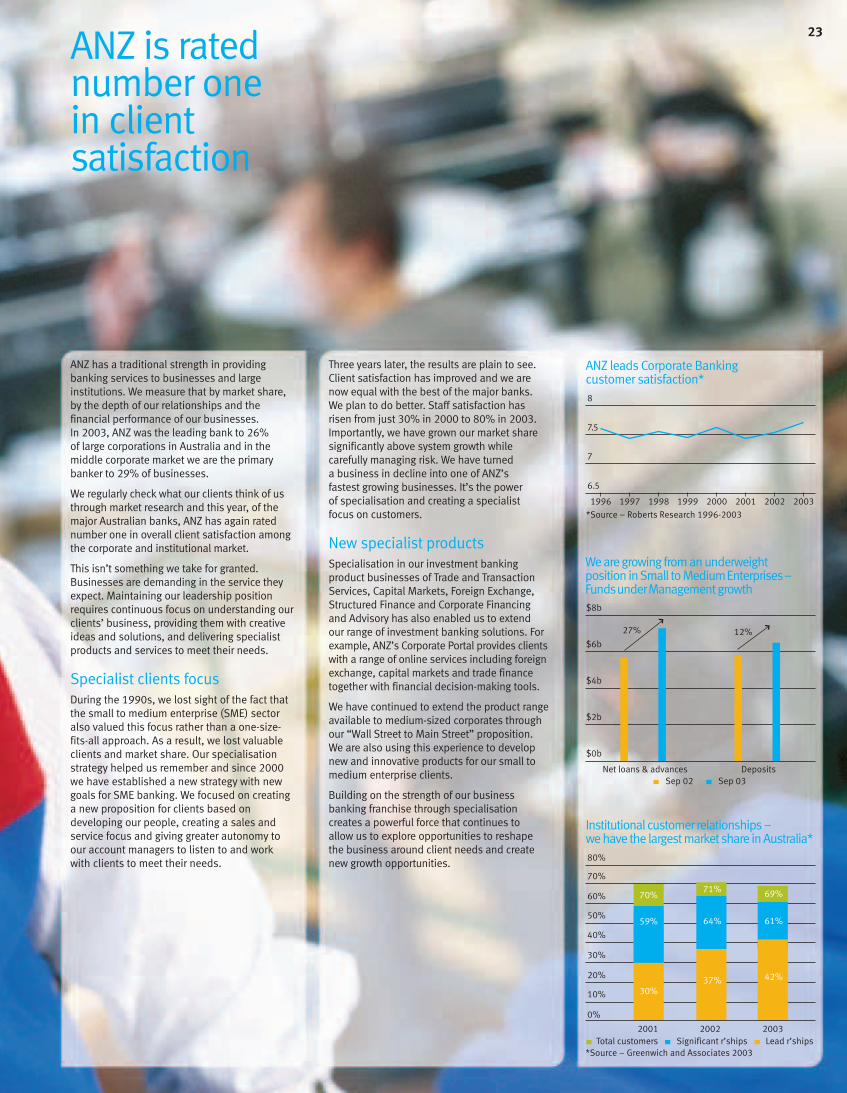
ANZ has a traditional strength in providingbanking services to businesses and largeinstitutions. We measure that by market share,by the depth of our relationships and thefinancial performance of our businesses. In 2003, ANZ was the leading bank to 26% of large corporations in Australia and in themiddle corporate market we are the primarybanker to 29% of businesses.
We regularly check what our clients think of usthrough market research and this year, of themajor Australian banks, ANZ has again ratednumber one in overall client satisfaction amongthe corporate and institutional market.
This isn’t something we take for granted.Businesses are demanding in the service theyexpect. Maintaining our leadership positionrequires continuous focus on understanding ourclients’ business, providing them with creativeideas and solutions, and delivering specialistproducts and services to meet their needs.
Specialist clients focusDuring the 1990s, we lost sight of the fact thatthe small to medium enterprise (SME) sectoralso valued this focus rather than a one-size-fits-all approach. As a result, we lost valuableclients and market share. Our specialisationstrategy helped us remember and since 2000we have established a new strategy with newgoals for SME banking. We focused on creatinga new proposition for clients based ondeveloping our people, creating a sales andservice focus and giving greater autonomy toour account managers to listen to and workwith clients to meet their needs.
Three years later, the results are plain to see.Client satisfaction has improved and we arenow equal with the best of the major banks. We plan to do better. Staff satisfaction hasrisen from just 30% in 2000 to 80% in 2003.Importantly, we have grown our market sharesignificantly above system growth whilecarefully managing risk. We have turned a business in decline into one of ANZ’sfastest growing businesses. It’s the power of specialisation and creating a specialistfocus on customers.
New specialist productsSpecialisation in our investment bankingproduct businesses of Trade and TransactionServices, Capital Markets, Foreign Exchange,Structured Finance and Corporate Financing and Advisory has also enabled us to extend our range of investment banking solutions. Forexample, ANZ’s Corporate Portal provides clientswith a range of online services including foreignexchange, capital markets and trade financetogether with financial decision-making tools.
We have continued to extend the product rangeavailable to medium-sized corporates throughour “Wall Street to Main Street” proposition. We are also using this experience to developnew and innovative products for our small tomedium enterprise clients.
Building on the strength of our businessbanking franchise through specialisationcreates a powerful force that continues to allow us to explore opportunities to reshape the business around client needs and createnew growth opportunities.
ANZ is ratednumber one in clientsatisfaction
ANZ leads Corporate Banking customer satisfaction*8
7.5
6.5
7
2002 2003200120001999199819971996
*Source – Roberts Research 1996-2003
Total customers Significant r’ships Lead r’ships
80%
0%
20032001 2002
Institutional customer relationships –we have the largest market share in Australia*
70%
30%
69%
61%59%
42%
71%
64%
37%
70%
60%
50%
40%
30%
20%
10%
*Source – Greenwich and Associates 2003
DepositsNet loans & advances
We are growing from an underweight position in Small to Medium Enterprises – Funds under Management growth$8b
27% 12%$6b
$4b
$2b
$0b
Sep 02 Sep 03
While we want to put a human face to banking,it is technology that allows us to provide apersonalised, consistent service to ourcustomers. It is technology that empowers ourcustomers and staff with real-time informationand access. It allows us to reduce costs,improve productivity, and simplify andautomate administrative functions. It istechnology that makes our business work forcustomers, staff and shareholders.
Transforming our businessThere are fundamentally two waysof thinking about the technology. The first is allabout computing – chips, databases, operatingsystems, software and other technologyelements. It’s focusing on the second way ofthinking about technology – extracting valuethrough the application of computing toimprove or transform our businesses – whichsets ANZ apart.
That is why we have made a substantialinvestment in technology in recent yearsto move beyond thinking about specificcomputing needs in terms of data centres,storage systems or even PCs, to thinking about the entire infrastructure on which our business runs – the infrastructure thatconnects and supports relationships andtransactions within our specialist businessesand with our customers.
Simplifying our infrastructureIn 1998, ANZ’s approach to technology wasrelatively inwardly focused and based on highercost complex infrastructure involving six coresystems, 15 data networks and many differentplatforms. Today, technology at ANZ is morecustomer focused with improved processes anda vastly simpler infrastructure involving two core systems, a single data network andstandardised hardware and software platforms.
Managing technology for valueTransforming ANZ’s infrastructure has given usthe ability to move into a new phase, where we will seek to extract greater value from ourtechnology investments through back-to-basicsperformance management.
It involves maximising value from the majorprojects we have undertaken in the past fiveyears. Including:
> our new telling system to replace the ageinghardware and software platform we use toserve customers in our branch network
> common web-based Peoplesoft software toreplace legacy administration systems
> our new VisionPlus credit card platform
> our state of the art image-based chequeanditemprocessing system, and
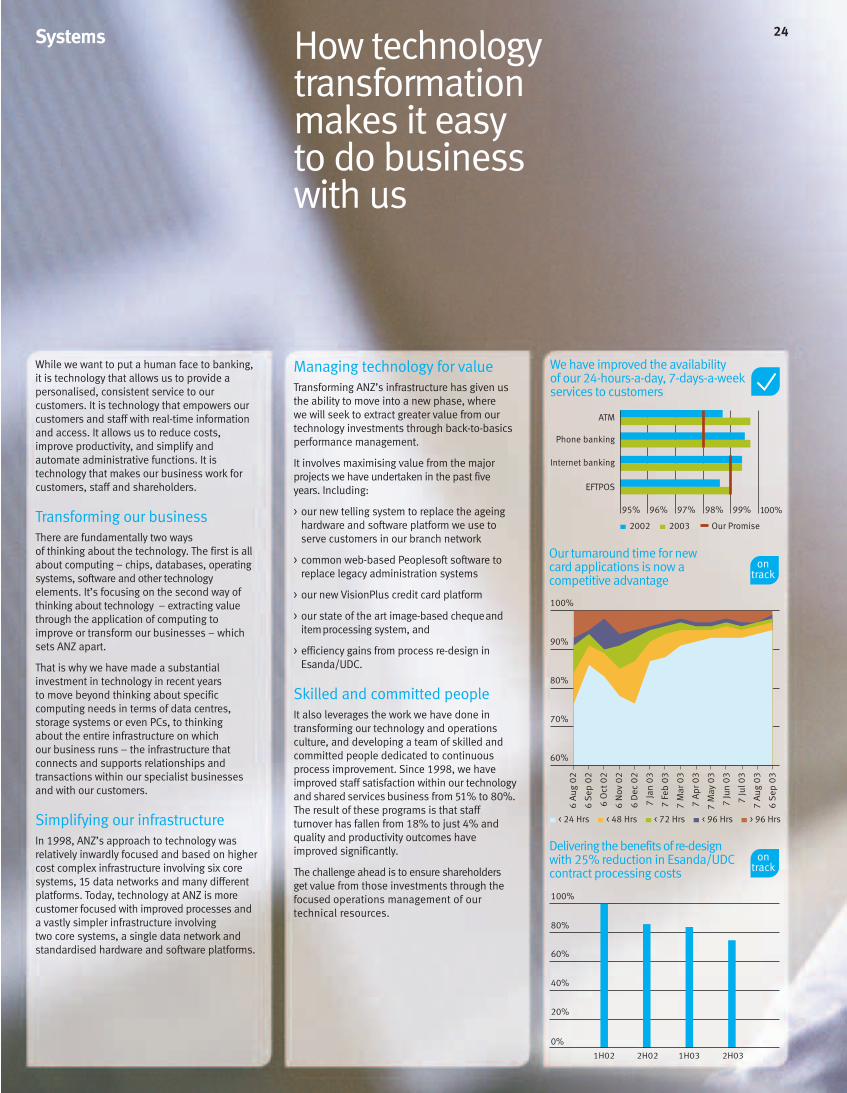
> efficiency gains from process re-design inEsanda/UDC.
Skilled and committed peopleIt also leverages the work we have done intransforming our technology and operationsculture, and developing a team of skilled andcommitted people dedicated to continuousprocess improvement. Since 1998, we haveimproved staff satisfaction within our technologyand shared services business from 51% to 80%.The result of these programs is that staffturnover has fallen from 18% to just 4% andquality and productivity outcomes haveimproved significantly.
The challenge ahead is to ensure shareholdersget value from those investments through thefocused operations management of ourtechnical resources.
Systems How technologytransformation makes it easyto do businesswith us
24
60%
70%
80%
90%
100%
6 A
ug 0
2
6 S
ep 0
2
6 O
ct 0
2
6 N
ov 0
2
6 D
ec 0
2
7 Ja
n 0
3
7 F
eb 0
3
7 M
ar 0
3
7 A
pr 0
3
7 M
ay 0
3
7 Ju
n 0
3
7 Ju
l 03
7 A
ug 0
3
6 S
ep 0
3
< 24 Hrs < 48 Hrs < 72 Hrs < 96 Hrs > 96 Hrs
Our turnaround time for new card applications is now a competitive advantage
1H03 2H032H021H02
Delivering the benefits of re-designwith 25% reduction in Esanda/UDC contract processing costs
0%
100%
80%
60%
40%
20%
We have improved the availability of our 24-hours-a-day, 7-days-a-week services to customers
2002 2003 Our Promise
Phone banking
Internet banking
EFTPOS
ATM
100%99%98%97%96%95%

25
Anastasia Bakolias –a Customer ServiceConsultant at ANZ’sCall Centre – deliversdistinctive customerservice every day
Partnering on financial issuesWe have also developed responses to some ofthe major social issues that involve the financialservices industry. These issues include financialliteracy and the low level of national savings.
During the year, ANZ commissioned and publishedthe results of the first national survey of adultfinancial literacy. For the first time, the researchprovides benchmarks for the measurement offinancial literacy across the Australian population.It also identifies aspects of financial productsand services that are causing the greatest problemsfor consumers and those segments of thepopulation that are struggling with financial skills.
ANZ has committed to improve financialliteracy in Australia, particularly among itsown customers. We are integrating the learningsfrom the survey into our business operations,training our people so they can identify andassist customers facing financial difficulty andestablishing a community partnership to developan adult education program.
This year, we have trained over 3,500 serviceconsultants in branches throughout Australiaand introduced a booklet titled “Kick-start yourfinancial fitness” to help people who want to useand manage their money more effectively. OurConsumer Finance business has also developeda website and series of brochures to assistcustomers and the community to betterunderstand how credit works.
In partnership with the Brotherhood of StLaurence, we have also introduced Saver Plus –Australia’s first matched savings program. It encourages families on lower incomes toregularly and consistently save for costs associatedwith their child’s secondary schooling.Participants will also receive financial educationtraining. The Saver Plus pilot aims to help 300Australian families on lower incomes reach asavings target and encourage or establish asavings habit.
Thefirst Saver Pluspilot commenced in Frankston,Victoria. ANZ and the Brotherhood are nowworking with Berry Street Victoria and TheBenevolent Society to conduct further programsin Shepparton, Victoria, and Campbelltown, New South Wales.
Rebuilding community trust begins withrecognising that our standing in the communityis as important to our future as ourrelationships with customers and staff.
We know that many in our society believe bankshave become increasingly detached from thecommunity. Many of the actions which fosteredthat view arose out of a focus on short-termshareholder value. This undermined customerfaith and public trust and diminished the pridestaff felt in working for us.
Strengthening local communitiesRebuilding community trust is about acting with fairness and integrity. Contributing to the health of local communities can also play a role.
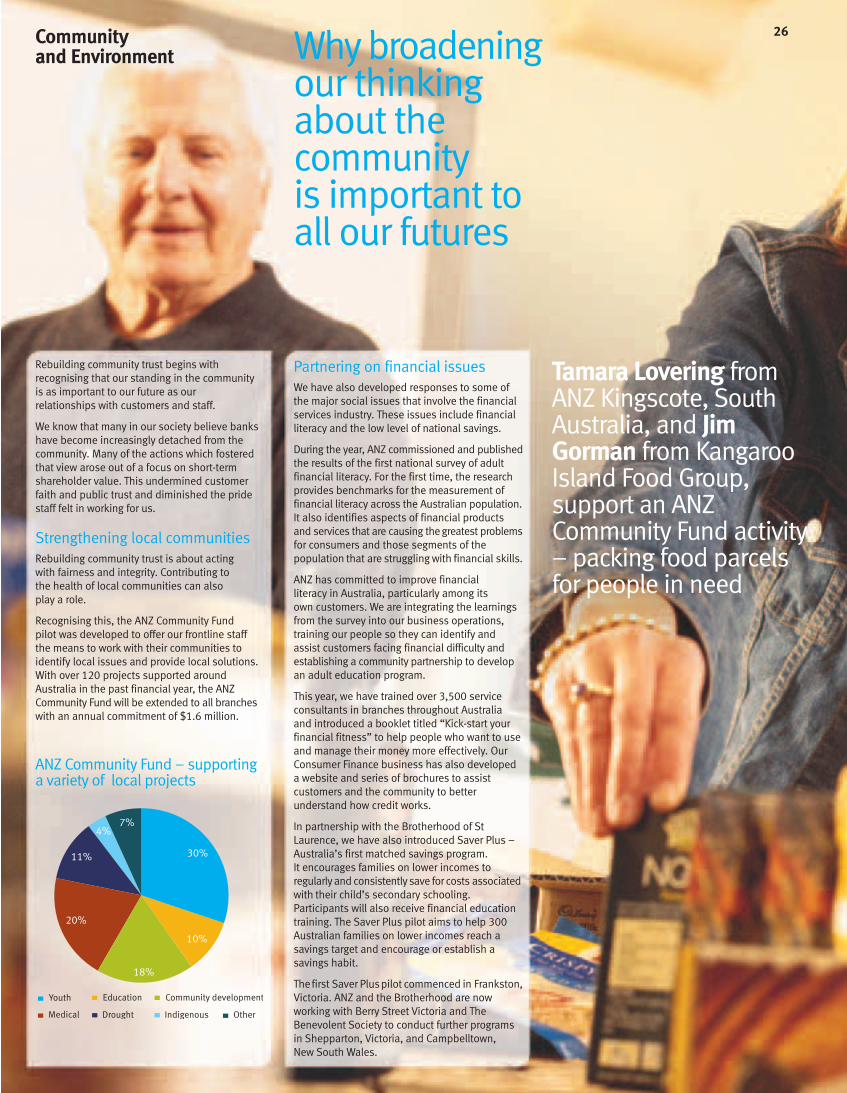
Recognising this, the ANZ Community Fund pilot was developed to offer our frontline staffthe means to work with their communities toidentify local issues and provide local solutions.With over 120 projects supported aroundAustralia in the past financial year, the ANZCommunity Fund will be extended to all brancheswith an annual commitment of $1.6 million.
ANZ Community Fund – supportinga variety of local projects
Tamara Lovering fromANZ Kingscote, SouthAustralia, and JimGorman from KangarooIsland Food Group,support an ANZCommunity Fund activity– packing food parcelsfor people in need
Communityand Environment Why broadening
our thinkingabout thecommunityis important to all our futures
26
Youth Education Community development
20%
18%
10%
30%11%
4%7%
DroughtMedical OtherIndigenous

27
Changing environmental impactsANZ also believes that it has an obligation to shareholders and society to operate as efficiently as possible to reduce itsenvironmental impacts. It is part of being a well-managed business. This includes ourdirect impacts – the resources we use incarrying out our operations such as energy,paper and travel, and our indirect impacts –such as the impacts of our customers towhom we lend and invest in.
In 2003, ANZ undertook a thoroughassessment of its environmental impacts andexamined its performance in managing thoseimpacts against some of its internationalpeers. We also consulted and engagedour staff and community groups on howimprovements can be made to reduce bothour direct and indirect impacts.
Improving our performanceBuilding on ANZ’s existing programs we haveundertaken a number of new initiatives toassist in managing our direct impacts. These include:
> appointing a full-time environmental managerto coordinate activities and develop oursystems
> examining our supply chain and assessingways to integrate environmental criteria intoour purchasing decisions
> developing a set of corporate improvementtargets and specific initiatives to meet these
> continuing to work on achieving ourcommitments to the Federal Government’sGreenhouse Challenge program
> becoming a signatory to the United NationsEnvironment Programme Finance Initiatives andengaging a range of external stakeholders
> reviewing our existing environmental lendingpolicy and procedures
> engaging ANZ’s external auditor to review ourdata measurement systems and verify theenvironmental baseline we established.
Further details on ANZ’s environmentalprogram and performance can be found at www.anz.com/sustainability.
New lending opportunitiesSustainability also creates new lending andinvestment opportunities. During the past year,a number of business units have been exploringthe demand for new “green” lending products.ANZ’s Infrastructure Services business has beenactive in the renewable energy area and hasrecently partnered with Spain’s EHN to pursuenew wind power opportunities in Australia. Our International Structured Finance businessis also pursuing new lending opportunities inthe growing renewable energy market in Europe.
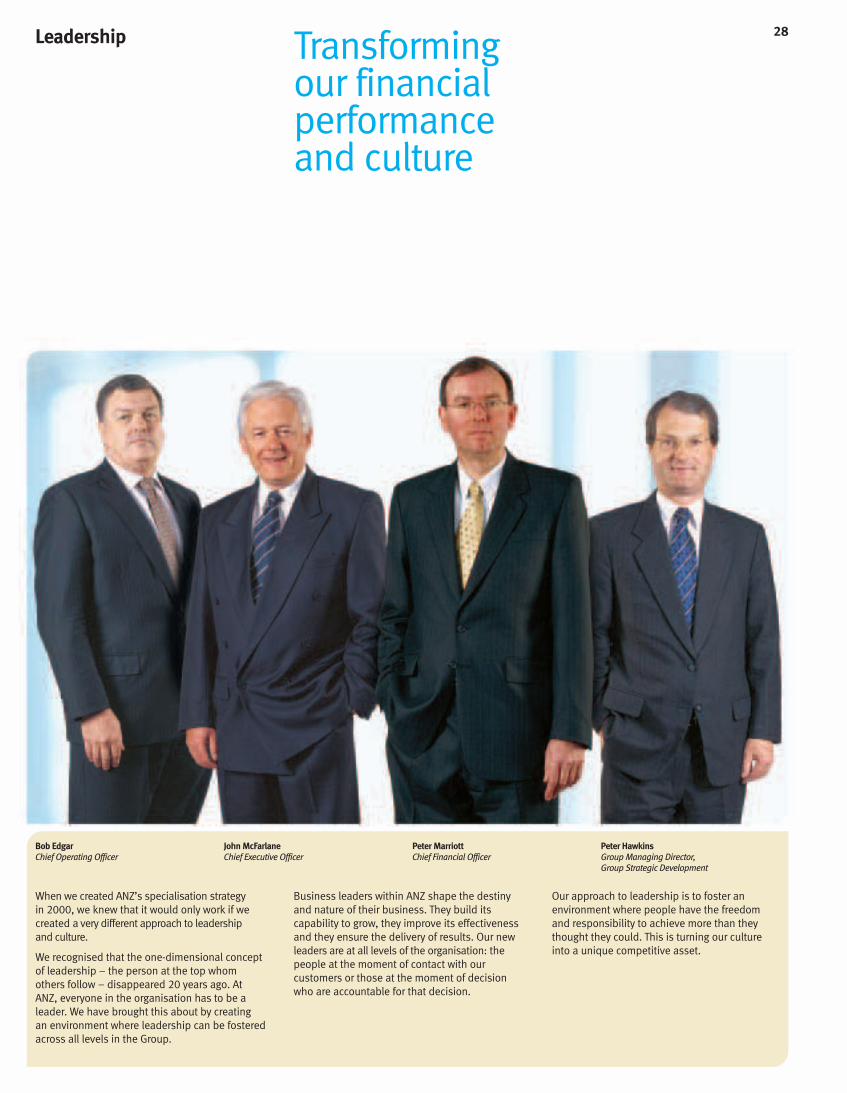
28Leadership Transformingour financialperformanceand culture
When we created ANZ’s specialisation strategyin 2000, we knew that it would only work if wecreated a very different approach to leadershipand culture.
We recognised that the one-dimensional conceptof leadership – the person at the top whom others follow – disappeared 20 years ago. AtANZ, everyone in the organisation has to be aleader. We have brought this about by creating an environment where leadership can be fosteredacross all levels in the Group.
Business leaders within ANZ shape the destinyand nature of their business. They build itscapability to grow, they improve its effectivenessand they ensure the delivery of results. Our newleaders are at all levels of the organisation: thepeople at the moment of contact with ourcustomers or those at the moment of decisionwho are accountable for that decision.
Our approach to leadership is to foster anenvironment where people have the freedomand responsibility to achieve more than theythought they could. This is turning our culture into a unique competitive asset.
Bob EdgarChief Operating Officer
John McFarlaneChief Executive Officer
Peter MarriottChief Financial Officer
Peter HawkinsGroup Managing Director, Group Strategic Development

29
ConsumerFinance
Corporate NewZealand Banking
Esanda/UDC MortgagesPersonal Banking and Wealth Management
Institutional Financial Services
Asia Pacific
Operations, Technology & Shared Services and Corporate Centre
The ANZ organisation
Shane FreemanGroup General Manager, People Capital
Graham HodgesManaging Director, Corporate & Small to MediumEnterprise Banking
Grahame MillerManaging Director, Major Investment Programs
David BoylesChief Operations Officer
Brian HartzerManaging Director, Consumer Finance
Elizabeth ProustManaging Director,Esanda
Greg CammManaging Director, New Zealand
Mark LawrenceChief Risk Officer
Elmer Funke KupperManaging Director,Personal Banking and WealthManagement Australia
Chris CooperManaging Director,Mortgages

30
New Zealand BankingGreg Camm, Managing Director New Zealand Banking
NZ Banking provides banking services, includingwealth management, for personal, small businessand corporate customers in New Zealand throughbranches, call centres, relationship managers andonline banking.
Staff satisfaction 88% (up from 83% in 2002)
$m 2003 2002 %
Operating income 538 490 10
Operating expenses -314 -281 12
Provisions -13 -13 0
Profit before tax 211 196 8
Income tax expense(A) -70 -65 8
Net profit 141 131 8
Cost to income ratio (CTI) 58.4% 57.3% 2
Staff (FTE) 2535 2371 7
Performance
Profit – Increased 8% driven by an appreciation inthe New Zealand dollar. Excluding the exchange rateimpact, profit was flat. This was due to flat feegrowth as we improved the competitiveness of ourproduct ranges; and increased frontline branch staffnumbers to improve customer service.
CTI – Increased by 2%, reflecting the investment infrontline staffing as part of the Restoring CustomerFaith program in Personal, and increasing capacityin Business and Rural.
Risk Management – Credit quality remains soundwith provision for doubtful debts charge falling 5%(in local currency terms) despite solid lending
Business Profiles
CorporateGraham Hodges, Managing DirectorCorporate and Small to MediumEnterprise Banking
Corporate comprises two businesses: Small toMedium Enterprises Australia (SME), whichprovides banking services for businesses withturnover up to $10 million; and Corporate BankingAustralia, which manages customer relationshipsand develops financial solutions for businesseswith turnover $10 million to $100 million.
Staff satisfaction 85% (7% improvement on 2002)
$m 2003 2002 %
Operating income 653 604 8
Operating expenses -219 -212 3
Provisions -48 -46 4
Profit before tax 386 346 12
Income tax expense(A) -116 -104 12
Net profit 270 242 12
Cost to income ratio (CTI) 33.5% 35.1% -5
Staff (FTE) 1597 1487 7
Performance
Profit – Increased by 12% with net interest incomegrowth of 9% due to strong volumes in bothdeposits and lending. Business growth resultedfrom an increased geographical presence, a focuson industry specialisation and stronger salesdisciplines.
CTI – Decreased as efficiency of the businesscontinues to improve.
Risk Management – Overall portfolio risk profileremains strong. Provision for doubtful debtsincreased 4% against a 19% growth in lendingvolumes. However, net specific provisions rose16% in 2003 largely reflecting problems with two
Esanda/UDCElizabeth Proust, Managing DirectorEsanda
Esanda/UDC delivers motor vehicle andequipment finance; equipment operating leasesand management services; fleet managementservices; and investment products through Esanda(Australia), Esanda FleetPartners (Australia & NewZealand) and UDC (New Zealand) and SpecialisedAsset Finance (Australia).
Staff satisfaction 79% (up from 77% 2002)
(A) Includes outside equity interest
$m 2003 2002 %
Operating income 429 399 8
Operating expenses -182 -180 1
Provisions -63 -69 -9
Profit before tax 184 150 23
Income tax expense(A) -57 -47 21
Net profit 127 103 23
Cost to income ratio (CTI) 42.0% 44.6% -6
Staff (FTE) 1311 1303 1
Performance
Profit – Increase underpinned by 4% growth in netinterest income resulting from strong asset growthand solid margins in all segments. Other incomeincreased by 25% driven by fees on higherbusiness volumes, profits on end-of-lease vehiclessales and commissions on increased insurancewritings.
CTI – Improved due to strong income uplift, whilstexpenses were held relatively flat with further backoffice operating efficiencies being achieved.
Risk Management – The focus was on the deliveryof robust pricing models and assessment tools.We continued to streamline processes and moreefficiently access customer risks.
Consumer FinanceBrian Hartzer, Managing DirectorConsumer Finance
Consumer Finance includes: Cards Issuing(Australia, New Zealand and Indonesia) providingcredit and charge card services including loyaltyprograms; Cards Acquiring (Australia and NewZealand) providing debit and credit card processing;and Personal Loans (Australia and New Zealand)providing unsecured personal instalment loans.
Staff satisfaction 81% (up from 75% in 2002)
$m 2003 2002 %
Operating income 713 694 3
Operating expenses -347 -310 12
Provisions -152 -161 -6
Profit before tax 214 223 -4
Income tax expense(A) -70 -73 -4
Net profit 144 150 -4
Cost to income ratio (CTI) 48.0% 43.7% 10
Staff (FTE) 1203 1156 4
Performance
Profit – Decreased by 4% due to impact of$38 million one-off pre-tax charge as a result ofan under accrual of loyalty points going back to1999, $20 million of which related to 2002.After adjusting for this, profit reflected stronggrowth in lending volumes, merchant turnoverand cardholder spend. Operating expenses wereup 12% due to volume growth and increasedamortisation costs of new technology andMultiPOS network.
CTI – Increased due to the impact of loyaltyunder accrual.

31
large corporate loans. Credit quality in the SMEsector remains sound.
Staff – Increased total staff due to additionalinvestment in frontline and business-related support.Investment in people and business culturereflected in improved customer satisfaction.
Achievements
Maintained strong growth in the business –Expanded the business in geographic areas whereANZ was previously underrepresented and inspecialist business such as franchising; expandedability to deliver more sophisticated solutions toour Corporate Banking customers.
Continued to recruit skilled people – Over 100additional staff employed for new frontline andspecialised business roles.
Improved customer service efficiency – Established aCorporate “middle office” to free up front line time toserve customers; developed straight throughprocessing for loans and customer documentation.
Continued to create value for corporate customers– Maintained strong focus on offering corporatecustomers the full range of banking services andleading the market in delivery of sophisticatedfinancial solutions.
Goals
> Maintain strong business growth.
> Continue investing in process and platformefficiencies to ensure it is easier for customersto do business with ANZ.
> Build on specialised business success in SME and solutions-based proposition inCorporate Banking.
> Build staff and management capabilities.
Staff – Training was a key priority with significantinvestment made in skills training and leadership development.
Achievements
Positioned the business to capture growthopportunities – Achieved strong growth rates innew business writings: motor vehicle finance 18%;equipment finance 26%; fleet managementservices 26%; equipment operating leases 24%.
Continued to improve profitability – Profit after taxincreased by 23%.
Provided an operationally excellent platform –Launched a comprehensive end-to-end re-designproject; analysis and design phases completed.
Attracted and retained talented people – Focusedon improving leadership capabilities with 80staff in the “Inspiring Leaders” program. Pilotedleadership development program for femalemanagers. Introduced new Talent Program todevelop management skills of junior staff.
Goals
> Grow usage segment and lift returns ontraditional asset finance business.
> Redevelop and revitalise our brand.
> Improve sales capability through improvedtraining and new incentive scheme.
> Progress implementation of operationallyexcellent platform and expand to New Zealandand Esanda FleetPartners.
growth of 13%. This reduced cost has been drivenby the continued reduction in the risk profile ofthe Corporate and business lending portfolio.Economic loss provisions remain well in excessof net specific provisions.
Staff – Increased total staff reflecting investmentin frontline staffing in New Zealand Personaland Businessand Rural to improve service and salesincluding extending branch operating hoursto weekends.
Achievements
Increased the number of customer-facing staff –Increased staffing in branches by 5%; increasednumber of Mobile Mortgage Managers; increased
number of relationship management staffin Business and Rural.
Top ranking in Corporate Banking sector – Attainednumber 1 ranking for market share and customersatisfaction in Corporate Banking (page 23).
Improved retail customer satisfaction – Mostimproved of any bank in NZ according to Consumermagazine annual survey and AC Neilson ConsumerFinance Monitor (September quarter 2003).Ranked third for service, up from fifth last year.
Upgraded the branch network and increasedbranches in key geographical growth cities –Opened one new branch, several others in
advanced planning. Planning for full re-signageand upgrade completed.
Goals
> Launch campaign to re-invigorate the brand,supported by product-specific campaigns.
> Maintain Corporate Banking’s number oneranking for customer satisfaction.
> Continue growth in the business segmentand strengthen the rural business.
> Roll-out needs-based sales training programsto frontline staff in branch network.
> Complete re-vitalisation of the branch network.
Risk Management – Strengthened financial controland compliance framework through clearmanagement focus and building people capability.
Staff – Increased due to a new customer servicesteam of 124 established to handle calls associatedwith the Reserve Bank interchange reforms.Excluding this team, FTEs were down 7% as aresult of back office initiatives. During the year,significant investments were made in workplacequality, with the move to a new state-of-the-artfacility, and in ongoing learning as a keycapability.
Achievements
Product innovation – Reshaped product set acrossthe Australian Cards Issuing portfolio to addressthe impact of the Reserve Bank interchangereforms and ensure leading products for eachcustomer segment. Launched ANZ Low RateMasterCard and ANZ Frequent Flyer Diners Card.
Increased merchants with ANZ MultiPOS facilities –Delivered 20% growth in the number of merchantsin the small business segment.
Maximised technology investments – Deliveredefficiency and service quality gains with averageoperational cost per account down 16% and 90%of new applications processed within 24 hours.Developed in-house capability to administer our
loyalty program, producing 21% annualisedsavings in loyalty management.
Controlled geographic expansion – Purchased a 40% joint venture interest in the credit cardbusiness of Metrobank in the Philippines.
Goals
> Minimise the impact of the Reserve Bankreforms, while leveraging our strong creditcard product set and execution capabilitiesto grow share in attractive segments.
> Continue to build new revenue streams throughproduct innovation, cross-selling, and controlledgeographic expansion.
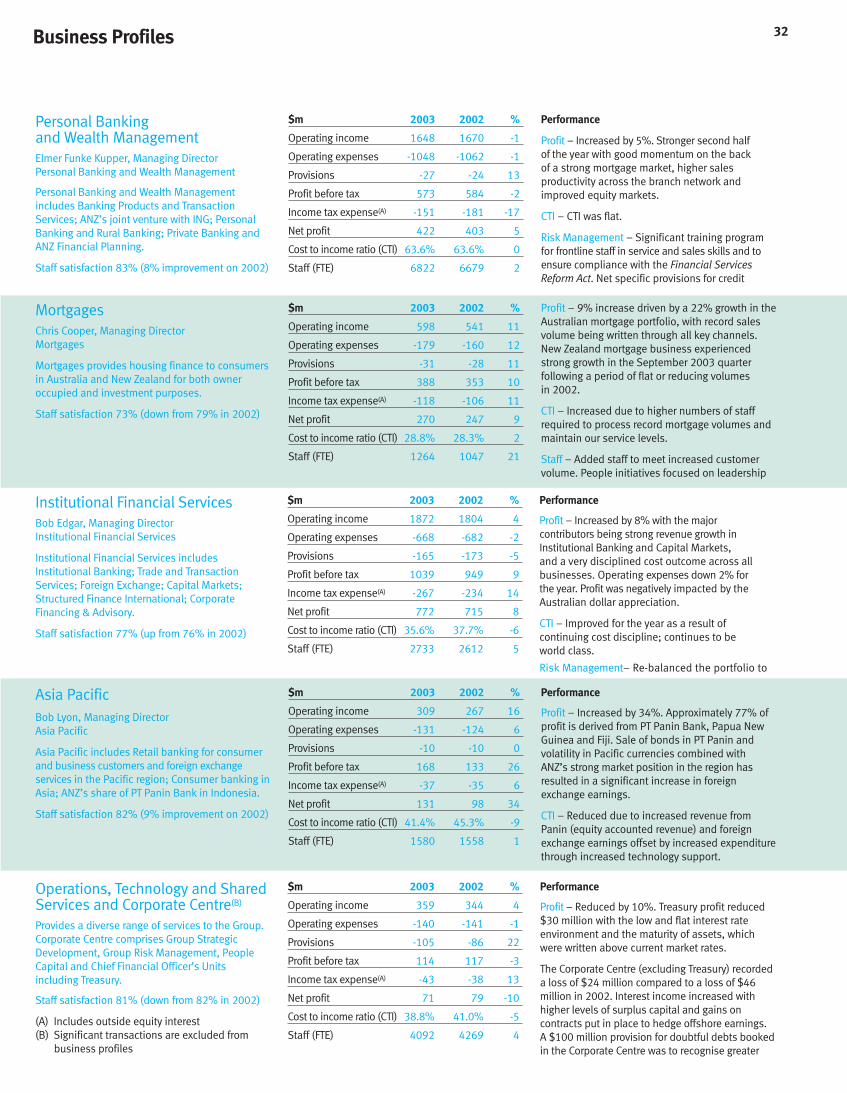
32
Institutional Financial ServicesBob Edgar, Managing DirectorInstitutional Financial Services
Institutional Financial Services includesInstitutional Banking; Trade and TransactionServices; Foreign Exchange; Capital Markets;Structured Finance International; CorporateFinancing & Advisory.
Staff satisfaction 77% (up from 76% in 2002)
$m 2003 2002 %
Operating income 1872 1804 4
Operating expenses -668 -682 -2
Provisions -165 -173 -5
Profit before tax 1039 949 9
Income tax expense(A) -267 -234 14
Net profit 772 715 8
Cost to income ratio (CTI) 35.6% 37.7% -6
Staff (FTE) 2733 2612 5
Performance
Profit – Increased by 8% with the majorcontributors being strong revenue growth inInstitutional Banking and Capital Markets,and a very disciplined cost outcome across allbusinesses. Operating expenses down 2% forthe year. Profit was negatively impacted by theAustralian dollar appreciation.
CTI – Improved for the year as a result ofcontinuing cost discipline; continues to be world class.
Risk Management– Re-balanced the portfolio to
Business Profiles
Personal Banking and Wealth ManagementElmer Funke Kupper, Managing DirectorPersonal Banking and Wealth Management
Personal Banking and Wealth Managementincludes Banking Products and TransactionServices; ANZ’s joint venture with ING; PersonalBanking and Rural Banking; Private Banking andANZ Financial Planning.
Staff satisfaction 83% (8% improvement on 2002)
$m 2003 2002 %
Operating income 1648 1670 -1
Operating expenses -1048 -1062 -1
Provisions -27 -24 13
Profit before tax 573 584 -2
Income tax expense(A) -151 -181 -17
Net profit 422 403 5
Cost to income ratio (CTI) 63.6% 63.6% 0
Staff (FTE) 6822 6679 2
Performance
Profit – Increased by 5%. Stronger second halfof the year with good momentum on the backof a strong mortgage market, higher salesproductivity across the branch network andimproved equity markets.
CTI – CTI was flat.
Risk Management – Significant training programfor frontline staff in service and sales skills and toensure compliance with the Financial ServicesReform Act. Net specific provisions for credit
MortgagesChris Cooper, Managing DirectorMortgages
Mortgages provides housing finance to consumersin Australia and New Zealand for both owneroccupied and investment purposes.
Staff satisfaction 73% (down from 79% in 2002)
$m 2003 2002 %
Operating income 598 541 11
Operating expenses -179 -160 12
Provisions -31 -28 11
Profit before tax 388 353 10
Income tax expense(A) -118 -106 11
Net profit 270 247 9
Cost to income ratio (CTI) 28.8% 28.3% 2
Staff (FTE) 1264 1047 21
Profit – 9% increase driven by a 22% growth in theAustralian mortgage portfolio, with record salesvolume being written through all key channels.New Zealand mortgage business experiencedstrong growth in the September 2003 quarterfollowing a period of flat or reducing volumesin 2002.
CTI – Increased due to higher numbers of staffrequired to process record mortgage volumes andmaintain our service levels.
Staff – Added staff to meet increased customervolume. People initiatives focused on leadership
Asia PacificBob Lyon, Managing DirectorAsia Pacific
Asia Pacific includes Retail banking for consumerand business customers and foreign exchangeservices in the Pacific region; Consumer banking inAsia; ANZ’s share of PT Panin Bank in Indonesia.
Staff satisfaction 82% (9% improvement on 2002)
$m 2003 2002 %
Operating income 309 267 16
Operating expenses -131 -124 6
Provisions -10 -10 0
Profit before tax 168 133 26
Income tax expense(A) -37 -35 6
Net profit 131 98 34
Cost to income ratio (CTI) 41.4% 45.3% -9
Staff (FTE) 1580 1558 1
Performance
Profit – Increased by 34%. Approximately 77% ofprofit is derived from PT Panin Bank, Papua NewGuinea and Fiji. Sale of bonds in PT Panin andvolatility in Pacific currencies combined with ANZ’s strong market position in the region hasresulted in a significant increase in foreignexchange earnings.
CTI – Reduced due to increased revenue fromPanin (equity accounted revenue) and foreignexchange earnings offset by increased expenditurethrough increased technology support.
Operations, Technology and SharedServices and Corporate Centre(B)
Provides a diverse range of services to the Group.Corporate Centre comprises Group StrategicDevelopment, Group Risk Management, PeopleCapital and Chief Financial Officer’s Unitsincluding Treasury.
Staff satisfaction 81% (down from 82% in 2002)
(A) Includes outside equity interest(B) Significant transactions are excluded from
business profiles
$m 2003 2002 %
Operating income 359 344 4
Operating expenses -140 -141 -1
Provisions -105 -86 22
Profit before tax 114 117 -3
Income tax expense(A) -43 -38 13
Net profit 71 79 -10
Cost to income ratio (CTI) 38.8% 41.0% -5
Staff (FTE) 4092 4269 4
Performance
Profit – Reduced by 10%. Treasury profit reduced$30 million with the low and flat interest rateenvironment and the maturity of assets, which were written above current market rates.
The Corporate Centre (excluding Treasury) recorded a loss of $24 million compared to a loss of $46million in 2002. Interest income increased withhigher levels of surplus capital and gains oncontracts put in place to hedge offshore earnings.A $100 million provision for doubtful debts bookedin the Corporate Centre was to recognise greater

33
lower risk sectors; good progress in reducinghigher risk offshore exposures, including the UKand US power sectors.
Staff – Increased largely due to ANZ acquiring theAustralian trade processing hub of the ProponixJoint Venture (TradeCentrix) in the first half of 2003.Continued developing programs that built thecapability of our people across all geographies. Keyappointments made in each business and regionreflecting the realignment of the structure and tomaximise the synergies between the relationshipand product businesses.
Achievements
Capitalised on core competencies in each of ourbusiness units – The strengths of our leadingdomestic market positions continued to beleveraged to build viable niche positions offshore.
Increased the range and complexity of our productsuite – Product offerings have been dynamicallymanaged, adding new products and segmentswhile discontinuing others.
Addressed credit issues and improved riskmitigation – Improved credit portfolio; reduced size
of domestic and offshore customer exposuresthrough lowering of single customer limits; non-core lending exited.
Goals
> Deepen our domestic leadership position.
> Develop new revenue streams for sustainable growth.
> Build a viable offshore franchise that adds valueto our global customers by leveraging thestrengths of our domestic business.
> Maintain excellence in risk management.
losses remained low at $19 million despite stronggrowth in rural lending.
Staff – Added staff to improve customer serviceand support higher sales. Staff absenteeismdecreased. Increased training investment.
Achievements
Invested in frontline training and technology –More than 4,200 staff trained on service and salesskills, with new merchandising to support the salesprocess. Piloted new telling platform for rolloutin 2004.
Improved share in core deposits – Receivedindustry award for Access transaction accounts.Added approximately 100,000 new customers toANZ since new products launched in 2002.
Launched full set of deposit products – Relaunchedsavings products and achieved deposit growthtargets. Our cash management trust, V2+,reached $6 billion for first time. Improved depositmarket share.
Improved cross-sell of wealth management andinsurance products – Despite a weak equitymarket, the ING Joint Venture improved its relativemarket position. Insurance cross-sell performanceimproved significantly from a low base.
Goals
> Maintain product leadership.
> Improve sales productivity and cross-sell.
> Continue to build our Human Face.
> Improve service delivery.
development, improved training/inductionprograms and enhanced work force capacity planning.
Risk Management – Overall delinquencies athistorically low levels. Changed approval policiesfor inner city lending has seen ANZ’s market sharedecrease in this segment. Delinquencies for innercity lending are not materially different from thetotal portfolio. Comprehensive portfolio modellingtechniques further refined, providing a strongfoundation for risk and portfolio management.
Achievements
Achieved above market growth across all channels –Loans outstanding up 22% in Australia and 6% inNew Zealand over the year.
Continued to lead the market with award winningproducts and strong customer service – LeadingCannex product ratings (5 star awards for ANZ MoneySaver Home and Residential Loans; 5 Year FixedRate Loans), high service rankings in independentcustomer and broker surveys.
Further built staff and customer advocacy –Improved processing efficiency and customerexperience through increased electronic deliveryof applications, “straight through” processing and roll-out of eMOS system for brokers andmortgage specialists.
Goals
> Deliver above market growth in retail andwholesale businesses.
> Significantly grow the volume of applicationsreceived electronically from third-party channels.
Risk Management – Quality of lending book hasprogressively increased over the 12 months.
Staff – Over 80% of our management positions areheld by national staff. Nationals working outsidetheir home country now account for 23% of ourexpatriate work force.
Achievements
Expanded our service – Launched Internetbusiness banking service, Ebiz, in Papua NewGuinea, Fiji, Tonga and Cook Islands.
Centralised support functions – Successful in-sourcing of call centre, help desk and financefunctions primarily for Pacific operations throughQuest, a 100% owned subsidiary, resulting inefficiency gains.
Re-engineered sales and service functions –Following Samoa pilot, commenced installation ofqueue management systems in major branches inPacific countries resulting in positive customerfeedback.
Strengthened staff skills – 80% of managementpositions in Pacific now held by nationals.
Goals
> Standardise our Business Operating Model to bePacific best practice.
> Improve decision making around our asset andliability management and pricing practices.
> Continue centralisation into Quest, our Fiji sharedservices centre.
> Further expansion of our sales model focusing on our customer relationships.
than expected default rates in the offshoreStructured Finance and Institutional Bankingportfolios.
Achievements
Replaced Group payroll systems – Implemented newpayroll and HR information systems in Australia.
Completed upgrade of corporate banking andcustomer transaction processing capabilities –Completed Corporate Banking initiatives;implemented improvements leading to bettercustomer response and processing efficiencyfor Consumer Finance and Mortgages.
Commenced customer access via web for “selfservice” enquiries on payments, statements andtransactions – Installed advanced web-basedsystems across all Australian and New Zealandoperations.
Implemented on-line procurement – Goods& services purchasing increasingly on-lineincluding information technology servicesand office hardware, stationery and travel.The vast majority of vendors now paid viaelectronic funds transfer.
Goals
> Extend customer access via web for “selfservice” enquiries.
> Replace New Zealand payroll system.
> Roll-out new telling platform in branch network.
> Implement managed vendor project for learning delivery.
> Expand wholesale funding base.

34Board of Directors
Dr B W Scott AOIndependent Non-Executive DirectorCompany Director
Ms M A Jackson ACIndependent Non-Executive DirectorCompany Director
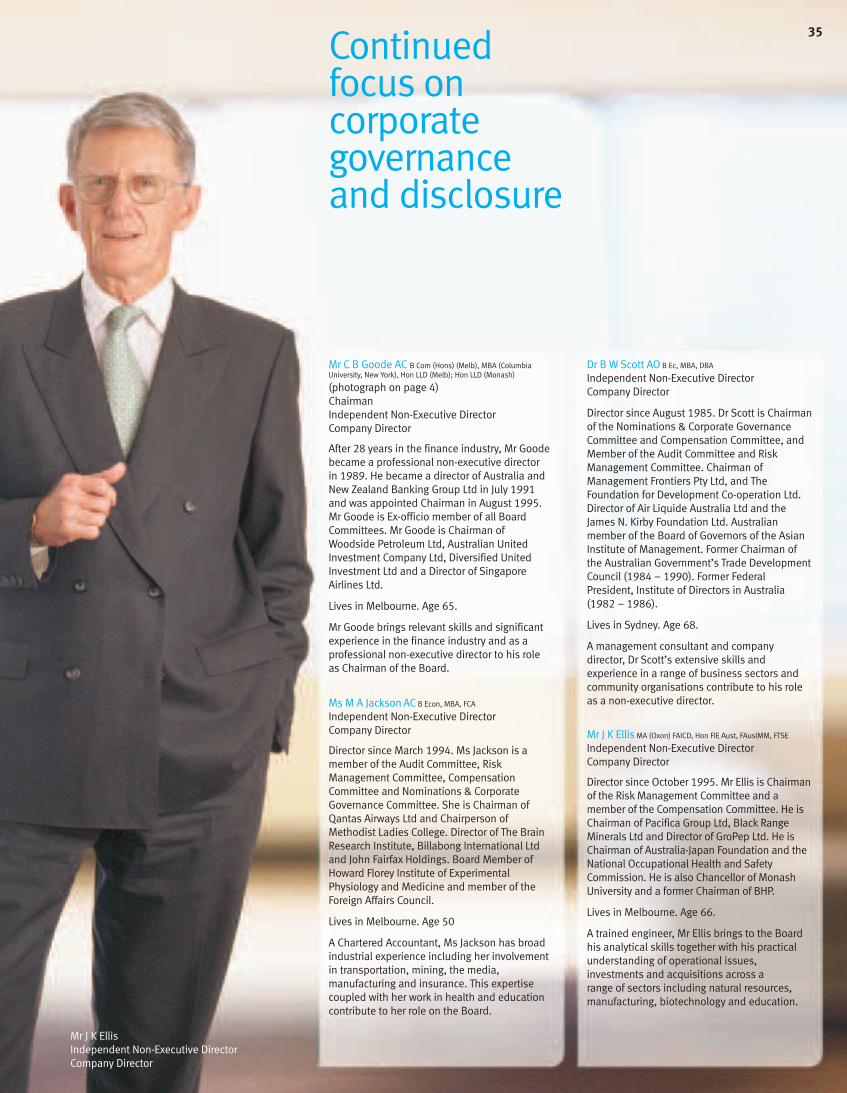
35
Dr B W Scott AO B Ec, MBA, DBA
Independent Non-Executive Director Company Director
Director since August 1985. Dr Scott is Chairmanof the Nominations & Corporate GovernanceCommittee and Compensation Committee, andMember of the Audit Committee and RiskManagement Committee. Chairman ofManagement Frontiers Pty Ltd, and TheFoundation for Development Co-operation Ltd.Director of Air Liquide Australia Ltd and theJames N. Kirby Foundation Ltd. Australianmember of the Board of Governors of the AsianInstitute of Management. Former Chairman ofthe Australian Government’s Trade DevelopmentCouncil (1984 – 1990). Former FederalPresident, Institute of Directors in Australia(1982 – 1986).
Lives in Sydney. Age 68.
A management consultant and companydirector, Dr Scott’s extensive skills andexperience in a range of business sectors andcommunity organisations contribute to his roleas a non-executive director.
Mr J K Ellis MA (Oxon) FAICD, Hon FIE Aust, FAusIMM, FTSE
Independent Non-Executive DirectorCompany Director
Director since October 1995. Mr Ellis is Chairmanof the Risk Management Committee and amember of the Compensation Committee. He isChairman of Pacifica Group Ltd, Black RangeMinerals Ltd and Director of GroPep Ltd. He isChairman of Australia-Japan Foundation and theNational Occupational Health and SafetyCommission. He is also Chancellor of MonashUniversity and a former Chairman of BHP.
Lives in Melbourne. Age 66.
A trained engineer, Mr Ellis brings to the Boardhis analytical skills together with his practicalunderstanding of operational issues,investments and acquisitions across a range of sectors including natural resources,manufacturing, biotechnology and education.
Mr C B Goode AC B Com (Hons) (Melb), MBA (ColumbiaUniversity, New York), Hon LLD (Melb); Hon LLD (Monash)
(photograph on page 4)ChairmanIndependent Non-Executive Director Company Director
After 28 years in the finance industry, Mr Goodebecame a professional non-executive directorin 1989. He became a director of Australia andNew Zealand Banking Group Ltd in July 1991and was appointed Chairman in August 1995. Mr Goode is Ex-officio member of all BoardCommittees. Mr Goode is Chairman ofWoodside Petroleum Ltd, Australian UnitedInvestment Company Ltd, Diversified UnitedInvestment Ltd and a Director of SingaporeAirlines Ltd.
Lives in Melbourne. Age 65.
Mr Goode brings relevant skills and significantexperience in the finance industry and as aprofessional non-executive director to his roleas Chairman of the Board.
Ms M A Jackson AC B Econ, MBA, FCA
Independent Non-Executive DirectorCompany Director
Director since March 1994. Ms Jackson is amember of the Audit Committee, RiskManagement Committee, CompensationCommittee and Nominations & CorporateGovernance Committee. She is Chairman ofQantas Airways Ltd and Chairperson ofMethodist Ladies College. Director of The BrainResearch Institute, Billabong International Ltdand John Fairfax Holdings. Board Member ofHoward Florey Institute of ExperimentalPhysiology and Medicine and member of theForeign Affairs Council.
Lives in Melbourne. Age 50
A Chartered Accountant, Ms Jackson has broadindustrial experience including her involvementin transportation, mining, the media,manufacturing and insurance. This expertisecoupled with her work in health and educationcontribute to her role on the Board.
Continuedfocus oncorporategovernanceand disclosure
Mr J K EllisIndependent Non-Executive DirectorCompany Director

Board of Directors Commitmenttoshareholdercontact
36
Mr J C DahlsenIndependent Non-Executive Director Company Director
Dr R S DeaneIndependent Non-Executive DirectorCompany Director

37
Mr J McFarlane OBE MA, MBA
(photograph on page 7)Chief Executive Officer
Appointed October 1997. Directorships includeThe Business Council of Australia and theAustralian Graduate School of Management.Mr McFarlane is a former Group ExecutiveDirector, Standard Chartered Plc (1993 – 1997),Head of Citibank, United Kingdom (1990 –1993), Managing Director, Citicorp InvestmentBank Ltd (1987 – 1990), Director of the LondonStock Exchange (1989 – 1991).
Lives in Melbourne. Age 56.
Mr McFarlane brings skills and experiences inbanking and finance which are relevant for hisrole as Chief Executive Officer.
Mr J C Dahlsen LLB, MBA (Melb)
Independent Non-Executive Director Company Director
Director since May 1985. Mr Dahlsen isChairman of the Audit Committee and a member of the Risk Management Committeeand Compensation Committee. Mr Dahlsen is a former Consultant to and Partner of the legal firm Corrs Chambers Westgarth. He isChairman of Southern Cross Broadcasting(Australia) Ltd, Director of The Smith Family, J C Dahlsen Pty Ltd Group and the WarehouseGroup Ltd of New Zealand. He is a formerChairman of Woolworths Ltd, MelbourneBusiness School Ltd, The Herald and WeeklyTimes Ltd and a former Deputy Chairman ofMyer Emporium Ltd.
Lives in Melbourne. Age 68.
The skills and expertise that Mr Dahlsen hasdeveloped in his legal career together with hisexperience in the media, not-for-profit, banking,retail and small business sectors ensure thathe brings an understanding of the law andbusiness to his role as a non-executive director.
Dr R S Deane PhD, B Com (Hons), FCA, FCIS, FNZIM
Independent Non-Executive DirectorCompany Director
Director since September 1994. Dr Deane is a member of the Risk Management andCompensation Committees, and Chairman of ANZ Banking Group (New Zealand) Ltd. He is Chairman of Telecom New Zealand Ltd,Fletcher Building Ltd and Te Papa Tongarewa(Museum of New Zealand). He is a Directorof Woolworths Ltd.
Lives in Wellington, New Zealand. Age 62.
Dr Deane has skills and experience in avariety of activities including the governmentsector, banking and finance, economics,telecommunications, and with charitable andcultural organisations.
Mr D M Gonski AO B.Com, LL.B (University of NSW)
Independent Non-Executive Director Company Director
Director since February 2002. Mr Gonski is amember of the Risk Management Committee,Compensation Committee and Nominations& Corporate Governance Committee, andrepresents the Group as Director of INGAustralia Ltd. He is Chairman of Coca ColaAmatil Ltd and Investec Wentworth Pty Ltd, andDirector of Westfield Holdings Ltd and JohnFairfax Holdings Ltd. Mr Gonski is Chairman of the National Institute of Dramatic Art (NIDA),the Art Gallery of NSW, the Australia Counciland the Sydney Grammar School Trust.
Lives in Sydney. Age 50.
Mr Gonski, a lawyer, has a wide experience in business, the law and investment banking. He also brings to his role on the Board anappreciation for the community through hiswork in the arts and the not-for-profit sector.
Mr D M Gonski Independent Non-Executive Director Company Director

the continuous disclosure obligations under theListing Rules of the ASX which are supplementedby Australian Corporations Legislation.Information provided to the ASX is posted on theASX website.
This year several shareholder meetings wereheld including:
> Annual General Meeting – 13 December 2002 –Perth, Western Australia
> Shareholder Meeting – 21 February 2003 –Auckland, New Zealand
> Shareholder Meeting – 24 February 2003 –Wellington, New Zealand
> Shareholder Meeting – 14 August 2003 –Adelaide, South Australia
In addition, a General Meeting was held on 13August 2003 in Melbourne to consider mattersassociated with ANZ’s ongoing capitalmanagement strategy. The specific resolutionsconfirmed approval of a buy-back agreementrelating to redeemable preference shares, issuedby ANZ in 1998, amended ANZ’s constitution tofacilitate the issue of preference shares, andapproved the issue of ANZ Stapled ExchangeablePreferred Securities (ANZ StEPS). Theseresolutions represented a “self-contained”package designed to enhance ANZ’s capitalmanagement flexibility.
Continued recognition forour quality disclosureANZ’s commitment to quality financial disclosureand transparent reporting continues to berecognised. During the financial year, ANZreceived a number of awards specifically for the2002 Annual Report including:
> International – ARC International Awards – GoldAward in the Banking and Finance category
> Australasia – Australasian Reporting Awards –Silver Award
> New Zealand – Instituted of CharteredAccountants of New Zealand – Commended forcorporate governance reporting in the 2002Annual Report.
ANZ has again been recognised for the quality ofits dealings with the investment community, withthe release of the Reuters/Institutional InvestorAsia Equities Report in July, specifically for:
> Best CEO in Australia
> Best CFO in Australia
> Best Investor Relations in Australia
> Best Corporate Governance.
The Board works in a culture ofdiligence and commitment
Board responsibility
The Board is responsible to shareholders for thegovernance of the Group, its operations andfinancial performance. To this end, it sets thestrategic direction and financial objectives forthe Group. It delegates responsibility for themanagement of ANZ to the Chief ExecutiveOfficer and senior management. The Board isalso responsible for ensuring that ANZ hasappropriate governance arrangements in placefor the benefit of all stakeholders.
The Board aims to carry out its responsibilitiesso as to create and to build sustainable value forthe benefit of shareholders, employees,customers, and the community. The Board hasadopted a Charter (available on www.anz.com)which sets out, among other things, the rolesand responsibilities of the Board. The Board’sresponsibilities include:
> Appointing the Chief Executive Officer, andreviewing his/her performance and remuneration
> Approving objectives, strategies and budgets,and monitoring and assessing management’sperformance in achieving these
> Monitoring compliance with regulatoryrequirements, and ensuring that the Group andits employees are meeting the highest standardsof ethics and integrity
> Approving policies and overseeing governanceand compliance practices relating tomanagement of risk, conduct of audit, healthand safety, people management, corporatesustainability, and customer service.
Corporate Governance and the Board
38
Continued focus on corporategovernance and disclosure Good governance and quality disclosure areimportant to ANZ. ANZ’s Board is acutely aware ofthe responsibilities it has for stewardship andaccountability to shareholders. The Board worksclosely with management to ensure that issues ofdisclosure, transparency, due process andpropriety are continually under review andmaintained at consistently high levels.
While corporate governance has long been anactive consideration for the ANZ Board, it decidedto establish a new committee, the Nominations& Corporate Governance Committee, at the startof the 2002/2003 financial year. The Committeeundertakes in-depth analysis and review ofmajor corporate governance issues and bringsrecommendations and advice to the full board.
In June 2003, ANZ was included in a reviewby Governance Metrics International (GMI) ofcorporate governance and disclosure practicesof the top 50 ASX companies. GMI rankedANZ above average for Board accountability,shareholders’ rights and corporate behaviour,remuneration and financial disclosure.
During the year, there has been considerablefocus on many aspects of corporate governance.These have included a review of Boardperformance, fine-tuning policy, and proceduraland governance requirements. In addition,attention has been directed to the externalenvironment and to various reports andstandards being set in a much more activeregulatory regime. Please refer to the box belowfor further detail on some areas of focus.
Commitment to qualityshareholder communication ANZ is committed to providing shareholders withquality information in a timely manner. Thiscontinuous disclosure is underpinned by ANZ’sMarket Disclosure Policy (see page 42).Communication with shareholders acrossAustralia and overseas is generally throughresults announcements, the Annual Report,briefings, newsletters and the shareholder site on www.anz.com. In addition, ANZ complies with
Major corporate governance issuesaddressed by the Board include:
International
> International Financial Reporting Standards (IFRS)– From 1 January 2005, all Australian entities willbe required to prepare their financial statementsunder the IFRS as adopted by the AustralianAccounting Standards Board (AASB). ANZ hasestablished a formal project, monitored by asteering committee, to ensure that ANZ isprepared to report for the first time under IFRSwhen the results for the half-year ended 31 March 2006 are announced.
> New Basel Capital Accord – A new frameworkknown as “Basel II” has been designed to
2001 that were introduced by the FinancialServices Reform Act 2001 . These provisions aimto provide a uniform and transparent system oflicensing, product information disclosure andrequisite levels of training for the financialservices industry. The Group will remain focusedon related staff training.
> Code of Banking Practice – Released by theAustralian Bankers Association (ABA) in August2003 and adopted by ANZ in the same month,this voluntary code of conduct sets standards ofgood banking practice covering personal andsmall business customers. ANZ sees this codeas an opportunity to further improve the servicesprovided to our customers.
improve the stability of the global financialsystem through encouraging improved riskmanagement practices and requiring banks tohold capital commensurate with their risk profile.The new Accord is scheduled to commence inANZ in 2006 for a year of parallel running withthe current Accord with full implementation from2007. A central project team, reporting to asteering committee, is working with all areas ofANZ to ensure that systems and processes areready for the change.
Australia
> Financial Services Reform Act – ANZ was grantedits new Australian Financial Services Licenceeffective from 1 October 2003. The licence isgranted under provisions of the Corporations Act
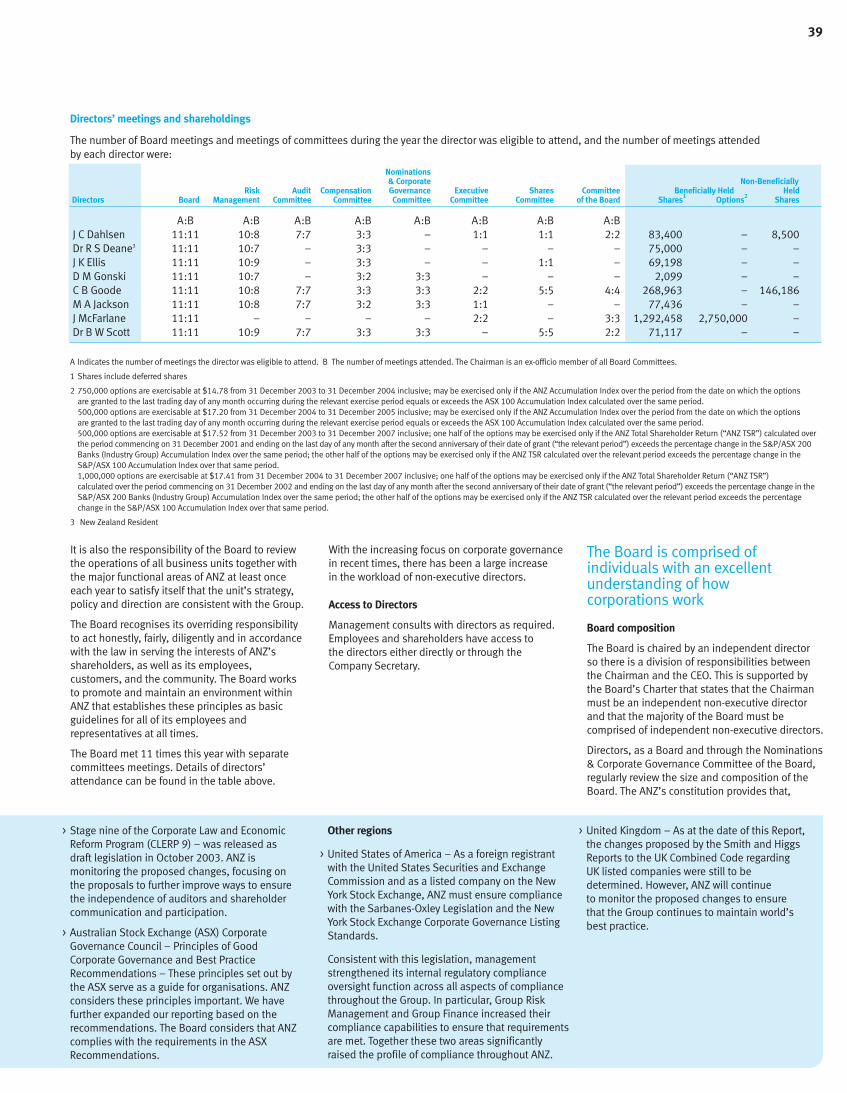
39
It is also the responsibility of the Board to reviewthe operations of all business units together withthe major functional areas of ANZ at least onceeach year to satisfy itself that the unit’s strategy,policy and direction are consistent with the Group.
The Board recognises its overriding responsibilityto act honestly, fairly, diligently and in accordancewith the law in serving the interests of ANZ’sshareholders, as well as its employees,customers, and the community. The Board worksto promote and maintain an environment withinANZ that establishes these principles as basicguidelines for all of its employees andrepresentatives at all times.
The Board met 11 times this year with separatecommittees meetings. Details of directors’attendance can be found in the table above.
With the increasing focus on corporate governancein recent times, there has been a large increasein the workload of non-executive directors.
Access to Directors
Management consults with directors as required.Employees and shareholders have access tothe directors either directly or through theCompany Secretary.
The Board is comprised ofindividuals with an excellentunderstanding of how corporations work
Board composition
The Board is chaired by an independent director so there is a division of responsibilities betweenthe Chairman and the CEO. This is supported bythe Board’s Charter that states that the Chairmanmust be an independent non-executive directorand that the majority of the Board must becomprised of independent non-executive directors.
Directors, as a Board and through the Nominations& Corporate Governance Committee of the Board,regularly review the size and composition of theBoard. The ANZ’s constitution provides that,
Directors’ meetings and shareholdings
The number of Board meetings and meetings of committees during the year the director was eligible to attend, and the number of meetings attendedby each director were:
Nominations& Corporate Non-Beneficially
Risk Audit Compensation Governance Executive Shares Committee Beneficially Held HeldDirectors Board Management Committee Committee Committee Committee Committee of the Board Shares1 Options2 Shares
A:B A:B A:B A:B A:B A:B A:B A:BJ C Dahlsen 11:11 10:8 7:7 3:3 – 1:1 1:1 2:2 83,400 – 8,500Dr R S Deane3 11:11 10:7 – 3:3 – – – – 75,000 – –J K Ellis 11:11 10:9 – 3:3 – – 1:1 – 69,198 – –D M Gonski 11:11 10:7 – 3:2 3:3 – – – 2,099 – –C B Goode 11:11 10:8 7:7 3:3 3:3 2:2 5:5 4:4 268,963 – 146,186M A Jackson 11:11 10:8 7:7 3:2 3:3 1:1 – – 77,436 – –J McFarlane 11:11 – – – – 2:2 – 3:3 1,292,458 2,750,000 –Dr B W Scott 11:11 10:9 7:7 3:3 3:3 – 5:5 2:2 71,117 – –
A Indicates the number of meetings the director was eligible to attend. B The number of meetings attended. The Chairman is an ex-officio member of all Board Committees.
1 Shares include deferred shares
2 750,000 options are exercisable at $14.78 from 31 December 2003 to 31 December 2004 inclusive; may be exercised only if the ANZ Accumulation Index over the period from the date on which the optionsare granted to the last trading day of any month occurring during the relevant exercise period equals or exceeds the ASX 100 Accumulation Index calculated over the same period.500,000 options are exercisable at $17.20 from 31 December 2004 to 31 December 2005 inclusive; may be exercised only if the ANZ Accumulation Index over the period from the date on which the optionsare granted to the last trading day of any month occurring during the relevant exercise period equals or exceeds the ASX 100 Accumulation Index calculated over the same period.500,000 options are exercisable at $17.52 from 31 December 2003 to 31 December 2007 inclusive; one half of the options may be exercised only if the ANZ Total Shareholder Return (“ANZ TSR”) calculated overthe period commencing on 31 December 2001 and ending on the last day of any month after the second anniversary of their date of grant (“the relevant period”) exceeds the percentage change in the S&P/ASX 200Banks (Industry Group) Accumulation Index over the same period; the other half of the options may be exercised only if the ANZ TSR calculated over the relevant period exceeds the percentage change in theS&P/ASX 100 Accumulation Index over that same period.1,000,000 options are exercisable at $17.41 from 31 December 2004 to 31 December 2007 inclusive; one half of the options may be exercised only if the ANZ Total Shareholder Return (“ANZ TSR”) calculated over the period commencing on 31 December 2002 and ending on the last day of any month after the second anniversary of their date of grant (“the relevant period”) exceeds the percentage change in theS&P/ASX 200 Banks (Industry Group) Accumulation Index over the same period; the other half of the options may be exercised only if the ANZ TSR calculated over the relevant period exceeds the percentagechange in the S&P/ASX 100 Accumulation Index over that same period.
3 New Zealand Resident
> Stage nine of the Corporate Law and EconomicReform Program (CLERP 9) – was released asdraft legislation in October 2003. ANZ ismonitoring the proposed changes, focusing onthe proposals to further improve ways to ensurethe independence of auditors and shareholdercommunication and participation.
> Australian Stock Exchange (ASX) CorporateGovernance Council – Principles of GoodCorporate Governance and Best PracticeRecommendations – These principles set out bythe ASX serve as a guide for organisations. ANZconsiders these principles important. We havefurther expanded our reporting based on therecommendations. The Board considers that ANZcomplies with the requirements in the ASXRecommendations.
Other regions
> United States of America – As a foreign registrantwith the United States Securities and ExchangeCommission and as a listed company on the NewYork Stock Exchange, ANZ must ensure compliancewith the Sarbanes-Oxley Legislation and the NewYork Stock Exchange Corporate Governance ListingStandards.
Consistent with this legislation, managementstrengthened its internal regulatory complianceoversight function across all aspects of compliancethroughout the Group. In particular, Group RiskManagement and Group Finance increased theircompliance capabilities to ensure that requirementsare met. Together these two areas significantlyraised the profile of compliance throughout ANZ.
> United Kingdom – As at the date of this Report,the changes proposed by the Smith and HiggsReports to the UK Combined Code regarding UK listed companies were still to bedetermined. However, ANZ will continue to monitor the proposed changes to ensurethat the Group continues to maintain world’sbest practice.

Board composition cont.
at a minimum, the Board must be comprised offive directors. Throughout this year, the Board has comprised eight directors – a non-executiveChairman, six other non-executive directors andthe Chief Executive Officer.
Director qualifications and appointments
The Board aims to bring a balance of skills,experience and views to its deliberations.
Directors, as a Board and through theNominations & Corporate Governance Committee,engage external consultants to assist them inidentifying appropriate candidates for considerationas Board members. Candidates are assessed interms of the depth and breadth of experience andskills considered relevant for ANZ, as well as theirpersonal qualities and communicationcapabilities. The complementary nature of theirdistinctive contributions with the other directorsis also assessed. Assurances are sought to ensurethat a candidate has the capacity to devoteappropriate time to this important role.
ANZ’s constitution provides that each director isrequired to hold, within 3 months of appointment,at least 2,000 fully paid shares in the director’sown right and must continue to hold at least2,000 shares until the director ceases to holdoffice. Details of directors’ shareholdings with ANZcan be found on page 39 and are set out in Note51 of the Financial Statements.
On appointment, directors are provided withinformation setting out their duties andresponsibilities including various Board policiesand their entitlements. During 2002–2003, theDirectors’ Handbook has been reviewed andupdated to meet directors’ requirements in acomprehensive manner.
Performance of Chairman and directors
The full Board is responsible for reviewing theperformance of the Chairman.
It is the responsibility of the Chairman, with input from the Nominations & CorporateGovernance Committee, to assess theperformance of each director.
Retirement
ANZ’s constitution provides that at least one third(or the nearest whole number) of directors mustretire at each Annual General Meeting, but areeligible for re-election at that meeting.
An appointee who is filling a casual vacancy hasto stand for election at the first Annual GeneralMeeting thereafter. This requirement does notapply to the Chief Executive Officer, or any directorretiring at that meeting in any event.
In addition, ANZ’s Constitution and the ASXListing Rules require that directors must putthemselves up for election every three years.Directors are required to retire at the age of 70years. Directors appointed since 1993 haveagreed to retire after 15 years service. Directors’independence is reviewed at least annually.
Independence and directors’ dealings
In 2002–2003, the Board instituted a process bywhich the independence of each non-executivedirector is reviewed in detail at least annually,and more frequently where a change in positionor relationship warrants it.
Following the most recent review, the Boardconcluded that each of its non-executivedirectors should be considered independent atthis time.
The Board applies the definition of“independence” which is in the Board Charteron www.anz.com >about anz >corporateinformation >anz policies.
Conflicts of interest and materiality
Over and above the issue of independence,each Director has a continuing responsibilityto determine whether he or she has a potentialor actual conflict of interest in relation to anymaterial matter, which comes before theBoard. Such a situation may arise from outsidefinancial, organisational, representational,professional, or other interest or relationshipwhich might affect, or be seen potentially toaffect, the Director’s position to act in the bestinterests of the Company.
It is also expected that other Board Directors willraise any concerns about possible conflicts ofinterest on the part of any Director in a materialmatter at any time.
Materiality may relate to financial significance,strategic significance, competitive significance,or any other matters of commercial or timingsignificance.
If a conflict or potential conflict arises, the Directormay not receive relevant Board papers, mayabsent himself /herself from Board deliberationson the subject, and may not vote on any relatedBoard resolutions. These matters are dulyrecorded in Board minutes when they occur.
Other than in their capacity as directors of ANZ,all non-executive directors are deemed not tohave a material relationship with ANZ or itsassociated companies.
Independent advice
In order to assist directors to fulfill theirresponsibilities, each director has the right, with the prior approval of the Chairman, to seekindependent professional advice regarding theirresponsibilities at the expense of the Group.In addition, the Board and each Committee mayobtain whatever professional advice it requires toassist it in its work at the expense of the Group.
Board Committees provideoversight and makerecommendations to the Board
Main committees
There are four main Board Committees:
> Audit Committee
> Risk Management Committee
> Nominations & Corporate Governance Committee
> Compensation Committee
Each of the four main Committees is comprisedsolely of independent directors, has its ownCharter and has the power to direct any specialinvestigations it deems necessary.
Committee membership is reviewed annually.Membership criteria are based on the relevanceof a director’s skills and experience, and theirability to add value to the Committee andcomplement the membership.
Committee performance evaluations areconducted annually to review each Committee’sperformance against its Charter, gathercomments on the suitability of its Charter andany areas for improvement, and to set goalsand objectives for the upcoming year. A copyof each Committee Charter can be found onwww.anz.com >about anz >corporate information>anz policies.
The Chairman is an ex-officio member of allCommittees. The Chief Executive Officer, JohnMcFarlane, is invited to attend all Committeemeetings. He is not present, however, if thiscould compromise proceedings. He also doesnot attend any meeting where his remunerationis considered or discussed. Directors may attendany meeting of a Committee on a subject wherethey have a special interest.
Corporate Governance and the Board
40
Board Committee Membership (as at 30 September 2003)
Nominations & Audit Risk Management Corporate Governance CompensationCommittee Committee Committee Committee
Mr John Dahlsen (C) –
Dr Roderick Deane – –
Mr Jerry Ellis – (C) –
Mr David Gonski –
Mr Charles Goode
Ms Margaret Jackson (FE)
Dr Brian Scott (C) (C)
(C)= Chairman (FE)= Financial Expert as defined in Sarbanes-Oxley US legislation
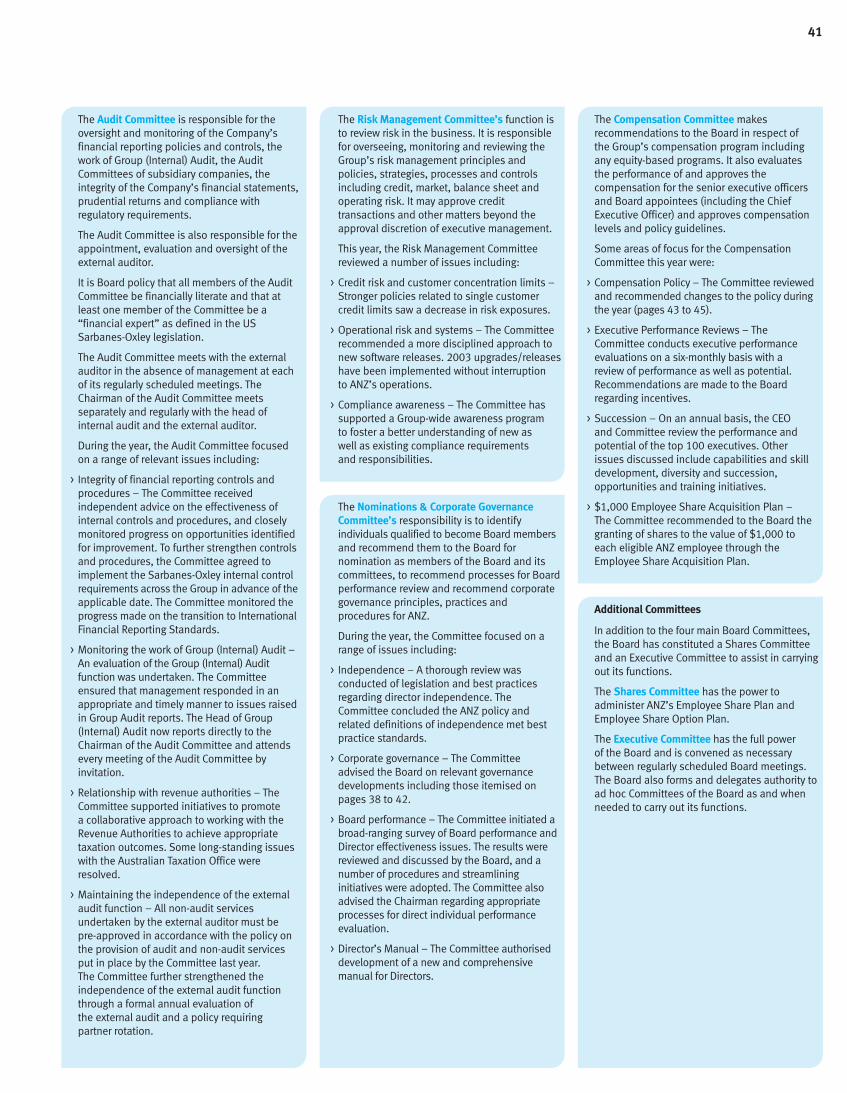
The Audit Committee is responsible for theoversight and monitoring of the Company’sfinancial reporting policies and controls, thework of Group (Internal) Audit, the AuditCommittees of subsidiary companies, theintegrity of the Company’s financial statements,prudential returns and compliance withregulatory requirements.
The Audit Committee is also responsible for theappointment, evaluation and oversight of theexternal auditor.
It is Board policy that all members of the AuditCommittee be financially literate and that atleast one member of the Committee be a“financial expert” as defined in the USSarbanes-Oxley legislation.
The Audit Committee meets with the externalauditor in the absence of management at each of its regularly scheduled meetings. TheChairman of the Audit Committee meetsseparately and regularly with the head ofinternal audit and the external auditor.
During the year, the Audit Committee focused on a range of relevant issues including:
> Integrity of financial reporting controls andprocedures – The Committee receivedindependent advice on the effectiveness ofinternal controls and procedures, and closelymonitored progress on opportunities identifiedfor improvement. To further strengthen controlsand procedures, the Committee agreed toimplement the Sarbanes-Oxley internal controlrequirements across the Group in advance of theapplicable date. The Committee monitored theprogress made on the transition to InternationalFinancial Reporting Standards.
> Monitoring the work of Group (Internal) Audit –An evaluation of the Group (Internal) Auditfunction was undertaken. The Committeeensured that management responded in anappropriate and timely manner to issues raisedin Group Audit reports. The Head of Group(Internal) Audit now reports directly to theChairman of the Audit Committee and attendsevery meeting of the Audit Committee byinvitation.
> Relationship with revenue authorities – TheCommittee supported initiatives to promotea collaborative approach to working with theRevenue Authorities to achieve appropriatetaxation outcomes. Some long-standing issueswith the Australian Taxation Office wereresolved.
> Maintaining the independence of the externalaudit function – All non-audit servicesundertaken by the external auditor must be pre-approved in accordance with the policy onthe provision of audit and non-audit servicesput in place by the Committee last year. The Committee further strengthened theindependence of the external audit functionthrough a formal annual evaluation ofthe external audit and a policy requiring partner rotation.
The Risk Management Committee’s function isto review risk in the business. It is responsiblefor overseeing, monitoring and reviewing theGroup’s risk management principles andpolicies, strategies, processes and controlsincluding credit, market, balance sheet andoperating risk. It may approve credittransactions and other matters beyond theapproval discretion of executive management.
This year, the Risk Management Committeereviewed a number of issues including:
> Credit risk and customer concentration limits –Stronger policies related to single customercredit limits saw a decrease in risk exposures.
> Operational risk and systems – The Committeerecommended a more disciplined approach tonew software releases. 2003 upgrades/releaseshave been implemented without interruption to ANZ’s operations.
> Compliance awareness – The Committee hassupported a Group-wide awareness program to foster a better understanding of new aswell as existing compliance requirementsand responsibilities.
The Nominations & Corporate GovernanceCommittee’s responsibility is to identifyindividuals qualified to become Board membersand recommend them to the Board fornomination as members of the Board and itscommittees, to recommend processes for Boardperformance review and recommend corporategovernance principles, practices andprocedures for ANZ.
During the year, the Committee focused on arange of issues including:
> Independence – A thorough review wasconducted of legislation and best practicesregarding director independence. TheCommittee concluded the ANZ policy andrelated definitions of independence met bestpractice standards.
> Corporate governance – The Committee advised the Board on relevant governancedevelopments including those itemised on pages 38 to 42.
> Board performance – The Committee initiated abroad-ranging survey of Board performance andDirector effectiveness issues. The results werereviewed and discussed by the Board, and anumber of procedures and streamlininginitiatives were adopted. The Committee alsoadvised the Chairman regarding appropriateprocesses for direct individual performanceevaluation.
> Director’s Manual – The Committee authoriseddevelopment of a new and comprehensivemanual for Directors.
The Compensation Committee makesrecommendations to the Board in respect ofthe Group’s compensation program includingany equity-based programs. It also evaluatesthe performance of and approves thecompensation for the senior executive officersand Board appointees (including the ChiefExecutive Officer) and approves compensationlevels and policy guidelines.
Some areas of focus for the CompensationCommittee this year were:
> Compensation Policy – The Committee reviewedand recommended changes to the policy duringthe year (pages 43 to 45).
> Executive Performance Reviews – TheCommittee conducts executive performanceevaluations on a six-monthly basis with a review of performance as well as potential.Recommendations are made to the Boardregarding incentives.
> Succession – On an annual basis, the CEO and Committee review the performance andpotential of the top 100 executives. Otherissues discussed include capabilities and skilldevelopment, diversity and succession,opportunities and training initiatives.
> $1,000 Employee Share Acquisition Plan – The Committee recommended to the Board thegranting of shares to the value of $1,000 toeach eligible ANZ employee through theEmployee Share Acquisition Plan.
Additional Committees
In addition to the four main Board Committees,the Board has constituted a Shares Committeeand an Executive Committee to assist in carryingout its functions.
The Shares Committee has the power toadminister ANZ’s Employee Share Plan andEmployee Share Option Plan.
The Executive Committee has the full powerof the Board and is convened as necessarybetween regularly scheduled Board meetings.The Board also forms and delegates authority toad hoc Committees of the Board as and whenneeded to carry out its functions.
41

Corporate Governance and the Board
42
Group (Internal) AuditGroup Audit provides independent assurance thatthe design and operation of the risk and controlframework across the Group is effective. Theinternal audit function operates under a Charterfrom the Audit Committee that gives it unrestrictedaccess to review all activities of the Group. TheGroup General Manager of Group Audit reports tothe Chairman of the Audit Committee.
A risk-based audit approach is used to ensure thatthe higher risk activities in each business areaudited each year. All audits are conducted in amanner that conforms to international auditingstandards. Audit results also influence incentivecompensation of business heads.
Group Audit plays an active role in ensuringcompliance with the requirements of supervisoryregulatory authorities, including APRA. GroupAudit also works collaboratively with the externalauditor to ensure a comprehensive audit scope.
The Audit Committee plays an active role inreviewing significant issues arising from internalaudits conducted by Group Audit. There is arobust process for ensuring prompt resolution ofaudit issues, which includes monthly reviews ofprogress by the CEO and the Chairman of theAudit Committee. The Audit Committee receivesformal reports on significant issues untilsatisfactory action has been taken.
ANZ’s PoliciesDuring the year, the Board reviewed key policeswhich apply to employees within the Group.Summaries of these policies can be viewed onwww.anz.com >about anz >corporate information>anz policies.
Code of Conduct for Directors and Code ofConduct for Employees – These policies set outthe ethical standards to which directors andemployees are expected to adhere. The Codesrequire that directors and employees adhere tothe law, that they disclose relevant interests thatthey have, that they act in the best interests of theGroup and that they act honestly and ethically inall their dealings.
The policies also cover the confidentiality ofinformation, acceptance of gifts or entertainmentand use of ANZ goods, services and facilities.
Code of Conduct for Financial Officers – Inaddition to ANZ’s Code of Conduct for Employees,ANZ adopted the Group of 100 Code of Conductfor CFOs and Senior Financial Officers. The Coderequires that CFOs and Senior Financial Officersinfluencing financial performance adhere to theprinciples of honesty and integrity, respectconfidentiality of information, declare conflicts ofinterest, maintain transparency in reporting,exercise diligence and good faith, ensure soundinternal controls and set a standard for otherfinancial professionals.
Directors’ Disclosure of Interests Policy and Policyfor Handling Conflicts of Interests – The Board hasadopted a policy on disclosure of interests whichprovides processes whereby directors disclosecertain interests, and actual or potential conflictsof interest are to be addressed. Details ofdirectors’ dealings with ANZ are set out in Note 51of the Financial Report.
Employee Indemnity Policy – This policy providesthat the Group will indemnify employees againstany liability that they incur in carrying out theirrole subject to meeting certain requirements.Further details on this policy and on indemnitiesgiven to certain employees can be found on page52 of this Annual Report.
Policy on the Prevention of Money Laundering,Criminal and Terrorist Financing – This policycovers Anti-Money Laundering and Anti-Terrorismlaws and regulations. It sets out principles relatedto identification and record keeping procedures,the need for staff awareness and related training,and annual requirements for independent testingand compliance reporting. The policy ensures thatANZ is able to protect its reputation, integrity,assets, liabilities and shareholder funds.
Market (Information) Disclosure Policy – ANZ iscommitted to achieving best practice in the areaof market disclosure. The policy is designed toensure that there is full and timely disclosure ofANZ’s activities to shareholders and the market. It is important that all shareholders have an equalopportunity to receive or obtain informationissued by ANZ. The policy requires that onceinformation is disclosed to the relevant stockexchanges, it be placed on www.anz.com.
Relationship with the External Auditor – Ashighlighted on page 41, the Board and the AuditCommittee’s policy on audit and non-auditservices regulates the audit-related and non-auditservices that may be conducted by ANZ’s externalauditor. It sets in place a formal approval processregarding the provision of non-audit services,which are only considered where they are notperceived to be in conflict with the role of auditor.This approval process is the responsibility of theAudit Committee.
Serious Complaints Process – ANZ has a historyof implementing policies and procedures thatare consistent with responsible and well-managed business practices. The SeriousComplaints Process is an additional mechanismby which ANZ staff, contractors and consultantsmay voice any concerns they may haveregarding any malpractice or impropriety thatthey find within ANZ. It is intended to operateas a last resort and requires that protection begiven to employees against dismissal or penaltyas a result of disclosing concerns in good faith.
Share Trading Policy – This policy covers tradingin ANZ securities by all employees as well ascontractors and consultants engaged by ANZ.
The Share Trading Policy prohibits trading for all persons aware of unpublished ANZ pricesensitive information. In addition, it specificallyprohibits trading by certain employees,contractors and consultants working in specific areas of ANZ during blackout periods.A blackout period is the six-week period leadingup to the day after the announcement of thehalf yearly and full year result. The Board hasalso resolved to apply the principles of thispolicy to directors’ own trading in ANZ shares.
Significant Accounting Policies
Details of the significant accounting policiesand any changes in accounting policies madesince the date of the last Annual Report areset out on page 56 of this Annual Report andNote 1 of the Financial Report and in thepress release available on www.anz.com>shareholders >half year and full year results.
Political Donations
In the year to 30 September 2003, ANZ donated$75,000 to the Liberal Party and $50,000 to theLabor Party.

43
ANZ’s compensation philosophy focuses oncreating value for shareholders.
The following underpins ANZ’s compensationphilosophy:
> Creation of an environment where people canexcel with energy and passion;
> Focus on creating and enhancing value for ANZ’sshareholders;
> Differentiation of individual compensationcommensurate with contribution to overallresults and according to individualaccountability, performance and potential;
> Significant emphasis on “at risk” components oftotal compensation linked to the enhancementof shareholder value through improvements inEconomic Value Added™ (EVA™); and
> The provision of a competitive compensationproposition to successfully attract, motivate andretain the high quality work force required todeliver on ANZ’s business and growth strategies.
The Role of the CompensationCommitteeThe Compensation Committee (see page 41) isresponsible for (amongst other things):
> ANZ’s general compensation program – inconsultation with senior management, to reviewand recommend to the Board for approval, ANZ’sgeneral approach to compensation, and tooversee the development and implementationof compensation programs;
> Executive compensation program – to reviewand recommend to the Board for approval,compensation programs applicable to ANZ’sexecutives;
> CEO compensation – to review and recommendto the Board for approval, corporate goals andobjectives relevant to the compensation of theChief Executive Officer (CEO), to evaluate theperformance of the CEO in light of those goalsand objectives, and to recommend to the Boardthe CEO’s compensation level based on thisevaluation and other relevant factors (the CEOdoes not participate in discussion or decisionsrelating to his own compensation);
> Compensation governance – to review andapprove any statement on ANZ’s compensationpolicy and any executive compensationdisclosures that may be required by any listingrule, legislation, regulatory body, or otherregulatory or legislative requirement, or anystatement proposed for inclusion in ANZ’sannual report; and
> Non-executive directors’ fees – to review thecompensation of non-executive directorsannually.
External Advisors (Compensation)Group People Capital and Independent non-executive directors have, from time to time,received advice from a range of external advisors,including executive search firms.
Non-executive directors
Compensation
Non-executive directors’ fees are determinedby the Board of Directors based on advice fromexternal advisors and with reference to fees paidto other non-executive directors of comparablecompanies.
Non-executive directors’ fees are within the limitagreed to by shareholders at the Annual GeneralMeeting held on 13 December 2002, and are setat levels that fairly represent the responsibilitiesof, and the time spent by, the non-executivedirectors on Group matters.
Directors may elect to take all or part of their feesin shares under the Directors’ Share Plan. Underthis plan, shares are bought on market for anamount equivalent to the fee that would havebeen paid to the Director and are held in trust forthe Director for at least one year.
Retirement and Termination Benefits
All non-executive directors participate in the ANZDirectors’ Retirement Scheme. Under the ANZDirectors’ Retirement Scheme, a lump-sumretirement benefit is payable to non-executivedirectors upon their ceasing to be a director. Thelump-sum retirement benefit payable where thenon-executive director has held office for 8 yearsor more is equal to the total emoluments paid orpayable to the non-executive director in respectof the 3 years immediately preceding the non-executive director ceasing to be a non-executivedirector. For periods of less than 8 years, aproportionate part of such emoluments ispayable. The non-executive directors are notentitled to the statutory entitlements of longservice leave and annual leave.
Compensation
Emoluments
For the year ended 30 September 2003 details of the emoluments for the non-executive directors are set out below:
Fees Paid Benefits accrued Value of Associated Chairman’s Retirement for the year Superannuation
Cash deferred shares1 entity board fee benefit’s paid3 but not paid3 contribution TotalName $ $ $ $ $ $ $ $
C B Goode (Chairman) 76,000 274,000 – – – 35,000 10,520 395,520J C Dahlsen 110,000 – – 25,000 – 35,000 10,520 180,520Dr R S Deane 110,000 – 100,9962 – – 32,042 9,900 252,938J K Ellis 110,000 – – 25,000 – 76,563 10,520 222,083D M Gonski 110,000 – 42,500 – – 91,854 10,520 254,874M A Jackson 88,000 22,000 – – – 7,500 9,900 127,400Dr B W Scott 110,000 – – 25,000 – 32,500 10,520 178,020
Total 714,000 296,000 143,496 75,000 – 310,459 72,400 1,611,355
1 Participation in Director’s Share Plan. Value of shares at the date they were purchased on market2 Fees paid in NZ$ converted at average exchange rate of 1.11393 If each non-executive director had ceased to be director as at 30 September 2003, the following amounts would have been payable: Mr C B Goode $1,015,000, Mr J C Dahlsen $367,500, Dr R S Deane
$599,936, Mr J K Ellis $367,500, Mr D M Gonski $91,854, Ms M A Jackson $332,500, Dr B W Scott $363,750

Compensation StructureANZ’s compensation structures are designed tomeet the needs of the specialised business unitsand the markets in which they operate. As aresult, the mix of compensation components canvary across the organisation although, wherepracticable, ANZ applies structures andopportunities on a consistent basis for similarroles and levels. There is a strong emphasis onvariable pay opportunities with total employeecompensation differentiated significantly on thebasis of individual and/or business unitperformance.
Executive Compensation
ANZ’s executive compensation policy limitsincreases in fixed compensation and emphasises“at risk” compensation
The executive compensation program is designedto support the delivery of specific performancetargets and the execution of agreed businessand growth strategies. This program aims todifferentiate compensation on the basis ofachievement against both individual andbusiness unit performance targets which arealigned to sustained growth in shareholder value.
The executive compensation program comprisesthe following components:
> Fixed compensation component: salary, benefitsand superannuation contributions. The fixedcomponent is generally targeted to the marketmedian levels being paid in the finance industryin the relevant global markets in which ANZoperates.
> Variable or “at risk” component:
> Short-Term Incentive (STI) consisting of cashand deferred shares, and
> Long-Term Incentive (LTI) consisting ofperformance-hurdled options and deferredshares.
Fixed compensation
The fixed component of executive compensationis reviewed annually based on performance andmarket data. Increases in fixed compensation arelimited, in favour of a strong emphasis on variablecompensation.
Variable compensation
The following summarises how the variablecomponents of compensation are determined:
> Key Result Areas (performance targets) are set atthe beginning of each half-year;
> At the end of each half, performance is assessedagainst targets;
> Executives are ranked against peers according toperformance;
> An executive’s total bonus (STI) is basedprincipally on Business Unit and/or ANZ Groupperformance, individual ranking and totaltarget reward;
> Half of the bonus is paid in cash and halfthe bonus is allocated as shares deferred for3 years;
> Executives are also assessed and ranked ontheir future potential:
> An executive’s potential, together with theirranking, influences the size of their LTI grant;
> LTIs are allocated half as shares deferred for3 years and half as performance-hurdledoptions. Shares are allocated at market priceand options are allocated on the basis ofindependent valuations at the time ofallocation.
Variable compensation – Short-Term Incentive
Short-Term Incentives encourage executives tosupport ANZ’s strategic objectives by providingrewards that are significantly differentiated on thebasis of achievement against performance targets.
The size of STI payments is based, firstly, onoverall group and business unit performanceresults and, secondly, on individual performanceagainst financial and non-financial measures.Executives are ranked against their peers withbetter relative performance attracting a greaterproportion of the incentive “pool”.
Short-Term Incentives are paid half in cash andhalf in shares deferred for 3 years. The STIdeferred shares are administered under the ANZEmployee Share Acquisition Plan.
Variable compensation – Long-Term Incentive
Long-Term Incentives are used as a mechanismto link a significant portion of executives’compensation to the attainment of sustainedgrowth in shareholder value. The size of LTIgrants is influenced significantly by individualperformance and the assessed potential forexecutives to deliver on ANZ’s long-term growthand business strategies.
The deferred shares component of the LTI isadministered under the ANZ Employee ShareAcquisition Plan. The shares are deferred forthree years.
The options component of the LTI is administeredunder the ANZ Share Option Plan. The options canonly be exercised between 3 years from grant andwhen they lapse after 7 years. The following typesof LTI options may be granted to executives:
> Index-linked options – These options have adynamic exercise price, i.e. the exercise price willbe adjusted in line with the movement in theS&P/ASX 200 Banks (Industry Group)Accumulation Index (excluding ANZ). As anadditional constraint, the option can only beexercised if the adjusted exercise price is equalto or above the original issue price. Index linkedoptions ensure that executives are onlyrewarded for the true out-performance of ANZ’sshare price over and above the movement in theabove Index.
> Hurdled options – These options have anexercise price set to the market value at the timeof allocation. There are two hurdles:
1. Half the options may only be exercised oncethe ANZ total shareholder return (ANZ TSR)exceeds the percentage change in theS&P/ASX 200 Banks (Industry Group)Accumulation Index, measured over the sameperiod (since issue) and calculated as at thelast trading day of any month (once theexercise period has commenced).
2. The other half of hurdled options may only beexercised once ANZ TSR exceeds thepercentage change in the S&P/ASX 100Accumulation Index, measured over the sameperiod (since issue) and calculated as at thelast trading day of any month (once theexercise period has commenced).
Compensation 44

45
Chief Executive Officer
Compensation
Mr McFarlane has an employment agreement withANZ which terminates on 1 October 2006 and maybe extended or renewed by mutual agreement.The termination arrangements associated withthis agreement are described in the section onRetirement and Termination Benefits below.
The structure of Mr McFarlane’s compensation,which is in accordance with his agreement, is asfollows:
> Fixed Compensation: Consists of salary, benefitsand superannuation contributions. Mr McFarlanemay elect to receive a proportion of his FixedCompensation in the form of shares purchasedunder the Directors’ Share Plan.
> Short-Term Incentive: Mr McFarlane’s Short-TermIncentive is determined under the ANZ ExecutiveRemuneration Scheme. It is based on theGroup’s EPS Growth and EVA performanceagainst target and an annual assessment of MrMcFarlane’s achievement of specific objectivesagreed with the Board. Mr McFarlane’s Short-Term Incentive may be paid in cash or in shares
purchased under the Directors’ Share Plan. MrMcFarlane has always elected to receive shares.
> Long-Term Incentive: Mr McFarlane’s Long-TermIncentive was approved by shareholders at theAnnual General Meeting in December 2001. Fourtranches of options were approved for issue:500,000 in 2001; 1,000,000 in 2002;1,000,000 in 2003 and 500,000 in 2004.The exercise of these options is subject toperformance hurdles being satisfied.Mr McFarlane’s specific performance hurdlesare indicated in Note 50 of the Financial Report.
The compensation of Mr McFarlane for the yearended 30 September 2003 is set out in thesection on Emoluments below.
Retirement and Termination Benefits
Mr McFarlane can terminate his employmentagreement by providing 12 months’ notice. ANZmay terminate the employment agreement byproviding notice or payment in lieu of notice equalto the unexpired term of the employmentagreement (which ends on 1 October 2006).Payment in lieu of notice is based on TEC (Total
Employment Cost package comprising salary orfees, benefits and superannuation contributions).In circumstances of serious misconduct, MrMcFarlane is only entitled to payment of TEC up todate of termination. Payment of accumulatedsuperannuation benefits plus statutoryentitlements of long service leave and annualleave (calculated on the basis of salary or fees)applies in all events of separation.
In the event of resignation not approved by theBoard or dismissal for serious misconduct, allunexercised options will be forfeited. In the eventof termination on notice, all option grants may beexercised. Upon separation, option entitlementsmust be exercised within 6 months of termination.In the event of serious misconduct, shares held inthe Directors’ Share Plan will be forfeited, but willbe released on resignation or termination onnotice.
Emoluments
For the year ended 30 September 2003 details of the emoulments for the CEO are set out below:
Annual CompensationSuperannuation Performance Related Bonus
Salary or fees1 contributions Deferred shares1 TotalName Year Ended $ $ $ $
J McFarlane (CEO) September 2003 1,412,250 87,750 982,121 2,482,121September 2002 1,419,462 80,538 1,398,236 2,898,236
1 J McFarlane’s performance-related bonus and part of his salary have been used to purchase on market deferred shares under the Directors’ Share Plan. Shares obtained have not been amortised
Long-Term Incentive (LTI) amortisation
Amortised cost of LTIName Year Ended options granted $2
J McFarlane (CEO) September 2003 2,538,759September 2002 1,747,071
2 Details of options and deferred shares granted under long-term incentive arrangements appear in the Annual Report of the year in which they are grantedIn accordance with Australian Securities and Investments Commission guidelines, remuneration includes a proportion of the fair value of options and deferred shares granted pursuant to the Company’s equity-based incentive plans (both short-term and long-term) and which had not yet fully “vested” as at the commencement of the financial year. These values represent the amortised cost of options and deferredshares as determined at grant date and are progressively allocated on a straight-line basis over the “vesting period” for options and deferred shares. It is assumed that 100% of all options and deferred sharesgranted will vest and no adjustments will be made to reverse amounts in relation to options that never vest (eg through forfeiture)The amount included as remuneration is not related to nor indicative of the benefit (if any) that individual executives may ultimately realise should the options become exercisable or the deferred shares vest.The fair value of options as at their effective date of grant has been determined in accordance with the fair value measurement provisions of Accounting Exposure Draft ED108 (input assumptions are detailed inNote 50 of the Financial Report). The fair value of deferred shares is the weighted average price of the Company’s shares during the one week up to and including the allocation date
Long-Term Incentive
Options granted during year3
Hurdled OptionsName Number Issued Date Exercise Price $4
J McFarlane (CEO) 1,000,000 31.12.2002 17.41
3 J McFarlane’s options expire five years from the date of grant. These options are exercisable between two and five years of the date of grant if certain performance conditions are met. Each option entitlesJ McFarlane to purchase one ordinary fully paid share in the Company. Estimated value per option has been calculated as at the date of issue in accordance with the fair value measurement provisions ofAccounting Exposure Draft ED108 and was $2.09 (31 December 2002)
4 The exercise price is set at the weighted average price of the Company’s shares during the five trading days immediately after the Annual General Meeting of the Company held in respect of the financial year ofthe Company that ended before the date of grant

Compensation 46
Executives
Emoluments
For the year ended 30 September 2003 details of the Emoluments of the six executives of the Group and Company receiving the highest emoluments areset out below:
Annual Compensation including Short-Term Incentive (STI) amortisationPerformance Related Bonus
Amortised cost ofSTI deferred shares Superannuation
Salary or fees Benefits1 Cash component granted2 contributions TotalName Year Ended $ $ $ $ $ $
D L Boyles September 2003 654,850 4,200 192,508 280,920 40,950 1,173,428September 2002 654,189 8,227 220,355 430,147 37,584 1,350,502
G Branston September 20033 445,055 24,105 484,053 461,176 – 1,414,389September 20024 469,760 25,973 458,891 630,016 – 1,584,640
R Edgar September 2003 583,500 28,475 222,004 235,632 38,025 1,107,636September 2002 467,951 28,245 196,676 333,240 28,188 1,054,300
E Funke Kupper September 2003 654,850 4,200 210,008 313,830 40,950 1,223,838September 2002 658,446 3,970 261,865 436,223 37,584 1,398,088
P J O Hawkins September 2003 593,432 4,200 200,016 278,936 43,875 1,120,459September 2002 705,761 3,970 213,198 460,451 40,269 1,423,649
P R Marriott September 2003 654,850 4,200 239,017 294,492 40,950 1,233,509September 2002 658,446 3,970 256,671 421,861 37,584 1,378,532
1 Benefits include the provision of housing, cars and parking, private health insurance, subsidised loans and certain other expenses2 Refer to footnote 2 under Chief Executive Officer Emoluments3 Conversion rate of GBP @ 0.38224 Conversion rate of GBP @ 0.3621
Long-Term Incentive (LTI) amortisationAmortised cost of LTIoptions and deferred
Name Year Ended shares granted $5
D L Boyles September 2003 626,437September 2002 556,638
G Branston September 20036 257,813September 20027 173,597
R Edgar September 2003 341,535September 2002 193,620
E Funke Kupper September 2003 682,536September 2002 576,174
P J O Hawkins September 2003 562,848September 2002 564,715
P R Marriott September 2003 645,841September 2002 561,122
5 Refer to footnote 2 under Chief Executive Officer Emoluments6 Conversion rate of GBP @ 0.38227 Conversion rate of GBP @ 0.3621
Short-Term Incentive
Deferred Shares granted during year8
Name Number9 Value $10
D L Boyles 10,248 186,301G Branston 27,472 500,406R Edgar 12,045 219,500E Funke Kupper 12,702 230,850P J O Hawkins 11,318 205,836P R Marriott 13,930 253,467
8 Deferred shares issued as Short-Term Incentives may be held in trust for up to ten years and are restricted for up to three years9 Represents number granted in relation to the year ended 30 September 2003 (ie. granted in October 2002 and May 2003)10 Based on the Company share price at grant date determined as the weighted average price of the Company’s shares during the one week up to and including the allocation date.
Deferred shares are granted in or around April and October of each year

47
Long-Term Incentive
Deferred Shares granted during year11
Name Number12 Value $13
D L Boyles 16,100 293,426G Branston 3,100 56,476R Edgar 16,100 293,741E Funke Kupper 14,800 269,668P J O Hawkins 10,800 196,973P R Marriott 18,400 335,489
11 Deferred shares issued as Long-Term Incentives may be held in trust for up to 10 years and are restricted for three years12 Refer to footnote 9 under Short-Term Incentive13 Refer to footnote 10 under Short-Term Incentive
Options granted during year14
NameIndex linked options Index linked options
Value $ Number issued Date base exercise price $15 Number Issued Date base exercise price $15
D L Boyles 132,000 20.05.2003 18.32 140,000 23.10.2002 18.06G Branston 24,800 20.05.2003 18.32 28,600 23.10.2002 18.06R Edgar 147,000 20.05.2003 18.32 125,000 23.10.2002 18.06E Funke Kupper 119,000 20.05.2003 18.32 131,000 23.10.2002 18.06P J O Hawkins 96,000 20.05.2003 18.32 87,000 23.10.2002 18.06P R Marriott 158,000 20.05.2003 18.32 153,000 23.10.2002 18.06
14 All options expire seven years from the date of grant. These options are exercisable between three and seven years of the date of grant. Each option entitles the holder to purchase one ordinary fully paidshare in the Company. Estimated values per option have been calculated as at the dates of issue in accordance with the fair value measurement provisions of Accounting Exposure Draft ED108 and were: $1.10 (23 October 2002), $1.04 (20 May 2003)
15 The prevailing exercise price will be the base exercise price indexed by the change in the S&P/ASX 200 Banks (Industry Group) Accumulation Index excluding ANZ. The prevailing exercise price can be nolower than the base exercise price, which is set at the weighted average price of the Company’s shares during the week up to and including the allocation date
Retirement and Termination Benefits forexecutives (excluding the Chief Executive Officer)
The following separation arrangements vary inaccordance with the level of an executive:
> ANZ may terminate the executive’s employmentagreement by providing 6 or 12 months’ notice.
> The executive may terminate their employmentagreement by providing 3 or 12 months’ notice.
> In the event that no suitable position exists, theexecutive is entitled to a severance payment of6 or 12 months’ Total Employment Cost (TEC).
In circumstances of serious misconduct, theexecutive is only entitled to payment of TEC up todate of termination. Entitlement to accumulatedsuperannuation benefits and the statutoryentitlements of long service leave and annualleave (calculated on the basis of Salary or Fees)applies in all events of separation.
In the event of resignation or dismissal for seriousmisconduct, all unexercised options and unvesteddeferred shares will be forfeited. In the event oftermination on notice, all STI deferred shares willvest, and all unexercised options and unvested LTIshares will be are forfeited.
In the event of retrenchment, all STI deferredshares will vest. A pro-rated entitlement to optionsgranted since 24 April 2002 applies. All priorgrants may be exercised. LTI deferred shares willbe pro-rated on grants made since 23 October2002. All prior LTI shares will vest.

IntroductionThe Annual Report of ANZ is a key communicationto our stakeholders. ANZ presents two reports, theANZ Annual Report (this document) and the ANZFinancial Report. Both reports show how ANZperformed during the year ended 30 September2003 and the overall financial position of theGroup at the end of the year. ANZ also publishesan announcement to the market each half year. All these documents can be accessed onwww.anz.com
ANZ prepares its financial reports in accordancewith Australian Accounting Standards. Particularterms required by the Standards may not befamiliar to some readers and this guide is designedto assist readers to understand the report.
Annual Report ContentsThe ANZ Annual Report has two main sections –the front section (pages 1 to 48) and the ConciseFinancial Report (pages 49 to 63). The frontsection contains information about significantmatters that impacted the management andperformance of ANZ during the year, includingdiscussion and analysis of the financial results,updates on the specialist business units andGroup-wide programs and information on thedirectors and senior management. The ConciseFinancial Report contains financial informationrequired by Australian Accounting Standardsincluding the Consolidated Statements ofFinancial Performance, Financial Position andCash Flows. These statements have beenprepared by ANZ’s staff, reviewed by ANZ’s Boardand Audit Committee, and audited by ourexternal auditor, KPMG. The assets, liabilities andresults of controlled companies are includedwithin the consolidated results of the Group.
Consolidated Statement ofFinancial Performance (see page 53)Financial performance refers to ANZ’s profit for the year including:
> the sources of ANZ’s income split between net interest income and other income
> the expenses incurred by ANZ during the year
> provision for doubtful debts
> ANZ’s tax expense for the year.
The key figure to look at is “Net profitattributable to shareholders of the Company”,which is the profit for the year.
Consolidated Statement ofFinancial Position (see page 54)This Statement is a summary of the assets,liabilities and shareholders’ equity as at 30September 2003. It shows what ANZ as a Groupowns as assets, what it owes as liabilities andthe ANZ Group’s net assets. Net assets are equalto total shareholders’ equity. The assets andliabilities are listed in order of liquidity, withthose assets representing cash shown firstand those hardest to convert to cash i.e. fixedassets, last.
Consolidated Statementof Cash Flows (see page 55)The Consolidated Statement of Cash Flowssummarises the Group’s cash payments and cash receipts for the financial year. The valuesmay differ from those shown in the ConsolidatedStatement of Financial Performance because theConsolidated Statement of FinancialPerformance is prepared on an accrualaccounting basis.
Cash in the Statement refers to cash on hand,bank deposits and other forms of highly liquidinvestments that can readily be converted to cash.
Directors’ Declaration (see page 60)This declaration contains the director’s sign-offthat the Annual Report complies with AccountingStandards and provides a true and fair view of the performance and financial position ofthe Company.
Auditors’ Report (see page 61)The independent audit report is the external andindependent opinion on the Financial Report. Itprovides the reader with an independentopinion on the Financial Report.
Key TermsArrears – see page 12
Cost-to-income ratio (CTI) – see page 2
Credit rating – see page 2
Credit risk – see page 12
Dividend per share (DPS) – see page 2
Earnings per share (EPS) – see page 2
Economic value added (EVA™) – see page 2
Equity – the residual interest in the assetsof a company after deducting all liabilities.As a publicly listed company, our shareholdersown these net assets. This is calledshareholders’ equity.
Equity standardisation – EVA™ principles are in use throughout the Group, whereby riskadjusted capital is allocated and charged againstbusiness units. Equity standardised profit isdetermined by eliminating the impact ofearnings on each business unit’s book capitaland attributing earnings on the business unit’srisk adjusted capital. This enhancescomparability of business unit performance.Geographic results are not equity standardised.
Franked dividends – dividends paid by thecompany out of profits on which the companyhas already paid Australian tax.
Full time equivalent (FTE) – our total staff numbersbased on the working week. For example, twopart-time staff in Australia each working 20hours a week would be defined as one FTE astheir hours add up to 40 hours a week.
Interest margin – a measure which tells us howmuch interest we have generated by lendingmoney after accounting for our costs of borrowingthat money, either from customers or financialmarkets. The interest margin is calculated bydividing net interest income by average interest-earning assets. This is expressed as a percentage.
Market capitalisation of ordinary shares – thestock market’s assessment of a company’svalue, calculated by multiplying the number of shares on issue by the current share price.
Market risk – see page 12
Net profit after tax(NPAT) – see page 2
Non-interest income – includes fees, profits oncapital markets trading, foreign exchange earningand any other revenue that is not interest income.
Operating revenue – the income ANZ generatesfrom its activities. This includes net interest, feeincome and earnings from capital markets andforeign exchange dealings.
Operational risk – see page 12
Organic growth – where we have increasedour business through growth in our existingoperations rather than through acquisition of another company.
Return on equity (ROE) – see page 2
Service Transfer Pricing – is used to allocatethe cost of services that are provided by centralareas of the company to each business unit.
Significant transactions – see page 3
Provisions and doubtful debtsEconomic loss provisioning (ELP) (or provisionfor doubtful debts) – each month the Grouprecognises an expense for credit losses basedon the expected average annual loss of principalover the economic cycle for each part of the loanportfolio. The method used by the Group fordetermining this monthly expense charge isreferred to as ‘economic loss provisioning’ (ELP).The Group uses ELP models to calculate theexpected loss by considering:
> the history of credit loss for each type and riskgrade of lending; and
> the size, composition and risk profile of thecurrent loan portfolio.
Net specific provision – the transfer from thegeneral provision to the specific provision(representing new and increased specificprovisions less specific provision releases)less recoveries.
Non accruals – loans or other credit facilitieswhere there is reasonable doubt about thecollectability of interest, fees (past and future) orprincipal outstanding, or where concessionalterms have been provided because of thefinancial difficulties of the customer.
Specific provision – the Group maintainsa specific provision for doubtful debts arisingfrom its exposure to organizations and creditcounterparties. When it is identified that fullrepayment of a loan on our book is unlikely,we will create a specific provision for that loan.
Guide to Concise Financial Report
48

49
Our Capital FrameworkAdjusted common equity (ACE) – Tier one capitalless preference shares at current rates anddeductions from regulatory capital.
Capital adequacy ratio – a measure that comparesour regulatory capital with our risk-weighted assets.
Risk-weighted assets – the Group’s assetsadjusted for the risk of the counterparty. Therelative risk weight for each counterparty isdetermined by the Bank for InternationalSettlements. For example, a mortgage with a LVR(loan to valuation ratio) below 80% carries a riskweighting of 50%.
Tier One capital – the highest quality capitalfrom a risk perspective. It consists of paid-upordinary shares, general reserves, retainedearnings, and certain preference shares lessspecified deductions.
Tier Two capital (or supplementary capital) –includes general provisions for doubtful debts(subject to a limit), asset revaluation reserves,mandatory convertible notes and similar capitalinstruments.
Understanding the ConsolidatedStatement of Financial PositionThis financial statement reports a company’sassets or resources and the claims against them –including liabilities or obligations of a businessand shareholders’ equity.
Asset – resources controlled by the company.Assets can be in the form of money, such as cashor amounts owed; they can be fixed assets such asproperty or equipment; or they can be intangiblessuch as a company’s goodwill, trademarks andpatents. For accounting purposes, assets arefuture economic benefits which are controlled bythe entity and result from past transactions orevents. For banks, loans are assets.
Liability – a company’s obligations to a lender,supplier of goods and services, a tax authorityand others. For accounting purposes, liabilitiesare future sacrifices of economic benefits that anentity is obliged to make as a result of pasttransactions or events. For ANZ, liabilities are largely money we have borrowed to fund ourlending activities.
Numbers shown in brackets ( ) – the bracketsare there to indicate a negative figure, instead of using a minus symbol.
When reading ANZ’s Statement of FinancialPosition, you will see it divided into “Assets” and“Liabilities”. Here is an explanation of the mainentries under each heading.
AssetsCustomer’s liabilities for acceptances – theamounts owed to the Group from customersfor acceptances, a form of lending.
Deferred tax assets – the future tax savings to the Group as a result of timing differences thatarise due to different treatment of transactionsunder accounting and tax rules.
Due from other financial institutions – the monies owed to ANZ by other banks and financial institutions.
Goodwill – the remaining amount, afteramortisation, of the historic excess over netasset value paid by ANZ for the acquisition of other companies.
Investment securities – the investments insecurities that ANZ intends to hold to maturity.
Liquid assets – the cash or cash equivalentsheld by ANZ.
Net loans and advances – ANZ’s largest assetby value, this consists of the loans ANZ hasadvanced to individuals and organisations, less an allowance for doubtful loan recoveries.
Other assets – includes assets that do not fitinto the categories listed here including theincrease in market value of amounts receivablefrom derivatives (refer also to ‘Payables and other liabilities’) and interest accrued and notyet received.
Premises and equipment – the value of allthe land, buildings, furniture, equipment, etc.which is owned by the Group.
Regulatory deposits – the cash ANZ hasdeposited at central banks to meet regulatoryrequirements.
Shares in associates and joint venture entities– ANZ’s investment in companies where theinterest is large enough to provide significantinfluence rather than control over the company,or where ANZ has joint control.
Trading securities – the securities held by ANZthat are regularly bought and sold as part ofits normal trading activities.
LiabilitiesBonds and notes – the Group’s liability for long-term financing bond and note facilitiesissued in wholesale markets to provide long-term financing.
Due to other financial institutions – the moniesowed to other Banks and financial institutionsby ANZ.
Deposits and other borrowings – ANZ’s largestliability, this represents ANZ’s obligations to our depositors.
Income tax liabilities – the amounts payable in respect of income tax.
Liability for acceptances – the amount owed to customers who have purchased customeracceptances from the Group.
Loan capital – the long-term funding that would rank behind other creditors, and ahead of onlyshareholders’ in the event of a winding up.
Payables and other liabilities – includes variousoperating creditors, accrued interest payableand market value of amounts payable onderivatives held by the Group.
Provisions – the Group’s accrued obligationsfor long service, annual leave and otherobligations, which although known, arenot yet payable.
Shareholders’ EquityThe components that make up shareholders’equity are:
> Ordinary and preference share capital – theamounts received when shares were originallysubscribed for;
> Reserves – retained profits plus surpluses ordeficits arising from (for example) revaluationsof properties, foreign exchange gains or losseson offshore operations; and
> Retained Profits – the amount of profitsretained by the Group.
This Concise Financial Report cannot be expected to provide as full an understanding of the Group’s financial performance, financialposition and financing and investing activities asthe Group’s 2003 Financial Report.
Analysis and discussion of the concise financialreport is on pages 2 to 3 and 8 to 11.
2003 Financial ReportA copy of the Group’s 2003 Financial Report,including the independent Auditors’ Report, isavailable to all shareholders, and will be sent toshareholders without charge upon request. TheFinancial Report can be requested by telephone (Australia: 1800 11 33 99,Overseas: (+ 61 3) 9615 5989) or by emailto [email protected]
ContentsTen Year Summary 50Directors’ Report 51Statement of Financial Performance 53Statement of Financial Position 54Statement of Cash Flows 55Notes to the Concise Financial Statements 56Directors’ Declaration 60Auditors’ Report 61Financial Highlights in Key Currencies 61Exchange Rates 61Shareholder Information 62Shareholder Feedback Form Last page
Concise Financial Report

Ten Year Summary1,2
2003 2002 2001 2000 1999 1998 1997 1996 1995 1994$m $m $m $m $m $m $m $m $m $m
Financial PerformanceNet interest income 4,311 4,018 3,833 3,801 3,655 3,547 3,437 3,327 3,084 2,794Other operating income 2,808 2,970 2,573 2,583 2,377 2,142 2,110 1,839 1,754 1,793Operating expenses (3,228) (2,905) (3,092) (3,314) (3,300) (3,442) (3,502) (3,397) (3,116) (3,001)
Profit before tax, debt provisionand prior period abnormals 3,891 4,083 3,314 3,070 2,732 2,247 2,045 1,769 1,722 1,586Provision for doubtful debts1 (614) (860) (531) (502) (510) (487) (400) (175) (237) (388)Income tax expense (926) (898) (911) (863) (736) (576) (466) (469) (442) (388)
Outside equity interests (3) (3) (2) (2) (6) (9) (8) (9) (10) (7)
Net Profit after taxbefore prior period abnormals 2,348 2,322 1,870 1,703 1,480 1,175 1,171 1,116 1,033 803
Net prior period abnormal profit (loss) – – – 44 – (69) (147) – 19 19
Net profit after tax 2,348 2,322 1,870 1,747 1,480 1,106 1,024 1,116 1,052 822
Financial PositionAssets2 195,591 183,105 185,493 172,467 152,801 153,215 138,241 127,604 112,587 103,874Net Assets 13,787 11,465 10,551 9,807 9,429 8,391 6,993 6,336 5,747 5,504Tier 1 capital ratio 7.7% 7.9% 7.5% 7.4% 7.9% 7.2% 6.6% 6.7% 6.6% 6.8%Return on average ordinary equity3,4 20.6% 21.6% 20.2% 19.3% 17.6% 15.9% 17.2% 18.3% 17.9% 15.6%Return on average assets3 1.2% 1.3% 1.1% 1.1% 1.0% 0.7% 0.7% 0.9% 0.9% 0.8%Cost income ratio5 45.1% 46.0% 48.0% 51.7% 54.5% 60.9% 63.1% 65.8% 64.4% 65.4%
Shareholder value – ordinary sharesTotal return to shareholders(share price movement plus dividends) 6.7% 15.3% 25.5% 35.3% 19.6% –15.6% 62.4% 33.9% 52.4% 2.0%Market capitalisation 27,314 26,544 23,783 20,002 16,045 13,885 17,017 10,687 8,199 5,293Dividend 95c 85c 73c 64c 56c 52c 48c 42c 33c 25cFranked portion –interim 100% 100% 100% 100% 75% 60% 100% 50% 0% 0%
–final 100% 100% 100% 100% 80% 60% 100% 100% 33% 0%Closing share price –high $19.23 $20.38 $17.39 $13.46 $12.45 $11.88 $11.58 $7.28 $5.75 $5.68
–low $15.95 $16.33 $13.44 $9.60 $8.58 $8.45 $7.10 $5.41 $3.55 $3.78–30 Sep $17.95 $17.65 $15.98 $13.28 $10.25 $9.02 $11.28 $7.23 $5.67 $3.91
Share information (per fully paid ordinary share)Earnings per share –basic 148.3c 147.3c 117.4c 106.8c 90.6c 72.6c 68.6c 76.3c 69.9c 55.9cDividend payout ratio6 64.2% 57.8% 62.0% 59.1% 62.1% 67.8% 61.6% 55.5% 49.1% 46.4%Net tangible assets $7.49 $6.58 $5.96 $5.49 $5.21 $4.98 $4.59 $4.24 $3.94 $3.58No. of fully paid ordinary
shares issued (millions) 1,521.7 1,503.9 1,488.3 1,506.2 1,565.4 1,539.4 1,508.6 1,478.1 1,446.0 1,353.6DRP issue price7 –interim $18.48 $19.24 $15.05 $11.62 $10.95 $10.64 $9.77 $5.59 $4.40 $3.78
–final – $18.32 $18.33 $14.45 $11.50 $10.78 $9.92 $7.60 $6.27 $3.73
Other informationPoints of representation 1,019 1,018 1,056 1,087 1,147 1,205 1,473 1,744 1,881 2,026No. of employees (full time
equivalents)8 23,137 22,482 22,501 23,134 30,171 32,072 36,830 39,721 39,240 39,642No. of shareholders9 223,546 199,556 181,035 179,244 214,151 151,564 132,450 121,847 114,829 121,070
1 From 1997, the annual debt provision charge has been calculated based on economic loss provisioning; prior year data has not been restated for this change in measurement approach2 Data for 1998, 1999, 2000 and 2001 includes the consolidation of assets in the statutory funds of ANZ Life as required by an accounting standard applicable from 1 October 1999. Not applicable for 2002
onwards, due to the sale of ANZ Life to ING Australia Ltd (INGA) on 1 May 20023 Excludes significant transactions and outside equity interests4 For the periods 1997 to 2002 the return on average ordinary equity calculation accrues the dividend over the year, for 2003 dividends may no longer be accrued and as such are not included in the calculation of
return on average ordinary equity5 Excludes goodwill amortisation, abnormals and significant transactions6 For 2003 the dividend payout ratio includes the final dividend of $777 million which is proposed but not provided for in terms of AASB 1044 Provisions, Contingent Liabilities and Contingent Assets7 DRP represents Dividend Reinvestment Plan8 Prior to 1997, excludes temporary staff9 For 2000, 2001, 2002 and 2003 the number of shareholders does not include the number of employees whose shares are held by ANZEST Pty Ltd as the trustee for shares issued under the terms
of any ANZ employee incentive plan
50
51
Directors’ ReportThe directors present their report together withthe concise financial report of the consolidatedentity (the Group), being Australia and NewZealand Banking Group Limited (the Company)and its controlled entities, for the year ended30 September 2003 and the auditors’ reportthereon. The information is provided inconformity with the Corporations Act 2001.
Principal ActivitiesThe principal activities of the Group during theyear were general banking, mortgage lending,leasing, hire purchase and general finance,international and investment banking, nomineeand custodian services, executor and trusteeservices and through its joint venture INGAustralia Limited (INGA), life insurance andwealth management.
There has been no significant change in thenature of the principal activities of the Groupduring the financial year.
At 30 September 2003, the Group had 1,019points of representation.
ResultConsolidated net profit after income taxattributable to shareholders of the Company was$2,348 million. Further details are contained inthe Chief Executive Officer’s Report and theChief Financial Officer’s Review on pages 6 to 7and 8 to 11 respectively of this Annual Report.
DividendsThe directors propose that a final fully frankeddividend of 51 cents per fully paid ordinaryshare be declared on 13 November 2003 and bepaid on 19 December 2003. The proposedpayment amounts to $777 million.
During the financial year, the following fullyfranked dividends were paid on fully paidordinary shares:
Amount beforeCents per bonus options Date of
Type share $m payment
Final 46 692 13 December 2002
Interim 44 666 1 July 2003
The final dividend for the year ended30 September 2002 was paid on 13 December2002 and is detailed in the Directors’ Reportdated 4 November 2002.
Review of OperationsA review of the operations of the Group duringthe financial year and the results of thoseoperations are contained in the Chairman’sReport, the Chief Executive Officer’s Reportand the Chief Financial Officer’s Review onpages 4 to 5, 6 to 7 and 8 to 11 respectively ofthis Annual Report.
State of AffairsIn the directors’ opinion, there have beenno significant changes in the state of affairs ofthe Group during the financial year, other than:
> Net loans and advances increased by 13% from $132,060 million to $149,465 million,primarily from growth in mortgage lending and commercial lending in Australia andNew Zealand.
> Deposits and other borrowings increased by 10% from $113,259 million to $124,494million.
> The charge for doubtful debts has beendetermined using economic loss provisioningand is based on the Group’s risk managementmodels.
The economic loss provision charge decreasedfrom $860 million (including a $250 millionspecial provision) to $614 million. Our economicloss provisioning models recognise that thegeneral provision balance must be regularlyreviewed, and in rare situations, increased tocover unusual events. An additional charge of$100 million was taken to recognise continueduncertainty and expected levels of default in theoffshore lending portfolios. The balance is at anappropriate level.
> Net specific provisions were $527 million, downfrom $728 million.
> Gross non-accrual loans decreased to $1,007million, or 0.6% of net loans and advancesand acceptances.
> On 23 September 2003, the Company issued 10 million stapled securities, raising $1 billion(before issue costs). Further details are includedon page 56 of this Annual Report.
> During the years 1996–2002 ANZ was involvedin securities lending, equity swaps, and othersimilar kinds of transactions in the normalcourse of its business of banking. The ATO hadbeen reviewing these transactions for sometime. On 21 February 2003, a settlement wasreached between the ATO and ANZ whichinvolved the payment of $262 million to theATO. The amount was met from ANZ’s existingtax provisions.
While the above matters are those considered to be significant changes, reviews of mattersaffecting the Group’s state of affairs are alsocontained in the Chairman’s Report, the ChiefExecutive Officer’s Report and the ChiefFinancial Officer’s Review.
Events since the End of theFinancial YearOther than the acquisition of the National Bankof New Zealand and the call for the buy-backof the Trust Securities Issues (TrUEPrS) (referpage 59 of this Annual Report), no matter orcircumstance has arisen between 30 September2003 and the date of this report that hassignificantly affected or may significantly affectthe operations of the Group in future financialyears, the results of those operations or thestate of affairs of the Group in future years.
Future DevelopmentsDetails of likely developments in the operationsof the Group in future financial years arecontained in the Chairman’s Report and theChief Executive Officer’s Report. In the opinionof the directors, disclosure of any furtherinformation would be likely to result inunreasonable prejudice to the Group.
Environmental RegulationThe operations of the Group are not subject toany particular or significant environmentalregulation under a law of the Commonwealth orof a State or Territory. However, the operations ofthe Group may become subject to environmentalregulation when enforcing securities over landand ANZ is developing policies to appropriatelymanage such environmental risks.
ANZ has not incurred any environmentalliabilities during the year.
Rounding of AmountsThe Company is a company of the kind referred to in Australian Securities andInvestments Commission class order 98/100dated 10 July 1998 pursuant to section 341(1)of the Corporations Act 2001. As a result,amounts in this report and the accompanyingfinancial statements have been rounded to thenearest million dollars except where otherwiseindicated.
ShareholdingsThe directors’ shareholdings, both beneficialand non-beneficial, as at the date of this reportin the shares of the Company are detailed in the Compensation Report on pages 43 to 47 ofthis Annual Report.

Share OptionsDetails of share options issued over un-issuedshares granted to the Chief Executive Officer,senior executives and officers, and on issue asat the date of this report are detailed in theCompensation Report on pages 43 to 47 of thisAnnual Report, and Note 50 of the FinancialReport.
No person entitled to exercise any option has orhad, by virtue of an option, a right to participatein any share issue of any other body corporate.
The names of all persons who currently holdoptions are entered in the register kept bythe Company pursuant to section 170 of theCorporations Act 2001. This register may beinspected free of charge.
Directors’ Qualificationsand ExperienceThe Board comprises seven non-executivedirectors who have a diversity of business andcommunity experience and one executivedirector, the chief executive officer, who hasextensive banking experience. The names,qualifications and experience of the directorswho are in office at the date of this report arecontained on pages 34 to 37 of the 2003 AnnualReport and those pages are incorporated in andform part of this report.
Special responsibilities and attendanceat meetings by directors, are shown in theCorporate Governance Statement on pages38 to 42 of this Annual Report.
Directors’ and Executive Officers’Emoluments and CompensationPolicyDetails of ANZ’s compensation policy in respectof the directors and executive officers is detailedin the Compensation Report on pages 43 to 47of this Annual Report. Details of the emolumentspaid to each non-executive director are detailedin the Compensation Report on page 43 ofthis Annual Report. Details of the emolumentspaid to the chief executive officer and directorare detailed on page 45 of this Annual Report.Details of the emoluments paid to the sixexecutives of the Company and the Groupare detailed in the Compensation Report onpages 46 to 47 of this Annual Report and thesepages are incorporated in and form part of thisAnnual Report.
Directors’ and Officers’ IndemnityThe Company’s Constitution (Rule 11.1) permitsthe Company to indemnify each officer oremployee of the Company against liabilities (sofar as may be permitted under the CorporationsAct 2001) incurred in the execution anddischarge of the officer’s or employee’s duties.
It is the Company’s policy that its employeesshould not incur any liability for acting in thecourse of their employment legally, within thepolicies of the Company and provided they actin good faith.
Under the policy, the Company will indemnifyemployees against any liability they incur incarrying out their role. The indemnity protectsemployees and former employees who incur aliability when acting as an employee, trustee orofficer of the Company, or a subsidiary of theCompany at the request of the Company.
The indemnity is subject to the Corporations Act2001 and will not apply in respect of any liabilityarising from:
> a claim by the Company;
> a claim by a related body corporate;
> a lack of good faith;
> illegal or dishonest conduct; or
> non compliance with the Company’s policiesor discretions.
The Company has entered into Deeds of Access,Insurance and Indemnity with each of itsdirectors and secretaries and with certainemployees and certain other individuals who actas directors of related body corporates or ofanother company. To the extent permitted bylaw, the Company indemnifies the individual forall liabilities, including costs, damages andexpenses incurred in their capacity as an officerof the company to which they havebeen appointed.
The Company has indemnified the trustees andformer trustees of certain of the Company’ssuperannuation funds and directors, formerdirectors, officers and former officers of trusteesof various Company sponsored superannuationschemes in Australia. Under the relevant Deedsof Indemnity, the Company must indemnify eachindemnified person if the assets of the relevantfund are insufficient to cover any loss, damage,liability or cost incurred by the indemnifiedperson in connection with the fund, being loss,damage, liability or costs for which theindemnified person would have been entitled tobe indemnified out of the assets of the fund inaccordance with the trust deed and theSuperannuation Industry (Supervision) Act1993. This indemnity survives the terminationof the fund. Some of the indemnified personsare or were directors or executive officers ofthe Company.
The Company has also indemnified certainemployees of the Company, being trustees andadministrators of a trust which is a subsidiaryentity, from and against any loss, damage,liability, tax, penalty, expense or claim of anykind or nature arising out of or in connectionwith the creation, operation or dissolution of thetrust, where they are acting in good faith and ina manner that they reasonably believed to bewithin the scope of the authority conferred bythe trust.
Except for the above, neither the Company norany related body corporate of the Company hasindemnified or made an agreement to indemnifyany person who is or has been an officer orauditor of the Company or of a related bodycorporate.
During the financial year, and again sincethe end of the financial year, the Companyhas paid a premium for an insurance policy forthe benefit of the directors, secretaries, andexecutive officers of the Company, and directors,secretaries and executive officers of relatedbodies corporate of the Company. In accordancewith common commercial practice, theinsurance policy prohibits disclosure of thenature of the liability insured against and theamount of the premium.
Signed in accordance with a resolution of thedirectors.
Charles GoodeDirector
John McFarlaneChief Executive Officer
7 November 2003
52

53
Australia and New Zealand Banking Group Limited and Controlled EntitiesConsolidated Statement of Financial Performancefor the year ended 30 September 2003
Consolidated2003 2002 2001
$m $m $m
Total income 13,023 12,007 12,824
Interest income 10,215 9,037 10,251Interest expense (5,904) (5,019) (6,418)
Net interest income 4,311 4,018 3,833Proceeds, net of costs, on disposal of investments – 566 –Carrying amount of assets given up – (392) –
Net profit on disposal of investments – 174 –Other operating income 2,702 2,765 2,598Share of joint venture: profit from INGA joint venture 55 2 –Share of associates profit (net of writeoffs) 51 29 (25)
Operating income 7,119 6,988 6,406Operating expenses (3,228) (2,905) (3,092)
Profit before debt provision 3,891 4,083 3,314Provision for doubtful debts (614) (860) (531)
Profit before income tax 3,277 3,223 2,783
Income tax expense (926) (898) (911)
Profit after income tax 2,351 2,325 1,872Net profit attributable to outside equity interests (3) (3) (2)
Net profit attributable to shareholders of the Company 2,348 2,322 1,870
Currency translation adjustments, net of hedges after tax (356) (98) 197
Total adjustments attributable to shareholders of the Company recognised directly in equity (356) (98) 197
Total changes in equity other than those resulting from transactions with shareholders as owners 1,992 2,224 2,067
Earnings per ordinary share (cents)Basic 148.3 147.3 117.4Diluted 147.9 146.6 117.0
Dividend per ordinary share (cents) 95 85 73
Net tangible assets per ordinary share ($) 7.49 6.58 5.96
The Notes appearing on pages 56 to 59 and the discussion and analysis appearing on pages 2 to 3 and 8 to 11 form an integral part of these financial statements

Australia and New Zealand Banking Group Limited and Controlled EntitiesConsolidated Statement of Financial Positionas at 30 September 2003
Consolidated2003 2002
Note $m $m
AssetsLiquid assets 6,592 7,410Due from other financial institutions 2,427 3,815Trading securities 4,213 5,873Investment securities 4,767 3,609Net loans and advances 149,465 132,060Customers’ liabilities for acceptances 13,178 13,796Regulatory deposits 101 178Shares in associates and joint venture entities 1,814 1,692Deferred tax assets 1,165 1,218Goodwill1 160 180Other assets 10,224 11,810Premises and equipment 1,485 1,464
Total assets 195,591 183,105
LiabilitiesDue to other financial institutions 6,467 10,860Deposits and other borrowings 124,494 113,259Liability for acceptances 13,178 13,796Income tax liabilities 1,083 1,340Payables and other liabilities 13,611 12,630Provisions 769 1,602Bonds and notes 16,572 14,708Loan capital 5,630 3,445
Total liabilities 181,804 171,640
Net assets 13,787 11,465
Shareholders’ equityOrdinary share capital 4,175 3,939Preference share capital 3 2,212 1,375Reserves 180 534Retained profits 7,203 5,600
Share capital and reserves attributable to shareholders of the Company 13,770 11,448Outside equity interests 17 17
Total shareholders’ equity 13,787 11,465
Contingent liabilities and contingent asset 5
The Notes appearing on pages 56 to 59 and the discussion and analysis appearing on pages 2 to 3 and 8 to 11 form an integral part of these financial statements1 Excludes notional goodwill of $821 million (September 2002: $865 million) included in the net carrying value of ING Australia Limited
54

55
Australia and New Zealand Banking Group Limited and Controlled EntitiesConsolidated Statement of Cash Flowsfor the year ended 30 September 2003
Consolidated2003 2002 2001
$m $m $m
Inflows (Outflows)
Cash flows from operating activitiesInterest received 10,887 10,148 11,054Dividends received 7 3 75Fees and other income received 2,908 2,919 2,783Interest paid (5,724) (5,367) (6,703)Personnel expenses paid (1,848) (1,900) (1,827)Premises expenses paid (279) (268) (253)Other operating expenses paid (1,952) (1,893) (1,775)Income taxes paid (1,312) (853) (823)Goods and services tax (paid) received 1 (28) (53)Net (increase) decrease in trading securities 1,669 (1,030) (629)
Net cash provided by operating activities 4,357 1,731 1,849
Cash flows from investing activitiesNet decrease (increase)
Liquid assets – greater than three months 1,113 (442) 983Due from other financial institutions (44) 554 909Regulatory deposits 52 37 (27)Loans and advances (19,944) (9,441) (4,829)Shares in controlled entities and associates (2) (1) (36)
Investment securitiesPurchases (3,871) (2,851) (4,005)Proceeds from sale or maturity 2,445 2,436 3,630
Controlled entities, associates and joint venture entitiesPurchased (net of cash acquired) – (1,050) (36)
Premises and equipmentPurchases (368) (385) (452)Proceeds from sale 51 101 127
Recovery from NHB litigation – 248 –Other 1,663 201 (454)
Net cash (used in) investing activities (18,905) (10,593) (4,190)
Cash flows from financing activitiesNet (decrease) increase
Due to other financial institutions (2,946) (1,211) (826)Deposits and other borrowings 13,995 9,152 890Payables and other liabilities 1,000 362 581
Bonds and notesIssue proceeds 8,255 4,537 7,542Redemptions (4,095) (3,519) (2,878)
Loan capitalIssue proceeds 3,380 759 –Redemptions (437) (589) (244)
Decrease (increase) in outside equity interests (1) 1 (1)Dividends paid (1,322) (1,178) (1,028)Share capital issues (ordinary capital) 120 112 114StEPS preference share issue 1,000 – –StEPS issue costs (13) – –Share buyback – – (495)
Net cash provided by financing activities 18,936 8,426 3,655
Net cash provided by operating activities 4,357 1,731 1,849Net cash (used in) investing activities (18,905) (10,593) (4,190)Net cash provided by financing activities 18,936 8,426 3,655
Net increase (decrease) in cash and cash equivalents 4,388 (436) 1,314Cash and cash equivalents at beginning of year 7,925 9,071 6,462Foreign currency translation on opening balances (4,998) (710) 1,295
Cash and cash equivalents at end of year 7,315 7,925 9,071
The Notes appearing on pages 56 to 59 and the discussion and analysis appearing on pages 2 to 3 and 8 to 11 form an integral part of these financial statements
Notes to the Concise FinancialStatements
1: Basis of preparation of concise financial report
This concise financial report has been derivedfrom the Group’s 2003 Financial Report whichcomplies with the Corporations Act 2001,Accounting Standards, Urgent Issues GroupConsensus Views and other authoritativepronouncements of the Australian AccountingStandards Board. A full description of theaccounting policies adopted by the Group isprovided in the 2003 Financial Report. Theaccounting policies are consistent with those of the previous financial year except for thefollowing changes in accounting policies:
> AASB 1044, Provisions, Contingent Liabilitiesand Contingent Assets became effective for theGroup from 1 October 2002. Under the newStandard, provisions for dividend cannotbe booked unless dividends are declared,determined or publicly recommended on orbefore balance date. Accordingly the finaldividend applicable to the current reportingperiod has not been booked in this report.However, dividends declared after balancedate still need to be disclosed in the Notes. Theadoption of AASB 1044 results in an increasein Shareholder’s Equity of $777 million. TheGroup will continue its current practice ofmaking a public announcement of the dividendafter balance date. Dividend information for thecurrent period is provided in Note 4, Dividends.
> AASB 1012, Foreign Currency StandardTranslation became effective for the Group from1 October 2002. Under this revised Standard,foreign denominated equity must be reportedusing the spot rate applicable at the date ofissue and must not be retranslated using thespot rate at the end of each reporting period.The Group has retranslated its US preferenceshare capital at historical spot rates. As thetranslation adjustment is reported in the foreigncurrency translation reserve the impact of thesechanges are neutral on equity.
56
2: Critical accounting policies
The Group has identified the following criticalaccounting policies:
> Economic loss provisioning;
> Specific provisioning;
> Deferred acquisition costs, software assets anddeferred income;
> Derivatives and hedging;
> Special purpose and off-balance sheet vehicles;and
> Valuation of investment in ING Australia Limited.
Details of the critical accounting policies arecontained within the ANZ results announcementreleased on 24 October 2003 and in the 2003Financial Report. The results announcement canbe obtained from www.anz.com
3: Significant events this financial year
ANZ Stapled Exchangeable Preferred Securities(ANZ StEPS)On 23 September 2003, the Company issued 10 million stapled securities, raising $1 billiondollars less issue costs of $13 million. ANZStEPS comprise two fully paid securities – aninterest paying unsecured note (issued by ANZHolding (New Zealand) Limited, a wholly ownedsubsidiary of ANZ) stapled to a preference shareissued by ANZ. Distributions on ANZ StEPS arenon-cumulative and are payable quarterly inarrears based upon a floating distribution rateequal to the 90 day bank bill rate plus a margin.At each payment date the 90 day bank bill rateis reset for the next quarter. Distributions aresubject to certain payment tests and are payableon 15 March, June, September and December ofeach year. Dividends are not payable on thepreference share while it is stapled to the note.The first reset date is 15 September 2008. Ateach reset date ANZ may change certain terms(subject to certain restrictions). Holders of StEPScan require exchange of the stapled securitieson any reset date, or earlier if certain specifiedevents occur. On exchange, a holder will receive(at ANZ’s discretion) either $100 cash for eachANZ StEPS or a number of ordinary shares inANZ. In certain circumstances, ANZ may alsorequire exchange outside the reset date. On awinding up, ANZ StEPS preference sharecomponent ranks ahead of ordinaryshareholders. Holders of ANZ StEPS cannot voteat general meetings, except in limitedcircumstances.
Australian Tax Office (ATO) ResolutionDuring the years 1996–2002 ANZ was involvedin securities lending, equity swaps, and othersimilar kinds of transactions in the normalcourse of its business of banking. The ATO hadbeen reviewing these transactions for sometime. On 21 February 2003, a settlement wasreached between the ATO and ANZ whichinvolved the payment of $262 million to theATO. The amount was met from ANZ’s existingtax provisions.
57
4: Dividends
Ordinary Dividends2003 2002 2001
$m $m $m
Interim dividend 666 583 491Final dividend 7771 692 595Bonus option plan adjustment (25) (23) (24)
Dividends on ordinary shares 1,418 1,252 1,062
1 Not provided for. Refer Note 1
A fully franked final dividend of 51 cents, is proposed to be paid on each fully paid ordinary share on 19 December 2003 (2002: final dividend of 46 cents, paid13 December 2002, fully franked; 2001: final dividend of 40 cents, paid 14 December 2001, fully franked). The 2002 interim dividend of 44 cents, paid 1 July2003, was fully franked (2002: interim dividend of 39 cents, paid 1 July 2002, fully franked; 2001: interim dividend of 33 cents, paid 2 July 2001, fully franked).
The tax rate applicable to the franking credits attached to the interim dividend and to be attached to the proposed final dividend is 30% (2002: 30%, 2001: 30%).
Preference Dividends2003 2002 2001
$m $m $m
Dividends on preference shares 102 117 119
In 1998 the Company issued 124,032,000 preference shares, raising USD 775 million via Trust Securities issues. The Trust Securities carry an entitlement to adistribution of 8% (on USD 400 million) and 8.08% (on USD 375 million). The amounts are payable quarterly in arrears. Payment dates are the fifteenth days ofJanuary, April, July and October in each year.
Dividend Franking AccountThe amount of franking credits available to the Company for the subsequent financial year is nil (2002 and 2001: nil), after adjusting for franking credits that willarise from the payment of tax on Australian profits for the 2003 financial year, less franking credits which will be utilised in franking the proposed final dividendand franking credits that may not be accessible by the Company at present.
5: Contingent Liabilities and Contingent Asset
Contingent Liabilities
There are outstanding court proceedings, claims and possible claims against the Group, the aggregate amount of which cannot readily be quantified.
ANZ in Australia is being audited by the Australian Taxation Office (ATO) as part of normal ATO procedures. The Group has received various assessments that arebeing disputed and is likely to receive further assessments. Based on external advice, ANZ has assessed the likely progress of these issues, and believes itholds appropriate provisions.
ANZ in New Zealand is being audited by local revenue authorities as part of normal revenue authority procedures. No tax assessments have been issued.
Further details regarding Group contingent liabilities are contained in the 2003 Financial Report.
Contingent Asset
On 14 October 2003 ANZ issued proceedings in the Victorian Supreme Court against its captive insurance company ANZcover Insurance Pty Ltd regarding a$130 million insurance claim. This claim is in relation to the loss on settlement of its former subsidiary ANZ Grindlays Bank Limited’s 1992 dispute with India’sNational Housing Bank (NHB). ANZcover is an authorised general insurer restricted to insuring the interests of ANZ and its subsidiaries. ANZcover in turnpurchases reinsurance from global reinsurers, primarily in the London reinsurance market. The claim against ANZcover is fully reinsured, and therefore ANZcoverhas no retained exposure to the claim.
The January 2002 settlement of the NHB litigation saw Grindlays recover Rupees 6.20 billion (AUD 248 million at 19 January 2002 rates) of the disputed moniesthat Grindlays Bank had lodged with the Court, which by that time totalled Rupees 16.45 billion (AUD 661 million at 19 January 2002 rates), including interest,with NHB receiving the balance. ANZ in turn received a payment of USD 124 million from Standard Chartered Bank under the terms of the Indian Indemnity(refer Note 48 in the 2003 Financial Report). The claim of $130 million is for the balance of the limit of indemnity under ANZcover’s reinsurance arrangementsfor the 1991-92 policy year.

6: Segment Analysis
During the year ended 30 September 2003, the Group managed its activities along the following lines of business:
Personal Banking Australia, ING Australia, Institutional Financial Services, Corporate, New Zealand Banking, Mortgages, Consumer Finance, Esanda and UDC,Asia Pacific and other. A description of each of the operating business segments, including the types of products and services the segments provide tocustomers, is detailed in the 2003 Financial Report.
As the composition of segments has changed over time, September 2002 comparatives have been adjusted to be consistent with the 2003 segment definitionsas detailed in the 2003 Financial Report. Comparatives for the year ended 30 September 2001 have not been provided as data could not reasonably bedisaggregated into the changed segments.
Business Segment Analysis1, 2
Personal Institutional NewBanking ING Financial Zealand Consumer Esanda Asia Consolidated
Consolidated Australia Australia Services Corporate Banking Mortgages Finance and UDC Pacific Other3 Total30 September 2003 $m $m $m $m $m $m $m $m $m $m $m
External interest income 359 – 2,146 723 299 4,397 695 1,005 137 454 10,215External interest expense (861) (16) (2,074) (396) (475) (197) – (512) (129) (1,244) (5,904)Net intersegment interest 1,353 – 629 160 487 (3,425) (246) (143) 112 1,073 –
Net interest income 851 (16) 701 487 311 775 449 350 120 283 4,311Other external operating income 378 46 1,196 209 181 90 357 86 189 76 2,808Net intersegment income 389 – (25) (43) 46 (267) (93) (7) – – –
Operating income 1,618 30 1,872 653 538 598 713 429 309 359 7,119
Other external expenses (835) 2 (547) (178) (222) (140) (260) (157) (97) (794) (3,228)Net intersegment expenses (213) (2) (121) (41) (92) (39) (87) (25) (34) 654 –
Operating expenses (1,048) – (668) (219) (314) (179) (347) (182) (131) (140) (3,228)
Profit before debt provision 570 30 1,204 434 224 419 366 247 178 219 3,891Doubtful debt provision (27) – (165) (48) (13) (31) (152) (63) (10) (105) (614)Income tax and outside
equity interests (159) 8 (267) (116) (70) (118) (70) (57) (37) (43) (929)
Net profit after income tax 384 38 772 270 141 270 144 127 131 71 2,348
Total external assets 6,696 1,736 56,529 16,085 4,225 77,586 6,135 13,460 1,949 11,190 195,591
Total external liabilities 33,078 403 47,439 17,950 11,833 4,219 343 10,795 4,850 50,894 181,804
1 Results are equity standardised2 Intersegment transfers are accounted for and determined on an arm’s length or cost recovery basis3 Includes Treasury, Operations, Technology and Shared Services, Corporate Centre, Risk and Finance
Business Segment Analysis1, 2
Personal Institutional NewBanking ING Financial Zealand Consumer Esanda Asia Consolidated
Consolidated Australia Australia3 Services Corporate Banking Mortgages Finance and UDC Pacific Other4,5 Total30 September 2002 $m $m $m $m $m $m $m $m $m $m $m
External interest income 360 (16) 2,029 630 250 3,671 598 967 136 412 9,037External interest expense (559) (14) (1,968) (318) (397) (159) – (472) (124) (1,008) (5,019)Net intersegment interest 989 25 653 136 424 (2,827) (206) (157) 110 853 –
Net interest income 790 (5) 714 448 277 685 392 338 122 257 4,018Other external operating income 368 158 1,118 197 167 89 394 69 145 265 2,970Net intersegment income 399 (40) (28) (41) 46 (233) (92) (8) – (3) –
Operating income 1,557 113 1,804 604 490 541 694 399 267 519 6,988
Other external expenses (812) (62) (568) (170) (191) (120) (234) (151) (95) (502) (2,905)Net intersegment expenses (207) 19 (114) (42) (90) (40) (76) (29) (29) 608 –
Operating expenses (1,019) (43) (682) (212) (281) (160) (310) (180) (124) 106 (2,905)
Profit before debt provision 538 70 1,122 392 209 381 384 219 143 625 4,083Doubtful debt provision (24) – (173) (46) (13) (28) (161) (69) (10) (336) (860)Income tax and outside
equity interests (154) (27) (234) (104) (65) (106) (73) (47) (35) (56) (901)
Net profit after income tax 360 43 715 242 131 247 150 103 98 233 2,322
Total external assets 5,832 1,638 59,155 13,538 3,797 64,826 5,551 12,410 1,932 14,426 183,105
Total external liabilities 30,076 398 50,464 15,699 11,108 3,551 249 9,704 5,148 45,243 171,640
1 Results are equity standardised2 Intersegment transfers are accounted for and determined on an arm’s length or cost recovery basis3 Includes 7 months results for the businesses sold to ING Australia on 1 May 20024 Includes significant transactions during the year ended 30 September 2002, being the sale of business to ING Australia, the NHB recovery, and the special general provision for doubtful debts5 Includes Treasury, Operations, Technology and Shared Services, Corporate Centre, Risk and Finance
58

59
7: Capital Management
The Group’s total capital adequacy ratio has increased to 11.1% (2002: 9.5%). The Tier 2 ratio has increased to 4.0% (2002: 2.8%). There was a small reduction in the Tier 1 ratio to 7.7% (2002: 7.9%).
Our principal focus going forward is Adjusted Common Equity, defined as Tier 1 capital, less preference shares at current exchange rates and deductions fromtotal capital, (including investment in funds management subsidiaries and the ING joint venture). Adjusted Common Equity remained unchanged at 5.7% of riskweighted assets, (2002: 5.7%).
8: Equity Instruments Issued to Employees
Under existing Australian Accounting Standards, equity instruments issued to employees are not required to be expensed. The impact of expensing options1,and shares issued under the $1,000 employee share plan, has been calculated and is disclosed below.
Consolidated2003 2002
$m $m
Net profit attributable to shareholders of the Company 2,348 2,322Expenses attributable to:
– Options issued to Management Board1 (8) (7)– Options issued to general management1 (24) (19)– Shares issued under $1,000 employee share plan (18) (18)
Total 2,298 2,278
1 Based on fair values estimated at grant date determined in accordance with the fair value measurement provisions of Accounting Exposure Draft ED108. Value of options amortised on a straight line basis overthe vesting period
9: Events Since the End of the Financial Year
The National Bank of New Zealand (NBNZ)
On 24 October 2003, the Company announced the acquisition of NBNZ from Lloyds TSB.
The purchase price was approximately GBP 2,043.8 million ($4,915 million at exchange rates on 23 October 2003) excluding a dividend to Lloyds TSB of NZD575 million ($498 million) from NBNZ's retained earnings and transaction costs of $25 million.
The acquisition will be funded as follows:
> A 2 for 11 renounceable rights issue at $13 per share in the Company raising $3,570 million; and
> $1,370 million in hybrid Tier 1 capital, subordinated debt, and wholesale funding.
The completion date of the acquisition is 1 December 2003.
Further matters can be obtained by reference to the ANZ Renounceable Rights Issue prospectus dated 24 October 2003.
The financial effect of this acquisition has not been recognised in these financial statements.
Trust Securities Issues (TrUEPrS)
On 6 November 2003, ANZ called for the buy-back of the ANZ Preference Shares issued as part of the trust units exchangeable for preference shares (TrUEPrS)Series 1 (September 1998 – CUSIP No.001823202) and Series 2 (November 1998 – CUSIP No.0018241010). The buy-back is for the entire issue of both series.
The buy-back date will be effective on 12 December 2003. This buy-back will also result in ANZ redeeming the TrUEPrS on the same date.
The redemption price will be US$25.00 plus an amount equal to the accrued but unpaid interest on each US$25.00 principal amount of the debt securities fromand including the Interest Payment Date immediately preceding the Exchange Date to, but excluding, the Exchange Date.
The financial effect of this transaction has not been recognised in these financial statements.

Directors’ DeclarationThe directors of Australia and New ZealandBanking Group Limited declare that in theiropinion the accompanying concise financialreport of the Consolidated Group for the yearended 30 September 2003 complies withAccounting Standard AASB 1039 ‘ConciseFinancial Reports’.
In our report on the Group’s 2003 FinancialReport we declared that:
a) the financial statements and notes comply withthe Corporations Act 2001, including:
i) complying with applicable AustralianAccounting Standards and other mandatoryprofessional reporting requirements; and
ii) giving a true and fair view of thefinancial position of the Company and of theconsolidated Group and of their performanceas represented by the results of theiroperations and their cash flows; and
b) in the directors’ opinion at the date of thisdeclaration there are reasonable grounds tobelieve that the Company and consolidatedGroup will be able to pay its debts as and whenthey become due and payable.
Signed in accordance with a resolution ofthe directors.
Charles Goode John McFarlaneDirector Chief Executive Officer
7 November 2003
60
61
Financial Highlights in Key Currencies2003 2003 2003 2003
Millions AUD USD1 GBP1 NZD1
Financial PerformanceNet income 7,119 4,360 2,721 7,930Operating expenses (3,228) (1,977) (1,234) (3,596)
Profit before tax and debt provision 3,891 2,383 1,487 4,334Provision for doubtful debts (614) (376) (235) (684)
Profit before tax 3,277 2,007 1,252 3,650Income tax expense (926) (567) (354) (1,031)Outside equity interests (3) (2) (1) (3)
Profit after tax 2,348 1,438 897 2,616
Financial PositionAssets 195,591 132,904 79,606 223,580Liabilities 181,804 123,536 73,994 207,820Shareholders’ equity2 13,787 9,368 5,612 15,760Ratios – per ordinary shareEarnings per share – basic 148.3c 90.8c 56.7c 165.2cDividends per share – declared rate 95c 58c 36c $1.06Net tangible assets per share $7.49 $5.09 $3.05 $8.56
1 USD, GBP and NZD amounts – items relating to financial performance converted at average rates for financial year 30 September 2003 and items relating to financial position at closing ratesat 30 September 2003
2 Includes outside equity interests
Exchange RatesThe exchange rates used in the translation of the results and the assets and liabilities of major overseas branches and controlled entities are:
2003 2002 2001Closing Average Closing Average Closing Average
Great British pound 0.4070 0.3822 0.3477 0.3621 0.3331 0.3627United States dollar 0.6795 0.6124 0.5441 0.5323 0.4903 0.5230New Zealand dollar 1.1431 1.1139 1.1585 1.2001 1.2127 1.2473
Independent audit report onconcise financial report to themembers of Australia and NewZealand Banking Group Limited
Scope
We have audited the concise financial reportof Australia and New Zealand Banking GroupLimited and its controlled entities for thefinancial year ended 30 September 2003,consisting of the statement of financialperformance, statement of financial position,statement of cash flows, accompanyingNotes as set out on pages 53 to 59, and theaccompanying discussion and analysis set outon pages 2 to 3 and 8 to 11 in order to expressan opinion on it to the members of theCompany. The Company’s directors areresponsible for the concise financial report.
Our audit has been conducted in accordancewith Australian Auditing Standards to providereasonable assurance whether the concisefinancial report is free of material misstatement.
We have also performed an independent auditof the full financial report of Australia and New Zealand Banking Group Limited and itscontrolled entities for the year ended 30September 2003. Our audit report on the fullfinancial report was signed on 7 November2003, and was not subject to any qualification.
Our procedures in respect of the audit ofthe concise financial report included testingthat the information in the concise financialreport is consistent with the full financial reportand examination, on a test basis, of evidencesupporting the amounts, discussion andanalysis, and other disclosures which were notdirectly derived from the full financial report.These procedures have been undertaken toform an opinion whether, in all materialrespects, the concise financial report ispresented fairly in accordance with AccountingStandard AASB 1039 ‘Concise FinancialReports’ issued in Australia.
The audit opinion expressed in this report hasbeen formed on the above basis.
Audit Opinion
In our opinion the concise financial report ofAustralia and New Zealand Banking GroupLimited and its controlled entities for the yearended 30 September 2003 complies with AASB1039 ‘Concise Financial Reports’ issued inAustralia.
KPMG Peter NashMelbourne Partner
7 November 2003

Shareholder information
Ordinary shares
At 4 November 2003 the twenty largest holders of ordinary shares held 867,859,733 ordinary shares, equal to 57.01% of the total issued ordinary capital.
Name Number of shares % Name Number of Shares %
Chase Manhattan Nominees Ltd 196,106,579 12.88 ANZEST Pty Ltd (Deferred Share Plan A/C) 7,823,861 0.51National Nominees Ltd 180,531,941 11.86 Government Superannuation Office 7,096,283 0.47Westpac Custodian Nominees Ltd 173,709,096 11.41 Westpac Financial Services Ltd 6,060,181 0.40Citicorp Nominees Pty Ltd 71,139,055 4.67 Dervat Nominees Pty Ltd 5,196,963 0.34ANZ Nominees Ltd 56,070,804 3.68 Zurich Investment Management Ltd 5,142,989 0.34RBC Global Services Australia 44,878,324 2.95 Australia Foundation Investment 4,877,049 0.32Queensland Investment Corporation 27,336,967 1.80 Company LtdAMP Life Ltd 23,067,346 1.52 Victorian Workcover Authority 4,758,334 0.31Cogent Nominees Pty Ltd 22,128,894 1.45 Commonwealth Custodial Services Ltd 4,486,242 0.29HKBA Nominees Ltd 14,241,786 0.94 ANZEST Pty Ltd (ESAP Share Plan A/C) 4,411,454 0.29PSS Board 8,795,585 0.58
867,859,733
Distribution of shareholdings
At 4 November 2003 Number of % of Number of % ofRange holders holders shares shares
1 to 1,000 shares 126,578 55.82 58,777,084 3.861,001 to 5,000 shares 79,563 35.09 178,270,867 11.715,001 to 10,000 shares 12,461 5.50 88,536,453 5.8210,001 to 100,000 shares 7,747 3.42 166,130,933 10.91Over 100,001 shares 382 0.17 1,030,359,062 67.70
Total 226,731 100.00 1,522,074,399 100.00
At 4 November 2003:> there were no entries in the Register of Substantial Shareholdings; and> the average size of holdings of ordinary shares was 6,713 (2002: 7,536) shares; and> there were 3,857 holdings (2002: 2,863 holdings), of less than a marketable parcel (less than $500) in value or 42,926 shares based on a market price of $17.49, which is less than 1% of the total holdings
of ordinary shares.
Voting rights of ordinary shares
The Constitution provides for votes to be cast:
i) on show of hands, 1 vote for each shareholder; and
ii) on a poll, 1 vote for each fully paid ordinary share.
Preference shares
Trust Securities Issues
At 4 November 2003 Hare and Co held the preference shares issued with the Trust Securities units and held 124,032,000 preference shares, being 92.5 per cent of the total issued preference capital.
Voting rights of Trust Securities Issues
A preference shareholder may not vote in normal circumstances, but may vote:
i) when a preference share dividend (or equivalent) is not paid by the prescribed quarterly payment date. This entitlement to vote ceases after full payment of fourconsecutive quarterly preference share dividends; and
ii) on proposals or resolutions that affect the rights attached to the preference shares including proposals to restructure or wind up ANZ.
62
63
ANZ Stapled Exchangeable Preferred Securities (ANZ StEPS)
At 4 November 2003, the twenty largest holders of ANZ StEPS held 4,892,789 preference shares, equal to 48.94% of ANZ StEPS and 3.65% of the total issuedpreference capital.
Name Number of shares % Name Number of Shares %
National Nominees Ltd 867,070 8.67 UCA Cash Management Fund Ltd 100,000 1.00ANZ Nominees Ltd 738,641 7.39 Austrust Ltd 95,084 0.95Chase Manhattan Nominees Ltd 661,610 6.62 Baincor Nominees Pty Ltd 75,139 0.75IOOF Investment Management Ltd 510,000 5.10 UOB Kay Hian Pte Ltd 67,500 0.68Potter Warburg Nominees Pty Ltd 398,715 3.99 Permanent Trustee Australia Ltd 64,012 0.64AMP Life Ltd 331,000 3.31 Zurich Investment Management Ltd 64,000 0.64Westpac Custodian Nominees Ltd 309,960 3.10 UBS Nominees Pty Ltd 63,000 0.63Citicorp Nominees Pty Ltd 161,424 1.61 Gordon Merchant No2 Pty Ltd 59,000 0.59RBC Global Services Australia Nominees Pty Ltd 112,970 1.13 Invia Custodian Pty Ltd 54,230 0.54Calex Nominees Pty Ltd 111,593 1.12 JTW Trading Pty Ltd 47,841 0.48
4,892,789
Distribution of ANZ StEPS holdings
At 4 November 2003 Number of % of Number of % ofRange holders holders shares shares
1 to 1,000 preference shares 9,278 93.43 2,224,079 22.241,001 to 5,000 preference shares 522 5.26 1,324,646 13.255,001 to 10,000 preference shares 63 0.63 533,879 5.3410,001 to 100,000 preference shares 58 0.58 1,714,413 17.14Over 100,001 preference shares 10 0.10 4,202,983 42.03
Total 9,931 100.00 10,000,000 100.00
At 4 November 2003: There are no holders of less than a marketable parcel (less than $500 in value or 5 units).
Voting rights of ANZ StEPS
A preference share does not entitle its holder to vote at any general meeting of ANZ except in the following circumstances:
(a) on a proposal:
(i) to reduce the share capital of ANZ;
(ii) that affects rights attached to the preference shares;
(iii) to wind up ANZ; or
(iv) for the disposal of the whole of the property, business and undertaking of ANZ;
(b) on a resolution to approve the terms of a buy-back agreement;
(c) during a period in which a dividend which has been declared as payable on a dividend payment date has not been paid in full; or
(d) during the winding-up of ANZ.
If a poll is conducted on a resolution on which a holder is entitled to a vote under this clause, the holder has one vote for each preference share held.
Employee shareholder information
At the Annual General Meeting in January 1994, shareholders approved an aggregate limit of 7% of all classes of shares and options, which remain subject tothe rules of a relevant incentive plan, being held by employees and directors.
At 30 September 2003 participants held 2.76% (2002: 2.62%) of the issued shares and options of ANZ under the following incentive plans:
> ANZ Employee Share Acquisition Plan;
> ANZ Employee Share Save Scheme;
> ANZ Share Option Plan;
> ANZ Share Purchase Scheme; and
> ANZ Directors’ Share Plan.
As a shareholder and reader of ANZ’s 2003 Annual Report, your opinion is very important to us. Please take a minute to fill in this survey form and have your say on the Report. Your feedback will help shape the way we report to you next year.
1 Which of the following applies to your reading of the 2003 ANZ Annual Report? (Please tick)
Browsed through it Read some of it Read all of it
2 Using a 7 point scale, where 1 is poor and 7 is excellent, please indicate the extent to which you agree with the following statements (Please circle)
Strongly disagree Strongly agree
The overall look of the Report made me want to read it 1 2 3 4 5 6 7
The Report included the information I wanted to read as a shareholder 1 2 3 4 5 6 7
It was easy to find the information I wanted to read 1 2 3 4 5 6 7
The information was well written and easy to understand 1 2 3 4 5 6 7
The Report was interesting to read 1 2 3 4 5 6 7
3 When reading the 2003 ANZ Annual Report, how important to you are the following sections, on a 7 point scale, where 1 is poor and 7 is excellent? (Please circle)
Not important Extremely important
Investor Snapshot 1 2 3 4 5 6 7
Chairman’s Report 1 2 3 4 5 6 7
Chief Executive Officer’s Report 1 2 3 4 5 6 7
Chief Financial Officer’s Review 1 2 3 4 5 6 7
Risk Management 1 2 3 4 5 6 7
A View from the CEO on Creating Sustainable Businesses 1 2 3 4 5 6 7
The National Bank of New Zealand 1 2 3 4 5 6 7
People 1 2 3 4 5 6 7
Personal and Rural Customers 1 2 3 4 5 6 7
Business Banking 1 2 3 4 5 6 7
Systems 1 2 3 4 5 6 7
Community and Environment 1 2 3 4 5 6 7
Leadership 1 2 3 4 5 6 7
Business Profiles 1 2 3 4 5 6 7
Board of Directors 1 2 3 4 5 6 7
Corporate Governance and the Board 1 2 3 4 5 6 7
Compensation 1 2 3 4 5 6 7
Guide to the Concise Financial Report 1 2 3 4 5 6 7
Concise Financial Report 1 2 3 4 5 6 7
4 Do you have any specific comments about this Annual Report or suggestions for next year?
5 Annual Report election request (Please tick)
Please continue to send me a printed Annual Report
Please don’t send me an Annual Report
Please don’t send me an Annual Report but email me when it is available on ANZ’s website
Name SRN/HIN
Email Address
Yours faithfully
Simon FraserHead of Investor Relations Please complete the above form, remove from document,
and return with your Proxy Form in the envelope provided.
Shareholder Feedback Form
Dear Shareholder

Information for Shareholders
DividendsThe final dividend of 51 cents per share, fullyfranked, will be paid on 19 December 2003. A Dividend Reinvestment Plan (DRP) and BonusOption Plan (BOP) are available to shareholders.The plans are detailed in a plan booklet called‘Shareholder Alternatives’, copies of which areavailable from the ANZ Share Registry at theaddresses shown below.
ANZ has reviewed the way that it pays its dividendsto reduce costs, minimise the potential for fraudand enhance convenience for shareholders.Effective from the next interim dividend paymentdue in July 2004, payments to all shareholders inAustralia, New Zealand and the UK (other than tothose who have elected to participate in either theDRP or the BOP), will only be made by direct creditto a nominated bank account. A significant majorityof shareholders already receive their dividends bythis method. Shareholders who are currently paidtheir dividend by cheque will receive a form withtheir dividend advice from the ANZ Share Registryfor nomination of a bank account for futuredividend payments.
Stock Exchange ListingsThe Group’s ordinary shares are listed on theAustralian Stock Exchange and the New ZealandStock Exchange. The Capital Securities offered in1993 and the Preference Shares issued in 1998 are listed on the New York Stock Exchange. Thesubordinated bonds issued by Australia and NewZealand Banking Group (New Zealand) Limited in2002 are listed on the New Zealand Stock Exchange.
ANZ StEPSOn 24 September 2003, 10 million ANZ StapledExchangeable Preferred Securities (ANZ StEPS)were issued at an issue price of $100.00 each.Each ANZ StEPS is a stapled security comprisinga Preference Share in Australia and New ZealandBanking Group Limited and an unsecured Note issued by ANZ Holdings (New Zealand)Limited. ANZ StEPS are quoted on the AustralianStock Exchange.
American Depositary ReceiptsThe Bank of New York sponsors an AmericanDepositary Receipt (ADR) program in the UnitedStates of America and ADRs are listed on the NewYork Stock Exchange. ADR holders should dealdirectly with the Bank of New York, New York,telephone (+212) 815 2276, fax (+212) 571 3050on all matters relating to their ADR holdings.
2003 Financial ReportA copy of the Group’s 2003 Financial Report,including the independent Auditors’ Report, isavailable to all shareholders, and will be sent toshareholders without charge upon request. TheFinancial Report can be requested by telephone(Australia 1800 11 33 99, Overseas +613 96155989), by email at [email protected] orviewed directly on the Internet at www.anz.com
Removal from Mailing ListShareholders who do not wish to receive a copyof the Annual Report must advise the Share Registryin writing.
Change of AddressShareholders who have changed their address willneed to advise the Share Registry in writing, quotingtheir shareholder number, name and companyas applicable.
Credit Ratings
Short Term
Moody’s Investors Service P-1
Standard & Poor’s Rating Group A1+
Long Term
Moody’s Investors Service Aa3 (outlook stable)
Standard & Poor’s Rating Group AA- (outlook stable)
Handy ContactsANZRegistered OfficeLevel 6100 Queen StreetMelbourne VIC 3000AustraliaTelephone +613 9273 6141Facsimile +613 9273 6142Company Secretary: Tim L’Estrange
Investor RelationsLevel 22100 Queen StreetMelbourne VIC 3000AustraliaTelephone +613 9273 6466Facsimile +613 9273 [email protected]
Share RegistryAustraliaGPO Box 2975Melbourne VIC 3000AustraliaTelephone 1800 11 33 99 / +613 9615 5989Facsimile +613 9611 [email protected]
New ZealandPrivate Bag 92119Auckland 1020New ZealandTelephone 0800 174 007 or +649 488 8777Facsimile +649 488 8787
United KingdomPO Box 82The PavilionsBridgewater RoadBristol BS99 7NHTelephone +44 870 702 0000Facsimile +44 870 703 6101
Important Dates for ShareholdersDate Event19 December 2003 Annual General Meeting
(Brisbane) 19 December 2003 Final Dividend Payment27 April 2004* Interim Result Announced1 July 2004* Interim Dividend Payment26 October 2004* Annual Result Announced17 December 2004* Annual General Meeting17 December 2004* Final Dividend Payment
*tentative dates

Australia and New ZealandBanking Group LimitedABN 11 005 357 522
www.anz.com