2000 activities of the central great lakes binational lake ... · central great lakes bi-national...
TRANSCRIPT

Presented at: Great Lakes Fishery Commission Lake Huron Committee Meeting, Duluth, MN, March 18-19, 2002 Lake Erie Committee Meeting, Buffalo, NY, March 27-28, 2002 Provisional data, do not site without authors permission.
i
2000 Activities of the Central Great Lakes Binational Lake Sturgeon Group
Editors: Tracy D. Hill and Jerry R. McClain US Fish and Wildlife Service Alpena Fishery Resources Office Federal Building Room 204 145 Water St. Alpena, MI 49707 (989) 356-5102, (989) 356-4651 Fax [email protected]
Contributors
Nathan Caswell (St. Clair Waterway) Central Michigan University College of Science and Technology 230 Brooks Hall Mt. Pleasant, MI 48859 (989) 774-1627, (989) 774-3462 Fax Email: [email protected] David Davies (Lake Erie) Lake Erie Unit Ohio Department of Natural Resources 305 East Shoreline Drive Sandusky, OH 44870 (419) 625-8062, (419) 625-6272 Fax Email: [email protected] Tom Hughes (Niagara River) New York State Department of Environmental Conservation Region 1- Bureau of Fisheries SUNY Building 40 Stony Brook, NY 11790-2356 (631) 444-0280, (631) 444-0272 Email: [email protected] Christopher Lowie (Niagara River) US Fish and Wildlife Service Branch of Fish and Wildlife Management Assistance 4401 N. Fairfax Drive, Room 840k Arlington, VA 22203 (703) 358-2273, (703) 358-2044 Fax Email: [email protected]
Lloyd C Mohr (Lake Huron) Ontario Ministry of Natural Resources Lake Huron Management Unit 1450 Seventh Avenue East Owen Sound, ONT N4k 2Z1 (519) 371-5669, (519) 371-5844 Fax Email: [email protected] Doug Peterson (St. Clair Waterway) University of Georgia Warnell School of Forest Resources Athens, GA 30602 (706) 542-2944, (706) 542-8356 Fax [email protected] Michael V. Thomas (St. Clair Waterway) Michigan Department of Natural Resources Mt. Clemens Fisheries Research Station 33135 South River Road Mt. Clemens, MI 48045 (586) 465-4771, (586) 465-7504 Fax e-mail: [email protected] John Weisser (Lake Huron) US Fish & Wildlife Service Marquette Biological Station 1924 Industrial Parkway Marquette, MI 49855-1699 (906) 226-1213, (906) 226-3632 Fax email: [email protected] Emily C. Zollweg (Lake Huron) US Fish and Wildlife Service Alpena Fishery Resources Office Federal Building Room 204 145 Water St. Alpena, MI 49707 (989) 356-5102, (989) 356-4651 Fax Email: [email protected]

ii
Contents Contributors ................................................................................................... i Preface........................................................................................................... iii Lake Huron.................................................................................................... 1
Ontario Ministry of Natural Resources Lake Huron Management Unit..................................................... 1 U.S. Fish and Wildlife Service Alpena Fishery Resources Office ............................................................. 7 U.S. Fish and Wildlife Service Marquette Biological Station .................................................................. 12
St. Clair Waterway ..................................................................................... 14 Michigan Department of Natural Resources Mt. Clemens Fisheries Research Station............................ 14 Central Michigan University College of Science and Technology........................................................... 17
Lake Erie...................................................................................................... 24 Ohio Division of Wildlife Sandusky Fisheries Research Station ............................................................. 24
Niagara River .............................................................................................. 25 U.S. Fish and Wildlife Service Lower Great Lakes Fishery Resources Office ........................................ 25

iii
Preface In 1995, resource personnel from federal, state, and provincial agencies agreed to a collaborative effort to better define the population status of lake sturgeon in Lakes Huron and Erie and their connecting waterways. These efforts resulted in the creation of the Central Great Lakes Bi-National Lake Sturgeon Group (CGLBLSG). The U.S. Fish & Wildlife Service Alpena FRO has agreed to compile an annual report summarizing activities of agencies and organizations participating in the CGLBLSG. Following is a summary of 2000 activities with planned activities for 2001 and 2002. This report details information on 1,028 lake sturgeon encountered during the 2000 field season. The purpose of this report is to inform all interested parties of the ongoing lake sturgeon efforts in Lakes Huron and Erie and their connecting waterways. Previous years’ reports for this group can be found on the Alpena FRO home page (midwest.fws.gov/alpena/index.htm) under station reports
The increased level of cooperation has led to several notable results. First, with increased participation by commercial fishers, both Canadian and American, information recorded from lake sturgeon by-catch and harvest has been used to describe the life history and relative health and sustainability of lake sturgeon stocks throughout the central Great Lakes basins. Investigations are now underway to identify and quantify current spawning use at historic spawning areas, areas identified through new research, and areas identified by sport harvest reports. Using emerging technologies we are investigating habitat use and identifying critical habitat that will be essential for the recovery and sustainability of this species. Intensive research efforts in the St. Clair system have resulted in a limited sport fishery and a population estimate for that stock. Cooperation between USFWS Biological Stations and the MIDNR resulted in treatment of 5 streams in Michigan containing both sea lamprey and lake sturgeon, with no lake sturgeon mortality in 2000. In the years ahead, investigations are planned to identify juvenile lake sturgeon habitat and assess status of this life stage, genetic data will be used to identify spawning stocks and level of mixing throughout the central Great Lakes, a tributary inventory is planned to locate more spawning sites and populations, and contaminants investigations will continue.

1
Lake Huron
Ontario Ministry of Natural Resources Lake Huron Management Unit Contact: Lloyd C Mohr Phone: (519) 371-5669 Fax: (519) 371-5844 E-mail: [email protected]
Lake Sturgeon Monitoring in Ontario Waters of Lake Huron – 2000 Update Assessment of lake sturgeon populations in Ontario waters of Lake Huron continued during the 2000 open water season. Assessment relied heavily upon the cooperation of commercial fisheries in the North Channel, southern Lake Huron, and for the second year in southern Georgian Bay. The Mississaugi First Nation carried out additional assessment. The 2000 assessment program was similar to that conducted over the past 6 years in Ontario waters, concentrating upon the commercially fished stocks in these waters. As in the past, fishing effort in most instances is targeted at species other than lake sturgeon and therefore biases any harvest rate/fish abundance estimations. The exceptions are a limited amount of targeted effort in the North Channel in early April and May as well as the sampling which occurred in the Mississaugi River. The latter targets a spawning migration and population in that particular river. In 2000, a total of 648 lake sturgeon were observed and sampled. This is the largest number of fish observed since the beginning of this assessment program in 1995. The majority of these (65%) were captured in the extreme southern region of the Main Basin; this is the usual pattern of capture seen in previous years. Of the 648 fish sampled, 365 were tagged for the first time and released. An additional 39 fish were recaptured which had been previously tagged. Five of these recaptured fish had been tagged originally in Lake St. Clair, ten had been tagged in Saginaw Bay, Michigan, while the remaining had been tagged in Ontario waters of Lake Huron.

2
Figure 1. Map showing sampling locations for lake sturgeon in Ontario waters of Lake Huron, 2000. Time to recapture varied across the lake. Two fish were recaptured which had been previously tagged in 1995, both in the south end of the lake. In total, 20 fish were recaptured which had been tagged more than 3 years ago, while only one fish tagged in 2000 was recaptured within the same year. Fish from Ontario waters were also caught in other locations, including the Detroit River, the St. Clair River, and Saginaw Bay in 2000. These fish had not been seen for anywhere from one to three years since originally being tagged. Recaptures in the North Channel were fewer in 2000 than in previous years. All recaptured fish had been originally tagged in the North Channel. One fish from the Mississaugi River was recaptured in the North Channel, while another Mississaugi fish was recaptured in the St. Mary’s River. Lake sturgeon continue to show significant movement patterns, especially in the southern Main Basin and adjacent bays and rivers. Work continues to evaluate the importance of the southern main basin as a potential feeding area and the adjoining St. Clair and Detroit Rivers as spawning and staging areas. A wide range of ages and sizes of fish were once again sampled in 2000 (Table 1). The oldest fish sampled was a 42 year old lake sturgeon sampled in the Mississaugi River during the spring spawning run. However, it was not possible to determine the sex of this fish, as it did not discharge any reproductive material when sampled. A number of 2 year old fish were observed in 2000, both in the North Channel and in southern Lake Huron while age 3 fish were common in southern Georgian Bay. The continued presence of these very young fish leads us to assume continued recruitment in all basins of the lake.

3
Table 1. Mean size and age of lake sturgeon sampled in Lake Huron during 2000.
Main Basin
Georgian Bay
North
Channel
Mississaugi
River
LAKEWIDE
Mean Total Length (mm) 1134 800 814 1313 1067 Range (max-min) 1680-335 1220-420 1600-380 1950-1050 1950-335
Mean Round Weight (kg) 9.49 2.43 1.81 15.46 9.01 Range (max-min) 32.2-0.125 6.0-0.3 7.0-0.21 46.2-4.2 46.2-0.125
Mean Age (yr) 14.7 5.8 7.2 20.2 13.2 Range (max-min) 34-2 14-3 25-2 42-10 42-2 Number Sampled 423 27 140 58 648
The age distribution of lake sturgeon sampled in this study (Figure 2) is most likely biased by the type of gear being used and the fact that most of the fish are caught incidentally while targeting other fish species. Most of the fish caught in gillnets are caught in gear that is anywhere from 2.5 to 5.5 inches in mesh size. Larger fish would be less likely to be retained by this type of gear. The trap net incidental catch retains a larger spectrum of sizes and ages of fish and is perhaps a better indicator of fishing success. However it too is limited in terms of the location of the nets and the ability to catch extremely large fish. Regardless, a large number of age classes was represented in the 2000 samples, very similar to distributions seen in the past 5 years.
Figure 2. Age distribution of lake sturgeon captured in Ontario waters of Lake Huron in 2000.
In terms of size and growth, lake sturgeon sampled in 2000 were of similar size to those seen in previous years (Figure 3). Not surprisingly, the largest fish were seen in the Mississaugi River spawning run. The average size in southern Lake Huron has remained unchanged over the past several years with the mean size in 2000 not different from other years. In the North Channel, a larger sampling of younger, smaller fish in 2000 reduced the mean size of lake sturgeon seen. However, this is a direct result of increased monitoring of coolwater fisheries by OMNR staff
0
10
20
30
40
50
60
1 4 7 10 13 16 19 22 25 28 31 34 37 40
Age (yr)
Num
ber O
bser
ved

4
and subsequently more observations of small incidentally caught lake sturgeon in this area. The range of fish size in the North Channel has not changed over the term of this project. Based upon a legal commercial size limit (equivalent to 1.09 m), approximately 60% of the fish sampled were of legal harvestable size, although only 28% of all fish sampled were in fact harvested. Due to the limited harvest allowed, many legally harvestable sized fish were released and will contribute to future years assessment of lake sturgeon in the lake.
Figure 3. Total length of lake sturgeon sampled in Ontario waters of Lake
Huron in 2000. Lake sturgeon growth was measured both spatially and by sex. Growth patterns similar to those seen in the past were measured in 2000. Young lake sturgeon appear to grow in length faster in southern Lake Huron than in the North Channel, while conversely, large lake sturgeon appear to grow slower in length in southern Lake Huron than in the North Channel (Figure 4). This has been observed in previous years data as well. Length at age is quite uniform and very little variability was seen in the data collected in 2000. The same cannot be said however for changes in the weight of lake sturgeon throughout the lake. Once lake sturgeon reach age 24 to 25, the variability in weight increases dramatically (Figure 5). This change in variability in weight is most evident in female lake sturgeon although it also holds true for male lake sturgeon. It is suggested that this is related to the large fluctuations in weight that occur due to changes in the state of maturity of lake sturgeon and the amount of energy put into development of reproductive tissue and the subsequent loss of this weight through the reproductive act. This increase in variability is not seen in total length of lake sturgeon.
0
10
20
30
40
50
60
70
350 500 650 800 950 1100 1250 1400 1550 1700 1800+
TLEN (mm)
Num
ber O
bser
ved
Legal HarvestableSize

5
Figure 4. Mean total length at age for all lake sturgeon sampled in Lake Huron in 2000.
Figure 5. Mean round weight at age for all lake sturgeon sampled in Lake Huron in 2000. In 2000, we were able to accurately determine the sex of 168 lake sturgeon. In the non-spawning run samples, approximately 49% of all fish sexed were determined to be males. These samples are considered to be from mixed open water stocks. In contrast, the sex proportion of males in the Mississaugi River spawning run jumped to 79% in 2000. This points to the need to assess both spawning runs and mixed stocks in order to properly assess sex ratios in lake sturgeon. Age at maturation did not appear to vary between the North Channel and the Main Basin although sample sizes were limited in the North Channel. The majority of male lake sturgeon were mature by age 12 in southern Lake Huron, although 100% maturity did not occur until age 18. Females on the other hand began to mature at age 15 and not until age 22 did we observe 100% maturation. This is similar to data observed in previous years, indicating little or no change in maturation rate over the past six years in Lake Huron.
0
200
400
600
800
1000
1200
1400
1600
2 4 6 8 10 12 14 16 18 20 22 24 26 28 30 32 34
Age (yr)
TLEN
(mm
)
G B ay
M ain B
N C hannel
0
5
10
15
20
25
30
2 4 6 8 10 12 14 16 18 20 22 24 26 28 30 32 34
Age (yr)
RW
T (k
g)

6
Summary: The lake sturgeon assessment program in Ontario waters of Lake Huron continues to show increases in sample sizes, due mostly to the cooperation of the commercial fishing industry on Lake Huron. Movement information continues to be collected and examined and, as the undersized lake sturgeon have grown into the harvestable size range, we see large fish being returned to the waters instead of being harvested. The addition of the spawning run information from the Mississaugi River and the additional information collected from southern Georgian Bay have expanded the number of stocks for which information is now available in Lake Huron. Hopefully these new endeavors can be maintained. The continued recruitment into the mixed stocks gives rise to the question of where are the lake sturgeon spawning and to what degree. Future efforts need to be directed to identifying spawning locations and estimation of spawning stock size and reproductive capacity. Two areas need to be further assessed; southern Georgian Bay (the Nottawasaga River area) and southern Lake Huron (head of the St. Clair River). It is hoped that these two areas will be assessed in depth in the near future. Plans for 2001 are to increase sampling in the North Channel and in southern Georgian Bay and to maintain sampling levels in other parts of the lake. Attempts to acquire external funds will be made in order to expand the level of assessment which can be conducted. Finally, mixed stock population sizes need to be updated, incorporating new mark recapture information. All of this information is required if progress is to be made towards development of a lake wide management plan for lake sturgeon in Lake Huron.

7
U.S. Fish and Wildlife Service Alpena Fishery Resources Office Contact: Emily C. Zollweg Phone: (989) 356-5102 Fax: (989) 356-4651 E-mail: emily_zollweg@ fws.gov
2000 Lake Sturgeon Activities
Summary: A total of 40 lake sturgeon were captured by Lake Huron commercial fishers in 2000. Sturgeon were collected in trap nets, tagged and released alive. Pectoral fin ray sections were collected and used to age fish. Ages ranged from 4 to 28 years. Total number of fish tagged since this study was started in 1995 is 185. Tag recaptures continue to increase every year.
The U.S. Fish and Wildlife Service-Alpena Fishery Resources Office (FRO) began investigating the Lake Huron lake sturgeon population in 1995. The purpose for the study was to gather critical information on Lake Huron lake sturgeon necessary for determination of federal listing and the development of recovery plans. Previous year's reports for this project can be found on the Alpena FRO web page (midwest.fws.gov/Alpena/index.htm) under station reports.
Most of the lake sturgeon collected for this study came from Saginaw Bay, Lake Huron (Figure 1). Saginaw Bay is one of the largest bays in the Great Lakes. It is a shallow, well-mixed extension of the western shoreline of Lake Huron. Total area of the bay is 2,771 km2, and total water volume is 24.5 km3. Bottom substrates in Saginaw Bay range from silt to mostly cobble and rock.
Assistance from commercial fishers has been invaluable to the success of this study. Eleven commercial fishers (operating 16 boats) are providing information on incidentally captured lake sturgeon; nine of these fishers operate in Saginaw Bay (Table 1). Biological data were recorded from 40 lake sturgeon in 2000. Since 1995, a total of 185 lake sturgeon have been tagged by commercial fishers.
Fork length of lake sturgeon captured in 2000 ranged from 40 cm to 143 cm with a mean fork length of 106 cm (Table 2). Age of these fish ranged from 4 to 28 years with a mean of 13 years. Biotic parameters collected from the lake sturgeon have been standardized to assist with data exchange among other agencies involved in sturgeon status surveys.

8
Table 1. Number of lake sturgeon caught by participating commercial fishers in Lake Huron trap net fishery since 1995. Dash indicates the fisher was not participating in the program.
Fisher Year Enrolled
1995 1996 1997 1998 1999 2000 Total
Barbeaux Fishery 1996 - 1 7 0 0 0 8
Bay Port Fish Company 1995 13 7 10 8 12 3 53
Beardsley Fish Company 1997 - - 0 0 0 0 0
Cedarville Fish Company 1997 - - 1 7 9 4 21
Gauthier-Spaulding Fishery 1995 2 0 2 2 4 1 11
Kuhl Fishery 1999 - - - - 1 0 1
Lentz Fishery 1995 3 8 8 9 10 6 44
M&W Fish Company1 1995 1 3 4 4 2 14 28
Serafin Fishery 1996 - 10 17 3 4 8 42
Beers Fishery 1995 2 0 1 0 0 1 3
Whytes Fishery 1995 2 7 3 4 3 3 22
Total 23 36 53 37 45 40 2332
1Formerly Sam’s Fishery 2Not all lake sturgeon caught were measured or tagged.
Overall, the age distribution of lake sturgeon caught in 1997 through 2000 is dominated by sturgeon older than 11 years with a total of 30 year-classes represented. Lake sturgeon younger than 8 years old represent 14% of the sturgeon sampled in the trap net fishery. This may be due to poor recruitment, gear selectivity, distribution of young lake sturgeon, or it may indicate that Saginaw Bay is merely a staging area for sub-adult sturgeon. Mapping lake sturgeon locations by age lends support to the theory that Saginaw Bay is a staging area for sub-adult sturgeon (Figure 1). The majority of lake sturgeon captured in Saginaw Bay are less than 17 years old; conversely, most of the lake sturgeon caught outside of Saginaw Bay are over 16 years old.

9
#0
%[
%[
#0#0
%[%[
#0#0
#0#0
%[
%[#0
#0#0%[
#0
%[
#0#0
#0#0
#0
#0
#0%[
#0#0
#0
#0
#0
#0
#0
#0
#0
#0
#0#0
#0#0
#0#0%[%[
%[#0%[
%[
#0
#0
%[
#0
#0%[#0 %[#0 %[
#0
#0
#0
%[
#0#0
#0
%[
#0
#0
#0 #0
%[#0#0 #0#0
#0
%[#0
#0#0
%[%[
#0#0#0
%[
#0
%[%[%[
#0#0#0
#0
%[
#0#0
#0
#0%[
#0#0
#0
#0%[#0
#0%[#0
#0
L a k e S t u r g e o n A g e s # 0 3 - 1 6 % [ 1 7 - 7 2
0 3 0 60 90 Miles
N
EW
S
Figure 1. Ages of lake sturgeon captured by commercial fisher 1995-2000.
Thirty previously tagged lake sturgeon have been recaptured in Saginaw Bay, the Main Basin and North Channel of Lake Huron from 1995 to 2000. Coordination between OMNR-LHMU and the Alpena FRO on the lake sturgeon project in Lake Huron has provided documentation of interbasin movement of sturgeon between Saginaw Bay, the Main Basin and North Channel. In 2000, two lake sturgeon tagged by Saginaw Bay commercial fishers were recaptured in southern Lake Huron by Purdy Fisheries (Table 3). An additional 11 lake sturgeon were recaptured by Michigan state-licensed and tribal commercial fishers (Table 3). This represents the greatest number of lake sturgeon recaptured by the Michigan state-licensed commercial fishers during a single season since the project began in 1995 and a significant increase over the number of recaptures in any previous year (Figure 2).

10
The cooperation and assistance provided by Lake Huron commercial fishers provides crucial information on the lake sturgeon populations in Saginaw Bay and the northern regions of Lake Huron. Lake sturgeon appear to be less abundant in U.S. waters of Lake Huron than in Canadian waters based on by-catch return data. This is not surprising given that historically important spawning streams in Michigan have been blocked by hydropower projects. Several large streams with available spawning habitat are still free-flowing in Ontario, providing some degree of sustainability for lake sturgeon populations.
Increasing participation by commercial fishers should result in an escalation of lake sturgeon reports over the next few years. As the project continues and more lake sturgeon are tagged, additional information on seasonal movement should result from increased recaptures of previously tagged fish. In addition, collaboration between OMNR-LHMU and the Alpena FRO on the lake sturgeon project has begun to define movements of tagged sturgeon between the different basins of Lake Huron.
02468
101214
1996 1997 1998 1999 2000
Num
ber R
ecap
ture
d
Figure 2. Number of lake sturgeon recaptured by Lake Huron commercial fishers, 1996-2000.

11
Table 3. Summary of lake sturgeon recapture information for 2000.
Tag Number
Date Tagged
Date Recaptured
Tagging Grid
Recapture Grid
Tagging Fisher
Recapturing Fisher
4005 8/19/1997 5/29/2000 1508 1918 M & W Purdy Fisheries 4036 4/26/1997 4/26/2000 1508 1509 Serafin M & W 4050 10/16/1997 4/29/2000 1508 2015 Serafin Purdy Fisheries 4064 9/25/1999 5/22/2000 1508 1507 Whytes M & W 4064 8/8/2000 1607 Whytes 4110 11/17/1998 10/11/1999 1507 1507 Lentz Lentz 4110 11/25/1999 1507 Lentz 4110 5/21/2000 1507 Lentz 4152 10/19/2000 1309 Cedarville Serafin 4204 10/25/1998 6/13/2000 1507 Serafin Whytes 4258 4/11/2000 4/27/2000 1507 1509 M & W M & W 6270 10/19/1998 6/13/2000 2016 1408 OMNR Cedarville 6723 12/3/2000 1507 OMNR Lentz 6778 5/1/2000 1509 OMNR Bay Port 6785 11/2/1995 12/2/2000 2015 1509 OMNR M & W 9158 12/2/2000 1508 OMNR M & W

12
U.S. Fish and Wildlife Service Marquette Biological Station Contact: John Weisser Phone: (906) 226-1213 Fax: (906) 226-3632 E-mail: john_weisser@ fws.gov
Sea Lamprey Management Program and Lake Sturgeon Since the 1950's, the U.S. Fish and Wildlife Service and Department of Fisheries and Oceans of Canada have been contracted by the Great Lakes Fishery Commission to conduct operational activities of the Sea Lamprey Management Program (Program) throughout the Great Lakes basin. The Program continues to work with fisheries management agencies to achieve consensus on sea lamprey control and priority fisheries management projects in streams of the Great Lakes basin, apply the ecosystem approach, use adaptive management strategies, address risk management issues, and take action to minimize the risk to nontarget organisms. The Program has reduced populations of sea lamprey by 90% in the basin and is a key fishery management activity that contributes to the success of the Great Lakes fishery, an estimated benefit of about $4 billion/year to the region. The Program uses several techniques to attack sea lamprey during different stages of the life cycle. Currently, the primary method to control sea lamprey utilizes the lampricides 3-trifluoromethyl-4-nitrophenol (TFM) or the combination of TFM and 2’,5-dichloro-4’-nitrosalicylanilide (niclosamide) that kill sea lamprey larvae in streams with little or no impact on other fishes. Other methods of control include barriers to block the upstream migration of spawning sea lamprey, sea lamprey traps to capture and remove adult lamprey, and the sterile-male-release-technique to reduce the success of sea lamprey spawning. Lampricide treatment and low head sea lamprey barrier dam construction in a stream occur only with the support and the approval of regulatory and management agencies. The lake sturgeon is among the nontarget fishes most sensitive to TFM exposure. Since 1989, the Program established partnerships with agencies in the basin to identify lake sturgeon streams and conduct extensive toxicity tests using TFM and the combination of TFM and niclosamide to determine the LC 99.9 for larval sea lamprey and the no observable effect on lake sturgeon. State, provincial, and tribal agencies determine lake sturgeon streams where annual production occurs. In streams where sea lamprey and lake sturgeon co-exist, a specialized protocol is used to control larval sea lamprey and protect lake sturgeon. During 2000, lampricide treatments were conducted in five State of Michigan designated lake sturgeon streams; the Ford, Millecoquins, and Muskegon rivers (Lake Michigan) and Carp and Rifle rivers (Lake Huron). Assessments by dip net during and immediately after the lampricide treatments found no dead lake sturgeon. The assessments were completed to fulfill requirements specified in the 2000 certification of approval issued for lampricide treatments by the Michigan Department of Environmental Quality.

13
During 2001, lampricide treatments are scheduled in the following state designated lake sturgeon streams. Treatments in Michigan include the Tahquamenon and Sturgeon rivers (Lake Superior) and Manistique, Whitefish, Cedar, and White rivers (Lake Michigan). Treatments in Wisconsin include the Bad River (Lake Superior) and Peshtigo and Oconto rivers (Lake Michigan). Assessments of the effect of each treatment on lake sturgeon will occur during and immediately after each treatment. Link to the lake sturgeon section of the Sea Lamprey Management Program Web Page; midwest.fws.gov/marquette/etc/sturgeon.html

14
St. Clair Waterway
Michigan Department of Natural Resources Mt. Clemens Fisheries Research Station Contact: Mike Thomas Phone: (586) 465-4771 Fax: (586) 465-7504 E-mail: [email protected]
Summary: A total of 232 lake sturgeon were collected from the St. Clair River and Lake St. Clair in 2000. Sturgeon were collected with bottom trawls and baited setlines. Pectoral fin ray sections were used to age 801 fish captured from 1997 to 2000. Ages ranged from 1 to 74 years and included 50 year classes. Mean length at age data indicated that these sturgeon grew faster as juveniles, compared with lake sturgeon in Michigan's inland waters. A total of 217 sturgeon were tagged with serial numbered monel cattle ear tags and released in 2000. An additional 160 sturgeon have been tagged and released through September 1, 2001. In total, over 1000 lake sturgeon have been captured, tagged, and released in Lake St. Clair and the St. Clair River since this study began in 1996. Tag recoveries have been rare. Only eighteen recaptures have been made with survey gear, while another 15 have been reported by sport or commercial fishermen. The Mt. Clemens Fisheries Research Station began an investigation into the distribution and abundance of lake sturgeon in the St. Clair River and Lake St. Clair in 1996. Since 1997, the study has been funded through the Federal Aid for Sport Fish Restoration program. The objectives of this study are (1) to determine spawning period, areal distribution of spawning activity, and characterize spawning habitat for lake sturgeon in the St. Clair River, (2) to determine early (juvenile) life history of lake sturgeon in the St. Clair River and Lake St. Clair, and identify habitat requirements of lake sturgeon, (3) to document lake sturgeon population parameters for Lake St. Clair and the St. Clair River, including estimated abundance, exploitation, age composition, growth rate, and age/sex composition of the spawning stock. Capture of juvenile and adult lake sturgeon to collect biological data and mark with monel tags - Sturgeon were collected with two gear types in 2000. A total of 82 sturgeon, including three recaptures, was caught in 72 overnight sets using setlines in the North Channel of the St. Clair River, between May 8 and May 25. Total length of sturgeon caught on setlines ranged from 744 mm to 1,887 mm. Ages ranged from 6 to 74 years. All fish were tagged with monel cattle ear tags and released. A total of 150 lake sturgeon, including two recaptures, was captured with 10 m headrope bottom trawls from June through October on Lake St. Clair. Total length of sturgeon captured ranged from 859 mm to 1,849 mm. Ages ranged from 6 to 59 years. All fish were tagged with monel cattle ear tags and released. One of the two fish recaptured with trawls in 2000 was a fish previously tagged in the opercle, but the tag had been lost. A scar was clearly evident on the opercle and the left pectoral fin ray had clearly been removed. This is the first documented case of tag loss during this study.

15
Overall, the age distribution of lake sturgeon captured from 1997 through 2000 appeared well balanced, with a total of 50 year classes represented by the 801 lake sturgeon sampled for age (Figure 1). This sample reveals consistently good recruitment from 1973 to 1993. It may not be coincidental that this period of recruitment followed the federal Clean Water Act of 1972. The strongest year-classes were produced in 1993, 1991, 1985, 1979, and 1977. The 1995 to 1998 year classes were poorly represented in the sample. This could be due to gear selectivity, juvenile distribution, or poor recruitment in recent years. Since lake sturgeon are known to be capable of exceeding 50 years in age (Scott and Crossman 1973), year-classes prior to 1965 appeared under-represented in the catch. This could be an indication that recruitment prior to 1965 was poor, but has improved dramatically since that time. Alternatively, those year-classes may have experienced high exploitation rates in the past, particularly during the 1970’s and early 1980’s, prior to the closure of sturgeon season during the spawning period in May and June for these waters in 1983. A third alternative explanation for the low representation of pre-1961 cohorts is that the longevity of lake sturgeon in the St. Clair system is now, and always has been, less than 50 years for nearly all individuals in the population. Growth of lake sturgeon in the St. Clair ecosystem was good, with some fish attaining a total length of 1 m as early as age 8. A mean length of 1,270 mm is attained by age 19 (Table 1). In contrast, lake sturgeon in Michigan's inland waters grow slower, particularly from age 1 to age 15, and attain a mean length of 1,270 mm at age 22 (Baker 1980). Based on age and growth data collected during this study, the MDNR implemented new regulations for sturgeon sport fishing on Lake St. Clair and the St. Clair River in 1999. The regulations included a “slot” size limit, with a minimum length limit of 1,067 mm (42 inches) and a maximum length limit of 1,270 mm (50 inches), a season bag limit of 1 fish, an open season from July 16 to September 30, and mandatory registration of harvested sturgeon at designated check stations. This “slot” limit allows a limited harvest to continue, while protecting sexually mature female fish and potentially allowing older fish to increase in abundance. Characterization of adult spawning habitat and juvenile habitat, based on catch distribution, using underwater video, sidescan sonar, doppler flow meter, temperature and oxygen profiles - While good sidescan images of the site have been obtained from the Seascan PC system, signal returns from cinder substrate are not obviously different from the surrounding clay and gravel substrates. River currents tend to make the towfish unstable, resulting in distorted images. Also, steep bottom contours typical of the St. Clair River shorelines make it difficult to use the sidescan sonar effectively. Consequently, a quick reliable way to search the St Clair River and it’s many deltaic channels for additional spawning sites has not been found. Since researchers from the USGS Great Lakes Science Center undertook an investigation of suspected sturgeon spawning locations in 2001, we have directed our efforts towards other issues. Efforts to identify habitat requirements of juvenile lake sturgeon have been impeded by our inability to consistently collect young lake sturgeon. Less than 1% of the sturgeon captured through 2000 were younger than age 3 (smaller than about 500 mm total length). Efforts to capture Age 0 lake sturgeon in littoral areas with a 4.8 m headrope trawl have been unsuccessful. Potentially, Age 0 lake sturgeon in the St. Clair system may inhabit deep channel areas of the St.

16
Clair delta. However, sampling in these areas is extremely difficult. We examined one of the deep channel areas with underwater video during fall 2000. However, the search was ineffective due to camera instability resulting from current turbulence. Alternative methods of collecting juveniles will be explored in 2002. Smaller scale setlines or small minnow trap devices are possible sampling options yet to be investigated. Additional catch data from collections over the next few years may also help identify juvenile habitat based on the geographical distribution of juveniles in the catch. Collect and analyze tag recovery data - Tag recovery data remain sparse. Through 2000, only 29 lake sturgeon tagged and released during this study had been recaptured. Eleven have been recovered during the setline survey portion of this study in the North Channel, while three have been recovered while survey trawling. Seven recoveries were reported in 1998 and 1999 by sport anglers in the North Channel. Eight recoveries have been reported from the Ontario commercial trap-net fishery in southern Lake Huron, approximately 70 kilometers from the tag site. All other recaptures have occurred within 10 km of the tag sites. These data suggest that sturgeon movement between the St. Clair system and southern Lake Huron is common. Furthermore, it suggests that sturgeon spawning in the Michigan waters of the St. Clair River, experience considerable fishing exploitation in the Ontario waters of southern Lake Huron. These factors should be recognized in future sturgeon management strategies on these waters. Lake sturgeon movements are unrestricted by human or natural barriers in the St. Clair system. The potential for free immigration and emmigration makes it difficult to estimate abundance based on mark-recapture techniques. However, it is possible to produce some estimates of numerical abundance based on the mark-recapture data available from our survey gear. Using the SCHNABEL method (Ricker 1975) we estimated the abundance of lake sturgeon in the St. Clair system was 39,952 (95% CI=20,719-557,481). Using CAPTURE software (White et al 1978) we estimated the abundance of lake sturgeon in the St. Clair system was 45,506 (95% CI=24,230-86,190). Despite the problems associated with the potential violation of various assumptions regarding these estimation techniques, we believe the magnitude of these estimates suggests subadult and adult sturgeon abundance in the St. Clair system exceeds 20,000 fish.

17
Central Michigan University College of Science and Technology Contacts: Nathan Caswell & Doug Peterson (989) 774-1627 (989) 774-3462 Fax Email: [email protected] [email protected]
Summary - Using baited set lines, we captured adult lake sturgeon in several locations throughout the Detroit River from April - October 2000. A total of 40 sturgeon were captured, and there were no recaptures. Biological data was collected, and cross-sections of pectoral fin ray samples were used to evaluate the population age structure as well as individual growth rates. Sonic transmitters were implanted in 10 adult fish and their movements were tracked throughout the field season to evaluate habitat use and to identify potential spawning habitats within the river. Lake sturgeon in the Detroit River appear to be growing as fast, or faster, than other Great Lakes populations. Sturgeon appear to use only a relatively small portion of the Detroit River. We were unable to locate any spawning sites for sturgeon in the Detroit River in 2000. Central Michigan University, in conjunction with the USFWS Alpena FRO, began investigating the biology, spawning habitat, and movements of adult Detroit River lake sturgeon in 2000. The main objectives of this study were to (1) obtain baseline biological data including growth rates and age structure of the Detroit River stock, (2) evaluate movement patterns of adult lake sturgeon within the Detroit River, and (3) determine if lake sturgeon spawning is taking place in the Detroit River. Capture of Detroit River lake sturgeon to collect biological data and mark with monel/floy and pit tags – Beginning on 3 April 2000, baited setlines and large-mesh gill nets were set in selected areas of the Detroit River. Gill nets were quickly filled with drifting macrophytes, rendering them ineffective, and their use was discontinued on 20 April 2000. Setlines were initially set overnight, but more time was needed for the telemetry segment of the project. As a result, starting on 22 May 2000, setlines were set for two nights, and this was continued until 22 October 2000. We ended the year with a total of 217 sets, which yielded 354 setline-days. Forty (40) lake sturgeon were captured overall, with no recaptures, giving us an overall CPUE of 0.11 sturgeon/setline-day. Sturgeon were captured at seven sites, five of which were east and south of Fighting Island on the Canadian side of the Detroit River (Figure 1). Lake sturgeon were marked externally with monel cattle ear tags and/or floy tags inserted at the base of the dorsal fin. Sturgeon were also marked internally with a PIT tag inserted underneath the fourth dorsal scute. Total lengths ranged from 68.5 – 181 cm (125.1 cm mean) (Figure 2). Weights ranged from 1.5 – 55 kg (15.3 kg mean). The length-weight relationship for sturgeon in the Detroit River is W=

18
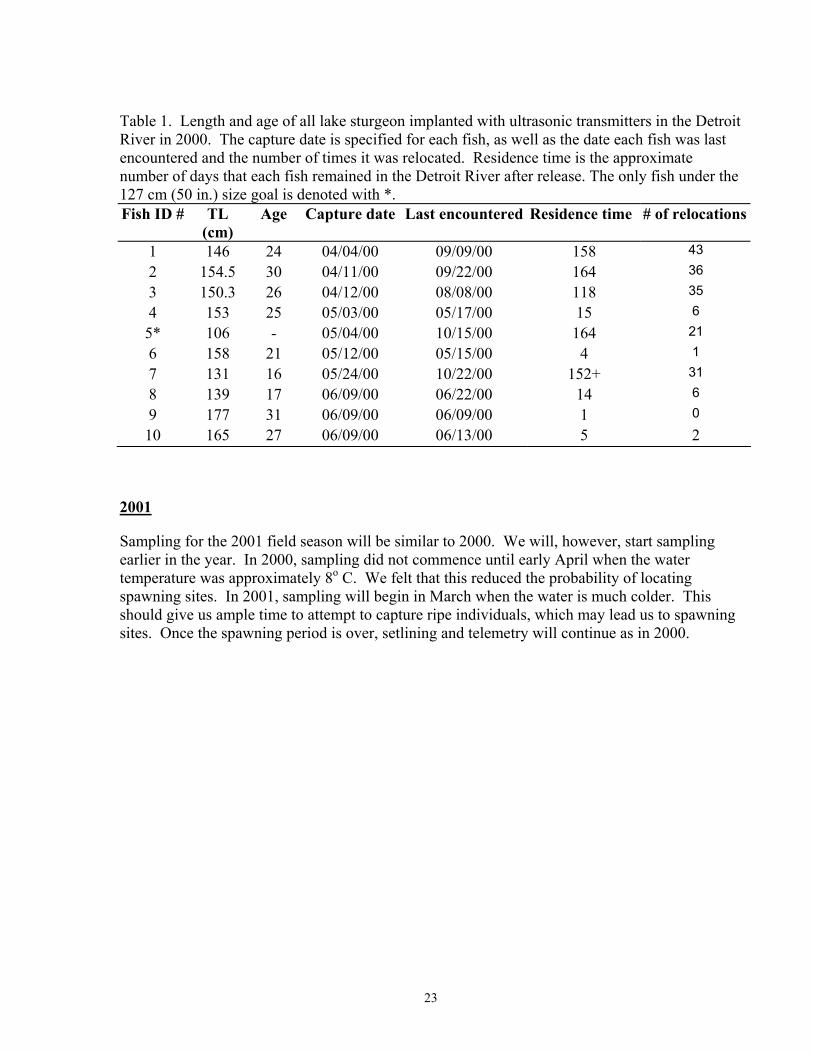
(5.04E-07) L 3.5162 (Figure 3). Pectoral fin ray cross-sections were used to age fish, and a total of 36 lake sturgeon from the Detroit River were aged in 2000. Ages ranged from 4 to 34 years with 25 year-classes represented (Figure 4). Findings were similar to those of Thomas and Haas (1999) with the strongest year-classes occurring in the early 1990s. Growth of lake sturgeon in the Detroit River appears to be faster than growth reported for Lake St. Clair and the St. Clair River by Thomas and Hass (2000). Fish from the Detroit River reach 95.6 cm by age 8, while fish from the St. Clair system reach 92.4 cm by the same age. At age 10, Detroit River and St. Clair sturgeon average 106.3 cm and 97.5 cm, respectively, and at age 20, those lengths are 156.8 cm and 129.7 cm, respectively (Figure 5). It is important, however, to remember that the sample size for the Detroit River (40) was much smaller than that for the St. Clair system (172), and that these growth rates may be closer as more fish are included in the mean lengths-at-age. Implantation of ultrasonic transmitters and movements of adult lake sturgeon in the Detroit River – Ultrasonic transmitters were implanted in ten (10) adult lake sturgeon between 4 April and 9 June 2000. Total lengths for these fish ranged from 106 to 165 cm (Table 1). Our goal was to implant ten sturgeon over 127 cm (50 in.) TL to insure maturity. We were unsure, however, if we would be able to capture ten fish of this size. Consequently, one fish (# 5) was under the 127-cm limit. Starting on 15 April 2001, the entire river was traveled by boat at least once each week to monitor individual movements of transmittered sturgeon. We checked for the presence of transmittered fish at 1.6-km intervals during each tracking day. The date, GPS coordinates, depth, and a general description of the location were recorded each time a fish was relocated. Individual sturgeon were relocated 0 – 43 times from 5 April to 22 October 2000. They used depths from 4.6 – 12.5 m (mean = 8.1 m). River residence time after release ranged from 0 – 164 days (mean = 71 d) (Table 1). By late October, nine of the ten fish with transmitters had left the Detroit River. Four of these were located in Lake St. Clair by personnel from the Michigan Department of Natural Resources Mt. Clemens Fisheries Research Station. The locations of the remaining five sturgeon are unknown at this time. A total of 181 locations were recorded for transmittered lake sturgeon in the Detroit River in 2000. Of these, over 91% of them occurred in an area that we refer to as their “home area” which extends from the north end of Fighting Island south to the north end of the Amherstburg Channel (Figure 1). It appears that when sturgeon are in the Detroit River, they hold within this area. It also appears that when sturgeon leave the home area, they leave the river entirely. Again, only 9% of all locations in the Detroit River in 2000 occurred outside of this area. As further evidence, fish #5 left this area around 17 May 2000, and was relocated on four occasions in Lake Erie. When it reentered the Detroit River five days later, it was located in nearly the same place it was before it left. It appears that adult lake sturgeon are using only a small portion of the available habitat in the Detroit River.

19
Lake sturgeon left the Detroit River throughout the summer and fall. There did not appear to be a specific event based on photoperiod or temperature that triggered the movement of sturgeon into or out of the river.
Lake sturgeon spawning in the Detroit River – We were unable to locate any definite or potential lake sturgeon spawning sites in the Detroit River. The main reason for this is that we did not capture any ripe individuals that we could have followed to spawning sites. Secondly, we were unable to capture more than a few large individuals before the reported spawning temperature (13-15o C) passed (Nichols 2000). Finally, there was no obvious movement of any of the transmittered sturgeon to indicate spawning behavior. Goodyear et al. (1982) reported the presence of seven historic lake sturgeon spawning sites in the Detroit River, but none of the transmittered fish moved to any of these sites at any time during the spring. Some of the fish we captured, though, had abrasions and bruising on their ventral surface which could be indicative of spawning behavior.

20
Figure 1. Map of the Detroit River with lake sturgeon capture locations (circles) and numbers of fish captured at those locations. Telemetry relocations for all transmittered sturgeon are depicted with black dots.

21
Figure 2. Length frequency distribution for lake sturgeon captured in the Detroit River in 2000.
Figure 3. Weight-length relationship for lake sturgeon captured in the Detroit River in 2000.
0123
4567
60-6
9
70-7
9
80-8
9
90-9
9
100-
109
110-
119
120-
129
130-
139
140-
149
150-
159
160-
169
170-
179
180-
189
Length (cm)
Num
ber o
f lak
e st
urge
on
W= (5.04E-07) L 3.5162
0102030
405060
50 100 150 200
Length (cm)
Wei
ght (
kg)

22
Figure 4. Year-class frequency for lake sturgeon captured in the Detroit River in 2000.
Figure 5. Length-at-age for lake sturgeon captured in the Detroit River in 2000.
0
1
2
3
4
5
1996
1994
1992
1990
1988
1986
1984
1982
1980
1978
1976
1974
1972
1970
1968
1966
Year class
Num
ber o
f stu
rgeo
n
020406080
100120140160180200
0 10 20 30 40
Age (years)
Leng
th (c
m)
23
Table 1. Length and age of all lake sturgeon implanted with ultrasonic transmitters in the Detroit River in 2000. The capture date is specified for each fish, as well as the date each fish was last encountered and the number of times it was relocated. Residence time is the approximate number of days that each fish remained in the Detroit River after release. The only fish under the 127 cm (50 in.) size goal is denoted with *. Fish ID # TL
(cm) Age Capture date Last encountered Residence time # of relocations
1 146 24 04/04/00 09/09/00 158 43
2 154.5 30 04/11/00 09/22/00 164 36
3 150.3 26 04/12/00 08/08/00 118 35
4 153 25 05/03/00 05/17/00 15 6
5* 106 - 05/04/00 10/15/00 164 21
6 158 21 05/12/00 05/15/00 4 1
7 131 16 05/24/00 10/22/00 152+ 31
8 139 17 06/09/00 06/22/00 14 6
9 177 31 06/09/00 06/09/00 1 0
10 165 27 06/09/00 06/13/00 5 2
2001
Sampling for the 2001 field season will be similar to 2000. We will, however, start sampling earlier in the year. In 2000, sampling did not commence until early April when the water temperature was approximately 8o C. We felt that this reduced the probability of locating spawning sites. In 2001, sampling will begin in March when the water is much colder. This should give us ample time to attempt to capture ripe individuals, which may lead us to spawning sites. Once the spawning period is over, setlining and telemetry will continue as in 2000.

24
Lake Erie
Ohio Division of Wildlife Sandusky Fisheries Research Station Contact: Dave Davies Phone: (419) 625-8062 Fax: (419) 625-6272 E-mail: [email protected]
There were 36 reported lake sturgeon sightings in 2000, compared to 38 in 1999. Commercial fisherman reported 17 of these sightings, including the first from a shore seine. Anglers reported catching and releasing only 5 sturgeon, compared to 13 in 1999. Anglers reported 2 adult-sized sturgeon from below Grand Rapids in the Maumee River, the first during April and the second during October. This reach of the Maumee is thought to contain ancestral sturgeon spawning habitat. These are our first confirmed sightings of sturgeon in this river system in recent times. The majority of the sightings were from Catawba to Cedar Point in Ohio's western basin, which is similar to previous years. Sightings were reported from Michigan (3), Pennsylvania (1), and New York (7) waters, as well. Total lengths ranged from 14 inches (350 mm) to 76 inches (1,930 mm) and averaged 43 inches (1,090 mm). The Pennsylvania and New York reports were from carcasses of large adults, 69 inches (1,750 mm) to 76 inches (1,930 mm) in total length, encountered in late August to early November. A video entitled "Lake Sturgeon: Dinosaurs of the Great Lakes" was produced, written and released by Betty Wills, of the Earthwave Society (www.earthwave.org; e-mail:[email protected]) in cooperation with the Great Lakes Bi-national Lake Sturgeon Group. Copies of the video are available by contacting Tracy Hill at (989) 356-5102 x16.

25
Niagara River
U.S. Fish and Wildlife Service Lower Great Lakes Fishery Resources Office Contacts: Tom Hughes & Chris Lowie Phone: (631) 444-0280, Fax: (631) 444-0272 E-mail: [email protected] [email protected]
In 2000, the LGLFRO continued the lake sturgeon sampling and ultrasonic telemetry initiated in 1998. For study results from 1998-1999, refer to the report entitled, 1999 Activities of the Central Great Lakes Bi-national Lake Sturgeon Group (Hill et al. 2000). The overall goal of our study is to identify key spawning and feeding habitats in the river in order to better manage, protect, and enhance the lake sturgeon population in the lower Niagara River. The research objectives of our study are to: (1) assess the population of lake sturgeon in the lower Niagara River by collecting and analyzing age, growth, and abundance data, (2) compare the movements of adult and juvenile lake sturgeon in the lower Niagara River, and (3) identify potential spawning, feeding, and nursery habitats in the lower Niagara River and compare utilization of these habitats between adult and juvenile lake sturgeon. During 2000, we collected a total of 32 lake sturgeon (3 recaptured fish) using gillnets and baited setlines. 25 cm gillnets were set from early March to late May. Since fast currents and floating debris in the main river often caused nets to fish ineffectively, gill nets were set mainly in back eddy environments or in areas of slower current. Setlines were constructed according to the methods of Thomas and Haas (1999). Setlines were used periodically from April through August. In 2000, CPUE for both methods was 0.28 fish per night, with gill nets (0.36 fish/night) performing slightly better than setlines (0.22 fish/night) (Table 1). Total CPUE for 2000 was remarkably similar to that of 1999 (0.27 fish/night). Overall, from 1998-2000, CPUE of gill nets and setlines were similar, with an average of 0.24 fish per night (Table 1).

26
Table 1. Summary of CPUE of lake sturgeon for all sampling methods (gill nets, setlines, and divers) in the lower Niagara River comparing 2000 to 1998-2000 combined.
Year Method Total nights
Total hours
Number sturgeon caught
CPUE (fish/night)
CPUE (fish/hr)
2000 Gill nets 47 1099.5 17 0.36 0.015
Setlines 76 1731.5 17 0.22 0.01
Divers 0 0 0 0 0
Total 123 2831 34 0.28 0.012
1998-2000 Gill nets 122 2539.2 30 0.25 0.012
Setlines 115 2459.75 27 0.23 0.011
Divers 4 7 10 2.5 1.43
Total 241 5005.95 67 0.28 0.013
Fork length, total length, weight, and girth were recorded for all lake sturgeon. Pectoral fin bone and tissue samples were collected for age estimation and genetic analysis. Measurements are summarized for the 29 non-recaptured fish (Table 2). In general, the heavier, larger, and older fish were captured in the 25 cm gill nets, however there was a broad, overlapping range across both gears (Table 2). Age of lake sturgeon captured ranged from 4 to 23 years old, with most fish (n = 22) less than 10 years old (Figure 1, Table 2). Consistent with 1998-1999, our setlines and gill nets primarily targeted sturgeon over 700 mm with an average total length of 1071 mm (Figure 2, Table 2). Table 2. Summary of biological data collected from lake sturgeon, for which all measurements were taken, captured in gill nets and setlines in the lower Niagara River for 2000.
Gear Type Gill Net Setline Both Gears
No. Fish 14 15 29 Mean TL (mm) 1156 1002 1071
Range (mm) 821 – 1573 773 – 1436 773 – 1573 Mean FL (mm) 1044 899 965
Range (mm) 740 – 1426 690 – 1333 690 – 1426 Mean Girth (mm) 536 434 480
Range (mm) 346 – 807 294 – 710 294 – 807 Mean Weight (kg) 14 7.9 10.6
Range (kg) 3.3 – 35.9 2.9 – 28.2 2.9 – 35.9 Mean Age (yrs) 11 8 9
Range (yrs) 5 - 23 4 - 17 4 - 23

27
Figure 1. Age distribution of lake sturgeon caught in the lower Niagara River, 2000.
Figure 2. Length distribution of lake sturgeon caught in the lower Niagara River, 2000.
0
1
2
3
4
5
6
7
8
9
10
1 2 3 4 5 6 7 8 9 10 11 12 13 14 15 16 17 18 19 20 21 22 23
Age (yrs)
Num
ber
of F
ish
0
1
2
3
4
5
6
7
8
0-99
100-1
99
200-2
99
300-3
99
400-4
99
500-5
99
600-6
99
700-7
99
800-8
99
900-9
99
1000
-1099
1100
-1199
1200
-1299
1300
-1399
1400
-1499
1500
-1599
Size Class (mm)
Num
ber
of F
ish

28
During 2000, we continued to monitor movements of ultrasonic tagged fish from 1999. In addition, 6 fish captured in 2000 received ultrasonic tags. Ultrasonic tags were applied to fish externally through the base of the dorsal fin. Plastic coded wire harnesses and fitted PVC plates were used to attach the ultrasonic tags according to the methods used by researchers on the St.Lawrence River, New York (J. Hayes personal comm.). Fish tagged in 1999 were tracked from April 1999 to August 2000. All of the 1999 fish exhibited little or no movement during the cold, winter months (October through March) (Figures 6, 7, 8, and 9). However, generally speaking, these fish showed a much greater range in movement before and after the overwintering period. The magnitude of fish movements varied among individual fish. Fish # 455 and fish # 275 (Figures 6 and 7) showed a much greater range in movement than fish # 87 and fish # 446 (Figures 8 and 9), which remained fairly localized throughout the study period. Four of the six fish tagged in 2000 were tracked from April through August 2000. Movements of these four fish are shown in Figures 10, 11, 12, and 13. In general, all fish originally captured in the river had moved out to the lake by mid-summer. Residence time that the fish spent in the river varied individually.
Figure 6. Movements of Fish #455 in the lower Niagara River, 1999-2000. Positive river kilometers represent the distance in the river upstream from the mouth (rkm = 0) and negative river kilometers represent the distance from the mouth in Lake Ontario. Lines are dashed between fixes when the interval between trackings is greater than 14 days. Lines are broken between fixes when the fish was not located despite efforts to find it in both the river and lake study area.
-8-6-4-202468
1012
M A M J J A S O N D J F M A M J J A
1999 Date 2000
Riv
er K
ilom
eter

29
Figure 7. Movements of Fish #275 in the lower Niagara River, 1999-2000. Positive river kilometers represent the distance in the river upstream from the mouth (rkm = 0) and negative river kilometers represent the distance from the mouth in Lake Ontario. Lines are dashed between fixes when the interval between trackings is greater than 14 days. Lines are broken between fixes when the fish was not located despite efforts to find it in both the river and lake study area.
Figure 8. Movements of Fish #87 in the lower Niagara River, 1999-2000. Positive river kilometers represent the distance in the river upstream from the mouth (rkm = 0) and negative river kilometers represent the distance from the mouth in Lake Ontario. Lines are dashed between fixes when the interval between trackings is greater than 14 days.
-8-6-4-202468
1012
M A M J J A S O N D J F M A M J J
1999 Date 2000
Riv
er K
ilom
eter
-8-6-4-202468
1012
J J A S O N D J F M A M J J A S
1999 Date 2000
Riv
er K
ilom
eter

30
Figure 9. Movements of Fish #446 in the lower Niagara River, 1999-2000. Positive river kilometers represent the distance in the river upstream from the mouth (rkm = 0) and negative river kilometers represent the distance from the mouth in Lake Ontario. Lines are dashed between fixes when the interval between trackings is greater than 14 days.
Figure 10. Movements of Fish #458 in the lower Niagara River, 2000. Positive river kilometers represent the distance in the river upstream from the mouth (rkm = 0) and negative river kilometers represent the distance from the mouth in Lake Ontario. Lines are dashed between fixes when the interval between trackings is greater than 14 days.
-8-6-4-202468
1012
S O N D J F M A M J
1999 Date 2000
Riv
er K
ilom
eter
-8-6-4-202468
1012
M A M J J A
Date
Riv
er K
ilom
eter

31
Figure 11. Movements of Fish #567 in the lower Niagara River, 2000. Positive river kilometers represent the distance in the river upstream from the mouth (rkm = 0) and negative river kilometers represent the distance from the mouth in Lake Ontario. Lines are dashed between fixes when the interval between trackings is greater than 14 days. Lines are broken between fixes when the fish was not located despite efforts to find it in both the river and lake study area.
Figure 12. Movements of Fish #449 in the lower Niagara River, 2000. Positive river kilometers represent the distance in the river upstream from the mouth (rkm = 0) and negative river kilometers represent the distance from the mouth in Lake Ontario. Lines are broken between fixes when the fish was not located despite efforts to find it in both the river and lake study area.
-8-6-4-202468
1012
M A M J J A
Date
Riv
er K
ilom
eter
-8-6-4-202468
1012
M A M J J A
Date
Riv
er K
ilom
eter

32
Figure 13. Movements of Fish #558 in the lower Niagara River, 2000. Positive river kilometers represent the distance in the river upstream from the mouth (rkm = 0) and negative river kilometers represent the distance from the mouth in Lake Ontario. Lines are dashed between fixes when the interval between trackings is greater than 14 days.
-8-6-4-202468
1012
A M J J A
Date
Riv
er K
ilom
eter