2 selected pt nanoparticles - ucf physicsroldan/publications/2013_merte_acscatal.pdf · 2 selected...
TRANSCRIPT

1
Correlating catalytic methanol oxidation with the structure and oxidation state of size-1
selected Pt nanoparticles 2
Lindsay R. Merte,1 Mahdi Ahmadi,1 Farzad Behafarid,1 Luis K. Ono,1 Estephania Lira,1 3
Jeronimo Matos,1 Long Li,2 Judith C. Yang2 and Beatriz Roldan Cuenya1,* 4
5
1 Department of Physics, University of Central Florida, Orlando, Florida 32816, United States 6
2 Department of Chemical and Petroleum Engineering, University of Pittsburgh, Pittsburgh, 7
Pennsylvania 15261, United States 8
* Corresponding author: [email protected] 9
Keywords: platinum; methanol oxidation; operando; XAS; EXAFS; alumina; nanoparticle; size 10
selected 11
12
Abstract 13
We have investigated the structure and chemical state of size-selected platinum nanoparticles 14
(NPs) prepared by micelle encapsulation and supported on γ-Al2O3 during the oxidation of 15
methanol under oxygen-rich reaction conditions following both oxidative and reductive 16
pretreatments. X-ray absorption near-edge structure (XANES) and extended x-ray absorption 17
fine-structure (EXAFS) spectroscopy measurements reveal that in both cases, the catalyst is 18
substantially oxidized under reaction conditions at room temperature and becomes partially 19
reduced when the reactor temperature is raised to 50°C. Reactivity tests show that at low 20
temperatures the pre-oxidized catalyst, where a larger degree of oxidation was observed, is more 21
active than the pre-reduced catalyst. We conclude that the differences in reactivity can be linked 22
to the formation and stabilization of distinct active oxide species during the pretreatment. 23
24

2
1. Introduction 1
The partial and total catalytic oxidation of methanol are important chemical processes, the 2
former being employed in the synthesis of industrially-relevant compounds like formaldehyde1,2 3
and methyl formate,3,4 and the latter in the elimination of this toxic chemicals, along with other 4
volatile organic compounds (VOC), from exhaust gases.5-7 While partial oxidation reactions are 5
carried out using coinage metals or various metal oxides,8 total oxidation is typically achieved 6
with platinum and/or palladium, which are able to convert methanol, higher alcohols, 7
hydrocarbons and carbon monoxide to CO2 with high efficiencies at relatively low temperatures. 8
Although occurring in a rather different environment, the electrocatalytic oxidation of methanol, 9
which proceeds over Pt-based catalysts, is also relevant. The rate of this process is a limiting 10
factor in the performance of direct methanol fuel cells (DMFC), which produce electricity from 11
liquid fuel without the need for reforming.9,10 12
Despite having been studied for decades, some controversy exists regarding the mechanisms 13
of oxidation reactions over platinum, particularly regarding the formation and participation of 14
oxide phases in the reaction process. On one hand, formation of surface oxides has long been 15
believed to cause deactivation of Pt catalysts, for example in the oxidation of alcohols to 16
aldehydes and ketones.11-13 On the other hand, chiefly in the context of CO and CH4 oxidation, 17
studies on single crystal samples and real catalysts have suggested that oxides may form under 18
reaction conditions which do not hinder the oxidation reaction, but in fact enhance the activity or 19
modify the selectivity.14-17 Although the topic remains a matter of debate,18,19 operando studies 20
of nanoparticle (NP) samples on high-surface-area supports have supported the idea that in some 21
cases surface oxides might enhance the activity in oxidation reactions.20-25 22
One of the primary limitations in the study of supported catalytic materials under realistic 23
reaction conditions is the complexity of such materials and the resulting difficulty in 24
characterizing them in detail. An emerging, successful approach to reducing the complexity of 25
such materials, enabling more detailed characterization, without sacrificing the direct 26
applicability of the results to commercially relevant chemical processes, is to use NP synthesis 27
techniques that produce catalysts with well-defined sizes and shapes.26 Taking this approach, we 28
have used reverse micelle NP synthesis to study methanol oxidation over a Pt/γ-Al2O3 catalyst, 29
with particular attention to the evolution of the structure and oxidation state of Pt under reaction 30

3
conditions. Based on the knowledge of the chemical state of the catalyst at work which can be 1
achieved via X-ray absorption fine-structure spectroscopy (XAFS), the effect of oxidative and 2
reductive pretreatments on the catalyst’s activity and selectivity will be discussed. 3
4
2. Experimental methods 5
The Pt-loaded micellar precursor was synthesized by dissolution of H2PtCl6 into a solution of 6
polystyrene-b-poly(2-vinylpyridine) [PS(27700)-b-P2VP(4300)] block copolymer (Polymer 7
Source, Inc.) in toluene (50 mg/ml). This results in reverse micelles with the Pt salt dissolved in 8
the P2VP core. The quantity of platinum salt added was chosen to give a Pt:P2VP molar ratio of 9
0.2. The mixture was stirred for 2 days to ensure complete dissolution and then filtered. The 10
formation of uniform micelles was checked by dip-coating a natively-oxidized Si wafer with the 11
micellar solution and imaging the wafer in an atomic force microscope (AFM). The solution was 12
then mixed with commercial γ-Al2O3 powder (Inframat Advanced Materials, ~150 m2/g) to yield 13
a nominal Pt loading of 1%. The toluene was evaporated under mechanical agitation at 50 °C. 14
The polymer was removed by calcination in 70% O2 (balanced with He) at 375 °C for 24h. 15
Complete removal of the polymer was confirmed by checking the C-1s x-ray photoelectron 16
spectroscopy (XPS) signal, which showed only small intensity attributable to adventitious carbon 17
accumulated during the brief exposure of the sample to air in the course of its ex situ transfer to 18
the XPS chamber.23,27 19
AFM measurements were conducted in tapping mode with a Veeco Multimode microscope. 20
XPS measurements were conducted using a monochromatic Al-Kα x-ray source (1486.6 eV) and 21
a Phoibos electron energy analyzer (SPECS, GmbH). Binding energies were referenced to the 22
Al-2p photoemission peak of Al2O3 at 74.3 eV. Pt-4f photoemission peaks were not detectable 23
for this sample due to their coincidence with the Al-2p peaks of the support, so the Pt-4d region 24
was used instead to characterize the Pt oxidation state. High-angle annular dark field scanning 25
transmission electron microscopy (HAADF-STEM) measurements were conducted after the 26
EXAFS experiments using a JEOL 2100F TEM/STEM operated at 200 kV. The TEM samples 27
were prepared by making an ethanol suspension of the Pt/γ-Al2O3 powder and placing a few 28
drops of this liquid onto an ultrathin C-coated TEM grid. The probe size of the STEM mode is 29

4
about 0.2 nm. The Pt NP diameters were determined by measuring the full width at half 1
maximum of the HAADF intensity profile across the individual Pt NPs. 2
Catalytic tests were performed at the University of Central Florida (UCF) at atmospheric 3
pressure in a vertically-mounted quartz tube continuous flow reactor with either 50 mg of pure 4
Pt/γ-Al2O3 catalyst or 1 mg Pt/γ-Al2O3 diluted with 200 mg α-Al2O3, in both cases supported by 5
a quartz wool plug. The reactant mixture consisted of 4% O2 and 0.15% methanol by volume, 6
balanced with He. The methanol was introduced to the mixture by passing He gas through a 7
bubbler at ambient temperature. Gas concentrations were varied using mass flow controllers 8
(MKS) and the total flow rate was set to 50 sccm. Prior to catalytic testing, the catalyst was first 9
reduced in H2 (50% in He) at 240 °C for 30 min. To test the influence of the catalyst oxidation 10
state on its catalytic activity, the reduction step was followed by an oxidation step in O2 (70% in 11
He) at 240 °C for 30 min. The methanol, carbon dioxide, and methyl formate concentrations 12
were measured with an online mass spectrometer (Hiden HPR20) sampling the reactor outlet. 13
Conversion versus temperature measurements were carried out in two different ways. For testing 14
the reactivity of the pure catalyst, the catalyst temperature was varied manually between 5°C and 15
100°C by cooling the quartz reactor cell with isopropanol, passed through a coil wrapped around 16
the reactor tube, and counter-heating with a heating tape powered by a variable-voltage AC 17
transformer. Measurements were made in increasing temperature steps and the conversion was 18
allowed to reach a steady state at each temperature. For testing the reactivity of the diluted 19
catalyst, the temperature was controlled with a tube furnace and a PID controller (Watlow) and 20
ramped from 30°C to 150°C and then back at a rate of 10°C/hour while monitoring the reactant 21
and product concentrations continuously. 22
XAFS spectra were acquired at the Pt-L3 edge in transmission mode at beamline X18B at the 23
National Synchrotron Light Source (NSLS I), Brookhaven National Laboratory (BNL). Spectra 24
were recorded from 150 eV below the absorption edge to 1230 eV above the edge (kmax = 18 Å-25
1). The reactor used for the operando XAS measurements consisted of a Kapton tube into which 26
25 mg of undiluted catalyst powder was loaded and held in place by quartz wool plugs, forming 27
a catalyst bed ~10 mm in length. The same space velocity (25 sccm total flow), gas 28
concentrations and pretreatment conditions were used at BNL and UCF for the reactivity 29
measurements. During the XAFS measurements, reactants and products were monitored via an 30
5
online mass spectrometer (SRS RGA100). Details of these measurements are given in Suppl. 1
Fig. S1. 2
The Athena and Artemis programs28 were used for normalization, background subtraction, 3
and fitting of the extended X-ray absorption fine-structure (EXAFS) spectra. Theoretical 4
scattering amplitudes and phase shifts used in the fits were calculated with the FEFF8 ab initio 5
code29,30 using fcc Pt to simulate Pt-Pt scattering paths and Na2Pt(OH)6 to simulate Pt-O 6
scattering paths. To provide absolute energy calibration, the EXAFS spectrum of a Pt foil placed 7
after the sample was measured simultaneously. Energies given in this work are referenced to the 8
first inflection point of the Pt foil spectrum defined to be 11564 eV. 9
10
3. Results 11
3.1 Sample characterization 12
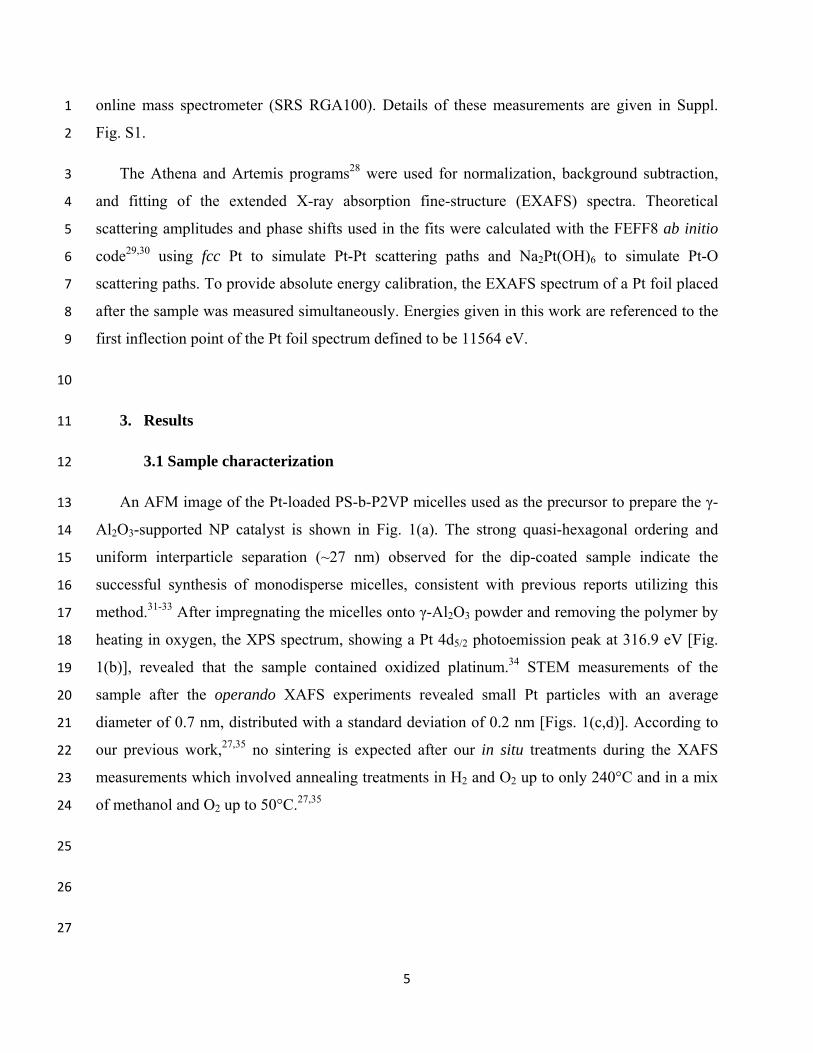
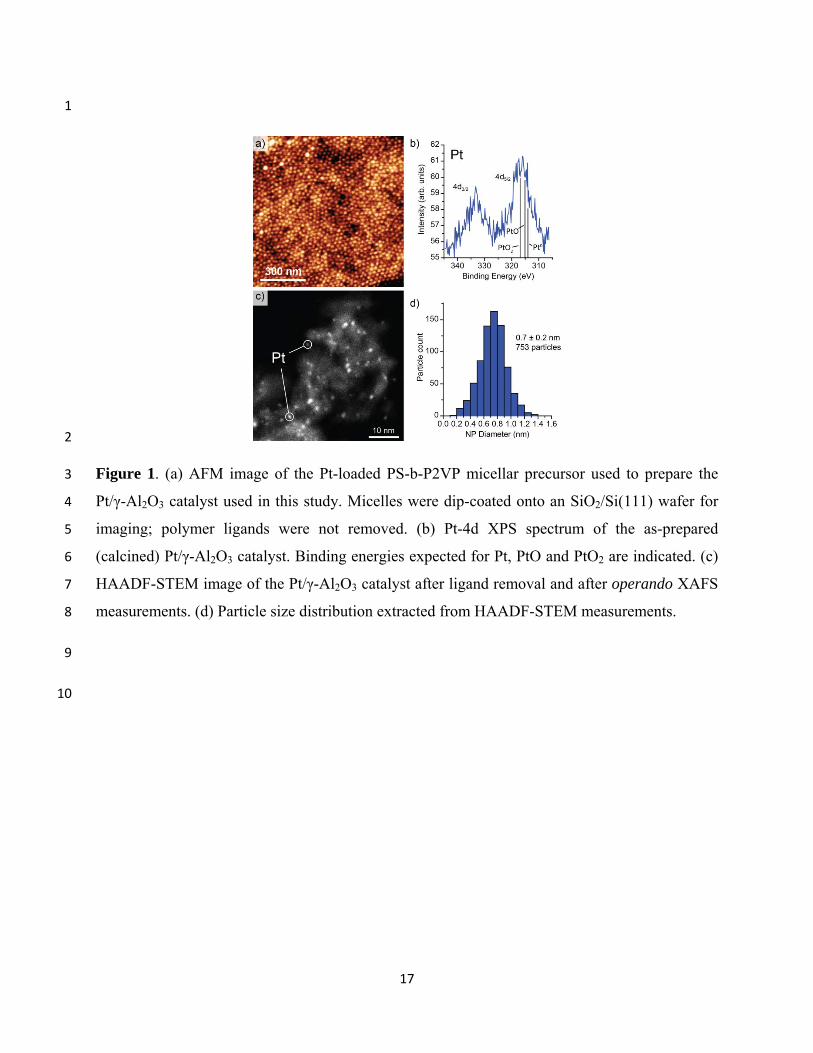
An AFM image of the Pt-loaded PS-b-P2VP micelles used as the precursor to prepare the γ-13
Al2O3-supported NP catalyst is shown in Fig. 1(a). The strong quasi-hexagonal ordering and 14
uniform interparticle separation (~27 nm) observed for the dip-coated sample indicate the 15
successful synthesis of monodisperse micelles, consistent with previous reports utilizing this 16
method.31-33 After impregnating the micelles onto γ-Al2O3 powder and removing the polymer by 17
heating in oxygen, the XPS spectrum, showing a Pt 4d5/2 photoemission peak at 316.9 eV [Fig. 18
1(b)], revealed that the sample contained oxidized platinum.34 STEM measurements of the 19
sample after the operando XAFS experiments revealed small Pt particles with an average 20
diameter of 0.7 nm, distributed with a standard deviation of 0.2 nm [Figs. 1(c,d)]. According to 21
our previous work,27,35 no sintering is expected after our in situ treatments during the XAFS 22
measurements which involved annealing treatments in H2 and O2 up to only 240°C and in a mix 23
of methanol and O2 up to 50°C.27,35 24
25
26
27
6
3.2 Catalytic activity 1
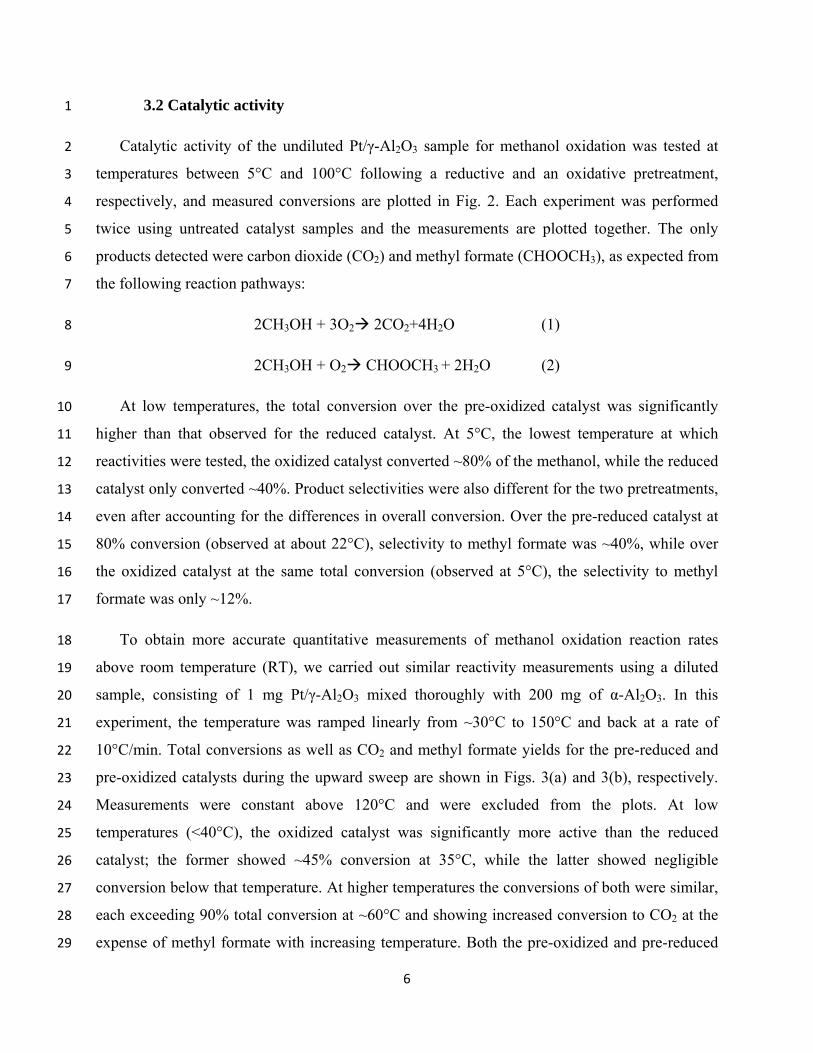
Catalytic activity of the undiluted Pt/γ-Al2O3 sample for methanol oxidation was tested at 2
temperatures between 5°C and 100°C following a reductive and an oxidative pretreatment, 3
respectively, and measured conversions are plotted in Fig. 2. Each experiment was performed 4
twice using untreated catalyst samples and the measurements are plotted together. The only 5
products detected were carbon dioxide (CO2) and methyl formate (CHOOCH3), as expected from 6
the following reaction pathways: 7
2CH3OH + 3O2 2CO2+4H2O (1) 8
2CH3OH + O2 CHOOCH3 + 2H2O (2) 9
At low temperatures, the total conversion over the pre-oxidized catalyst was significantly 10
higher than that observed for the reduced catalyst. At 5°C, the lowest temperature at which 11
reactivities were tested, the oxidized catalyst converted ~80% of the methanol, while the reduced 12
catalyst only converted ~40%. Product selectivities were also different for the two pretreatments, 13
even after accounting for the differences in overall conversion. Over the pre-reduced catalyst at 14
80% conversion (observed at about 22°C), selectivity to methyl formate was ~40%, while over 15
the oxidized catalyst at the same total conversion (observed at 5°C), the selectivity to methyl 16
formate was only ~12%. 17
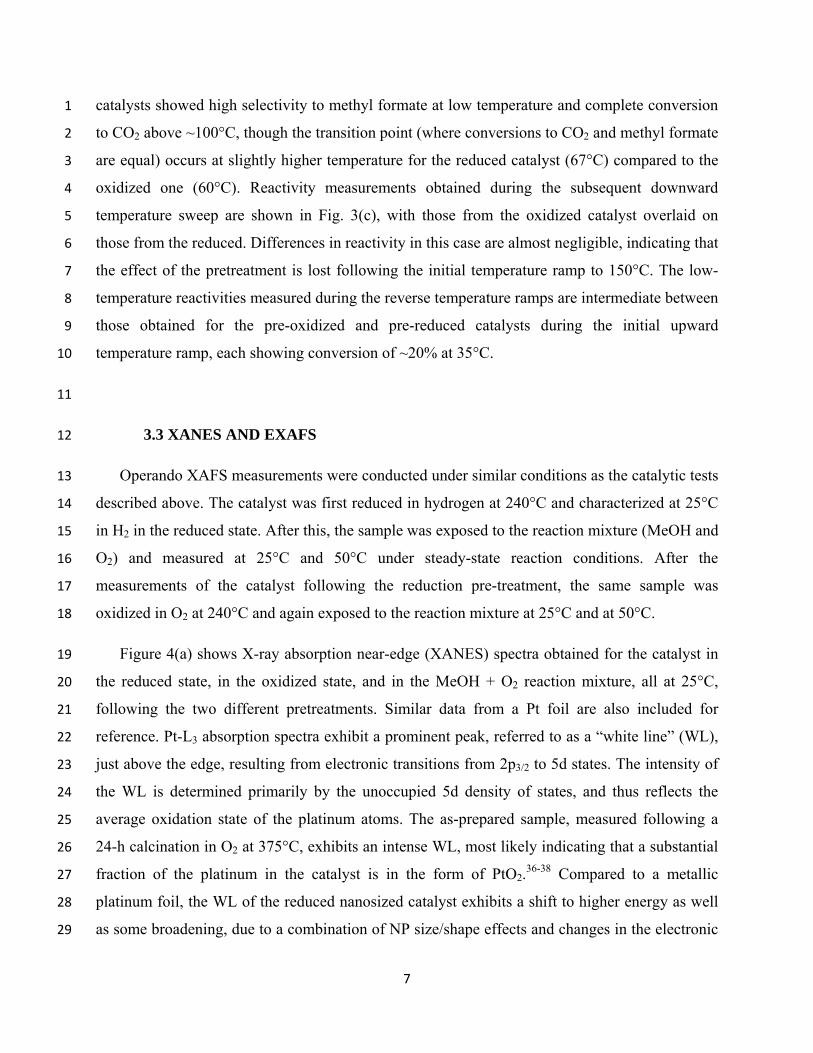
To obtain more accurate quantitative measurements of methanol oxidation reaction rates 18
above room temperature (RT), we carried out similar reactivity measurements using a diluted 19
sample, consisting of 1 mg Pt/γ-Al2O3 mixed thoroughly with 200 mg of α-Al2O3. In this 20
experiment, the temperature was ramped linearly from ~30°C to 150°C and back at a rate of 21
10°C/min. Total conversions as well as CO2 and methyl formate yields for the pre-reduced and 22
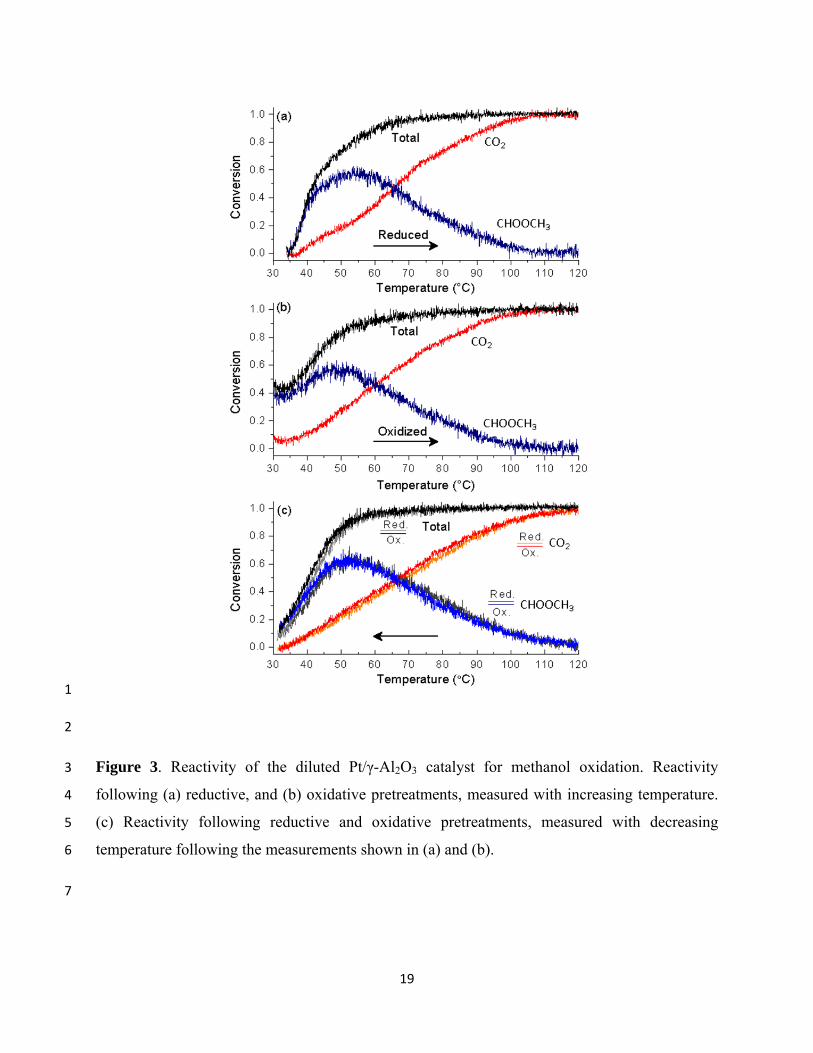
pre-oxidized catalysts during the upward sweep are shown in Figs. 3(a) and 3(b), respectively. 23
Measurements were constant above 120°C and were excluded from the plots. At low 24
temperatures (<40°C), the oxidized catalyst was significantly more active than the reduced 25
catalyst; the former showed ~45% conversion at 35°C, while the latter showed negligible 26
conversion below that temperature. At higher temperatures the conversions of both were similar, 27
each exceeding 90% total conversion at ~60°C and showing increased conversion to CO2 at the 28
expense of methyl formate with increasing temperature. Both the pre-oxidized and pre-reduced 29
7
catalysts showed high selectivity to methyl formate at low temperature and complete conversion 1
to CO2 above ~100°C, though the transition point (where conversions to CO2 and methyl formate 2
are equal) occurs at slightly higher temperature for the reduced catalyst (67°C) compared to the 3
oxidized one (60°C). Reactivity measurements obtained during the subsequent downward 4
temperature sweep are shown in Fig. 3(c), with those from the oxidized catalyst overlaid on 5
those from the reduced. Differences in reactivity in this case are almost negligible, indicating that 6
the effect of the pretreatment is lost following the initial temperature ramp to 150°C. The low-7
temperature reactivities measured during the reverse temperature ramps are intermediate between 8
those obtained for the pre-oxidized and pre-reduced catalysts during the initial upward 9
temperature ramp, each showing conversion of ~20% at 35°C. 10
11
3.3 XANES AND EXAFS 12
Operando XAFS measurements were conducted under similar conditions as the catalytic tests 13
described above. The catalyst was first reduced in hydrogen at 240°C and characterized at 25°C 14
in H2 in the reduced state. After this, the sample was exposed to the reaction mixture (MeOH and 15
O2) and measured at 25°C and 50°C under steady-state reaction conditions. After the 16
measurements of the catalyst following the reduction pre-treatment, the same sample was 17
oxidized in O2 at 240°C and again exposed to the reaction mixture at 25°C and at 50°C. 18
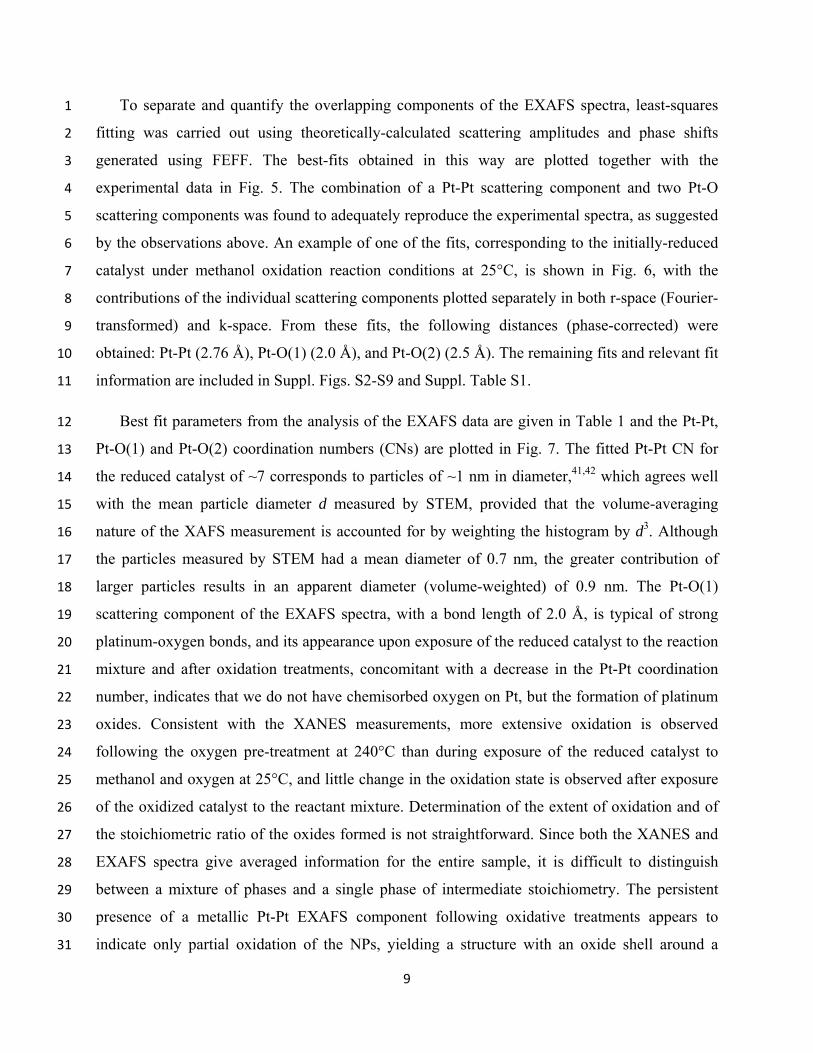
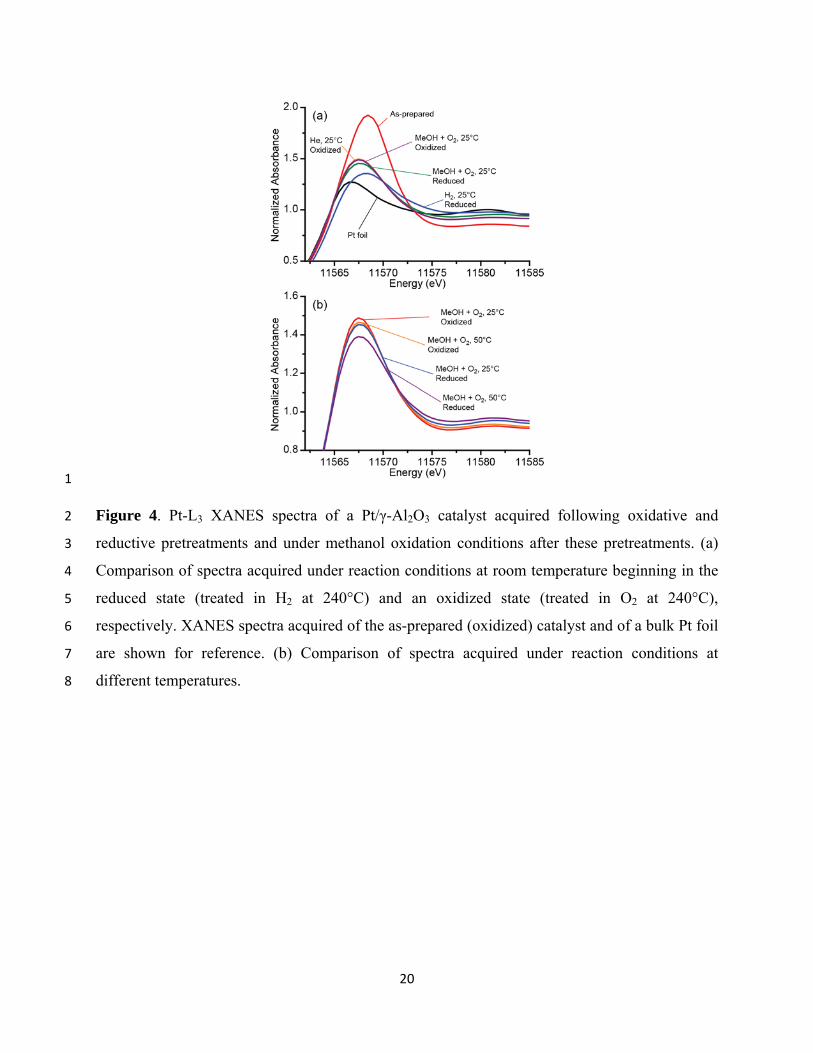
Figure 4(a) shows X-ray absorption near-edge (XANES) spectra obtained for the catalyst in 19
the reduced state, in the oxidized state, and in the MeOH + O2 reaction mixture, all at 25°C, 20
following the two different pretreatments. Similar data from a Pt foil are also included for 21
reference. Pt-L3 absorption spectra exhibit a prominent peak, referred to as a “white line” (WL), 22
just above the edge, resulting from electronic transitions from 2p3/2 to 5d states. The intensity of 23
the WL is determined primarily by the unoccupied 5d density of states, and thus reflects the 24
average oxidation state of the platinum atoms. The as-prepared sample, measured following a 25
24-h calcination in O2 at 375°C, exhibits an intense WL, most likely indicating that a substantial 26
fraction of the platinum in the catalyst is in the form of PtO2.36-38 Compared to a metallic 27
platinum foil, the WL of the reduced nanosized catalyst exhibits a shift to higher energy as well 28
as some broadening, due to a combination of NP size/shape effects and changes in the electronic 29

8
structure resulting from hydrogen chemisorption.39,40 Exposure of the reduced catalyst to the 1
oxygen-rich reaction mixture led to an increase in the white line intensity and decrease in the 2
peak energy, indicating the presence of either chemisorbed oxygen on Pt or PtOx species38. In 3
the case of the pre-oxidized sample, exposure to the reaction mixture at 25°C led to a very slight 4
decrease in WL intensity, indicating only a very small change in the oxygen content of the Pt 5
NPs. However, the intensity of the WL of the pre-reduced sample upon exposure to the reaction 6
mixture at 25°C was slightly lower than that of the sample following oxidation at 240°C. 7
Although the XANES spectra of the pre-oxidized and pre-reduced catalysts under reaction 8
conditions at 25°C are rather similar, the difference between them increased upon heating to 9
50°C, as shown in Fig. 4(b). In both cases, heating to 50°C led to a decrease in the WL intensity 10
with no change in peak position, but the difference in intensity between the 25°C and 50°C data 11
was significantly larger for the pre-reduced catalyst than for the pre-oxidized catalyst. 12
The EXAFS oscillations extracted from the post-edge region of the Pt-L3 absorption 13
coefficient result from interference effects due to the scattering of emitted photoelectrons by the 14
surrounding atoms and thus reflect the averaged local coordination environment of the Pt atoms. 15
Fourier-transformed EXAFS spectra in Fig. 5 exhibit characteristic peaks at positions 16
corresponding roughly (neglecting element- and momentum-dependent phase shifts) to the 17
nearest-neighbor distances in the sample. The EXAFS spectra of the Pt catalyst in the as-18
prepared, pre-reduced and pre-oxidized initial states (pre-reaction), as well as in the MeOH + O2 19
mix at 25°C and at 50°C are shown in Fig. 5, together with the spectrum of a bulk Pt foil. The 20
spectrum of the pre-reduced catalyst shows primarily a peak at ~2.6 Å (phase uncorrected) 21
corresponding to Pt-Pt nearest-neighbor scattering, similar to that of the Pt foil, but reduced in 22
intensity due to the small size (and thus reduced average coordination numbers) and enhanced 23
static atomic disorder of the NPs. The as-prepared sample (with the highest PtOx content due to 24
its extensive oxidation at 375°C for 24 h), in contrast, shows a dominant peak at ~1.7 Å (phase 25
uncorrected) due to Pt-O nearest-neighbor scattering. The spectrum of the pre-oxidized catalyst 26
(O2 treatment at 240°C for 30 min) and those of the catalyst obtained under reaction conditions 27
exhibit features corresponding to both Pt-Pt and oxidic Pt-O scattering [designated as Pt-O(1) in 28
Fig. 5], as well as a third feature at an intermediate scattering distance (~2.1 Å phase 29
uncorrected) designated as Pt-O(2). 30
9
To separate and quantify the overlapping components of the EXAFS spectra, least-squares 1
fitting was carried out using theoretically-calculated scattering amplitudes and phase shifts 2
generated using FEFF. The best-fits obtained in this way are plotted together with the 3
experimental data in Fig. 5. The combination of a Pt-Pt scattering component and two Pt-O 4
scattering components was found to adequately reproduce the experimental spectra, as suggested 5
by the observations above. An example of one of the fits, corresponding to the initially-reduced 6
catalyst under methanol oxidation reaction conditions at 25°C, is shown in Fig. 6, with the 7
contributions of the individual scattering components plotted separately in both r-space (Fourier-8
transformed) and k-space. From these fits, the following distances (phase-corrected) were 9
obtained: Pt-Pt (2.76 Å), Pt-O(1) (2.0 Å), and Pt-O(2) (2.5 Å). The remaining fits and relevant fit 10
information are included in Suppl. Figs. S2-S9 and Suppl. Table S1. 11
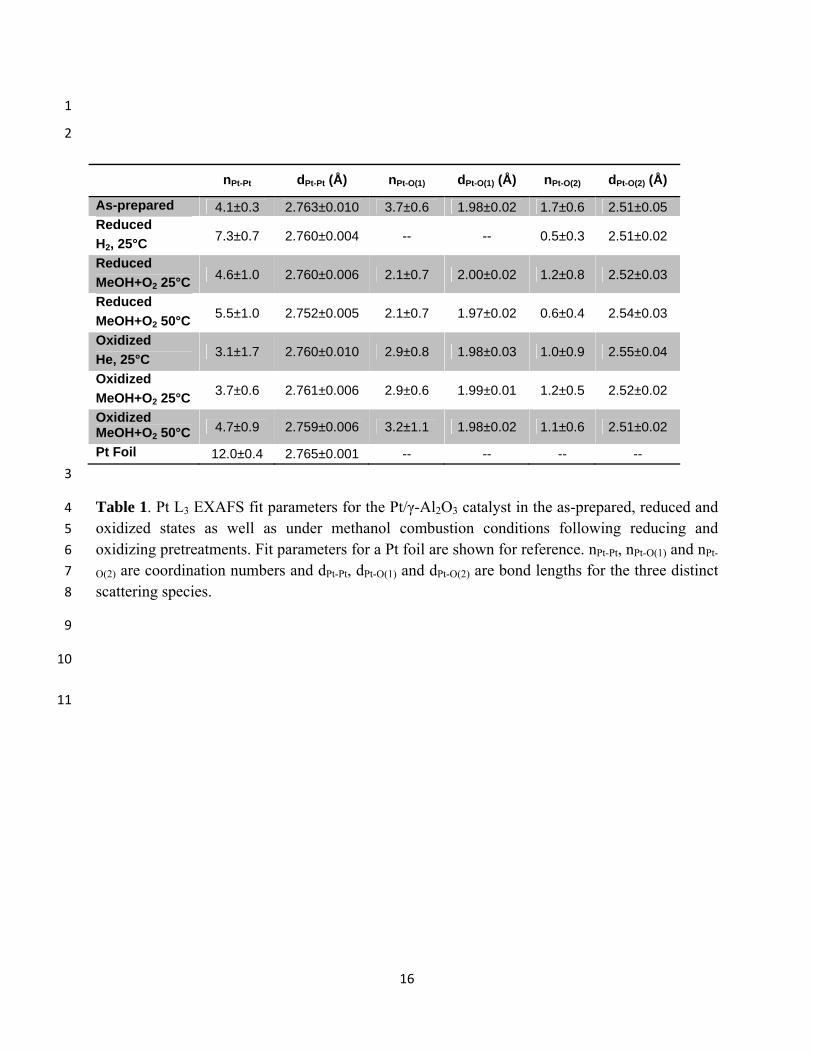
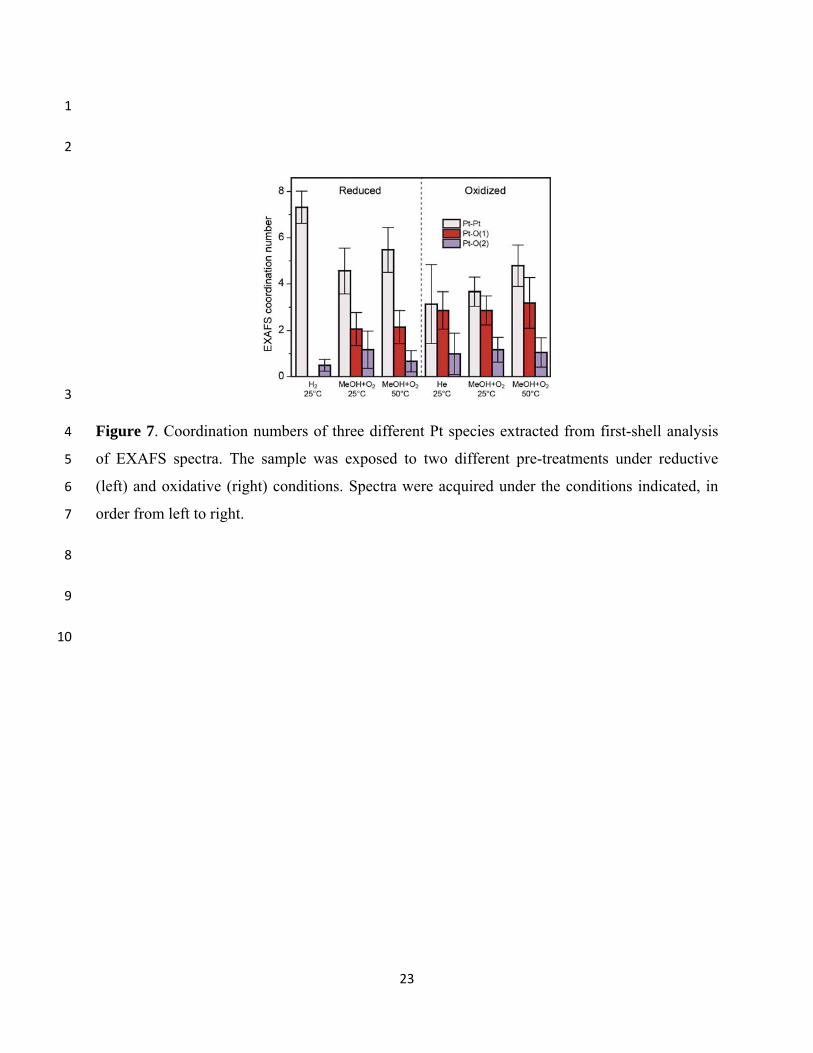
Best fit parameters from the analysis of the EXAFS data are given in Table 1 and the Pt-Pt, 12
Pt-O(1) and Pt-O(2) coordination numbers (CNs) are plotted in Fig. 7. The fitted Pt-Pt CN for 13
the reduced catalyst of ~7 corresponds to particles of ~1 nm in diameter,41,42 which agrees well 14
with the mean particle diameter d measured by STEM, provided that the volume-averaging 15
nature of the XAFS measurement is accounted for by weighting the histogram by d3. Although 16
the particles measured by STEM had a mean diameter of 0.7 nm, the greater contribution of 17
larger particles results in an apparent diameter (volume-weighted) of 0.9 nm. The Pt-O(1) 18
scattering component of the EXAFS spectra, with a bond length of 2.0 Å, is typical of strong 19
platinum-oxygen bonds, and its appearance upon exposure of the reduced catalyst to the reaction 20
mixture and after oxidation treatments, concomitant with a decrease in the Pt-Pt coordination 21
number, indicates that we do not have chemisorbed oxygen on Pt, but the formation of platinum 22
oxides. Consistent with the XANES measurements, more extensive oxidation is observed 23
following the oxygen pre-treatment at 240°C than during exposure of the reduced catalyst to 24
methanol and oxygen at 25°C, and little change in the oxidation state is observed after exposure 25
of the oxidized catalyst to the reactant mixture. Determination of the extent of oxidation and of 26
the stoichiometric ratio of the oxides formed is not straightforward. Since both the XANES and 27
EXAFS spectra give averaged information for the entire sample, it is difficult to distinguish 28
between a mixture of phases and a single phase of intermediate stoichiometry. The persistent 29
presence of a metallic Pt-Pt EXAFS component following oxidative treatments appears to 30
indicate only partial oxidation of the NPs, yielding a structure with an oxide shell around a 31

10
metallic core. Nevertheless, we cannot rule out potential contributions from large grains of Pt in 1
the sample which could be only partially oxidized, while the smaller NPs might be completely 2
oxidized. Although not detected in STEM measurements of this sample, even an extremely small 3
number of grains of only modest diameter (10-20 nm) can potentially make a detectable 4
contribution to the XAFS spectra owing to their much greater volume.24 We note, however, that 5
due to the very low surface-to-volume ratio of such large grains, their contribution to the 6
catalytic activity should in any case be negligible. 7
The Pt-O(2) scattering component, modeled as a platinum-oxygen bond with a length of ~2.5 8
Å, could not be quantified with great accuracy due to its strong overlap with the Pt-Pt and Pt-9
O(1) components, but exclusion of this component led to significantly poorer fits to the EXAFS 10
spectra. The need to include a long Pt-O component in EXAFS spectra of noble metals on 11
various supports has been noted in several previous studies.43-46 Koningsberger and Gates 12
observed such a component in spectra of various catalysts, and assigned it to bonds between 13
platinum atoms and oxide ions of the Al2O3 support, with the unusual length attributed to the 14
presence of hydrogen at the interface.12,43 A theoretical study investigating hydrogenated 15
platinum clusters on γ-Al2O3 appears to support this, showing also drastic NP shape changes and 16
breakage of Pt-substrate bonds upon adsorption of high coverages of hydrogen at the NP/support 17
interface.47 However, we consistently observe this long-bond component more prominently 18
under oxidizing conditions than in the exclusive presence of hydrogen. We interpret its 19
consistent presence under oxidizing conditions as a sign of significant contact area between the 20
NPs and the Al2O3 support surface, possibly due to a modification of the NP shape (flattening) 21
under reaction conditions. The latter is in agreement with data from Markusse et al.12 on C-22
supported NPs which suggested spherical to hemispherical (or flattened) shape transformations 23
when reducing environments were replaced by oxidizing reaction conditions. 24
In agreement with the XANES measurements, which showed a decrease in WL intensity 25
upon raising the reactor temperature to 50°C, we observe an increase in the Pt-Pt coordination 26
number in EXAFS spectra of both the initially-reduced and initially-oxidized catalysts, as would 27
be expected upon either partial reduction of Pt oxides to Pt metal or upon changing the NP shape 28
from a 2D to 3D morphology. Such a transformation would also be expected to lead to a 29

11
decrease in Pt-O(1) and Pt-O(2) coordination numbers, which is not clearly observed, although 1
the latter changes may be within the uncertainty of the measurements. 2
3
4. Discussion 4
Our experiments reveal that Pt NP/γ-Al2O3 catalysts exhibit a complex behavior in the 5
oxidation of methanol which is substantially different from that of bulk Pt. Over pure Pt wire 6
catalysts, McCabe and McCready48 found that methanol oxidation exhibited similar reaction 7
kinetics to CO oxidation, which is characterized by CO-saturated surfaces and low activity at 8
low temperatures, versus oxygen-saturated surfaces and high activity at high temperature. It was 9
therefore proposed that methanol oxidation over Pt proceeds through a strongly-bound 10
intermediate such as CO, which prevents adsorption of O2 and thus limits the rate at low 11
temperature. This is similar to what has been observed for electrochemical methanol oxidation 12
over Pt/C catalysts, where poisoning of the Pt anode surfaces with CO has been directly observed 13
and found to cause large overpotentials in the reaction.9 However, such poisoning does not seem 14
to occur in our experiments, since according to Safonova et al.,49 a significant shift and 15
broadening to higher energy of the Pt-L3 white line is expected upon adsorption of CO, which 16
was not observed in our data. In our experiments, XANES measurements indicate that under 17
reaction conditions at 25°C, the platinum catalyst is in an oxygen-rich state qualitatively similar 18
to that of the pre-oxidized sample, regardless of the pretreatment. 19
In addition, the observation of methyl formate as the main partial oxidation product is 20
consistent with a different mechanism for MeOH oxidation over highly dispersed Pt NPs/Al2O3
21
as compared to pure Pt.50,51 In particular, over pure Pt catalysts the main partial oxidation 22
product was formaldehyde, and was only formed in small yields.48,52 For Pd/Al2O3 catalysts, 23
methyl formate has been observed to be the only product over PdO surfaces53. Methyl formate 24
production could occur through different reaction paths involving surface formate species 25
(HCHO).53 Our high selectivity toward CO2 at moderate temperatures suggests that the oxidation 26
of formate species is faster than the condensations of absorbed methoxide with HCHO, 27
dimerization of HCHO, or esterification of formic acid (HCOOH) intermediates. 53 28

12
Furthermore, the oxidation state effect seems to be even complex, and system dependent. For 1
example, in methanol oxidation reactions over high surface area palladium catalysts (Pd/Al2O3), 2
the reverse trend to what we observed was reported, with a higher catalytic activity53,54 (up to 40 3
times) and a lower selectivity toward methyl formate53 being detected for the reduced Pd 4
catalysts as compared to PdO. Moreover, the methanol oxidation turnover frequency was shown 5
to be significantly lower for smaller Pd NPs53 due to stronger binding of chemisorbed oxygen 6
resulting in higher O coverages and the blockage of active sites.55 A similar size-dependent 7
binding was also reported for the O-Pt system,56-58 but no poisoning due to chemisorbed oxygen 8
was observed in our study since both the initially reduced and initially oxidized samples were 9
found to become/remain oxidized in the presence of the reactants (evident from the decrease in 10
Pt-Pt coordination number and increase in Pt-O), and the sample with the highest content of 11
oxygen (pre-oxidized) was also found to be the most active. 12
Nevertheless, although XANES and EXAFS measurements indicate that in both cases the 13
samples are oxidized under reaction conditions, our experiments show clearly that the initial 14
oxidation state of the Pt NPs has a strong effect on the catalysts’ low-temperature reactivity, and 15
that a greater degree of oxidation leads to larger reaction rates. The results of the EXAFS 16
analysis displayed in Fig. 7 reveal a higher degree of oxidation (larger contribution of the Pt-17
O(1) bond) for the pre-oxidized NPs under reactant exposure at 25°C and 50°C. The latter 18
finding is in accord with previous results by Markusse et al.12 revealing more extensive catalyst 19
oxidation under aqueous alcohol oxidation reaction conditions after an oxidative catalyst start-up 20
versus a reductive start-up. 21
It should be mentioned that in our case the pre-oxidized catalyst cannot be considered a true 22
oxygen reservoir, since the amount of oxygen stored in the form of Pt oxide is insignificant as 23
compared to the oxygen consumed during the reaction. Therefore, if any constituents of the 24
catalysts’ lattice (in this case oxygen) leave the NP surface as part of the reaction products, they 25
should be subsequently replenished by the oxygen reactant in the gas stream following a Mars-26
van-Krevelen process.59 On the other hand, a Langmuir–Hinshelwood (L-H) mechanism in 27
which the reactants both adsorb on the NP surface and then react has also been observed, mainly 28
on reduced metal surfaces,60,61 but also on some metal oxide surfaces (e.g. RuO2)62,63. 29
Furthermore, in numerous previous studies the drastic differences in reactivity observed for 30

13
oxidized versus reduced catalyst have been attributed to the onset of one of the former distinct 1
reaction mechanisms. For instance, in CO oxidation reactions over Pd catalysts it has been 2
shown that the Langmuir–Hinshelwood mechanism takes place over reduced Pd surfaces, but 3
with a lower activity as compared to oxidized surfaces following Mars-van-Krevelen (MvK) 4
processes.60,64 Similar behavior has also been reported for Pt, showing higher activity for the 5
oxidized catalyst during CO oxidation.14,15,65 Nevertheless, the NP/support interface and oxygen 6
or hydroxyl exchange between the metal NP phase and the oxide support might also need to be 7
considered.66,67 8
In our case, the difference in reactivity between the pre-oxidized and pre-reduced catalysts 9
cannot be attributed to a distinct reaction mechanism taking place over reduced versus oxidized 10
Pt surfaces (e.g. MvK vs. LH), since our operando spectroscopic characterization (XANES and 11
EXAFS) revealed that both catalysts are oxidized under reaction conditions. In contrast, our 12
operando data indicate that the catalytic activity of the NPs is influenced not only by the 13
presence of oxide overlayers, but also by their precise structure, chemical composition, and 14
possibly also thickness, which likely differ due to the difference in temperature during the initial 15
oxygen exposure (240°C in the case of the pre-oxidized catalyst, 25°C in the case of the pre-16
reduced catalyst). This is in line with previous studies showing that the catalytic activities of 17
different PtOx phases vary substantially. For example, theoretical calculations by Seriani et al.68 18
showed that while PtO and PtO2 layers on Pt surfaces are inert towards CO and CH4 oxidation, a 19
Pt3O4 surface can be highly active for these reactions. Other studies have shown that Pt oxides 20
with higher oxidation states such as PtO2 or Pt(OH)3 could act as poisonous species for primary 21
alcohol oxidation (e.g. methanol), while lower oxidation states such as PtO and Pt(OH) were 22
identified as active species.69 Unfortunately, EXAFS cannot be used to distinguish the different 23
PtOx phases, since they are all characterized by a nearly identical Pt-O distance of ~2 Å. 24
The differences in the XANES peak intensity and position observed between the as-prepared 25
NPs (PtO2-rich) and those measured under reaction conditions [Fig. 4(a)] can serve as guidance 26
to distinguish different chemical states of Pt in PtOx compounds. In particular, the XANES 27
spectra of our catalyst under reaction conditions and after the oxidative pretreatment exhibit 28
white lines which are significantly less intense than that of the as-prepared sample, measured 29
following a 24-h calcination at 375°C. The drastic difference in intensity, despite substantial Pt 30
14
oxide formation under reaction conditions at 25°C and in oxygen at 240°C, is an indication that 1
the oxides formed under these conditions consist primarily of Pt in a 2+ oxidation state, while the 2
prolonged higher-temperature treatment (375°C) likely produces Pt in the 4+ oxidation state. 3
Such self-limiting oxidation of Pt NPs at low temperatures (and also at low potentials under 4
electrochemical conditions38) has been observed in a number of studies to date. Considering that 5
the thermodynamically favored, well-ordered PtO2 phase has been found to be catalytically inert 6
for a number of reactions, the existence of partially oxidized species (e.g. PtO) appears to be an 7
important element in the high oxidation activities observed for certain catalytic reactions.20 8
Furthermore, XANES data acquired at 50°C on the pre-reduced sample (Fig. 4b) revealed a 9
significant decrease in the WL intensity, not observed on the pre-oxidized sample, which might 10
be either assigned to a more facile reduction of PtOx species, or to the loss of chemisorbed 11
oxygen species. Since no significant changes are observed in the Pt-Pt and Pt-O(1) EXAFS 12
components upon heating the sample to 50°C, a removal of chemisorbed species (which should 13
have a weaker overall effect on the EXAFS coordination numbers) appears more likely. 14
Nevertheless, it should be noted that the measured catalytic activity of such sample is still lower 15
than that of the pre-oxidized counterpart. 16
Recent theoretical and experimental studies of methanol oxidation over Pd catalysts assigned 17
the most active Pd species to either metallic Pd or a thick and well-ordered PdO structure, with 18
catalysts containing only one layer of oxide having higher reaction barriers and lower 19
reactivity.70 According to our operando spectroscopic data, it is plausible that a better-ordered 20
oxide layer (likely PtO) might be present in the pre-oxidized sample, while a thinner surface 21
oxide layer might exist under reactant exposure on the reduced sample. This might be 22
responsible for the initially higher activity observed for our oxidized sample as compared to the 23
reduced sample. 24
In summary, our study highlights the importance of the specific chemical structure (Pt 25
coordination environment and degree of disorder) and thickness of the oxidic species formed on 26
NPs after different sample pre-treatments as well as directly under operando reaction conditions 27
for oxidative catalytic reactions. 28
29
15
Conclusions 1
We have investigated the chemical state of micelle-synthesized Pt NPs supported on γ-Al2O3 2
under methanol oxidation reaction conditions. Reactivity measurements following oxidative and 3
reductive pretreatments show clear differences at low temperature, with an enhanced reactivity 4
of the oxygen pre-treated NPs. The most highly active NPs are shown by XANES and EXAFS 5
measurements to consist predominantly of platinum oxides. Similar measurements of the pre-6
reduced catalyst show that metallic NPs are also partially oxidized upon exposure to the reactants 7
at room temperature, but with a different structure than those formed in the oxidative 8
pretreatment at 240°C, which makes them less active and less stable. Our study supports the 9
notion that platinum oxides enhance the activity of oxidation catalysts at low temperature, but 10
reveals some subtleties regarding the precise nature of the oxides formed which are key for the 11
understanding of the reactivity trends observed. In particular, our work illustrates the importance 12
of operando studies in order to gain fundamental insight into structure, chemical state and 13
reactivity correlations of nanoscale catalysts. 14
15
Acknowledgements 16
The authors would like to acknowledge Anatoly I. Frenkel (Yeshiva University) for 17
assistance with the evaluation of the XAFS data and to Nebojsa Marinkovic (BNL) for his 18
excellent beamline support. This work has been made possible thanks to the financial support of 19
the Office of Basic Energy Sciences of the US Department of Energy under grants DE-FG02-20
08ER15995 (BRC) and DE-FG02-03ER15476 (JCY). Support to beamline X18B at NSLS-BNL, 21
where the XAFS experiments were conducted, was provided by DOE’s Synchrotron Catalysis 22
Consortium (DE-FG02-05ER15688) and DOE-BES (DE-AC02-98CH10866). NFCF at 23
University of Pittsburgh is acknowledged for the use of JEM 2100F. 24
25
16
1
2
nPt-Pt dPt-Pt (Å) nPt-O(1) dPt-O(1) (Å) nPt-O(2) dPt-O(2) (Å)
As-prepared 4.1±0.3 2.763±0.010 3.7±0.6 1.98±0.02 1.7±0.6 2.51±0.05 Reduced
H2, 25°C 7.3±0.7 2.760±0.004 -- -- 0.5±0.3 2.51±0.02
Reduced
MeOH+O2 25°C 4.6±1.0 2.760±0.006 2.1±0.7 2.00±0.02 1.2±0.8 2.52±0.03
Reduced
MeOH+O2 50°C 5.5±1.0 2.752±0.005 2.1±0.7 1.97±0.02 0.6±0.4 2.54±0.03
Oxidized
He, 25°C 3.1±1.7 2.760±0.010 2.9±0.8 1.98±0.03 1.0±0.9 2.55±0.04
Oxidized
MeOH+O2 25°C 3.7±0.6 2.761±0.006 2.9±0.6 1.99±0.01 1.2±0.5 2.52±0.02
Oxidized MeOH+O2 50°C 4.7±0.9 2.759±0.006 3.2±1.1 1.98±0.02 1.1±0.6 2.51±0.02
Pt Foil 12.0±0.4 2.765±0.001 -- -- -- --
3
Table 1. Pt L3 EXAFS fit parameters for the Pt/γ-Al2O3 catalyst in the as-prepared, reduced and 4
oxidized states as well as under methanol combustion conditions following reducing and 5
oxidizing pretreatments. Fit parameters for a Pt foil are shown for reference. nPt-Pt, nPt-O(1) and nPt-6
O(2) are coordination numbers and dPt-Pt, dPt-O(1) and dPt-O(2) are bond lengths for the three distinct 7
scattering species. 8
9
10
11
17
1
2
Figure 1. (a) AFM image of the Pt-loaded PS-b-P2VP micellar precursor used to prepare the 3
Pt/γ-Al2O3 catalyst used in this study. Micelles were dip-coated onto an SiO2/Si(111) wafer for 4
imaging; polymer ligands were not removed. (b) Pt-4d XPS spectrum of the as-prepared 5
(calcined) Pt/γ-Al2O3 catalyst. Binding energies expected for Pt, PtO and PtO2 are indicated. (c) 6
HAADF-STEM image of the Pt/γ-Al2O3 catalyst after ligand removal and after operando XAFS 7
measurements. (d) Particle size distribution extracted from HAADF-STEM measurements. 8
9
10

18
1
2
3
Figure 2. Reactivity of the undiluted Pt/γ-Al2O3 catalyst for methanol oxidation following (a) 4
reductive (240 °C in 50% H2 for 30 mins.) and (b) oxidative (240 °C in 70% O2 for 30 mins.) 5
pretreatments. Conversion refers to the molar fraction of methanol in the feed converted to a 6
particular product. Plotted points are individual measurements and solid curves are guides to the 7
eye. Carbon dioxide (CO2) and methyl formate (CHOOCH3) were the only products detected in 8
significant quantities. All data shown correspond to steady-state reaction conditions at each 9
given temperature. 10
11
19
1
2
Figure 3. Reactivity of the diluted Pt/γ-Al2O3 catalyst for methanol oxidation. Reactivity 3
following (a) reductive, and (b) oxidative pretreatments, measured with increasing temperature. 4
(c) Reactivity following reductive and oxidative pretreatments, measured with decreasing 5
temperature following the measurements shown in (a) and (b). 6
7
20
1
Figure 4. Pt-L3 XANES spectra of a Pt/γ-Al2O3 catalyst acquired following oxidative and 2
reductive pretreatments and under methanol oxidation conditions after these pretreatments. (a) 3
Comparison of spectra acquired under reaction conditions at room temperature beginning in the 4
reduced state (treated in H2 at 240°C) and an oxidized state (treated in O2 at 240°C), 5
respectively. XANES spectra acquired of the as-prepared (oxidized) catalyst and of a bulk Pt foil 6
are shown for reference. (b) Comparison of spectra acquired under reaction conditions at 7
different temperatures. 8

21
1
Figure 5. Fourier-transformed k2-weighted EXAFS spectra of the Pt/γ-Al2O3 catalyst after 2
reduction, oxidation and under MeOH oxidation reaction conditions following the two 3
pretreatments leading to the oxidation and reduction of the catalysts. Shown also are first-shell 4
fits to the experimental data using a combination of three scattering components, as described in 5
the text. A Hanning window from 2.5 to 13 Å-1 with Δk=1 Å-1 was used to compute the Fourier 6
transforms. The data are vertically displaced for clarity. 7
8

22
1
2
Figure 6. (a) Fourier –transformed (k=2.5-15.5 Å-1) EXAFS spectrum of the initially-reduced 3
catalyst measured at 25°C in MeOH+O2. The fitted spectrum as well as the magnitudes of the 4
three contributing scattering components corresponding to metallic Pt, a Pt-O(1) bond at ~2.0 Å, 5
and Pt-O(2) at ~2.5 Å are also shown. (b) Inverse-Fourier-transformed (R=1.2-3.2 Å) EXAFS 6
spectrum corresponding to that in (a). 7
8
23
1
2
3
Figure 7. Coordination numbers of three different Pt species extracted from first-shell analysis 4
of EXAFS spectra. The sample was exposed to two different pre-treatments under reductive 5
(left) and oxidative (right) conditions. Spectra were acquired under the conditions indicated, in 6
order from left to right. 7
8
9
10
24
1
2
3
4
5
6
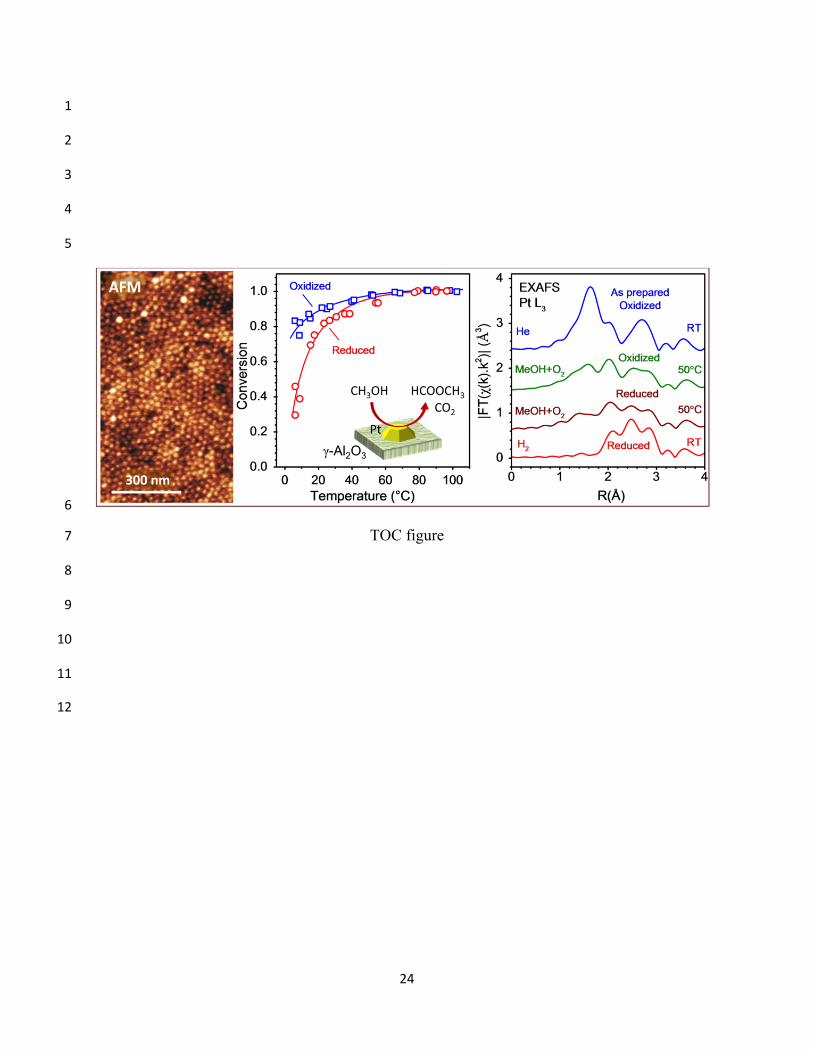
TOC figure 7
8
9
10
11
12

25
References 1
2
3
(1) Lefferts, L.; van Ommen, J. G.; Ross, J. R. H. Appl. Catal. 1986, 23, 385. 4 (2) Nagy, A.; Mestl, G. Appl. Catal. A 1999, 188, 337. 5 (3) Guerreiro, E. D.; Gorriz, O. F.; Larsen, G.; Arrúa, L. A. Appl. Catal. A 2000, 204, 33. 6 (4) Wittstock, a.; Zielasek, V.; Biener, J.; Friend, C. M.; Bäumer, M. Science 2010, 327, 319. 7 (5) Spivey, J. J. Ind. Eng. Chem. Res. 1987, 26, 2165. 8 (6) Sharma, R. K.; Zhou, B.; Tong, S.; Chuane, K. T.; Tg, A. Ind. Eng. Chem. Res. 1995, 34, 9 4310. 10 (7) Gandhi, H. S.; Graham, G. W.; McCabe, R. W. J. Catal. 2003, 216, 433. 11 (8) Tatibouët, J. M. Appl. Catal. A 1997, 148, 213. 12 (9) Iwasita, T. Electrochim. Acta 2002, 47, 3663. 13 (10) Lamy, C.; Lima, A.; LeRhun, V.; Delime, F.; Coutanceau, C.; Léger, J.‐M. J. Power Sources 14 2002, 105. 15 (11) Mallat, T.; Baiker, A. Chem. Rev. 2004, 104, 3037. 16 (12) Markusse, A. P.; Kuster, B. F. M.; Koningsberger, D.; Marin, G. B. Catal. Lett. 1998, 55, 17 141. 18 (13) Nicoletti, J. W.; Whitesides, G. M. J. Phys. Chem. 1989, 93, 759. 19 (14) Ackermann, M. D.; Pedersen, T. M.; Hendriksen, B. L. M.; Robach, O.; Bobaru, S. C.; 20 Popa, I.; Quiros, C.; Kim, H.; Hammer, B.; Ferrer, S.; Frenken, J. W. M. Phys. Rev. Lett. 2005, 95, 255505. 21 (15) Hendriksen, B. L. M.; Frenken, J. W. M. Phys. Rev. Lett. 2002, 89, 2. 22 (16) Li, W.‐X. J. Phys.: Condens. Matter 2008, 20, 184022. 23 (17) Mallens, E. P. J.; Hoebink, J. H. B. J.; Marin, G. B. Catal. Lett. 1995, 33, 291. 24 (18) Gao, F.; Wang, Y.; Cai, Y.; Goodman, D. W. J. Phys. Chem. C 2009, 113, 174. 25 (19) McClure, S. M.; Goodman, D. W. Chem. Phys. Lett. 2009, 469, 1. 26 (20) Alayon, E. M. C.; Singh, J.; Nachtegaal, M.; Harfouche, M.; van Bokhoven, J. A. J. Catal. 27 2009, 263, 228. 28 (21) Singh, J.; van Bokhoven, J. A. Catal Today 2010, 155, 199. 29 (22) Croy, J. R.; Mostafa, S.; Heinrich, H.; Roldan Cuenya, B. Catal. Lett. 2009, 131, 21. 30 (23) Mostafa, S.; Behafarid, F.; Croy, J. R.; Ono, L. K.; Li, L.; Yang, J. C.; Frenkel, A. I.; Roldan 31 Cuenya, B. J. Am. Chem. Soc. 2010, 132, 15714. 32 (24) Paredis, K.; Ono, L. K.; Mostafa, S.; Li, L.; Zhang, Z.; Yang, J. C.; Barrio, L.; Frenkel, A. I.; 33 Roldan Cuenya, B. J. Am. Chem. Soc. 2011, 133, 6728. 34 (25) Singh, J.; Nachtegaal, M.; Alayon, E. M. C.; Stotzel, J.; van Bokhoven, J. A. Chemcatchem 35 2010, 2, 653. 36 (26) Roldan Cuenya, B. Thin Solid Films 2010, 518, 3127. 37 (27) Matos, J.; Ono, L. K.; Behafarid, F.; Croy, J. R.; Mostafa, S.; DeLaRiva, A. T.; Datye, A. K.; 38 Frenkel, A. I.; Roldan Cuenya, B. Phys. Chem. Chem. Phys. 2012, 14, 11457. 39 (28) Ravel, B.; Newville, M. J. Synchrotron Rad. 2005, 12, 537. 40 (29) Rehr, J. J.; Albers, R. C. Rev. Mod. Phys. 2000, 72, 621. 41 (30) Ankudinov, A. L.; Bouldin, C. E.; Rehr, J. J.; Sims, J.; Hung, H. Phys. Rev. B 2002, 65, 42 104107 43 (31) Croy, J. R.; Mostafa, S.; Liu, J.; Sohn, Y.‐h.; Roldan Cuenya, B. Catal. Lett. 2007, 118, 1. 44 (32) Kästle, G.; Boyen, H.‐G.; Weigl, F.; Lengl, G.; Herzog, T.; Ziemann, P.; Riethmüller, S.; 45 Mayer, O.; Hartmann, C.; Spatz, J. P.; Möller, M.; Ozawa, M.; Banhart, F.; Garnier, M. G.; Oelhafen, P. 46 Adv. Func. Mater. 2003, 13, 853. 47

26
(33) Roldan Cuenya, B.; Baeck, S.‐H.; Jaramillo, T. F.; McFarland, E. W. J. Am. Chem. Soc. 1 2003, 125, 12928. 2 (34) Damyanova, S.; Bueno, J. M. C. Appl. Catal. A:Gen 2003, 253, 135. 3 (35) Roldan Cuenya, B.; Croy, J. R.; Mostafa, S.; Behafarid, F.; Li, L.; Zhang, Z.; Yang, J. C.; 4 Wang, Q.; Frenkel, A. I. J. Am. Chem. Soc. 2010, 132, 8747. 5 (36) Mansour, A. N.; Sayers, D. E.; Cook, J. W.; Short, D. R.; Shannon, R. D.; Katzer, J. R. J. 6 Phys. Chem. 1984, 88, 1778. 7 (37) Friebel, D.; Miller, D. J.; O'Grady, C. P.; Anniyev, T.; Bargar, J.; Bergmann, U.; Ogasawara, 8 H.; Wikfeldt, K. T.; Pettersson, L. G. M.; Nilsson, A. Phys. Chem. Chem. Phys. 2011, 13, 262. 9 (38) Merte, L. R.; Behafarid, F.; Miller, D. J.; Friebel, D.; Cho, S.; Mbuga, F.; Sokaras, D.; 10 Alonso‐Mori, R.; Weng, T.‐C.; Nordlund, D.; Nilsson, A.; Roldan Cuenya, B. ACS Catal. 2012, 2, 2371. 11 (39) Behafarid, F.; Ono, L. K.; Mostafa, S.; Croy, J. R.; Shafai, G.; Hong, S.; Rahman, T. S.; Bare, 12 S.; Roldan Cuenya, B. Phys. Chem. Chem. Phys. 2012, 14, 11766. 13 (40) Lei, Y.; Jelic, J.; Nitsche, L. C.; Meyer, R.; Miller, J. Top. Catal. 2011, 54, 334. 14 (41) Frenkel, A. I.; Yevick, A.; Cooper, C.; Vasic, R. Annu. Rev. Anal. Chem. 2011, 4, 23. 15 (42) Jentys, A. Phys. Chem. Chem. Phys. 1999, 1, 4059. 16 (43) Koningsberger, D. C.; Gates, B. C. Catal. Lett. 1992, 14, 271. 17 (44) Paredis, K.; Ono, L. K.; Behafarid, F.; Zhang, Z.; Yang, J. C.; Frenkel, A. I.; Roldan Cuenya, 18 B. J. Am. Chem. Soc. 2011, 133, 13455. 19 (45) Vaarkamp, M.; Miller, J. T.; Modica, F. S.; Koningsberger, D. C. J. Catal. 1996, 163, 294. 20 (46) Zhang, Y.; Toebes, M. L.; van der Eerden, A.; O'Grady, W. E.; de Jong, K. P.; 21 Koningsberger, D. C. J. Phys. Chem. B 2004, 108, 18509. 22 (47) Mager‐Maury, C.; Bonnard, G.; Chizallet, C.; Sautet, P.; Raybaud, P. Chemcatchem 2012, 23 3, 200. 24 (48) McCabe, R. W.; McCready, D. F. J. Phys. Chem. 1986, 90, 1428. 25 (49) Safonova, O. V.; Tromp, M.; van Bokhoven, J. A.; de Groot, F. M. F.; Evans, J.; Glatzel, P. 26 J. Phys. Chem. B 2006, 110, 16162. 27 (50) Chantaravitoon, P.; Chavadej, S.; Schwank, J. Chem. Eng. J. 2004, 97, 161. 28 (51) McCabe, R. W.; Mitchell, P. J. Appl. Catal. 1986, 27, 83. 29 (52) Gentry, J.; Jones, A.; Walsh, T.; Sheffield, S. J. Chem. Soc., Faraday Trans. I 1980, 76, 30 2084. 31 (53) Lichtenberger, J.; Lee, D.; Iglesia, E. Phys. Chem. Chem. Phys. 2007, 9, 4902. 32 (54) Brewer, T. F.; Abraham, M. A.; Silver, R. G. Ind. Eng. Chem. Res. 1994, 33, 526. 33 (55) Chou, P.; Vannice, M. A. J. Catal. 1987, 105, 342. 34 (56) Xu, Y.; Shelton, W. A.; Schneider, W. F. J. Phys. Chem. B 2006, 110, 16591. 35 (57) Xu, Y.; Shelton, W. A.; Schneider, W. F. J. Phys. Chem. A 2006, 110, 5839. 36 (58) Ono, L. K.; Croy, J. R.; Heinrich, H.; Roldan Cuenya, B. J. Phys. Chem. C 2011, 115, 16856. 37 (59) Mars, P.; van Krevelen, D. W. Chem. Eng. Sci. 1954, 3, 41. 38 (60) Hendriksen, B. L. M.; Ackermann, M. D.; van Rijn, R.; Stoltz, D.; Popa, I.; Balmes, O.; 39 Resta, A.; Wermeille, D.; Felici, R.; Ferrer, S.; Frenken, J. W. M. Nat. Chem. 2010, 2, 730. 40 (61) Endo, M.; Matsumoto, T.; Kubota, J.; Domen, K.; Hirose, C. Surf. Sci. 1999, 441, L931. 41 (62) Gong, X.‐Q.; Liu, Z.‐P.; Raval, R.; Hu, P. J. Am. Chem. Soc. 2004, 126, 8. 42 (63) Reuter, K.; Frenkel, D.; Scheffler, M. Phys. Rev. Lett. 2004, 93. 43 (64) Lashina, E. A.; Slavinskaya, E. M.; Chumakova, N. A.; Stonkus, O. A.; Gulyaev, R. V.; 44 Stadnichenko, A. I.; Chumakov, G. A.; Boronin, A. I.; Demidenko, G. V. Chem. Eng. Sci. 2012, 83, 149. 45 (65) Jensen, R.; Andersen, T.; Nierhoff, A.; Pedersen, T.; Hansen, O.; Dahl, S.; Chorkendorff, I. 46 Phys. Chem. Chem. Phys. 2013, 15, 2698. 47 (66) Schwartz, W. R.; Pfefferle, L. D. J. Phys. Chem. C 2012, 116, 8571. 48

27
(67) Müller, C. A.; Maciejewski, M.; Koeppel, R. A.; Tschan, R.; Baiker, A. J. Phys. Chem. 1996, 1 100, 20006. 2 (68) Seriani, N.; Pompe, W.; Ciacchi, L. C. J. Phys. Chem. B 2006, 110, 14860. 3 (69) Li, N.‐H.; Sun, S.‐G.; Chen, S.‐P. J. Electroanal. Chem. 1997, 430, 57. 4 (70) Hellman, A.; Resta, A.; Martin, N. M.; Gustafson, J.; Trinchero, A.; Carlsson, P. A.; Balmes, 5 O.; Felici, R.; van Rijn, R.; Frenken, J. W. M.; Andersen, J. N.; Lundgren, E.; Grönbeck, H. J. Phys. Chem. 6 Lett. 2012, 3, 678. 7
8
9