2 ppi trends & challenges, resilience thru infra v2
TRANSCRIPT

1
Trends and Challenges in Building Resilience
through Infrastructure
Philippine Institute for Development StudiesSurian sa mga Pag-aaral Pangkaunlaran ng Pilipinas
www.pids.gov.ph
Adoracion M. NavarroSenior Research Fellow
Pandi, Bulacan28 April 2016
Philippine Press Institute’s Seminar-Workshop on Sustainable Construction Reporting

2
OUTLINE• Suggested Analytical Framework
• Trends in Infrastructure Development
• Challenges in Building Resilience Case Study: Super Typhoon Yolanda PPP Program and Status

3
Analytical Framework
RISK of a country being
adversely affected by external shocks
VULNERABILITY/EXPOSURE
of a country to external shocks
COPING ABILITY/RESILIENCE
• Absorptive• Adaptive• Transformative
Exposure due to structural factors, e.g. geography
Exposure due to bad
policiesGood Policy
Interventions
Risk, Vulnerabilities and Resilience
Source: Llanto 2016
• OECD (2014) pointedly explains that economies with resilient systems are more capable of bearing various environmental, political, economic, and social risks, stresses, and shocks.
• Llanto (2016) stresses that risks are not only limited to disasters, but also economic shocks due to global interconnectedness
• Good economic policies have a large role to play in building the economy’s resilience
• Building resilient infra is also key

Trends in Infrastructure Development
• Infrastructure spending was at 2.38% in 2015
• Further, actual expenditures in 2014 showed that the public infrastructure spending-to-GDP ratio declined to 1.26 percent from 1.98 percent in 2013
• Low disbursements may be attributed to:
• delays due to additional procedures; • additional restrictions on the use of
savings and realignments (i.e. SC ruling on DAP);
• structural weaknesses within the agencies; and
• other reasons that are beyond the control of the agencies. (DBM, 2014)
4
2008 2009 2010 2011 2012 2013 2014 2015
1.79%
2.09%
1.74%
1.41%
1.73%1.98%
1.26%
2.38%
2.34%
2.75%
2.15%1.88%
2.83% 2.81%
1.79%
3.79%
Infrastructure Outlay, % of GDP Capital Outlays, % of GDP
Actual Infrastructure and Other Capital Outlays as % of GDP, 2008-2014
Source: Department of Budget and Management Notes: 2008 to 2014 figures – actual spending; 2015 figures – adjusted obligations.

5
Trends in Infrastructure Development
• Competitive Bidding as the default mode of procurement according to RA 9184.
• Allowable time until issuance of notice to proceed:
• For below P50 M: 113 calendar days• For P50 M and above: 144 calendar days
• However, there are delays in procurement. GPPB-TSO highlights that the most common cause of delays can be traced to the planning stage; also causes failure of bidding.
• Difficulty in setting appropriate ABC• Lapses in details of technical specs
Pre-Procurement Conference
Award of Contract
Advertisement Pre-Bid Conference
Bid Evaluation & Ranking Post-Qualification
Submission of Bids
Opening of 2nd Envelope –
Financial Proposal
Opening of 1st Envelope –
Eligibility Docs & Technical Proposal
Standardized Bidding Procedure for Goods and Infra
Source: Capacity Development Division, GPPB

6
Trends in Infrastructure Development
2000 2001 2002 2003 2004 2005 2006 2007 2008 2009 2010 2011 2012 2013 20140.0
5.0
10.0
15.0
20.0
25.0
30.0
35.0
40.0
BRN; 27.3
IND; 32.6
CMB; 20.9
LAO; 30.1
MYS; 26.0
PHL; 20.8
SGP; 25.4THA; 24.6VNM; 23.8
Gross Capital Formation (as % of GDP): 2000 - 2014
Source: Worldbank Database
• Among ASEAN member states, the Philippines ranks 2nd to the last in terms of gross capital formation (% of GDP) in 2015.

7
Challenges in Building Resilience
Country Risk (%) RankVanuatu 36.5 1Philippines 28.25 2Tonga 28.23 3Guatemala 20.68 4Bangladesh 19.37 5Solomon Islands 19.18 6Costa Rica 17.33 7El Salvador 17.12 8Cambodia 17.12 9Papua New Guinea 16.74 10Timor-Leste 16.41 11Brunei Darussalam 16.23 12Nicaragua 14.87 13Mauritius 14.78 14Guinea-Bissau 13.75 15
Country Exposure (%) RankVanuatu 63.66 1
Tonga 55.27 2
Philippines 52.46 3
Japan 45.91 4
Costa Rica 42.61 5
Brunei Darussalam 41.1 6
Mauritius 37.35 7
Guatemala 36.3 8
El Salvador 32.6 9
Bangladesh 31.7 10
Chile 30.95 11
Netherlands 30.57 12
Solomon Islands 29.98 13
Fiji 27.71 14
Cambodia 27.65 15
Top 15 countries most at risk worldwide, World Risk Report 2014
Top 15 countries most exposed worldwide, World Risk Report 2014
Source: UNU-EHS and Alliance Development Works (2014)
population, conditions of builtup
areas, infra, environmen
tal areas

8
• From 2000-2014, an average of 19 tropical cyclones per year hit the Philippines.
• Almost 8 were typhoons, while the remaining were classified as either tropical storms or tropical depression.
• In 2013, we had the most number of cyclones.
• including one super typhoon (Yolanda)
2000 2001 2002 2003 2004 2005 2006 2007 2008 2009 2010 2011 2012 2013 20140
5
10
15
20
25
30
1817
13
25 25
17
20
13
2122
11
1917
25
15
Tropical Depression Tropical Storm Typhoon Super Typhoon
Total No. of Cyclones, per Category, in the Philippines: 2000-2014
Source: Reyes, C. (2016)
Challenges in Building Resilience

9
• Tropical depression - a tropical cyclone with maximum sustained winds of up to 61 kilometers per hour (kph) or less than 33 nautical miles per hour (knots)
• Tropical storm - a tropical cyclone with maximum wind speed of 62 to 88 kph or 34 - 47 knots
• Severe tropical storm - a tropical cyclone with maximum wind speed of 89 to 117 kph or 48 - 63 knots
• Typhoon - a tropical cyclone with maximum wind speed of 118 to 220 kph or 64 - 120 knots
• Super typhoon - a tropical cyclone with maximum wind speed exceeding 220 kph or more than 120 knots.

10
Storms; 51.3
Flood; 31.9
Landslide; 6.4
Volcano; 4.6
Earthquake; 4.1
Other; 1.7
Frequency
Storm; 78.7
Earthquake; 7.9
Flood; 5.9
Landslide; 5.6
Other; 2
Mortality
Storm; 79.0
Flood; 17.3
Earthquake; 2.2
Other; 1.5
Economic Impacts
Frequency and Impacts of Disasters in the Philippines, 1990-2014
Source: The OFDA/CRED - International Disaster Database
• Cyclones/storms are the most frequent disaster in the county, which account for the highest mortalities and the most adverse economic impacts.
Challenges in Building Resilience

11
Case of Super Typhoon Yolanda• Super Typhoon Yolanda
• 8 November 2013• Affected Regions VI-B, VI, VII, and
VIII
• Casualties• 6,300 deaths, 28,688 injured,
1,062 missing
• Total Damaged houses: 1,140,332• 550,928 totally• 589,404 partially
• Total Infrastructure damage is 9.584B
Track of Super Typhoon Yolanda
Sour
ce: h
ttp:/
/goo
.gl/j
HtM
9a
12
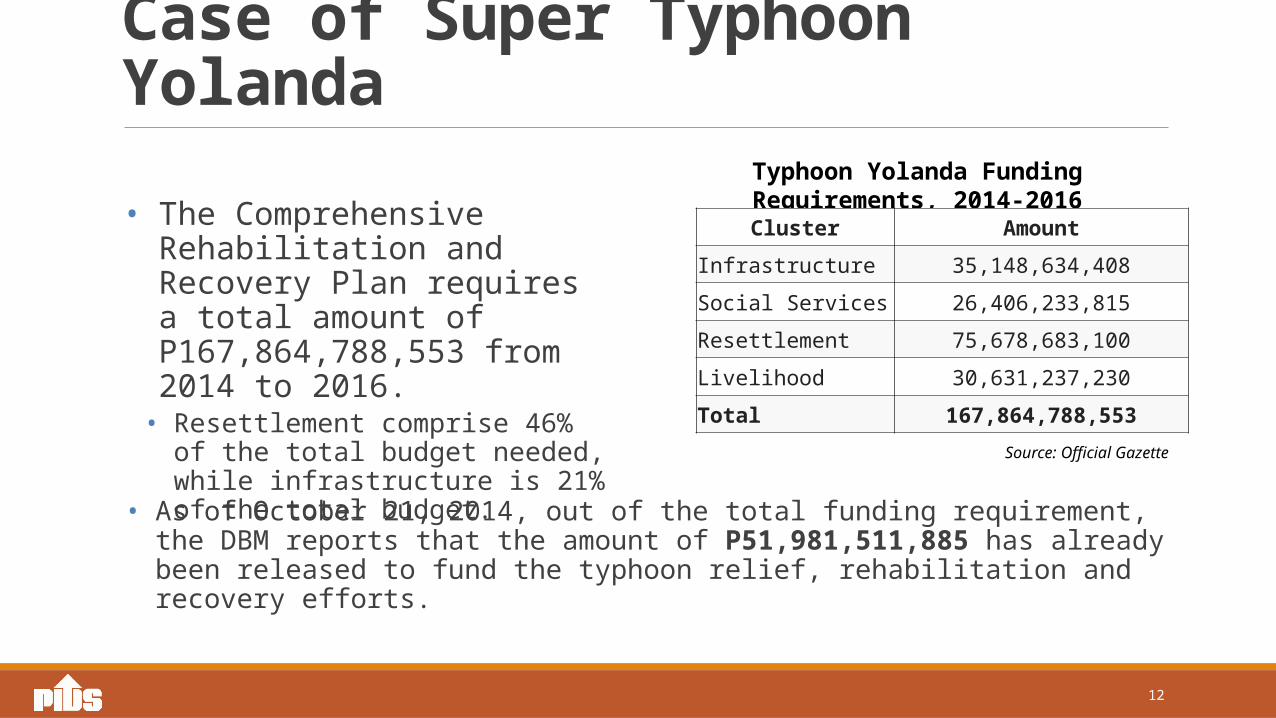
Case of Super Typhoon Yolanda• The Comprehensive Rehabilitation
and Recovery Plan requires a total amount of P167,864,788,553 from 2014 to 2016.
• Resettlement comprise 46% of the total budget needed, while infrastructure is 21% of the total budget.
Source: Official Gazette
Typhoon Yolanda Funding Requirements, 2014-2016
• As of October 21, 2014, out of the total funding requirement, the DBM reports that the amount of P51,981,511,885 has already been released to fund the typhoon relief, rehabilitation and recovery efforts.
Cluster Amount
Infrastructure 35,148,634,408
Social Services 26,406,233,815
Resettlement 75,678,683,100
Livelihood 30,631,237,230
Total 167,864,788,553

13
Government Response: Infrastructure Cluster
Agency Project Total Physical Target Completed On Going Pre-Procurement/
Procurement Stage
DPWH
National Roads (in km) 106.7 60.286 38.415 7.346
Bridges (in km) 1852.53 1117.64 640.09 94.8
Access Roads (in km) 1.7 1.7 - -
Flood Control (no. of projects) 110 77 17 8
DPWH Buildings (no. of buildings) 48 36 11 1
Reconstruction of Municipal Facilities (no. of buildings) 25 2 14 9
DepEdNew Construction (no. of projects) 2,313 1,026 928 359
Rehabilitation (no. of projects) 17,335 5,457 4,239 3484
School Furniture (no. of furnitures) 292,166 121,950 0 170,216
DILG Repair/rehabilitationof partially-damaged LGU Facilities (no. of projects) 309 292 no data no data
CHED SUCs (no. of projects) 606 412 191 3Source: DPWH, 2015
Summary of Accomplishments, as of September 15, 2015

14
Government Response: Resettlement ClusterSummary of Accomplishments, as of 5 November 2015• NHA
• Completed: 17,641 permanent housing units• Currently on-going: 42,566 permanent housing units• With funding: 74,385 permanent housing units
• Target completion is December 2016
• DSWD• 92,554 housing constructions funded
• 987,545 out of 1,028,329 families with damaged houses were given Emergency Shelter Assistance (ESA)
• On going: 40,784 families with damaged houses are covered and will be given Emergency Shelter Assistance (ESA)
Source: NHA, 2015Note: This is a photo of Brgy. San Isidro, Tacloban City
Source: NHA, 2015Note: This is a photo of Brgy. Sacme, Tanuan, Leyte.

15
The challenge of sustaining the PPP Program• Public-Private Partnership
• As of 11 January 2016, there are 12 awarded PPP projects, for a total of Php 217.4 billion
• Three (3) completed projects:• Muntinlupa-Cavite Expressway• Automated Fare Collection system• PPP for School Infrastructure – Phase 1
• Two (2) more expected to be completed before end of Aquino administration:
• NAIA Expressway – Phase 2• PPP for School Infrastructure – Phase 2
No. Project Amount (in Billion Php)
1 Daang Hari-SLEX Link Road 2.012 PPP School Infrastructure Phase 1 16.433 NAIA Expressway (Phase II) Project 15.864 PPP for School Infrastructure Phase 2 3.86
5 Modernization of Philippine Orthopedic Center 8.69
6 Automatic Fare Collection System (AFCS) 1.72
7 Mactan-Cebu International Airport Passenger Terminal Building 17.52
8 LRT Line 1 Cavite Extension and O&M 64.90
9 Southwest Integrated Transport System (ITS) Project 2.50
10 Cavite-Laguna (CALA) Expressway 55.5111 South Integrated Transport System Project 4.0012 Bulcan Bulk Water Supply Project 24.40 So
urce
: PPP
Cen
ter
Awarded PPP Projects, as of 2016

16
Status of Some PPP ProjectsProject Status
1. NAIA Expressway (Phase II) Project Expected to be completed in 2016; Construction ongoing: 72.69% complete (as of 18 March 2016)
2. PPP for School Infrastructure Phase 2
Expected to be completed in 2016; As of 29 February 2016:
2,035 classrooms (46.57%) completed; 1,295 classrooms (29.63%) with ongoing construction;
and 1,042 classrooms (23.84%) under pre-construction
phases.
3. Modernization of Philippine Orthopedic Center
Megawide letter requesting termination of concession agreement received by DOH on 10 November 2015.
DOH letter of March 3, 2016 confirmed DOH acceptance of Megawide's request for termination
4. Mactan-Cebu International Airport Passenger Terminal Building
As of 29 February 2016:Construction ongoing: 12.48% completed
Sour
ce: P
PP C
ente
r

17
Project Status
5. LRT Line 1 Cavite Extension and O&M
Financial Closure achieved on 11 February 2016; and Ongoing soft renovation and upgrades of LRT Line 1 existing system and other
pre-construction activities.
6. Southwest Integrated Transport System (ITS) Project
Concession Agreement signed on 24 April 2015; and Ongoing pre-construction activities and procurement of independent
consultant (IC).
7. Cavite-Laguna (CALA) Expressway
Contract signed on 10 July 2015; and Ongoing pre-construction activities and procurement of independent
consultant (IC).
8. South Integrated Transport System Project
Contract signed on 26 January 2016; Ongoing Independent Consultant procurement and pre-construction
activities.9. Bulcan Bulk Water Supply Project
Groundbreaking ceremony held on April 15, 2016; and Ongoing pre-construction activities.
Status of Some PPP Projects
Source: PPP Center

18
Postcript on another challenge in media reporting

19
Philippine Institute for Development Studies
Surian sa mga Pag-aaral Pangkaunlaran ng Pilipinas
Service through policy research
WEBSITE: www.pids.gov.ph
FACEBOOK: facebook.com/PIDS.PH
TWITTER: twitter.com/PIDS_PH
Thank you!