2 phase measurement of non-wetting phase trapping
DESCRIPTION
2 Phase Measurement of Non-Wetting Phase Trapping. Stefan Iglauer, Saleh K Al-Mansoori, Christopher H Pentland, Branko Bijeljic, Martin J Blunt. Outline. Why am I up here talking about (oil-brine and air-brine) sand packs? Because of…. the importance of capillary trapping to CO 2 storage - PowerPoint PPT PresentationTRANSCRIPT

Stefan Iglauer, Saleh K Al-Mansoori, Christopher H Pentland, Branko Bijeljic, Martin J Blunt
2 Phase Measurement of Non-Wetting Phase Trapping

2
Outline
Outline
1. Background2. Motivation3. Experimental Overview4. Results5. Future work
Why am I up here talking about (oil-brine and air-brine) sand packs?
Because of…. the importance of capillary trapping to CO2 storage
Application to residual hydrocarbon saturations in producing fields and carbon storage.
3
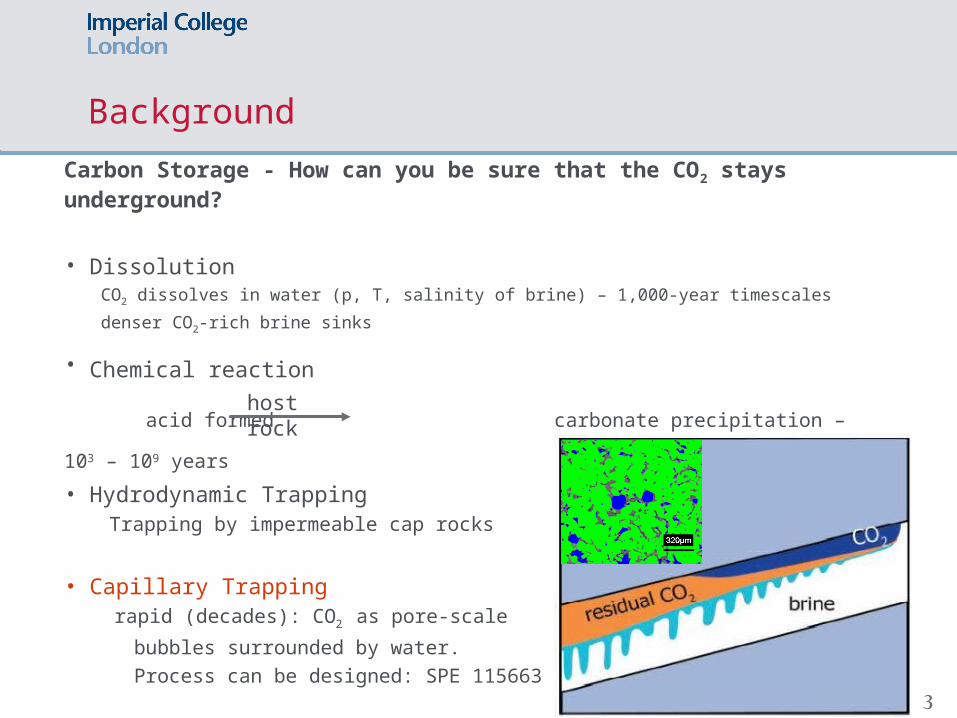
BackgroundCarbon Storage - How can you be sure that the CO2 stays underground?
• Dissolution CO2 dissolves in water (p, T, salinity of brine) – 1,000-year timescales
denser CO2-rich brine sinks
• Chemical reaction acid formed carbonate precipitation – 103 – 109 years • Hydrodynamic Trapping Trapping by impermeable cap rocks
• Capillary Trapping rapid (decades): CO2 as pore-scale
bubbles surrounded by water. Process can be designed: SPE 115663 Qi et al.
host rock
4
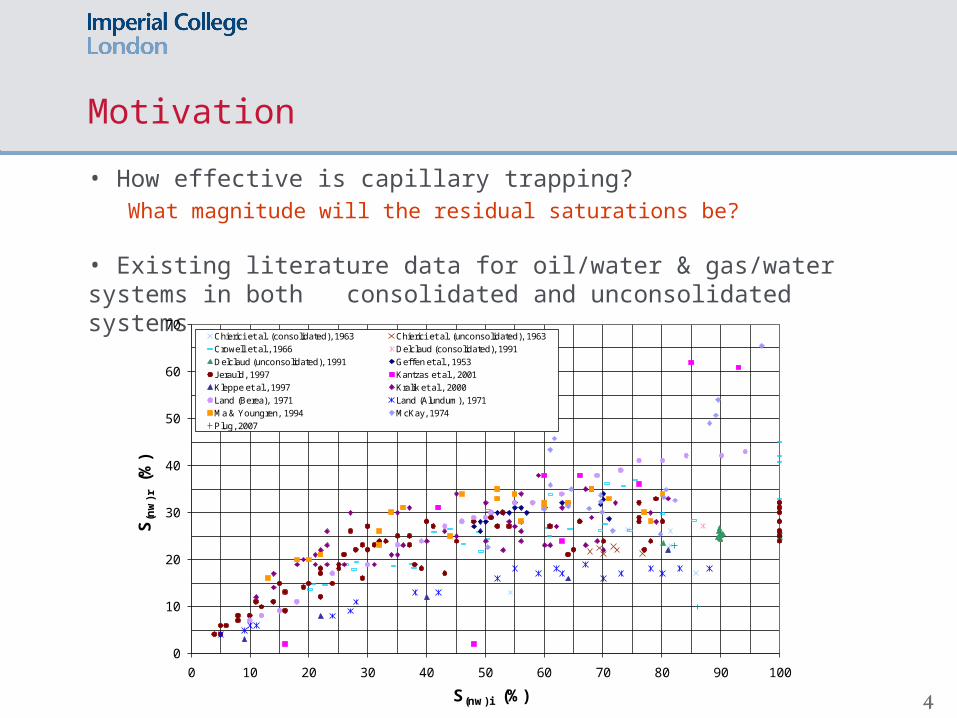
Motivation• How effective is capillary trapping?
What magnitude will the residual saturations be?
• Existing literature data for oil/water & gas/water systems in both consolidated and unconsolidated systems.
0
10
20
30
40
50
60
70
0 10 20 30 40 50 60 70 80 90 100
S (nw
) r(%
)
S(nw) i (%)
Chierici et al. (consolidated), 1963 Chierici et al. (unconsolidated), 1963Crowell et al., 1966 Delclaud (consolidated), 1991Delclaud (unconsolidated), 1991 Gef fen et al., 1953Jerauld, 1997 Kantzas et al., 2001Kleppe et al., 1997 Kralik et al., 2000Land (Berea), 1971 Land (Alundum), 1971Ma & Youngren, 1994 McKay, 1974Plug, 2007
5
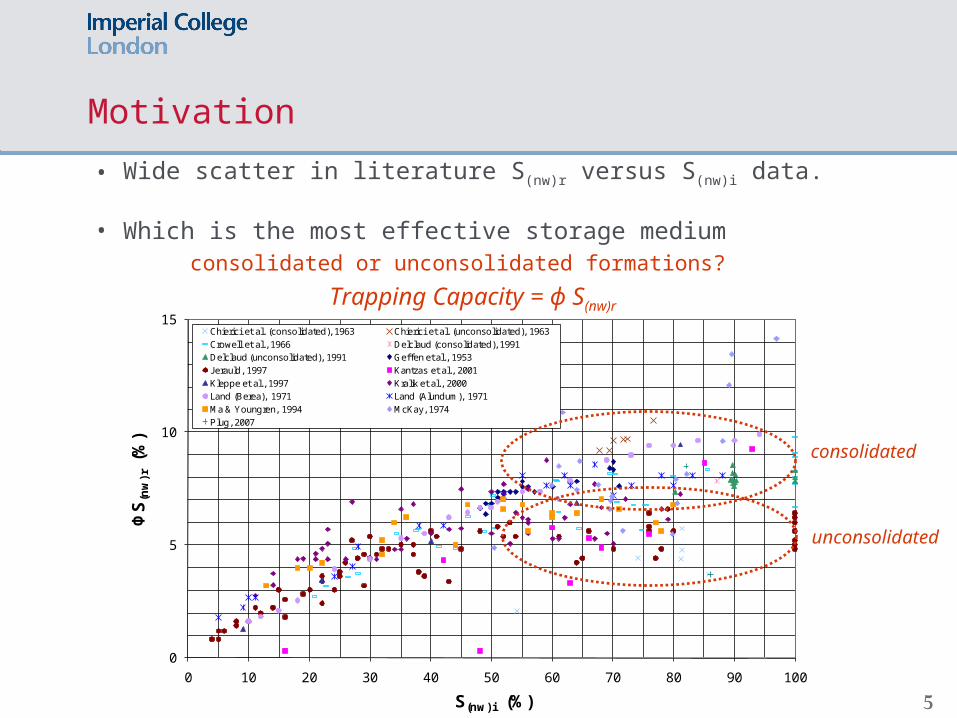
Motivation• Wide scatter in literature S(nw)r versus S(nw)i data.
• Which is the most effective storage mediumconsolidated or unconsolidated formations?
0
5
10
15
0 10 20 30 40 50 60 70 80 90 100
ΦS(n
w) r
(%)
S(nw) i (%)
Chierici et al. (consolidated), 1963 Chierici et al. (unconsolidated), 1963Crowell et al., 1966 Delclaud (consolidated), 1991Delclaud (unconsolidated), 1991 Gef fen et al., 1953Jerauld, 1997 Kantzas et al., 2001Kleppe et al., 1997 Kralik et al., 2000Land (Berea), 1971 Land (Alundum), 1971Ma & Youngren, 1994 McKay, 1974Plug, 2007
consolidated
unconsolidated
Trapping Capacity = ϕ S(nw)r
6
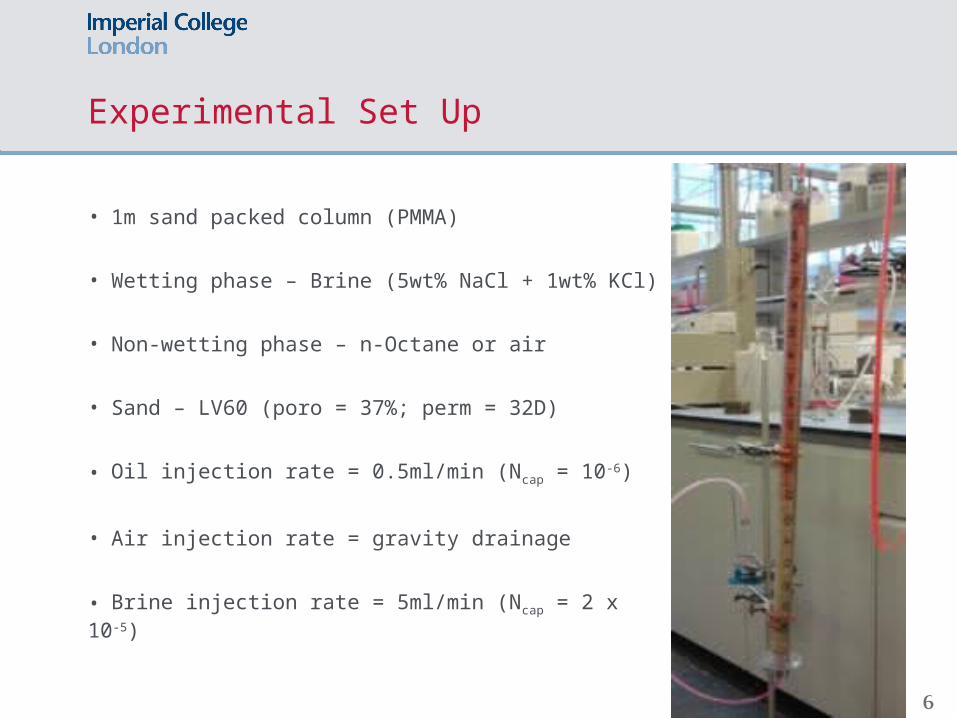
Experimental Set Up
• 1m sand packed column (PMMA)
• Wetting phase – Brine (5wt% NaCl + 1wt% KCl)
• Non-wetting phase – n-Octane or air
• Sand – LV60 (poro = 37%; perm = 32D)
• Oil injection rate = 0.5ml/min (Ncap = 10-6)
• Air injection rate = gravity drainage
• Brine injection rate = 5ml/min (Ncap = 2 x 10⁻⁵)

7
Oil-brine experiments - Experimental Procedure• Pack column with sand
• Packing ratio used to give reproducible porosity
• Fully saturate column with brine
• Known volume of oil injected into the column from the top• Different experiments performed – 30ml, 50ml, 80ml of n-Octane
• Column is inverted and oil rises from the bottom due to density difference• Experiment ended when the first drop of oil reached the top of the column
• Column positioned horizontally & either sliced for Soi or waterflooded to reach Sor.
• Column sliced and sampled. Analysis of saturations in each section done with gas chromatography, GC.
• Thermal Conductivity Detector (TCD) allows water to be analysed
• Repeat (reproducibility)

8
Oil-brine experiments - Experimental Results
0
20
40
60
80
100
0 20 40 60 80 100So (%)
Dis
tanc
e fr
om to
p of
col
umn
(cm
)
Initial oil saturation curves (Soi)
Residual oil saturation curves (Sor) – post
waterfloodingGHGT-9
9
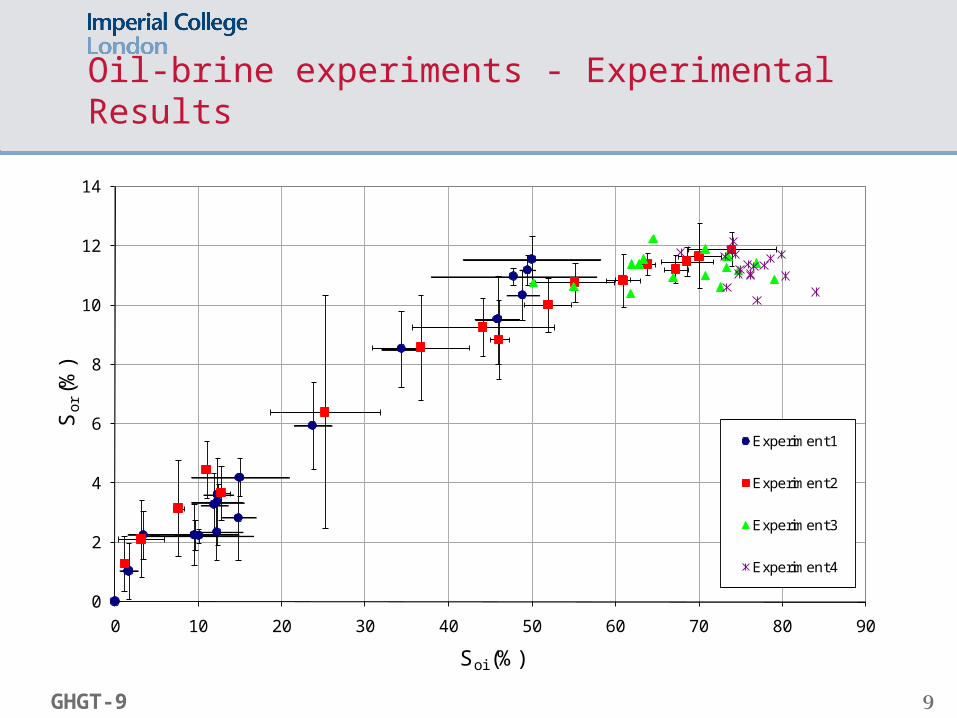
Oil-brine experiments - Experimental Results
0
2
4
6
8
10
12
14
0 10 20 30 40 50 60 70 80 90
Sor
(%)
Soi (%)
Experiment 1
Experiment 2
Experiment 3
Experiment 4
GHGT-9
10
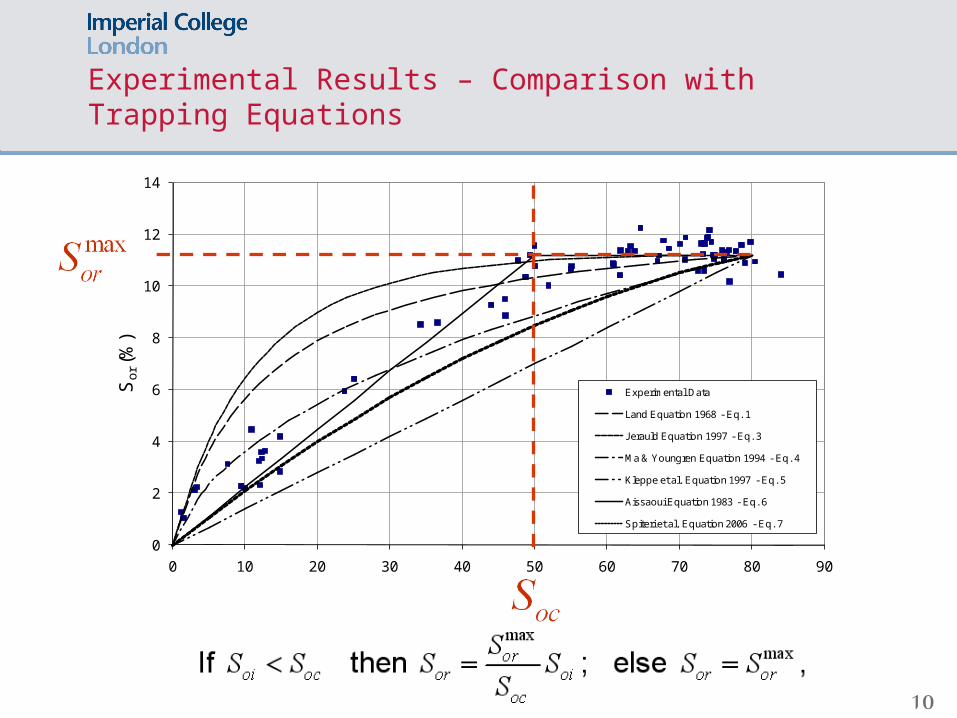
Experimental Results – Comparison with Trapping Equations
0
2
4
6
8
10
12
14
0 10 20 30 40 50 60 70 80 90
Sor
(%)
Soi (%)
Experimental Data
Land Equation 1968 - Eq. 1
Jerauld Equation 1997 - Eq. 3
Ma & Youngren Equation 1994 - Eq. 4
Kleppe et al. Equation 1997 - Eq. 5
Aissaoui Equation 1983 - Eq. 6
Spiteri et al. Equation 2006 - Eq. 7

11
Air-brine experiments - Experimental Procedure
• Pack column with sand• Packing ratio used to give reproducible porosity
• Fully saturate column with brine
• Air enters column by opening top and bottom to atmosphere (gravity drainage)• Draining time was 3 hours and 30 minutes
• Column was either sliced for Sgi or waterflooded (from the bottom) to reach Sgr.
• Column sliced and sampled. Saturation measurement of each section via mass balance.
• Repeat (reproducibility)
12
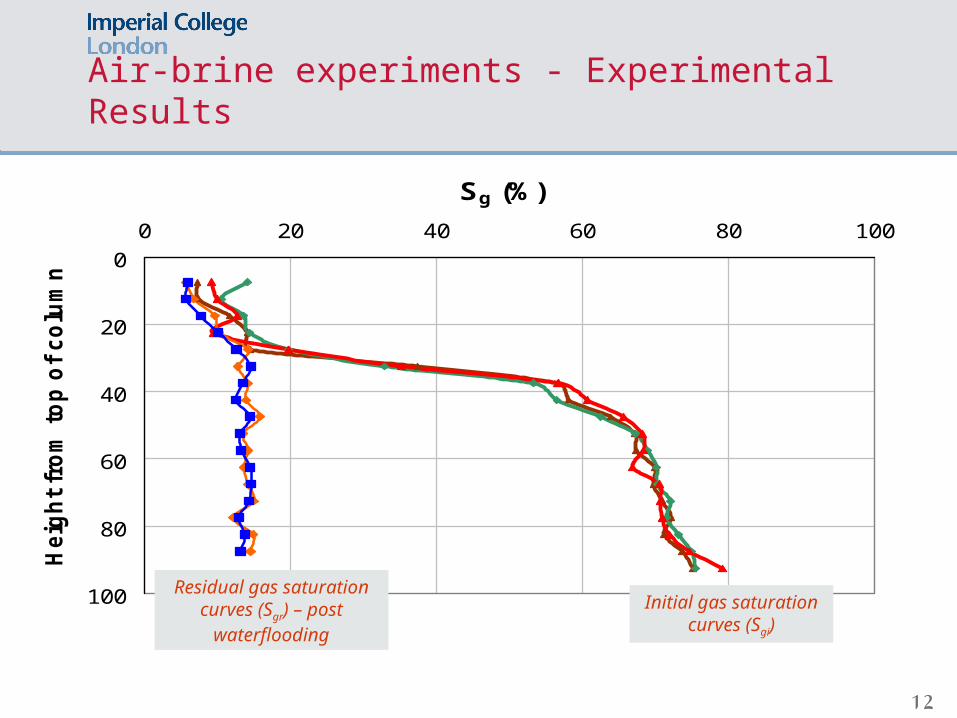
Air-brine experiments - Experimental Results
0
20
40
60
80
100
0 20 40 60 80 100
Sg (%)
Hei
ght f
rom
top
of c
olum
n (c
m)
Residual gas saturation curves (Sgr) – post waterflooding
Initial gas saturation curves
(Sgi)

13
Air-brine experiments - Experimental Results
0
2
4
6
8
10
12
14
16
18
0 10 20 30 40 50 60 70 80Sgi (%)
S gr (
%)
14
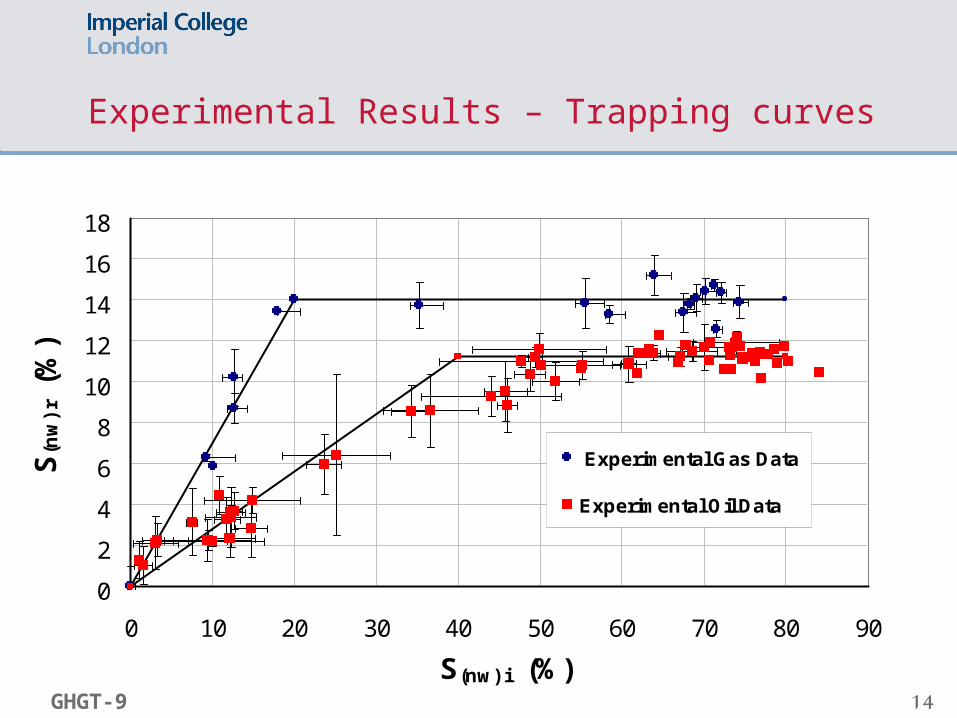
Experimental Results – Trapping curves
GHGT-9
0
2
4
6
8
10
12
14
16
18
0 10 20 30 40 50 60 70 80 90
S(nw) i (%)
S (nw
) r (
%)
Experimental Gas Data
Experimental Oil Data

15
Experimental Results – Comparison with Literature Data
GHGT-9
0
5
10
15
0 10 20 30 40 50 60 70 80 90 100S(nw) i (%)
ΦS (
nw) r
(%
)
Chierici et al. (consolidated), 1963 Chierici et al. (unconsolidated), 1963Crowell et al., 1966 Delclaud (consolidated), 1991Delclaud (unconsolidated), 1991 Geffen et al., 1953Jerauld, 1997 Kantzas et al., 2001Kleppe et al., 1997 Kralik et al., 2000Land (Berea), 1971 Land (Alundum), 1971Ma & Youngren, 1994 McKay, 1974Plug, 2007 Our results (oil-water), 2008Our results (air-water), 2008

16
Future Work
•Consolidated mediaSandstone (started)Carbonates
• Reservoir conditions
• Supercritical carbon dioxide
• Study link between trapping and system variables:Pore size distributionIFT / contact angle

17
Acknowledgements
Shell-Imperial Grand Challenge on Clean Fossil FuelsADNOC
Thank you!

18
Trapping Equations
Equation 1 Land, 1968
Equation 3 Jerauld, 1997
Equation 4 Ma & Youngren, 1994
Equation 5 Kleppe et al., 1997
Equation 6 Aissaoui, 1983
Equation 7 Spiteri et al., 2005
**
*1gi
grgi
SS
C S
*max
1 1gr
CS
where
*max
**
1 1*max *1 1 1 gr
gigr S
gr gi
SS
S S
**
*1
gigr
bgi
SS
a S
maxmaxgi
gr grgi
SS S
S
2or oi oiS S S