2 nd quarter 2002 results presentation a member of the li & fung (retailing) group cra website: ...
TRANSCRIPT

22ndnd Quarter 2002 Results Quarter 2002 ResultsPresentationPresentation
A member of the Li & Fung (Retailing) GroupA member of the Li & Fung (Retailing) Group CRA Website: www.cr-asia.comCRA Website: www.cr-asia.com29 July 200229 July 2002

22
22ndnd Quarter 2002 Results Presentation Age Quarter 2002 Results Presentation Agendanda
22ndnd Quarter 2002 Financial Results Highlights Quarter 2002 Financial Results Highlights
2002 Update & Outlook2002 Update & Outlook
Questions & AnswersQuestions & Answers

33
22nd nd Quarter 2002 Financial Results HighlightsQuarter 2002 Financial Results HighlightsGroup Turnover – 2Group Turnover – 2ndnd Quarter 2002 Quarter 2002
972.91,140.7
1,305.1
326.5 343.4
0
500
1,000
1,500
HK$ Million
1999 Total 2000 Total 2001 Total 2nd Qtr2001
2nd Qtr2002
No. of Stores:No. of Stores: 114 114 123 123 146 146 132 132 151 151
+ 5%+ 5%

44
309.3 290.3
0
100
200
300
400
HK$ Million
2nd Qtr 2001 2nd Qtr 2002
22ndnd Quarter 2002 Financial Results Highlights Quarter 2002 Financial Results Highlights121 Stores Comparative Sales121 Stores Comparative Sales
- 6%- 6%
55
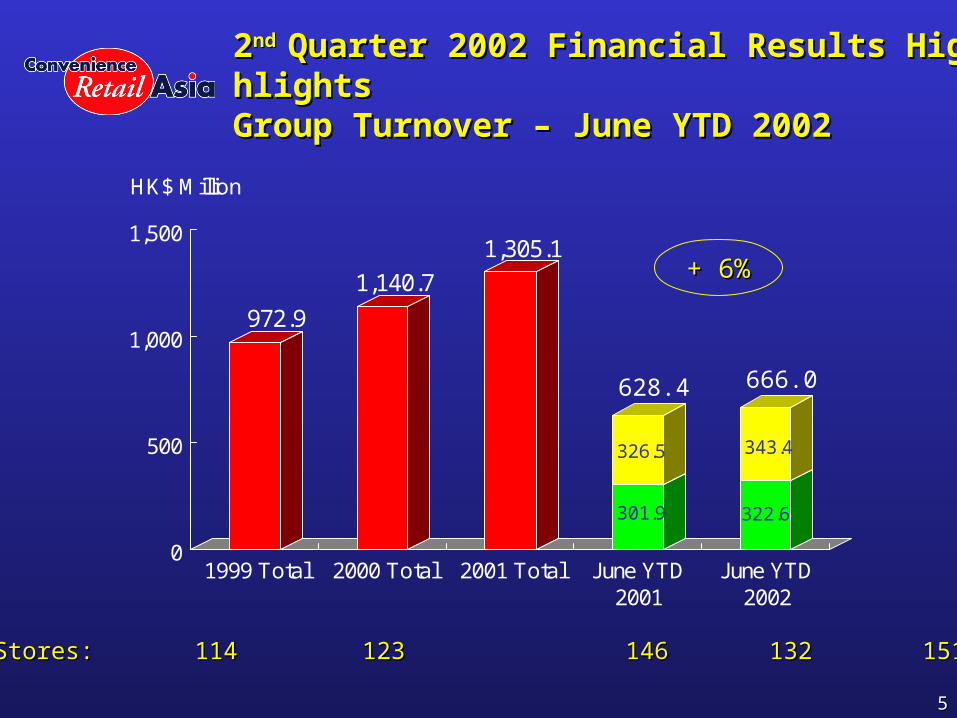
22nd nd Quarter 2002 Financial Results HighlightsQuarter 2002 Financial Results HighlightsGroup Turnover – June YTD 2002Group Turnover – June YTD 2002
972.9
1,140.7
1,305.1
301.9
326.5
322.6
343.4
0
500
1,000
1,500
HK$ Million
1999 Total 2000 Total 2001 Total June YTD2001
June YTD2002
No. of Stores:No. of Stores: 114 114 123 123 146 146 132 132 151 151
+ 6%+ 6%
628.4 666.0

66
22ndnd Quarter 2002 Financial Results Highlights Quarter 2002 Financial Results HighlightsGroup Net Profit – 2Group Net Profit – 2ndnd Quarter 2002 Quarter 2002
6.6
48.1
65.5
18.1 19.8
0
10
20
30
40
50
60
70
80
HK$ Million
1999 Total 2000 Total 2001 Total 2nd Qtr2001
2nd Qtr2002
+ 9%+ 9%

77
22ndnd Quarter 2002 Financial Results Highlights Quarter 2002 Financial Results HighlightsGroup Net Profit – June YTD 2002Group Net Profit – June YTD 2002
6.6
48.1
65.5
11.2
18.1
12.0
19.8
0
10
20
30
40
50
60
70
80
HK$ Million
1999 Total 2000 Total 2001 Total June YTD2001
June YTD2002
+ 8%+ 8%
29.3 31.8
88
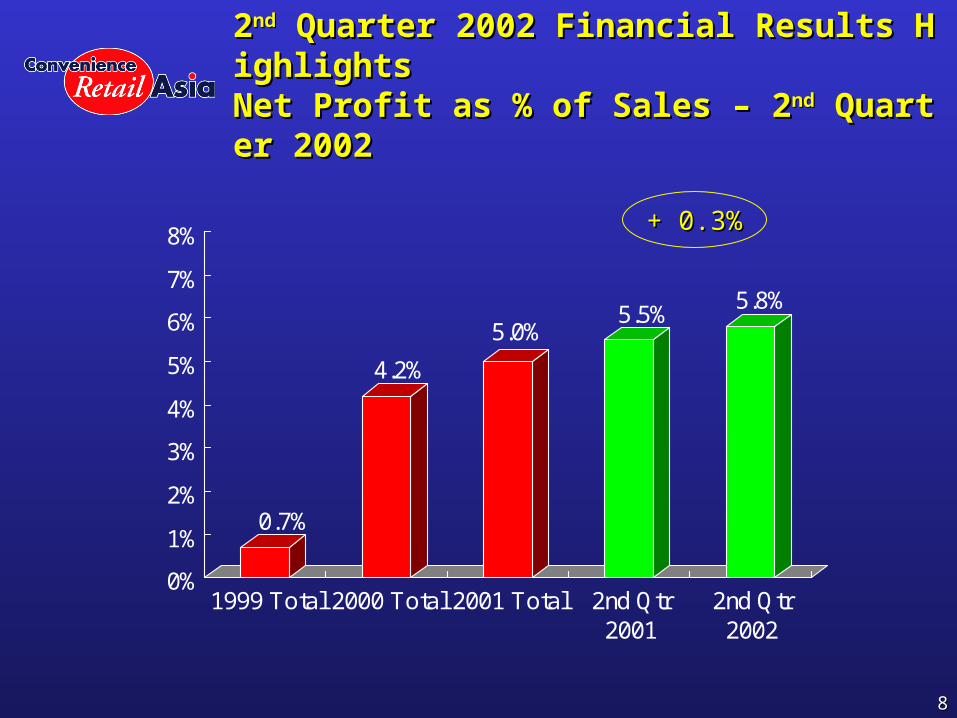
22ndnd Quarter 2002 Financial Results Highlights Quarter 2002 Financial Results HighlightsNet Profit as % of Sales – 2Net Profit as % of Sales – 2ndnd Quarter 2002 Quarter 2002
0.7%
4.2%
5.0%5.5%
5.8%
0%
1%
2%
3%
4%
5%
6%
7%
8%
1999 Total 2000 Total 2001 Total 2nd Qtr2001
2nd Qtr2002
+ 0.3%+ 0.3%
99
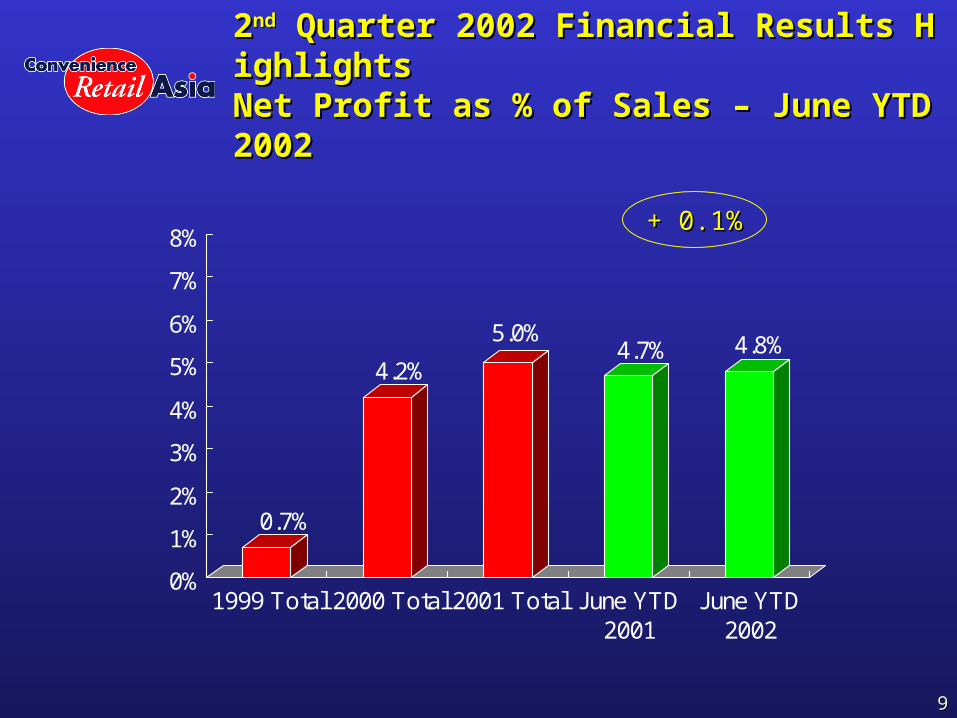
22ndnd Quarter 2002 Financial Results Highlights Quarter 2002 Financial Results HighlightsNet Profit as % of Sales – June YTD 2002Net Profit as % of Sales – June YTD 2002
0.7%
4.2%
5.0%4.7% 4.8%
0%
1%
2%
3%
4%
5%
6%
7%
8%
1999 Total 2000 Total 2001 Total June YTD2001
June YTD2002
+ 0.1%+ 0.1%

1010
22ndnd Quarter 2002 Financial Results Highlights Quarter 2002 Financial Results HighlightsBasic Earnings Per Share – 2Basic Earnings Per Share – 2ndnd Quarter 2002 Quarter 2002
1.3
9.8 10.1
2.8 3.0
0
2
4
6
8
10
12
HK$ Cents
1999 Total 2000 Total 2001 Total 2nd Qtr2001
2nd Qtr2002
+ 7%+ 7%
1111
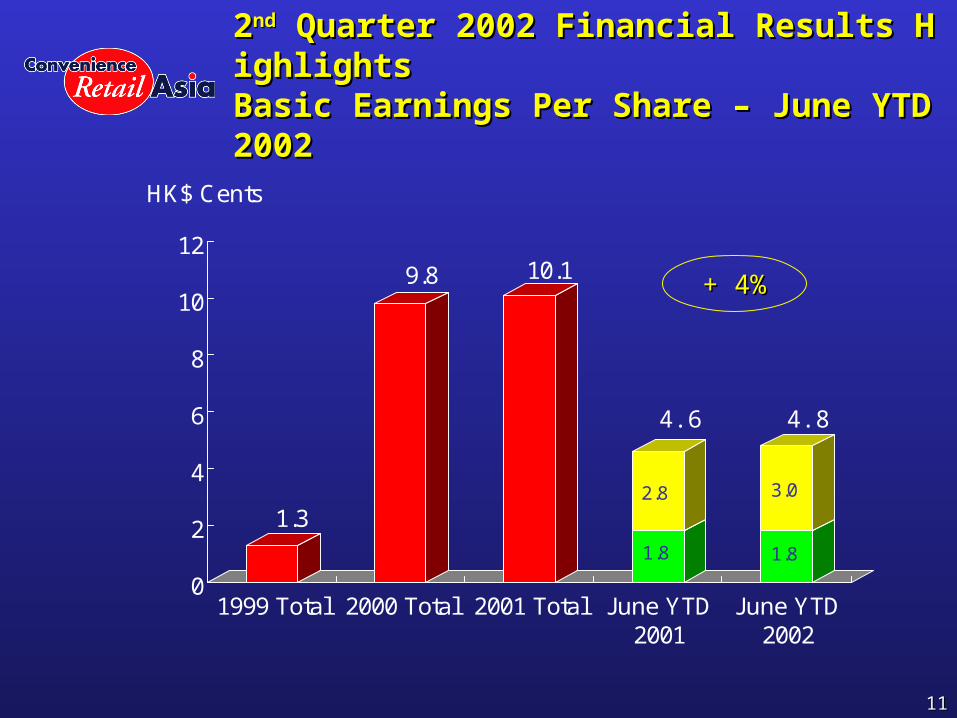
22ndnd Quarter 2002 Financial Results Highlights Quarter 2002 Financial Results HighlightsBasic Earnings Per Share – June YTD 2002Basic Earnings Per Share – June YTD 2002
1.3
9.8 10.1
1.8
2.8
1.8
3.0
0
2
4
6
8
10
12
HK$ Cents
1999 Total 2000 Total 2001 Total June YTD2001
June YTD2002
+ 4%+ 4%
4.84.6

1212
Why 2Why 2ndnd Quarter 2002 Favorable Results? Quarter 2002 Favorable Results? Higher at Gross Margin/Other IncomeHigher at Gross Margin/Other Income
30.4%31.0%
31.6%31.3%
33.2%
28%
30%
32%
34%
1999 Total 2000 Total 2001 Total 2nd Qtr2001
2nd Qtr2002
Gross Margin/Other Income as % of Sales
+ 1.9%+ 1.9%

1313
Why 2Why 2ndnd Quarter 2002 Favorable Results? Quarter 2002 Favorable Results? Offset By Higher Expenses as % of SalesOffset By Higher Expenses as % of Sales
Expenses as % of SalesExpenses as % of Sales 2002 vs 20012002 vs 2001
Store Operating ExpensesStore Operating Expenses (1.2%)(1.2%) HighHigh
erer
China Start-up ExpensesChina Start-up Expenses (0.1%)(0.1%) HighHigh
erer

1414
22ndnd Quarter 2002 Financial Results Highlights Quarter 2002 Financial Results Highlights
22ndnd Qtr 2001 Qtr 2001 22ndnd Qtr 2002 Qtr 2002
Group Turnover (HK$ Million)Group Turnover (HK$ Million) $326.5$326.5 $343.4$343.4 + 5%+ 5%
Group Net Profit (HK$ Million)Group Net Profit (HK$ Million) $18.1 $18.1 $19.8 $19.8 + 9%+ 9%
Net Profit as % of TurnoverNet Profit as % of Turnover 5.5%5.5% 5.8%5.8% + 0.3%+ 0.3%
Basic Earnings Per ShareBasic Earnings Per Share 2.8 Cents 2.8 Cents 3.0 Cents3.0 Cents + 7%+ 7%

1515
June YTD 2002 Financial Results HighlightsJune YTD 2002 Financial Results Highlights
June YTD 2001June YTD 2001 June YTD 2002June YTD 2002
Group Turnover (HK$ Million)Group Turnover (HK$ Million) $628.4$628.4 $666.0$666.0+ 6%+ 6%
Group Net Profit (HK$ Million)Group Net Profit (HK$ Million) $29.3 $29.3 $31.8 $31.8+ 8%+ 8%
Net Profit as % of TurnoverNet Profit as % of Turnover 4.7%4.7% 4.8%4.8%+ 0.1%+ 0.1%
Basic Earnings Per ShareBasic Earnings Per Share 4.6 Cents 4.6 Cents 4.8 Cents4.8 Cents+ 4%+ 4%
1616
2002 Update & Outlook2002 Update & Outlook

1717
2002 Update & Outlook2002 Update & OutlookCircle K Hong KongCircle K Hong Kong
Rising Unemployment, Continuing Rising Unemployment, Continuing
Deflation, Declining Consumer Deflation, Declining Consumer
ConfidenceConfidence
No Signs of RecoveryNo Signs of Recovery
Tough 2Tough 2ndnd Half 2002 Half 2002
1818
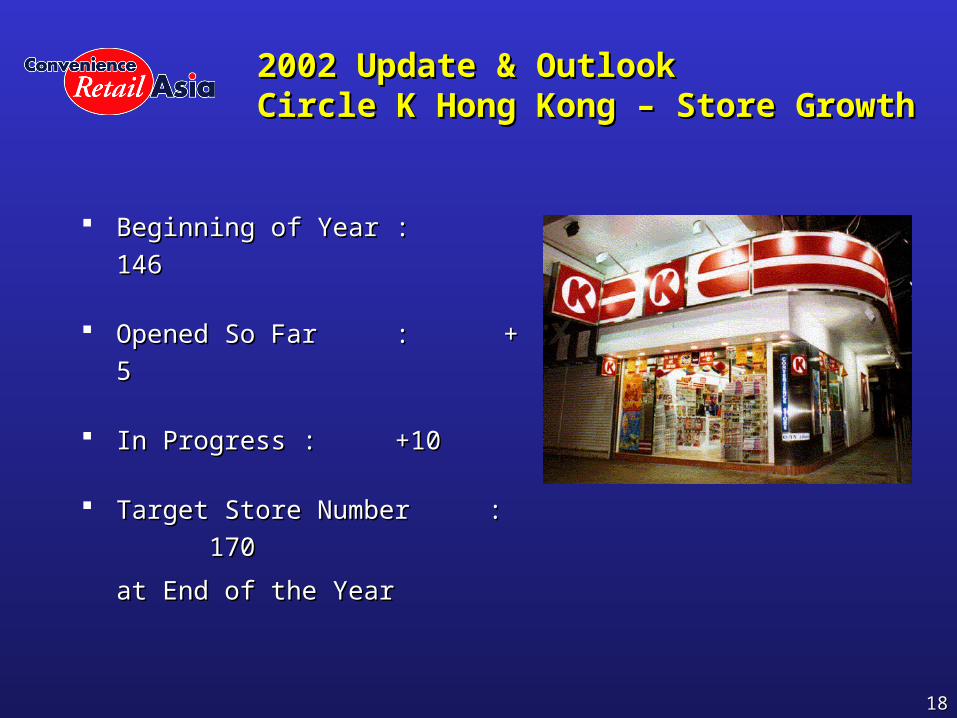
2002 Update & Outlook2002 Update & OutlookCircle K Hong Kong – Store GrowthCircle K Hong Kong – Store Growth
Beginning of YearBeginning of Year ::
146146
Opened So FarOpened So Far :: + 5 + 5
In ProgressIn Progress ::
+10+10
Target Store NumberTarget Store Number ::
170170
at End of the Yearat End of the Year

1919
2002 Update & Outlook2002 Update & OutlookCircle K Hong Kong TacticsCircle K Hong Kong Tactics
Focus on Managing Pricing, Focus on Managing Pricing,
Gross Profit & Controlling Gross Profit & Controlling
ExpensesExpenses
Aggressive Promotions Targeted Aggressive Promotions Targeted
at Youngstersat Youngsters
Develop Fast-growth Product Develop Fast-growth Product
Categories – Categories – Food Services, Food Services,
Phone Cards and Store ServicesPhone Cards and Store Services
2020
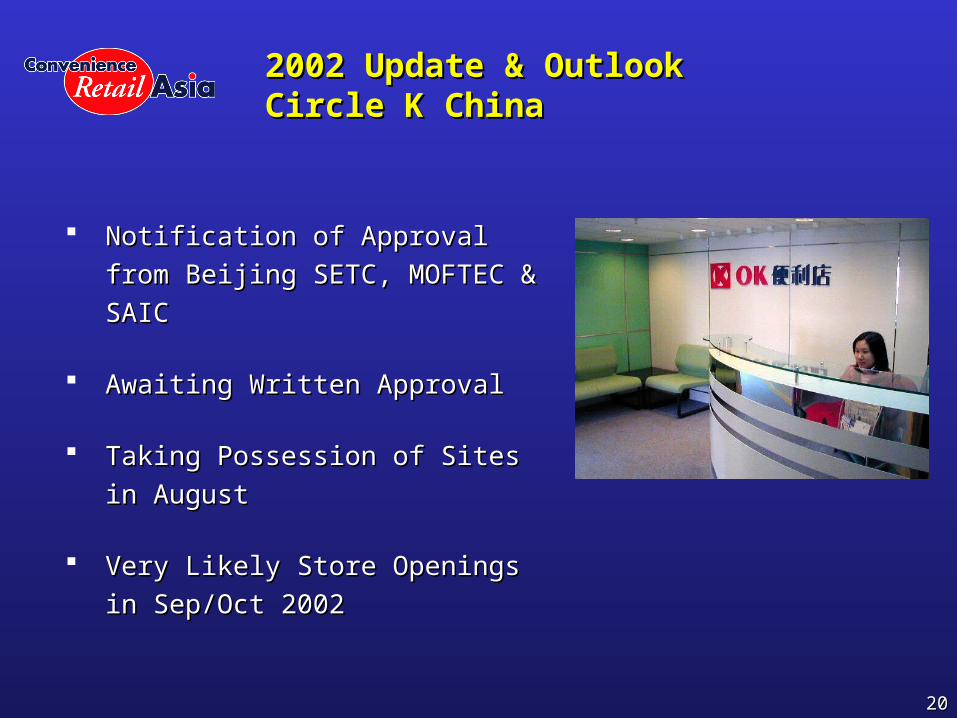
2002 Update & Outlook2002 Update & OutlookCircle K ChinaCircle K China
Notification of Approval from Beijing Notification of Approval from Beijing
SETC, MOFTEC & SAICSETC, MOFTEC & SAIC
Awaiting Written ApprovalAwaiting Written Approval
Taking Possession of Sites in AugustTaking Possession of Sites in August
Very Likely Store Openings in Very Likely Store Openings in
Sep/Oct 2002Sep/Oct 2002

2121
2002 Update & Outlook2002 Update & OutlookTo SummariseTo Summarise
Tough Hong Kong Market Slowing Tough Hong Kong Market Slowing
Profit GrowthProfit Growth
About to Commence Business in About to Commence Business in
Southern ChinaSouthern China
China Start-up Cost to IncreaseChina Start-up Cost to Increase
Volatility in Rate of Profit Growth in 2Volatility in Rate of Profit Growth in 2ndnd
Half 2002Half 2002
22ndnd Quarter 2002 Results Quarter 2002 ResultsPresentationPresentation
A member of the Li & Fung (Retailing) GroupA member of the Li & Fung (Retailing) Group CRA Website: www.cr-asia.comCRA Website: www.cr-asia.com29 July 200229 July 2002