2 national survey of ngos report | 2009 national survey of
TRANSCRIPT


2 • National Survey of NGOs Report | 2009 National Survey of NGOs Report | 2009 • 1
National Survey of NGOs Report
2009
© A publication of the NGOs Co-ordination Board

2 • National Survey of NGOs Report | 2009 National Survey of NGOs Report | 2009 • 3
REPORT ON THE NATIONAL VALIDATION SURVEY OF NGOs
FOREWORD
One of the Board’s mandate is to review the register of NGOs on a regular basis to determine consistency with the reports submitted by them. The Board conducted na-tionwide survey of NGOs in 2007 and 2008. The data from the survey would enable the Board to advise the Government further on NGOs’ activities and their role and contribution to development in Kenya.
The survey revealed that charitable activities are deeply embedded in communities and respond to some common concerns that cannot be adequately addressed by indi-vidual families or Government. On the other hand, most countries have evolved from centrally planned economies to market-oriented economies requiring fundamental modifications of all stages of development policies, implementation, and administra-tion. In this changing environment, there has been a tremendous growth in the num-ber of NGOs in the country, some of them established to respond to this new reality. Therefore, development strategies in the NGO sector must take into consideration the political and economic realities that exist today.
While the Government development blue print Vision 2030 targets high quality life for the citizens, it is apparent that it can no longer sufficiently fund or respond to the demands of all its citizens. Therefore, the Sector plays a complementary role in providing services and essential facilities to deserving or underserved regions thereby contributing to realization of the social and economic pillars of Vision 2030. Although NGOs are strategic in their approaches to societal needs, this has not been without challenges as they continue to face institutional, financial and programme sustain-ability problems. Compliance with regulatory and statutory requirements is also low and most NGOs do not hold annual general meetings and elections according to their constitutions. The survey findings have provided useful information and insights that the Board has utilised in enabling legal and regulatory framework for NGOs with a view to ensuring efficiency and effectiveness in the sector.
Amb. Peter O. Ole Nkuraiyia, CBSExecutive Director
ACKNOWLEDGEMENTS
Former Chairman: Wycliffe Mutsune, OGW, HSC
National Co-ordinator/Former Executive Director: David Isoe
Technical Co-ordinator: Henry Otieno Ochido
Regional Co-ordinators: Rahma Jillo, Douglas Odhiambo Owino, Benjamin Karume, Bernard Bwoma, Thomas Ombasa
Communications Co-ordinators: Nixon S. Nyadiero and Richard Chesos
Logistics and Administration: Andrew Ogombe and David Njane
Data Entries: Jemimah Muraya, Josephine Wanjala, Yusuf N. Abdi, Elizabeth Kamau and Irine Angwenyi
Data Analysis: Douglas Odhiambo Owino, Jemimah Muraya, Zilpah Kwamboka
Secretarial Co-ordinator: Winnie Odera
Registry Clerk: Charles Mugo Ichagichu
ICT Support: Yusuf N. Abdi
Data Management Co-ordinator: Kibwana Zamani
Editing: Richard Chesos
Technical Advisor (Data interpretation and sufficiency; and report writing): Douglas Odhiambo Owino
Invaluable Contribution: All Supervisors, Enumerators and Management and Staff of the NGOs Co-ordination Board
Funding: The survey was fully funded by the Government of Kenya
Design and Layout: Sanabora Design House Ltd

4 • National Survey of NGOs Report | 2009 National Survey of NGOs Report | 2009 • 5
3.1.4 NGOs With Internet Access .................................................................................................................30
3.1.5 NGOs With Fixed Telephone Lines........................................................................................................32
3.1.6 NGOs That Displayed Registration Certificates .....................................................................................33
3.2 Distribution Of NGOs ..............................................................................................................................34
3.2.1 Provinces ............................................................................................................................................34
3.2.2 Distribution Of NGOs In Kenya (In Terms Of Scope Of Operation) .........................................................36
3.2.3 NGOs’ Strategic Approach – Advocacy, Service Provision And Capacity Building ...................................37
3.2.4 Sector ................................................................................................................................................39
3.2.5 NGOs Engaged In Microfinance ...........................................................................................................40
3.2.6 NGOs Running Children Homes ...........................................................................................................42
3.3 Finances ................................................................................................................................................45
3.3.1 Sources ..............................................................................................................................................45
3.3.2 Donor Countries .................................................................................................................................47
3.3.3 Expenditure ........................................................................................................................................48
3.3.4 Comparison Of Survey Information Against Information Provided By NGOs In Their Returns..................50
3.3.5 Assets ................................................................................................................................................51
3.4 Personnel ..............................................................................................................................................52
3.4.1 Paid And Volunteer Staff .....................................................................................................................52
3.4.2 Nationality Of Staff (Local And Foreign Staff) ......................................................................................55
3.5 Policy And Legal Issues ..........................................................................................................................57
3.5.1 Compliance With Regulatory Requirements .........................................................................................57
3.5.1.1 Functions And Existence Of The Board .............................................................................................57
3.5.1.2 Awareness On Annual Returns And Audited Accounts .......................................................................58
3.5.2 Understanding Of The Regulatory Framework For NGOs In Kenya .........................................................60
3.5.2.1 Awareness On NGOs Co-Ordination Act ............................................................................................60
3.5.2.2 Understanding On Roles Of The NGOs Co-Ordination Board And NGOs Council ................................61
3.5.2.3 Adequacy Of The Act ........................................................................................................................63
Table Of ContentsGlossary Of Abbreviations ...................................................................................................................12
Preface ..............................................................................................................................................12
Definitions .........................................................................................................................................14
Executive Summary ............................................................................................................................16
Chapter One .......................................................................................................................................18
1.0 Introduction ...........................................................................................................................................18
1. 1 About The Non-Governmental Organizations Co-Ordination Board ..........................................................18
1.2 Background To The National Validation Survey Of NGOs ..........................................................................19
1.3 Organization Of The Survey .....................................................................................................................20
1.4 Objectives Of The Survey ........................................................................................................................21
1.5 Rationale Of The Survey .........................................................................................................................21
1.6 Expected Results ...................................................................................................................................21
1.7 Policy Implications .................................................................................................................................22
Chapter Two .......................................................................................................................................23
2.0 Methodology .........................................................................................................................................23
2.1 Study Area And Population Size..............................................................................................................23
2.2 Methods Of Data Collection ...................................................................................................................23
2.3 Methods Of Data Analysis ......................................................................................................................24
2.4 Limitations Of The Study ........................................................................................................................24
2.5 Assumptions Of The Study ......................................................................................................................24
Chapter Three .....................................................................................................................................25
3.0 The Survey Findings ...............................................................................................................................25
3.1 Basic Information On NGOs ...................................................................................................................25
3.1.1 Number And Scope Of NGOs Interviewed ............................................................................................25
3.1.2 Status Of Office ..................................................................................................................................27
3.1.3 NGOs With Physical Address ...............................................................................................................29

6 • National Survey of NGOs Report | 2009 National Survey of NGOs Report | 2009 • 7
4.0.5 Filing Of Complaints ...........................................................................................................................80
4.0.6 Letter Of Confirmation Of Registration .................................................................................................80
4.0.7 Tax Exemption Recommendation .........................................................................................................81
4.0.8 Work Permit Recommendation ............................................................................................................81
4.0.9 What Could Be Done To Improve Services At The Board? .....................................................................82
Chapter 4 ...........................................................................................................................................83
A Summary Of Discussions With The Key Informants.....................................................................................83
Chapter 5 ...........................................................................................................................................84
5.0 Conclusions And Recommendations ......................................................................................................84
5.1 Conclusions ...........................................................................................................................................84
5.2 Recommendations .................................................................................................................................85
5.2.1 Board’s Mandate ................................................................................................................................85
5.2.2 Proportionate And Risk Based Approach .............................................................................................86
5.2.3 Legal And Regulatory Framework (Review Of The Act) ..........................................................................86
5.2.4 NGO Sustainability And Relations With The Government ......................................................................86
5.2.5 Compliance And Decentralisation Of Board’s Services ........................................................................87
Appendices ........................................................................................................................................87
3.5.2.4 Awareness On Sessional Paper No. 1 Of 2006 .................................................................................65
3.5.2.5 Awareness On Code Of Conduct And NGOs Regulations Of 1992 .....................................................66
3.6 Governance ...........................................................................................................................................67
3.7 Project Implementation ..........................................................................................................................68
3.7.1 Projects Implemented As At 31St December, 2006 .............................................................................68
3.7.2 Projects Implemented In Terms Of Scope ............................................................................................69
3.7.3: Top Three Projects In Terms Of Population Reached ............................................................................70
3.7.4 Rating Of Project Performance By NGOs ..............................................................................................71
3.7.5 What Contributed To Successes In Projects Implemented? ..................................................................72
3.7.6 Challenges Faced In Project Implementation .......................................................................................73
3.8 Participation In Local Development Initiatives .........................................................................................73
3.9 Collaborators .........................................................................................................................................75
3.9.1 Nature Of Collaboration ......................................................................................................................76
4.0 Rating Of Board Services By NGOs ........................................................................................................76
4.0.1 Recommendation Letters For Opening Bank Accounts .........................................................................78
4.0.2 Where NGOs Banked Their Money (Top Ten Banks) ..............................................................................78
4.0.3 Filing Documents For Registration .......................................................................................................79
4.0.4 File Search .........................................................................................................................................79

8 • National Survey of NGOs Report | 2009 National Survey of NGOs Report | 2009 • 9
Figure 3.2.4B: A Pie Chart On NGOs Distribution In Terms Of Sectors Of Operation .......................................39
Figure 3.2.5A: A Pie Chart On The Number Of NGOs Engaged In Microfinance ..............................................40
Figure 3.2.5B: Showing The Percentage Of Deposit-Taking Microfinance NGOs ..............................................41
Figure 3.2.6B: A Pie Chart Showing Children’s Home Operating With Or Without Approval .............................42
Figure 3.2.6C: Showing The Distribution Of Children’s Homes In Each Province In Percentages .....................43
Figure 3.2.6D: Distribution Of Children’s Homes By Scope ...........................................................................43
Figure 3.2.6E: Distribution Of Children’s Homes In The Country ....................................................................44
Table 3.3.1B: Showing NGOs’ Sources Of Funds In 2005/6 By Percentages .................................................45
Figure 3.3.1C: Donor Countries ....................................................................................................................46
Figure 3.3.1D: A Pie Chart Showing Donor Countries ....................................................................................47
Figure 3.3.3B: A Pie Chart On Total Expenditure By NGOs By Scope ..............................................................48
Figure 3.3.3C: A Bar Graph Showing NGOs’ Expenditure By Scope................................................................48
Figure 3.3.3D: A Bar Graph Showing How NGOs Spent Their Incomes ...........................................................49
Figure 3.3.4A A Line Graph Showing Deviation On NGOs’ Financial Reporting ...............................................50
Figure 3.3.5: A Pie Chart On Assets Owned By NGOs ....................................................................................51
Figure 3.4.1B: Showing Gender Of Paid And Unpaid Staff In Percentages .....................................................52
Figure 3.4.1C: A Pie Chart Showing The Distribution Of Paid And Unpaid Staff ..............................................52
Figure 3.4.1D: Distribution Of Paid And Unpaid Staff In Terms Of Scope .......................................................53
Figure 3.4.1E: Distribution Of Staff In Terms Of Scope ..................................................................................53
Figure 3.4.1F: Distribution Of Ngo Employees By Gender ..............................................................................54
Figure 3.4.2(I): Number Of Local And Foreign Staff Employed By NGOs ........................................................54
Figure 3.4.2(Ii): Percentage Of Kenyans And Non-Kenyans Employed
By International And National NGOs .............................................................................................................55
Table 3.4.3A: New Work Permits ...................................................................................................................55
Figure 3.4.3B: Work Permit Renewals ...........................................................................................................56
Figure 3.5.1.1A: Awareness On Functions And Existence Of The Board ..........................................................56
Figure 3.5.1.1B: Awareness On Functions And Existence Of The Board By National And International NGOs ..57
List Of Tables Table3.1.1: Number And Scope Of NGOs Interviewed ...................................................................................27
Table 3.1.2A: Status Of Office ......................................................................................................................28
Table 3.2.6 (A): Showing The Number Of Children’s Homes In Each Province ................................................43
Table 3.3.1A: Showing NGOs’ Sources Of Funds In 2005/6..........................................................................45
Table 3.3.3A: NGOs’ Expenditure ..................................................................................................................48
Table 3.3.4A: Provides Data On NGOs’ Expenditure From The National Survey And Form 14 ..........................51
Table 3.4.1A: Provides A Breakdown On Paid And Volunteer Staff In Terms Of Scope And Gender ..................52
List Of FiguresFigure 3.1.2B: Pie Chart On The Distribution Of NGOs’ Regional, Main And Branch Offices ...........................27
Figure 3.1.2C: Pie Charts On The Distribution Of NGOs’ Regional, Main And Branch Offices By Scope ...........28
Figure 3.1.3A: Pie Chart On NGOs With Or Without Physical Addresses .........................................................29
Figure 3.1.3B: Pie Charts On Physical Address By Scope ..............................................................................29
Figure 3.1.4A: A Pie Chart On NGOs With Or Without Internet Access ...........................................................30
Figure 3.1.4B: Percentage Of NGOs With Or Without Internet Access By Scope .............................................30
Figure 3.1.4C: Showing Where NGOs Accessed Internet ...............................................................................31
Figure 3.1.4D: Showing National And International NGOs Accessed Internet .................................................31
Figure 3.1.5A: NGOs With Fixed Telephone Lines By Percentages ..................................................................32
Figure 3.1.5B: Pie Charts Showing NGOs With Fixed Telephone Lines By Scope ............................................32
Figure 3.1.6A: NGOs That Displayed Registration Certificates By Percentages ...............................................33
Figure 3.1.6B: NGOs That Displayed Registration Certificates By Scope ........................................................33
Figure 3.2.1: Distribution Of NGOs In Various Provinces By Percentages .......................................................34
Figure 3.2.3: Distribution Of NGO Offices In Kenya In Terms Of Scope Of Operation ......................................35
Figure 3.2.3B: NGOs Distribution In Terms Of Strategic Approach By Province ...............................................37
Figure 3.2.3C: NGOs Distribution In Terms Of Strategic Approach By Scope ..................................................37
Figure 3.2.4A: A Bar Graph Showing NGOs Distribution In Terms Of Sectors Of Operation .............................38
10 • National Survey of NGOs Report | 2009 National Survey of NGOs Report | 2009 • 11
Figure 3.9.1: Nature Of Collaboration ...........................................................................................................75
Figure 4.0: Rating Of Board Services ............................................................................................................76
Figure 4.01: Bank Letter ..............................................................................................................................77
Figure 4.0.2: Most Preferred Banks By NGOs ...............................................................................................77
Figure 4.0.4: File Search ..............................................................................................................................78
Figure 4.0.5: Filing Of Complaints ................................................................................................................79
Figure 4.0.6: Letter Of Confirmation Of Registration ......................................................................................79
Glossary Of AbbreviationsAAC-Area Advisory Council
AU- African Union
CACCs-Constituency Aids Co-ordinating Committees
CBOs-Community Based Organizations
CDF- Constituency Development Fund
CSOs-Civil Society Organizations
DACC- District Aids Co-ordinating Committee
DC- District Commissioner
DDOs- District Development Officers
DO- District Officer
KES- Kenya Shillings
LASDAP- Local Authority Service Delivery Action Plan
LDI-Local Development Initiative
NGOs –Non Governmental Organizations
RC- Regional Co-ordinator
SPSS- Statistical Package for Social Scientists
TC- Technical Co-ordinator
UN- United Nations
Figure 3.5.1.2A: Awareness On Submission Of Annual Returns .....................................................................58
Figure 3.5.1.2B: Awareness By National And International NGOs On Submission Of Annual Returns And Audited Accounts ......................................................................................................58
Figure 3.5.1.2C: Number Of NGOs Due To Submit Returns And Those Who Actually Submitted And Due ........59
Audited Accounts In 2005/6 ........................................................................................................................59
Figure 3.5.1.2D: A Pie Chart On Submitted And Due Audited Accounts In 2005/6 .......................................59
Figure 3.5.3.1A: NGOs’ Awareness On NGOs Co-Ordination Act ....................................................................60
Figure 3.5.3.1B: Awareness Of NGOs Co-Ordination Act By National And International NGOs ........................60
Figure 3.5.3.2A: NGOs’ Understanding Of The Role Of NGOs Co-Ordination Board And NGOs Council ...........61
Figure 3.5.3.2B: NGOs’ Understanding Of The Role Of NGOs Co-Ordination Board And NGOs Council By Scope 61
Figure 3.5.3.3A: Adequacy Of The Act...........................................................................................................62
Figure 3.5.3.3B: Percentage Of National And International NGOs That Considered The Act Adequate .............62
Figure 3.5.3.4A: NGOs’ Awareness On Sessional Paper No. 1 Of 2006 .........................................................64
Figure 3.5.3.4: Awareness By National And International NGOs’ Of Sessional Paper No. 1 Of 2006 ..............64
Figure 3.5.3.4C: How NGOs’ Learnt About The Sessional Paper No. 1 Of 2006 .............................................65
Figure 3.5.3.5A: NGOs’ Awareness On Code Of Conduct And NGOs Regulations Of 1992 .............................66
Figure 3.5.3.5B: Awareness On Code Of Conduct And NGOs Regulations Of 1992 By National And International NGOs ...........................................................................................................................................................66
Figure 3.6: The Percentage Of NGOs That Held Annual General Meeting In 2005/6.......................................67
Figure 3.7.1: The Number Of Projects Implemented By NGOs As At 31St December, 2006 ...........................68
Figure 3.7.2: Percentage Of National And International NGOs That Implemented Projects As At 31St December, 2006 ...........................................................................................................................................................69
Figure 3.7.3: A Pie Chart Top Three Projects Implemented In Terms Of Population Reached ...........................70
Figure 3.7.5: Factors That Contributed To Success In Projects .......................................................................72
Figure 3.7.6: Challenges Faced In Project.....................................................................................................72
Figure 3.8(i): NGOs’ Participation In Local Development Initiatives ...............................................................73
Figure 3.8(ii): A Pie Chart Showing NGOs’ Participation In Various Local Development Initiatives ...................74
Figure 3.9 A Pie Chart On NGOs’ Collaborations With Other Organizations Or Agencies ..................................74

12 • National Survey of NGOs Report | 2009 National Survey of NGOs Report | 2009 • 13
necessary to help it exercise adequate oversight on the increasingly complex and sophisticated operations of the NGO sector in the country. Inadequate staff and equipment have also had a bearing on service delivery to the NGO sector.
The fact that the NGOs Co-ordination Board only has presence in Nairobi has further eroded its ability to monitor NGOs to ensure they operate within their stated objectives and contribute effectively to national development. The requirement that NGO officials have to travel to Nairobi to access services has been a financial burden particularly on the smaller organizations. It is due to the foregoing factors that the Government in 2007 funded the Board to conduct a national survey to validate data on NGOs in the country. The study sought to collect information which would im-prove public confidence and form the basis for improved regulation and enablement of the NGO sector in Kenya. The study was conducted in three phases with the last phase carried out in October, 2008.
Definitions
1. Charitable OrganizationsNGOs Co-ordination Act 1990 defines a Non-Governmental Organization (NGO) as a private voluntary grouping of individuals or associations not operated for profit or other commercial purposes but which have organized themselves nationally or internationally for the benefit of the public at large and promotion of social welfare, development, charity or research in the areas inclusive of, but not restricted to health, agriculture, education, industry and supply of amenities and services.
2. SectorsNGOs carry out various activities/projects towards the fulfillment of their objectives. Related activities are usually grouped based on their thematic relationships referred to as sectors. While a number of organizations carry out integrated programmes (i.e. combine a number of different activities under one project i.e. HIV/AIDS, Microfi-nance, Agriculture etc) they would normally have a core focus for instance “ mitiga-tion of the impact of HIV/AIDS “ which would then make such a project fall in the HIV/AIDS sector.
3. Area Advisory CouncilUnder the Children’s Act of 2001 and its attendant Regulations of 2006, all Children’s Homes must be inspected and approved by the Area Advisory Council (AAC). The AACs are multi-sectoral teams composed of representatives of Government and Civil Society Organizations (CSOs) and are to be found at the District, Division and Loca-tion.
4. Financial YearAll NGOs are required to have a financial year, usually a 12 month period. Organiza-tions usually close their books of accounts after the end of their financial year. NGOs are required to submit an annual report usually referred to as Annual Returns to the NGOs Co-ordination Board by the May 31st following the end of their financial year. This is done on a statutory document commonly known as Form 14. It is mandatory
Preface
The last decade has witnessed -substantial growth in the number of organizations registered under the NGOs Co-ordination Act of 1990. The sector recorded sig-nificant growth between 2001 and 2007 which could be attributed to the impact of globalization and the opening up of democratic space in Kenya. Since 2001, the sec-tor has been growing at the rate of 400 organizations per year. By August 2009, the Board had cumulatively registered 6,075 organizations.
These organizations are spread all over the country and vary from small organiza-tions operating locally, to international ones with regional programmes. They range from organizations run by small teams of volunteers to mega organizations with hundreds of fully paid staff of diverse professions and sophisticated systems and pro-cesses. They reflect diversity in their activities from welfare, to environment, human rights, gender, agriculture and education among others. Further, they employ various strategies ranging from policy and advocacy to research and training, consciousness-raising to information and communication. NGOs in Kenya encompass organiza-tions with modest budgets of a few thousand shillings to those managing over a billion Kenya shillings per year.
The positive impact of increased NGO activity cannot be gainsaid and indeed the sector is increasingly becoming a major player in the provision of basic services in many parts of the country. Nevertheless, the expansion also brings with it high risks of potential abuse both for the public who interact with these organizations on a day to day basis as well as overall national security and economic stability. Activities of rogue NGOs pose a direct threat to public safety and can also impact negatively on the economy inter alia through acts of fraud, money laundering and financing of terrorism.
In 2003, it was estimated that the sector was contributing KES 80 billion annually to the economy. Nevertheless, it has been difficult to get accurate data on exactly how much NGOs are contributing to the economy due to low compliance in submis-sion of annual returns to the Board as well as filing of inaccurate data. The forego-ing expansion in the NGO sector has, however, not been matched by a concomitant growth in the capacity of the NGOs Co-ordination Board, the state regulatory body, to effectively regulate the sector.
The Board was established in response to the phenomenal growth in the number of organizations involved in the areas of welfare and development and the need to bring them under one legal framework. This it was felt would enable effective regulation and concurrently facilitate better understanding on their contribution to national development.
The budgetary allocation to the Board through the Treasury has, however, only been sufficient to enable it provide registration services and minimal post-registration services. The key functions of monitoring, evaluating and researching NGO activities in order to competently advise the Government on the sector has therefore not been well addressed. Concurrently, due to insufficient funding, the NGOs Co-ordination Board has been unable to recruit enough technical staff and acquire the equipment

14 • National Survey of NGOs Report | 2009 National Survey of NGOs Report | 2009 • 15
8. Technical CapacityRefers to the level of skills, knowledge and experience available to an NGO to enable them competently implement a project in their chosen area of intervention.
9. NetworkingRefers to an NGO’s capacity to identify other organizations which can contribute to the attainment of its objectives, communicate effectively with them and enter into a mutually beneficial relationship.
10. CommunityWe use community to refer to the beneficiaries of a programme implemented by an NGO as well as the people resident in the area of where a project is being imple-mented.
11. AdvocacyAdvocacy NGOs primarily promote policies and/or actions addressing specific concerns, points of view, or interests. In the context of development, they work to influence the policies and practices of governments and development institutions.
12. Service provision In service provision, NGOs work towards improving quality of life by ensuring ac-cess to basic services like Education, Shelter, Water, Health, Food e.t.c.
13. Capacity buildingCapacity Building refers to actions that improve NGO’s effectiveness or enhance abil-ity to work towards its mission. Capacity building efforts can include a broad range of approaches, e.g. financial support, providing training and supporting collaboration with other NGOs.
for NGOs with an annual incomes of KES 1 million and more to accompany Form 14 with audited accounts.
5. Top Officials of an NGOAll NGOs in Kenya are required to have at least three Directors (who comprise the Board of the Organization), one of whom must be a Kenyan. The Directors have re-sponsibility for overseeing the management of the NGO. From the Directors, a team of officials are usually elected to whom the Directors give responsibility of exercis-ing oversight on the management of an organization on a day to day basis since the Board of Directors meet after a long time, say after every three months.
6. Regulatory EnvironmentNGOs operate by set rules prescribed in the NGOs Co-ordination Act 1990 and its attendant NGO Regulations of 1992. The rules provide for the conduct of NGOs and at the same time seek to facilitate their activities. The rules themselves and their application are referred to as the “regulatory environment” Regulatory environment therefore refers to the manner in which NGOs are regulated and enabled to carry out their functions.
7. GovernanceRefers to the manner in which the officials and staff of NGOs exercise authority in the management of the affairs and resources of the organization. NGOs are expected to maintain clear separation of powers between its Board of Directors (with the management providing policy guidance while the staffcarry out implementation of activities as agreed on by the Board). NGOs are also expected to demonstrate the values of probity, self-regulation, justice, service, co-operation, prudence and respect as prescribed in the Code of Conduct
16 • National Survey of NGOs Report | 2009 National Survey of NGOs Report | 2009 • 17
Another notable finding was that 88 per cent of the organisations inter-viewed had not conducted elections as required by their constitutions in the year preceding the interview, which indicates poor governance among a significant majority of the NGOs. The survey further points to an inordi-nately high number of volunteer staff in the sector which was not consistent with the total amount spent on personnel costs. It would appear that a large number of staff who where actually salaried where falsely reported as vol-unteer staff.
While most NGOs were cooperative in the exercise, a small number proved uncooperative and were particularly hesitant to provide financial informa-tion. This was rather strange for organisations which were registered to pro-vide public benefit and which are part of a value driven sector. It would appear then that a number of NGOs had difficulties in meeting the trans-parency and accountability test.
All in all, the survey results point to a diverse sector with small organisa-tions run by volunteers operating at community level and extremely large organisations with activities not only in Kenya but in the region as well, with massive budgets and professional staff. This diversity in terms of activi-ties, size and reach necessitates a review of the Board’s regulatory approach and makes a strong case for a risk based and proportionate approach in regulation. At the same time, it clearly demonstrates that the NGO sector in Kenya has evolved considerably since the enactment of the NGOs Co-ordination Act.
The expansion and growth of the sector brings with it tremendous opportu-nities for harnessing their potential to stimulate economic growth and im-prove social welfare in Kenya, but at the same time, it brings with it myriad challenges particularly considering the vulnerability of the sector to abuse. There is therefore an urgent need to review the legislative and regulatory framework to ensure a professional approach to regulation that is able to balance the need to enable the sector to play its important role in national development while ensuring that NGOs are not abused to the detriment of the public interest.
Executive Summary
The National Validation Survey of NGOs was carried out in three phases between May 2006 and October2008. The country was zoned into eleven (11) administrative regions based on the provincial boundaries and then into districts as constituted as at December 2006.
The overarching goal of this study was to generate information which would assist in enhancing regulation of NGOs in order to increase their effective-ness and improve public trust and confidence in them. The survey was car-ried out in fulfilment of the Boards mandate as stipulated under section 7(e) of the NGOs Co-ordination Act of 1990 which requires it to conduct a regular review of the register to determine its consistency with the reports submitted by NGOs.
The survey was particularly necessary because while the Board collects data on NGOs in the country annually through the information contained in annual returns, this method of data collection had not been successful due to low compliance. There was, therefore, need to update and validate data on all NGOs since the available information was inadequate. This lack of adequate information had constrained the Board’s capacity to quantify the role played by NGOs in national development, and identify opportunities for improved enablement of the sector.
The survey confirmed the diversity of NGOs in terms of their activities, size and access to resources. Further, it established that NGOs were present even in the most far flung of places in Kenya providing basic services to poor communities in the country. The survey established that the 1,334 NGOs interviewed received KES 68 billion in 2005/6 meant for a wide range of public benefit interventions.
The Survey further revealed that only 18 per cent of the organisations reg-istered with the Board at the time of the survey could be traced based on the information in the Board’s Register. It must be noted, however, that the Board did not solely relay on the Register but conducted its on surveys at district level which enabled it to identify organisations even where the data provided in the register was inaccurate. Further, three per cent of the or-ganisations, which could be traced, did not have offices as required by law.

18 • National Survey of NGOs Report | 2009 National Survey of NGOs Report | 2009 • 19
• Provide policy guidelines for NGOs for harmonizing their activities with the National Develop-ment Plan so that NGOs avoid activities which contradict State development programmes
• Receive, discuss and approve the regular reports of the NGO Council and to provide strategies for efficient planning and coordination of activities for NGOs in Kenya
• Develop and publish a Code of Conduct for the regulation of NGOs and their activities in Kenya• Prescribe rules and procedures for the audit of accounts of NGOs
1.2 BACKGROUND TO THE NATIONAL VALIDATION SURVEY OF NGOS Section 7 of the Act provides the Board with a mandate to maintain a register of national and interna-tional NGOs operating in Kenya, with their precise sectors, affiliations and location of their activities. The Board is also expected to conduct a regular review of the register to verify the accuracy of reports submitted by NGOs with a view to advising the Government on their activities. While the Board had over the years been collecting data on NGOs particularly through the information contained in annual returns, this was not very successful due to low compliance. The information available to the Board was therefore to a large extent outdated and needed to be urgently updated.
The lack of adequate information meant that the Board was unable to quantify the important role played by NGOs in national development, and identify opportunities for improved enablement of the sector when in fact NGOs are diverse in terms of thematic emphasis, financial capacity and expertise.
Additionally, the Board continued to apply a uniform approach to all NGOs. It is in the foregoing con-text that the Board carried out a nationwide survey to validate existing data on the sector and establish opportunities for improved enablement and regulation.
It was anticipated that the information collected through the survey would be useful for the Board to update its database and improve service provision to the NGO sector. Secondly, the information would be used to advise the Government on the contribution of the NGO sector to the national economy and on the nature of legislative and policy support that the sector might require. Thirdly, the information would be important for documenting and quantifying effectiveness of NGOs to donors and the general public thus building public confidence in them.
1.3 ORGANIZATION OF THE SURVEY The National Validation Survey of NGOs was carried out in three phases between May 2006 and October 2008. The country was zoned into eleven (11) administrative regions based on the provincial boundaries and then into districts as constituted as at December 2006. The process involved:
i. Sensitizing the public and NGOs on the exercise to ensure its smooth implementation by Con-ducting eleven (11) regional sensitization workshops; visits to District Commissioners (DCs) in 71 districts; running advertisements in the print and electronic media and communicating directly with NGOs through letters and e-mails.
ii. Conducting desk research to establish existing data on registered NGOs, specifically to identify number of NGOs registered, areas of operation, main objectives, officials and contact address.
iii. Recruiting, training and deployment of coordinators, supervisors and enumerators. This also involved reconnaissance visits to the districts to conduct logistical planning.
iv. Carrying out field survey to validate existing data on NGOs and fill existing information gaps. All registered NGOs were visited at their project sites by enumerators on behalf of the Board to
1.0 INTRODUCTION
1. 1 ABOUT THE NON-GOVERNMENTAL ORGANIZATIONS CO-ORDINATION BOARDThe Non-Governmental Organizations Co-ordination Board (hereinafter referred to as “the Board”) is a State Corporation established by an Act of Parliament, the Non-Governmental Organizations Co-ordination Act No. 19 of 1990 (hereinafter referred to as the Act). The Board’s broad mandate is to register, regulate, coordinate, and facilitate all NGOs operating in Kenya. Currently, the Board is under the office of the Vice President, Ministry of State for National Heritage and Culture. The Board was formed as a result of the recognition for the need for a legal and administrative framework to guide NGO operations in Kenya.
Prior to the establishment of the Board, NGOs were registered under different legal regimes. This made regulation of their operations difficult. The Act envisaged the establishment of a single regulator of all charitable organizations operating in Kenya. However, this has not been possible since NGOs continue to be registered under various laws.
Specifically, the Board is mandated to:
• Register, coordinate and facilitate the work of national and international NGOs operating in Kenya• Maintain a register of national and international NGOs operating in Kenya, with their precise sec-
tors, affiliations and location of their activities• Receive, analyze and evaluate the annual reports of NGOs• Advise the Government on the activities of NGOs and their role in development within Kenya• Conduct a regular review of the Register and to determine its consistency with the reports submit-
ted by NGOs and the NGO Council.
Chapter One1

20 • National Survey of NGOs Report | 2009 National Survey of NGOs Report | 2009 • 21
to validate data on all NGOs registered with the Board and collect additional information on awareness of the Board’s mandate and regulatory issues in the sector.
1.6 EXPECTED RESULTS The exercise anticipated the following key outputs:
• Information would be generated to enable the Board implement a proportionate approach in its enablement and regulation of NGOs.
• The Board could develop a framework for measuring and demonstrating the contribution of the NGO sector to the national economy and the overall development of the country.
• The Board would generate data to guide improved enablement and regulation of the NGO sector.• Improved public confidence and goodwill towards the NGO sector.
1.7 POLICY IMPLICATIONSThe study findings will help the Board to:
• Implement a proportionate approach in its enablement and regulation of NGOs.• Develop a framework for measuring and demonstrating the contribution of the NGO sector to the
national economy and the overall development of the country.• Improve enablement and regulation of the NGO sector.• Inform the drafting of Code of conduct. • Determine ‘public benefit’ for tax benefit status. • Determine a case for bringing all organizations that are charitable in nature under one regulatory
body.
collect information ranging from basic data on the challenges faced by NGOs and feedback on services currently provided by the Board. Key informants were also visited and interviewed.
v. Data entry and analysis.
vi. Report writing
For the purposes of the survey, Nyanza Province was divided into two administrative areas: Nyanza south and Nyanza central. Rift Valley Province was divided into north, south and central while Eastern Province was also divided into upper and lower Eastern. Nairobi Province was zoned into Kasarani, Embakasi, Langata and Westlands divisions. However, Central, Western and Coast provinces were not sub-divided.
Each supervisor was assigned a district, while enumerators were allocated proportionately based on the number of NGOs. Guides were also identified to help the supervisors map the distribution of NGOs prior to and during the survey. The selection of guides was based on their knowledge of the district as well as with the physical locations of NGOs in the district. All guides were residents of these districts.
The technical co-ordinator and regional co-ordinators conducted reconnaissance before the actual sur-vey. This involved meeting the DCs, District Development Officers (DDOs) and District Officers (DOs) to sensitize them on the intended survey as well as informing them of the Board’s mandate. They also arranged for accommodation for supervisors and enumerators.
1.4 OBJECTIVES OF THE SURVEY The overarching goal of this study was to enhance regulation of NGOs in order to increase their effec-tiveness and improve public trust and confidence in them. Thus, this survey sought to validate existing data on NGOs operating in the country. Specifically, this survey sought to:
• Establish basic information on NGOs• Validate NGOs income and expenditure in 2005/6• Verify the source(s) of NGOs funds and collaborators for the period 2005/6• Establish NGOs assets as reported in their last inventory• Establish the number of staff both paid and unpaid and their nationality• Establish the numbers of work permit applications recommended by the Board between 2004 and
2005 • Establish how often NGOs held elections• Establish awareness of Board’s mandate and existence• Determine the levels of satisfaction with services provided by the Board• Explore the successes in projects implemented by NGOs• Explore the challenges faced by NGOs in implementing projects• Establish the level of participation in local development initiatives and committees
1.5 RATIONALE OF THE SURVEYThe Board collects data on NGOs in the country annually through the information contained in annual returns. However, this has not been quite successful due to low compliance. There was therefore need to update data on NGOs since the available information was inadequate. This lack of adequate information has constrained the Board’s capacity to quantify the role played by NGOs in national development and identify opportunities for improved enablement of the sector. The national survey was therefore meant
22 • National Survey of NGOs Report | 2009 National Survey of NGOs Report | 2009 • 23
Development Officers to establish their perception of the sector’s regulatory framework and knowledge of NGO activities at the grassroots.
2.3 METHODS OF DATA ANALYSISData were entered on MS Access while analysis and graphicals were done in both Statistical Package for Social Scientists (SPSS) and MS Excel.
2.4 LIMITATIONS OF THE STUDY• The survey was carried out at different periods in May 2007, September, 2007 and October, 2008.
Therefore, it is possible that the perception of the survey may have changed thereby influencing the kind of information that was disclosed by the respondents.
• The NGOs were visited in their offices, while those without offices were interviewed in convenient locations. This made it difficult to countercheck information provided by some NGOs.
• Some questions were not answered by the respondents. Therefore, it is possible that some NGO officials interviewed were not conversant with the Board’s mandate and services. This led to collec-tion of incomplete information on certain NGOs.
• Because of the election violence that followed the 2007 elections, some NGOs which had already been interviewed moved to areas that had not been covered while others relocated to regions which had been covered in the first two phases of the survey. Out of all the NGOs interviewed, only 96 were selected for validation. However, the sample size may not be considered to be statisti-cally representative of the total population.
• Despite the levels of NGOs awareness about the national survey, some still thought that it was an audit, hence were reluctant to participate in the survey, while others provided inadequate informa-tion.
2.5 ASSUMPTIONS OF THE STUDYThe following assumptions underpinned this study:
• All NGOs Registered had physical addresses• All NGOs Registered were operating at their physical addresses indicated in the Board’s Register• All NGOs would were to provide responsible officers to respond to all the questions• That the validation analysis drawn from 96 NGOs who had responded to both the questionnaire in
the national survey and through NGOs self-reporting using Form 14 was fairly representative.
2.0 METHODOLOGY
2.1 STUDY AREA AND POPULATION SIZEA pilot study was conducted in Bungoma District to test the tool for data collection in December, 2006.This was followed by the actual survey in eight provinces in three phases as follows:
• The first phase in Nairobi, Nyanza, and Western (except Mt. Elgon District) provinces was carried out from May 21-29, 2007. However, the exercise was extended to May 28, 2007 in Nyanza prov-ince and to May 29, 2007 in Nairobi province due to high concentration of NGOs in these regions.
• The second phase in Central, Eastern and Coast provinces was conducted between September 3-8, 2007.
• The third phase in Rift Valley and North Eastern provinces was done between October 13-17, 2008. Mt Elgon District was also covered in the third phase due to insecurity in the region in 2007.
All 5,929 NGOs registered with the Board as at various dates when the survey was conducted were targeted in the study.
2.2 METHODS OF DATA COLLECTIONRegistered NGOs were visited at their offices by enumerators on behalf of the Board to collect informa-tion ranging from basic data on the NGOs, challenges faced and obtain feedback on services provided by the Board. Officials of NGOs without offices were interviewed at places convenient for them. A pilot study was carried out in Bungoma District between October 26 and November 5, 2006. The question-naires contained both open and close-ended questions and were interviewer administered. Key infor-mant interviews were also conducted with members of the provincial administration and the District
Chapter Two2

24 • National Survey of NGOs Report | 2009 National Survey of NGOs Report | 2009 • 25
that were interviewed. This implies that only 22 per cent of NGOs registered with the Board could be traced, 78 per cent could not be traced and did not participate in this survey. It can be inferred that these organisations had either ceased operations without informing the Board (as required by law), had filed wrong informa-tion on their areas of operation and address or were inactive (See figure 3.1.1a).A total of 2,029 NGO offices were visited in various parts of the country. They were either regional, main or branch offices. A regional office refers to an International NGO based in Kenya which coordinates activities in other African countries, main office is the head office of an NGO operating in and headquartered in Kenya and a branch is any office which is coordinated by a main office to implement the organization’s programmes.
Table3.1.1: Number and Scope of NGOs interviewed
Scope of operation Number
National 1,283
International 367
Did not indicate 379
Total 2,029
Some 63 per cent of NGOs interviewed were national in scope (1,283) compared with 19 per cent international NGOs (367). Some 19 per cent of those interviewed were unsure on their scope of operation as indicated in figure 3.1.1d. It is possible that the respondents could have been newly employed staff and were not conversant with the NGO scope of operation. This could be due to inadequate induction of new staff by NGOs on their registration status. On the other hand, this could also imply a worrying lack of awareness by NGOs on basic issues regarding their registration status. The foregoing concerns are further exacerbated by the fact that in some instances, respondents in different branches of the same organization provided inconsistent information.
3.1.2 STATUS OF OFFICE Respondents were requested to state the status
3.0 THE SURVEY FINDINGS
A total of 3,000 questionnaires were administered to various organisations. However, only 2,029 questionnaires were complete and valid for the following reasons:-
• Some were Community Based Organizations (CBOs).• Some completed questionnaires were also spoilt and
were therefore invalid for analysis.• Some NGOs terminated their interviews prematurely.
3.1 BASIC INFORMATION ON NGOs The purpose of the survey was to validate existing data on NGOs registered with the Board and are operational. There-fore, NGOs visited were requested to provide their Names; Postal and Physical addresses; Telephone, Cell phone, Fax and E-mail details. They were also asked to provide infor-mation regarding their websites, internet and telephone access details, status and location of their Main or Regional Offices in Kenya.
3.1.1 NUMBER AND SCOPE OF NGOs INTERVIEWED According to the Board’s Register at the time of the survey, there were 5,929 registered NGOs compared with 1,334
TOTAL
Did not indicate physical address
Numbers of NGOs registered Numbers of NGOs Interviewed
North Eastern
Western
Coast
Central
Rift Valley
Eastern
Nyanza
Nairobi
0 1000 2000 3000 4000 5000 6000
59292029
1215
12953
166123
140159175163
1231233
164258271
332
7082438
0
NGOs not found78%
NGOs found & interviewed
22%
Figure 3.1.1a: Number of NGOs interviewed by percentages
Figure 3.1.1b: Breakdown of NGOs by province comparing number of registered NGOs and those actually found
Main of�ce60%
Branch of�ce31%
Regional of�ce6%
No physical address
3%
Figure 3.1.2b: pie chart on the distribution of NGOs’ Regional, Main and Branch offices
National22%
Did not indicate
19%
International18%
Figure 3.1.1d: Scope of NGOs interviewed by percentages
Chapter Three3

26 • National Survey of NGOs Report | 2009 National Survey of NGOs Report | 2009 • 27
of their office. The offices visited were either Regional- im-plying the office coordinated activities within more than one country; branch, meaning the office was the subsidiary with a main office located in Kenya; or main office. Out of 5,929 organisations in the Board’s register at the time of the survey, only 1,334 NGO were found. The survey established that there were 120 active regional offices and 1,214 main offices. The foregoing organizations had 622 branches. Based on the foregoing figures, 60 per cent of the NGO offices visited were main offices, six per cent were regional offices and 31 per cent were branch offices as illustrated in figure 3.1.2b. It is also important to note that three per cent did not have physical addresses, although all NGOs are required to have a physical address.
Table 3.1.2a: status of office
Status of office Number
Main office 1,214
Regional Office 120
Branch office 622
No physical address 73
Total 2,029
Majority of the national NGOs visited were main offices (84 per cent), while 16 per cent were branch offices. This implies that only a few national NGOs had offices spread all over country. This could be due to inadequate financial capacity. Nonetheless, it should be noted that a number of organisations enhance their outreach by collaborating with other NGOs and institutions with similar objectives operat-ing in other regions (See figure 3.1.2c).
As illustrated in figure 3.1.2c, most international NGOs operating in the country (64 per cent) were headquartered in Kenya. Some 24 per cent were regional offices and 40 per cent were main offices, while 36 per cent were branch offices. It is important to note that main offices of some international NGOs are located in other countries but they have regional offices in Kenya to coordinate activities of their branch offices in Kenya and in other countries within region. On the other hand, some international NGOs’ main offices are based in the country.
3.1.3 NGOs WITH PHYSICAL ADDRESSMost of the NGOs (97 per cent) interviewed had physical addresses. Only three per cent did not have physical ad-dresses and were therefore interviewed at places convenient to them. These findings are consistent with the percentage
of NGOs that did not indicate their office status (See figure 3.1.3a).
It is also evident that more national NGOs (three per cent) did not have physical addresses compared with international NGOs (one per cent) as indicated in figure 3.1.3b.
3.1.4 NGOs WITH INTERNET ACCESS NGOs were also asked to indicate if they had access to the internet and where they accessed it from. The question sought to establish the viability of e-mail as a reliable and cost-effective medium of communication with NGOs as well as NGOs access to information technology. Most NGOs (76 per cent) had access to the internet as compared with 24 per cent that did not have as illustrated in figure 3.1.4a.
Internet access was more or less similar across the board with international NGOs only having a slight edge over national ones. Some 88 per cent of international NGOs had access to the internet facilities compared to 78 per cent of national NGOs as indicated in figure 3.1.4b. This implies that scope of operations is not a significant factor in influ-encing access to internet facilities.
Data gathered also showed that 40 per cent of the NGOs had access to internet in their offices while 35 per cent used cyber cafés. Another 25 per cent did not indicate where they access internet as illustrated in figure 3.1.4c.
As expected, most of International NGOs had access to internet in their offices (76 per cent), while 21 per cent used cyber café and three per cent did not indicate where they ac-cessed the internet. On the other hand, a significant number of national NGOs (51 per cent) depended on internet cafes for services with 43 per cent accessing the same from their offices. Some six per cent of national NGOs did not indicate where they accessed internet, (See figure 3.1.4d).
3.1.5 NGOs WITH FIXED TELEPHONE LINESAccording to data gathered, 56 per cent of NGOs had fixed telephone lines in their offices compared with 44 per cent that did not have as shown in figure 3.1.5a.
Most international NGOs (72 per cent) had fixed telephone lines installed in their offices compared to National NGOs (57 per cent) as illustrated in figure 3.1.5b.
3.1.6 NGOs THAT DISPLAYED REGISTRATION CERTIFICATES It is a requirement of the terms and conditions attached
INTERNATIONAL
Main of�ce40%
Branch 36%
Regional24%
NGOs without physical address
1%
NGOs with physical address
99%
INTERNATIONAL
Main of�ce84%
Branch of�ce16%
NATIONAL
NGOs with physical address
97%
NGOs withoutphysical address 3%
NATIONAL
NGOs with physical address
97%
NGOs without physical address
3%
NGOs with Internet access 76%
NGOs without Internet access
24%
Figure 3.1.2c: pie charts on the distribution of NGOs’ Regional, Main and Branch offices by scope Figure 3.1.3b: pie charts on physical address
by scope
Figure 3.1.3a: pie chart on NGOs with or without physical addresses
Figure 3.1.4a: a pie chart on NGOs with or without internet access

28 • National Survey of NGOs Report | 2009 National Survey of NGOs Report | 2009 • 29
• Rift Valley is the largest province in Kenya and has the highest population in the country hence higher demand for NGO services.
• Many NGOs may have shifted to Rift Valley after post-election violence to promote peace building and conflict resolution and carry out relief activities.
• The province has a high concentration of urban centres.• The larger Turkana area (mostly Lokichoggio) have a
high concentration of NGOs which use its strategic location to provide services to people Southern Sudan.
3.2.3 NGOs’ STRATEGIC APPROACH – ADVOCACY, SERVICE PROVISION AND CAPACITY BUILDING The survey sought to categorise NGOs based on the stra-tegic approach to their work. The study established that the strategic approaches used by NGOs in addressing their objectives could be categorized into three broad areas: ad-vocacy, service provision and capacity building. A number of NGOs employed more than one of these strategies. The survey findings showed that most NGOs are engaged in service provision (53 per cent) followed by capacity build-ing (38 per cent) and advocacy (nine per cent) as illustrated in figure 3.2.3a.
A breakdown of strategies employed by NGOs by province showed that Rift Valley Province most NGOs engaged in advocacy ((24 per cent) compared with service provi-sion (22 per cent) and capacity building (21 per cent). This could possibly be due to a relatively high number of NGOs engaged in peace building and conflict resoultion due the high levels of insecurity in the province. It is noteworthy that Nairobi(21 per cent) and Nyanza (16 per cent) also had a slightly higher number of NGOs involved in advocacy than in service provision or capacity building. However, this was not the case with Eastern, Coast, Central, Western and North Eastern provinces since slightly more NGOs in these regions were engaged in service provision and capacity building as comapred to advocacy as shown in figure 3.2.3b:
Survey findings also showed that more national NGOs (54 per cent) were involved in capacity building compared with International NGOs (51 per cent). In service provision, there was no significant difference in terms of scope, while majority of international NGOs (12 per cent) were engaged in advocacy compared with national ones (eight per cent).
to the certificate of registration that NGOs should visibly display the certificate at the office. Interviewers sought to establish if the NGOs interviewed had displayed their certificates in their offices. It was observed that 40 per cent of the NGOs displayed their certificates, while 60 per cent did not. This implies that NGOs were either ignorant of the requirement or had chosen to ignore it (See figure 3.1.6a).
However, the study findings showed that most national NGOs (53 per cent) displayed their certificates compared with international NGOs (46 per cent) as shown in figure 3.1.6b.
3.2 DISTRIBUTION OF NGOs3.2.1 ProvincesA total of 2,029 NGOs were interviewed in three phases of the survey on NGOs as follows: Nairobi (708) Nyanza (332), Eastern (258), Central (163), Coast (159), Rift Valley (233) Western (123), and North Eastern (53). The highest con-centration of NGOs was in Nairobi Province (35 per cent), while the lowest was in North Eastern Province (three per cent) as illustrated in figure 3.2.1.
The foregoing disparaties could be ascribed to the follow-ing:
• There is a tendency for newly registered NGOs to set up offices in Nairobi even though they intend to oper-ate in other regions.
• NGOs tend to establish offices in areas with infrastruc-ture which could explain the relatively low presence of NGOs in North Eastern Province.
3.2.2 DISTRIBUTION OF NGOs IN KENYA (IN TERMS OF SCOPE OF OPERATION)From figure 3.2.3, it can be observed that Rift Valley Prov-ince had the highest concentration of national NGOs (21 per cent) followed by Nairobi (18 per cent) and Nyanza (15 per cent) provinces respectively. However, the trend was different with international NGOs since Nairobi province had the highest percentage (22 per cent), followed by Rift Valley (21 per cent) and Eastern (14 per cent). North East-ern Province had the least concentration of international (six per cent) and national NGOs (four per cent).
The relatively high number of NGOs in Rift Valley Province could possibly be attributed to a number of factors::
INTERNATIONAL
With Internet access 88%
Without Internet access 12%
INTERNATIONAL
Did not indicate3%
Of�ce76%
Cyber cafe21%
NATIONAL
Without Internet access 22%
With Internet 78%
NATIONAL
Did not indicate6%
Of�ce43%
Cyber cafe51%
Of�ce40%
Did not indicate25%
Cyber cafe35%
With �xed telephone lines
56%
Without �xed telephone lines
44%
Figure 3.1.4b: percentage of NGOs with or without internet access by scope
Figure 3.1.4d: showing National and International NGOs accessed internet
Figure 3.1.4c: showing where NGOs accessed internet
Figure 3.1.5a: NGOs with fixed telephone lines by percentages

30 • National Survey of NGOs Report | 2009 National Survey of NGOs Report | 2009 • 31
lished as illustrated in figure 3.2.6b.
Table 3.2.6 (a): showing the number of Children’s Homes in each province
Province Approved Not Approved
Total
Central 23 2 25
Coast 30 1 31
Eastern 25 0 25
Nairobi 109 4 113
Nyanza 40 2 42
Western 6 1 7
Rift Valley 29 31 60
North Eastern 17 10 27
Total 279 51 330
It is important to note that Rift Valley Province (61 per cent) had the highest concentration of illegally established children’s homes, while in Eastern Province, all children’s homes were approved by the AAC.
There was no significant difference between the percentage of International (eight per cent) and national (10 per cent) NGOs operating children’s homes (See figure 3.2.6d).
It can be observed from the figure above that Nairobi Province (34 per cent) had the highest concentration of children’s homes, followed by Rift Valley (18 per cent) and Nyanza (13 per cent) provinces respectively. Western Prov-ince (two per cent) province had the least concentration of children’s homes.
3.3 FINANCES
3.3.1 SOURCES A total of KES 68,825,055,222.00 was received by NGOs as donations to fund various projects in 2005/6. These included traditional sources such as donor organizations and Government agencies, while non- traditional sources were in the form of contributions by NGO officials, mem-bers and community contributions. However, some NGOs did not disclose funding sources (See table 3.3.1a for more details).
3.2.4 SECTORAmong the NGOs that were interviewed, HIV/Aids sector had the highest percentage of NGOs (12 per cent), followed by education (11 per cent), percentages while energy, sports, refugee, housing, old age and informal sectors had the least percentage. It is important to note that many NGOs operate in more than one sector. It is instructive to note that only two per cent of NGOs where involved in the reproductive health and population sector a worrying trend considering current concerns about the increasing fertility rates in the country (See figure 3.2.4b for more details).
3.2.5 NGOs ENGAGED IN MICROFINANCEThis survey also sought to determine the number of NGOs that took deposits from members of the public or their beneficiaries. According to the Microfinance Act, 2006, all deposit-taking microfinance institutions are required to obtain a license from the Central Bank of Kenya. This law was enacted to improve the regulation of the fast expanding microfinance sector. At least four per cent of NGOs oper-ated in microfinance sector. Out of this 84 per cent were national NGOs while 16 per cent were International NGOs as shown in figure 3.2.5a.
As illustrated in figure 3.2.5b, 29 per cent of NGOs in mi-crofinance sector indicated that they were taking deposits from the public. It follows then that most NGOs in the microfinance sector are non-deposit taking, as such do not need to conform to the stringent requirements of the Micro-finance Act, 2007.
Among the NGOs that took deposits from the public, 89 per cent were national NGOs, while 11per cent were interna-tional NGOs (See figure 3.2.5c).
3.2.6 NGOs RUNNING CHILDREN HOMES Under the Children’s Act of 2001 and its attendant regula-tions of 2006, all children’s homes must be inspected and approved by the Area Advisory Council (AAC). The survey sought to establish the number of NGOs running children’s homes and whether these homes were approved by the AAC as required by law. According to the survey findings, there were 330 children’s homes in the country run by NGOs. Most of the children’s homes were approved (279) by the AAC, and 51 were not approved. This implies that 85 per cent of the Children’s homes were operating legally as required by the law, while 15 per cent were illegally estab-
INTERNATIONAL
With �xed telephone lines
72%
Without �xed telephone lines
28%
INTERNATIONAL
Did not display certi�cates
54%
Displayed certi�cates
46%
NATIONAL
With �xed telephone lines
57%
Without �xed telephone lines
43%
NATIONAL
Did not display certi�cates
47%
Displayed certi�cates
53%
Did not display certi�cates
60%
Displayed certi�cates
40%
Central 8%
Eastern 13% Nyanza 16%
Coast 8%
Rift Valley 11%
Western 6%
North Eastern 3%
Nairobi35%
Figure 3.1.5b: pie charts showing NGOs with fixed telephone lines by scope
Figure 3.1.6b: NGOs that Displayed registration certificates by scope
Figure 3.1.6a: NGOs that displayed registration certificates by percentages
Figure 3.2.1: distribution of NGOs in various provinces by percentages

32 • National Survey of NGOs Report | 2009 National Survey of NGOs Report | 2009 • 33
3.3.3 EXPENDITUREAccording to data collected, NGOs spent KES 16,130,192,509.00 on projects, while they used KES 3,326,606,185.00 on administration and KES 4,415,309,351.00 on personnel. Others costs consumed KES 2,140,187,659.00. In total NGOs that were interviewed spent KES 26,012,295,704.00 in 2005/6 as indicated in table 3.3.3a. Table 3.3.3a: NGOs’ expenditure
National International Did not specify scope Total
Project 8,444,636,425.00 6,639,797,303.00 1,045,758,781.00 16,130,192,509.00
Administration 1,277,810,386.00 1,877,451,077.00 171,344,722 3,326,606,185.00
Personnel 1,981,489,050.00 2,180,066,934.00 253,753,367 4,415,309,351.00
Other costs 775,853,975.00 1,243,184,057.00 121,149,627 2,140,187,659.00
TOTAL 12,479,789,836.00 11,940,499,371.00 1,592,006,497.00 26,012,295,704.00
Table 3.3.1.a: showing NGOs’ sources of funds in 2005/6
ORGANIZATION TYPE AMOUNT
Public Foundation /Trusts /private foundation
36,031,651,169.00
International Governmental Aid Agencies /Embassies
6,809,746,309.00
International NGO 5,069,797,368.00
Individual and corporate Dona-tions
2,817,400,694.00
UN/ AU 1,723,421,954.00
Religious Organizations 1,443,615,227.00
Income Generating Activities 777,087,425.00
Membership subscriptions 185,287,567.00
National NGO 183,926,011.00
Kenya Government Agency 181,286,114.00
Community 118,486,193.00
Directors contributions 57,397,334.00
Devolved Funds 54,087,768.00
Unspecified sources 13,371,864,089.00
TOTAL 68,825,055,222.00
A greater percentage of donations were from Public and Private Foundations and Trusts (52 per cent), International Governmental Aid Agencies/Embassies (10 per cent) and International NGOs (8 per cent).
Further data analysis showed that International NGOs re-ceived most of the funds (69%) donated to various organisa-tions compared with National NGOs (31%) as illustrated in figure 3.3.1c.
3.3.2 DONOR COUNTRIESIt is evident that most donations to NGOs were from Ger-many (58 per cent); Kenya (in country donations) (12%); United States (nine per cent); Netherlands (eight per cent) and United Kingdom (seven per cent) respectively (See figure 3.3.1c).
INTERNATIONAL
Nairobi22%
Central 7%
Rift Valley 21%
Nyanza 13%
Western 8%
Coast 9%
Eastern 14%
North Eastern 6%
NATIONAL
Nairobi18%
Central 12%
Rift Valley 21%Nyanza 15%
Western 8%
Coast 8%
Eastern 14%
North Eastern 4%
Service Provision53%
Advocacy9%
Capacity38%
Figure 3.2.3: Distribution of NGO offices in Kenya in terms of scope of operation
Figure 3.2.3a: a pie chart showing NGOs distribution in terms of strategic approach
24%
22%21% 21%
16%
18%
12%
16%15%
16%
13% 13%
9%10%
9%8%
9%10%
7%8% 8%
3%
6% 6%
Rift Valley Nairobi Eastern Nyanza Coast Central Western North Eastern
Service Provision Capacity BuildingAdvocacy
0
5
10
15
20
25
8%
12%
38% 37%
54%
51%
InternationalNational
Service Provision Capacity BuildingAdvocacy
0
10
20
30
40
50
60
10891059
901
748
634
573544
518
364331 325
247 241 240 234196 185 178 177
122 12074 73 70 63
0
200
400
600
800
1000
1200
HIV/
AIDS
Educ
atio
n
Heal
thCh
ildre
n
Agric
ultu
re
Envir
onm
ent &
Con
serv
atio
n
Wat
er &
San
itatio
n
Yout
h
Mic
ro-F
inan
ce
Hum
an R
ight
sAd
voca
cy &
Leg
al A
id
Relie
f
Info
rmat
ion
Gove
rnan
ce
Othe
rs
Peac
e Bu
ildin
g
Popu
latio
n &
Repr
oduc
tive
Heal
th
Cultu
re
Disa
bilit
y
Spor
ts
Info
rmal
Sec
tor
Hous
ing
& Hu
man
Set
tlem
ent
Old A
ge C
are
Refu
gees
Ener
gy
Figure 3.2.3c: NGOs distribution in terms of strategic approach by scope
Figure 3.2.3b: NGOs distribution in terms of strategic approach by province
Figure 3.2.4a: a bar graph showing NGOs distribution in terms of sectors of operation

34 • National Survey of NGOs Report | 2009 National Survey of NGOs Report | 2009 • 35
The survey findings also showed that the total ex-penditure by national NGOs was slightly higher than international NGOs in 2005/6 as shown in figure 3.3.3b.
On the other hand, expenditure by national NGOs on projects (68 per cent) was higher compared with international NGOs (56 per cent). While international NGOs spent more on personnel (18 per cent) and administration (16 per cent) compared with the amount spent by national NGOs on the same as illustrated in figure 3.3.3c. This could be due to the fact that international NGOs employed more expatriates who were paid higher salaries compared with the local staff.
If we were to use the percentage of money spent on direct project implementation against that spent on personnel and administration costs as an indicator for efficiency, then it might be concluded that national NGOs are more efficient than international NGOs, since national NGOs on average spent 68 per cent of their income on projects as opposed to international NGOs, which spent 56 per cent. Part of the reason for this is that international NGOs tend to provide higher salaries and provide more benefits for staff and concurrently employ more expatriate staff. Generally, NGOs seem to spend insignificant amount of money on administration (13 per cent) and personnel (17 per cent). Other run-ning costs consumed eight per cent of the NGOs’ expenditures (See figure 3.3.3d for more details).
3.3.4 COMPARISON OF SURVEY INFORMATION AGAINST INFORMATION PROVIDED BY NGOS IN THEIR RETURNSOne of the objectives of the survey was to validate self-reported data received by the Board from NGOs mainly through their annual returns. Data from 96 NGOs who had responded to both the questionnaire in the national survey and through the self-administered Form 14 were compared for the period 2006/6. Data in comparable variables in both tools were analyzed comparatively to corroborate information given by the NGOs as illustrated in table 3.3.4a and figure 3.3.4b. Data analysed showed that NGOs under-reported the
amount spent on projects, personnel and on other running costs on Form 14. However, data collected on administrative costs indicated that it was over-reported on Form 14 compared with the national survey. Overall, there was a Standard Deviation of 7.23433 regarding financial information provided by these organizations during the national survey from Form 14.
Table 3.3.4a: provides data on NGOs’ expenditure from the National Survey and Form 14
Expenditure Item National Survey Form 14 Deviation
Projects 33,080,079.00 25,825,155.00 7,254,924.00
Administration 5,775,103.00 6,250,169.00 -475,066.00
Personnel 9,908,826.00 8,013,550.00 1,895,276.00
Other Costs 1,390,164.00 1,165,526.00 224,638.00
Total Expenditure 50,154,172.00 41,254,400.00 8,899,772.00
DEVSQ 7.23433
3.3.5 ASSETSData gathered on assets owned by NGOs as per their last inventory in 2005/6 showed that 54 per cent were furniture and equipment; computers accounted for 20 per cent; Motor Vehicles, 13per cent; Land, six per cent; buildings (six per cent. Stocks, which included medical and agricultural stocks accounted for only one per cent as illustrated in the figure below. It would appear then that most NGO assets where held in movable assets with only 12 per cent of them owning either buildings or land. Further, only one per cent was held in stocks thereby raising issues on their sustainability.
HIV/AIDS
Education
Health
Children
Agriculture
Environment & Conservation
Water & Sanitation
Youth
Micro-Finance
Human Rights
Advocacy & Legal Aid
Relief
Information
Governance
Others
Peace Building
Population & Reproductive Health
Culture
Disability
Sports
Informal Sector
Housing & Human Settlement
Old Age Care
Refugees
Energy
12%
11%
10%
8%
7%
6%6%
6%
4%
4%
3%
3%
3%
3%
3%
2%
2%
2% 2%
1% 1%1%
1%1%1%
Figure 3.2.5a: a pie chart on the number of NGOs engaged in Microfinance
Figure 3.2.4b: a pie chart on NGOs distribution in terms of sectors of operation
National NGOs89%
International NGOs11%
Approved85%
Not approved15%
Figure 3.2.5c: percentage of deposit-taking National and International NGOs
Figure 3.2.6b: a pie chart showing Children’s Home operating with or without approval
National NGOs84%
InternationalNGOs16%
Figure 3.2.5b: showing the percentage of deposit-taking Microfinance NGOs
Do not take deposits
71%
Take deposits29%

36 • National Survey of NGOs Report | 2009 National Survey of NGOs Report | 2009 • 37
Among the paid staff, majority were men (56 per cent) compared with women (44 per cent)., However, most women (80 per cent) worked as unpaid staff or volunteered their services to charity work compared with men (20 per cent).
According to the data collected, most of NGO employees were both working as unpaid staff or volunteers and only 14 per cent were paid staff (See figure 3.4.1c).
Distribution of staff across scope: Data gath-ered also showed that international NGOs (79 per cent) engaged more paid staff compared with National NGOs (eight per cent). This could be due to the fact international NGOs have better access to funding and can afford to employ more staff either on long term or temporary basis (See figure 3.4.1d).
Gender and scope: Further data analysis also showed that more men (55 per cent) work with international NGOs compared with women (45 per cent), while majority of Na-tional NGOs’ employees were women (78 per cent) and only 22 per cent were men as shown in figure 3.4.1e.
Regarding gender parity, most NGO staff were women (75 per cent) compared with men (25 per cent). Nonetheless, as has been noted most of the female staff were volunteers.
3.4.2 NATIONALITY OF STAFF (LOCAL AND FOREIGN STAFF)Most of the NGOs interviewed employed more Kenyans (103,684) compared with foreign nationals (944) as detailed in the figure below. It can also be observed that 91% of international NGO staff were Kenyans com-pared with nine per cent foreign nationals as illustrated in figure 3.4.2(ii).
3.4.3 EXPATRIATES AND WORK PERMITSNGOs seeking to engage international staff are required to apply for letters of recommenda-tion to the Ministry of State for Immigration from the Board for the purposes of obtaining
3.4 PERSONNEL
3.4.1 PAID AND VOLUNTEER STAFF Data gathered on 1,334 NGOs visited showed that 104,628 staff was engaged by them as follows: paid staff (14,217) volunteers (90,411) as shown in table 3.4.1a.
Table 3.4.1a: provides a breakdown on paid and volunteer staff in terms of scope and gender
Category
Scope Grand Total
Gender International National
Paid F 2,792 3,499 6,291
M 3,866 4,060 7,926
Paid Total
6,658 7,559 14,217
Unpaid F
978
71,683 72,661
M
823
16,927 17,750
Unpaid Total
1,801 88,610 90,411
Grand Total
8,459
96,169 104,628
INTERNATIONAL
Without children’s homes92%
With children’s home8%
NATIONAL
Without children’s homes90%
With children’s home10%
Western 2%
Nairobi34%
Nyanza 13%Rift Valley 18%
North Eastern 8%
Central 8%
Coast 8%
Eastern 8%
Figure 3.2.6d: Distribution of children’s homes by scope
Rift Valley NairobiEastern NyanzaCoastCentralWestern
2% 2%6%
19%
8%4%
9%
0%
11%
2%
11%
61%
14%
39%
8%4%
North Eastern
Approved Not Approved
0
10
20
30
40
50
60
70
80
Figure 3.2.6c: showing the distribution of children’s homes in each province in percentages
Figure 3.2.6e: Distribution of children’s Homes in the country
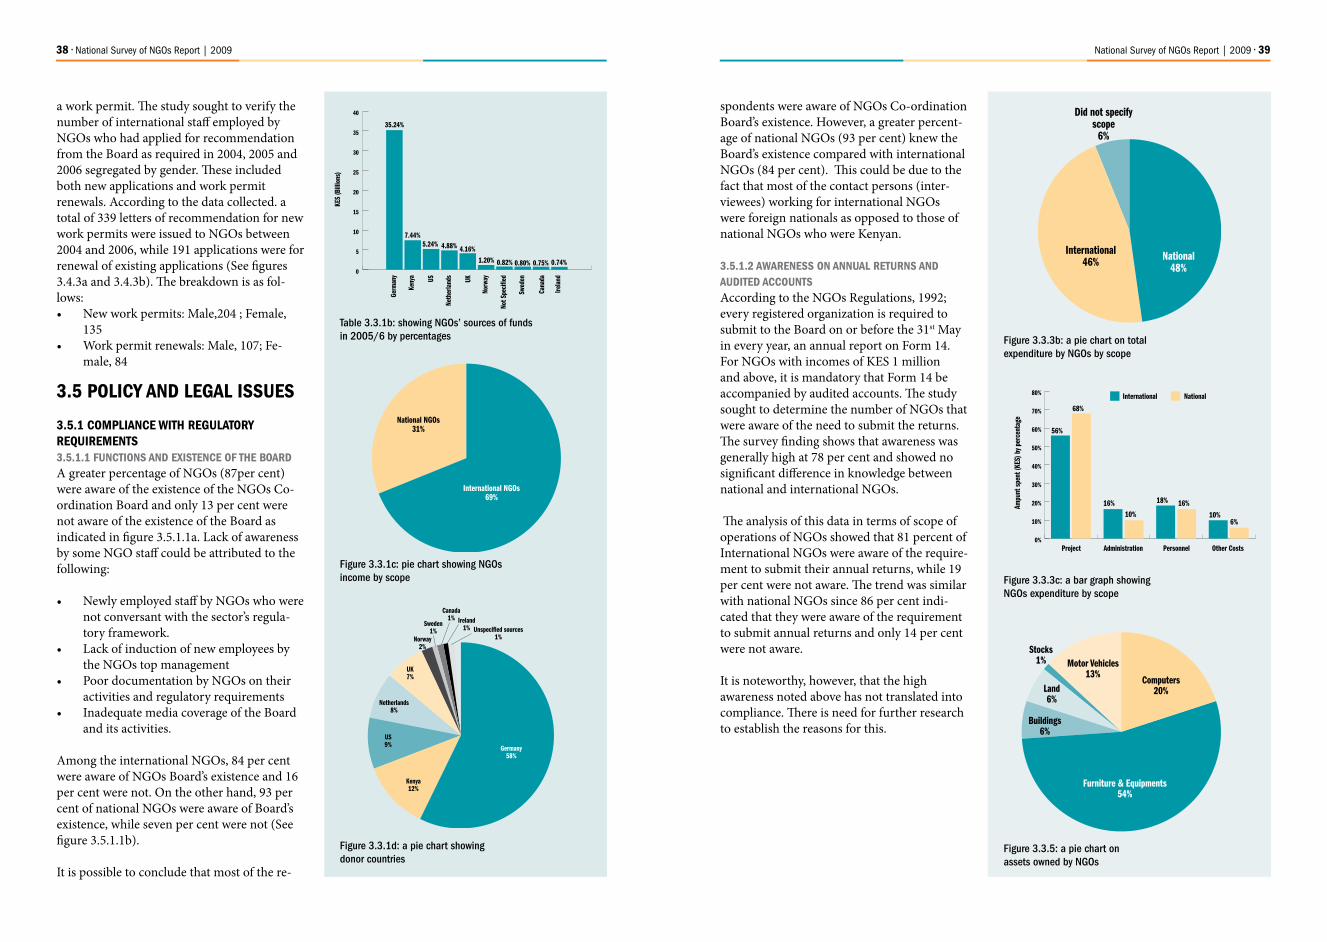
38 • National Survey of NGOs Report | 2009 National Survey of NGOs Report | 2009 • 39
spondents were aware of NGOs Co-ordination Board’s existence. However, a greater percent-age of national NGOs (93 per cent) knew the Board’s existence compared with international NGOs (84 per cent). This could be due to the fact that most of the contact persons (inter-viewees) working for international NGOs were foreign nationals as opposed to those of national NGOs who were Kenyan.
3.5.1.2 AWARENESS ON ANNUAL RETURNS AND AUDITED ACCOUNTS According to the NGOs Regulations, 1992; every registered organization is required to submit to the Board on or before the 31st May in every year, an annual report on Form 14. For NGOs with incomes of KES 1 million and above, it is mandatory that Form 14 be accompanied by audited accounts. The study sought to determine the number of NGOs that were aware of the need to submit the returns. The survey finding shows that awareness was generally high at 78 per cent and showed no significant difference in knowledge between national and international NGOs.
The analysis of this data in terms of scope of operations of NGOs showed that 81 percent of International NGOs were aware of the require-ment to submit their annual returns, while 19 per cent were not aware. The trend was similar with national NGOs since 86 per cent indi-cated that they were aware of the requirement to submit annual returns and only 14 per cent were not aware.
It is noteworthy, however, that the high awareness noted above has not translated into compliance. There is need for further research to establish the reasons for this.
a work permit. The study sought to verify the number of international staff employed by NGOs who had applied for recommendation from the Board as required in 2004, 2005 and 2006 segregated by gender. These included both new applications and work permit renewals. According to the data collected. a total of 339 letters of recommendation for new work permits were issued to NGOs between 2004 and 2006, while 191 applications were for renewal of existing applications (See figures 3.4.3a and 3.4.3b). The breakdown is as fol-lows:• New work permits: Male,204 ; Female,
135• Work permit renewals: Male, 107; Fe-
male, 84
3.5 POLICY AND LEGAL ISSUES
3.5.1 COMPLIANCE WITH REGULATORY REQUIREMENTS 3.5.1.1 FUNCTIONS AND EXISTENCE OF THE BOARD A greater percentage of NGOs (87per cent) were aware of the existence of the NGOs Co-ordination Board and only 13 per cent were not aware of the existence of the Board as indicated in figure 3.5.1.1a. Lack of awareness by some NGO staff could be attributed to the following:
• Newly employed staff by NGOs who were not conversant with the sector’s regula-tory framework.
• Lack of induction of new employees by the NGOs top management
• Poor documentation by NGOs on their activities and regulatory requirements
• Inadequate media coverage of the Board and its activities.
Among the international NGOs, 84 per cent were aware of NGOs Board’s existence and 16 per cent were not. On the other hand, 93 per cent of national NGOs were aware of Board’s existence, while seven per cent were not (See figure 3.5.1.1b).
It is possible to conclude that most of the re-
35.24%
7.44%5.24% 4.88% 4.16%
1.20% 0.82% 0.80% 0.75% 0.74%
Germ
any
KES
(Bill
ions
)
Keny
a US
Neth
erla
nds
UK
Norw
ay
Not S
peci
�ed
Swed
en
Cana
da
Irela
nd
0
5
10
15
20
25
30
35
40
International NGOs69%
National NGOs31%
Germany58%
Kenya12%
US9%
Netherlands8%
UK7%
Norway2%
Sweden1% Unspeci�ed sources
1%
Ireland1%
Canada1%
Figure 3.3.1c: pie chart showing NGOs income by scope
Table 3.3.1b: showing NGOs’ sources of funds in 2005/6 by percentages
Figure 3.3.1d: a pie chart showing donor countries
National 48%
International46%
Did not specifyscope
6%
Ampu
nt s
pent
(KES
) by p
erce
ntag
e
Project
56%
68%
16%10%
18% 16%
10%6%
Administration
International National
Personnel Other Costs0%
10%
20%
30%
40%
50%
60%
70%
80%
Computers20%
Motor Vehicles13%
Land6%
Stocks1%
Buildings6%
Furniture & Equipments54%
Figure 3.3.3b: a pie chart on total expenditure by NGOs by scope
Figure 3.3.3c: a bar graph showing NGOs expenditure by scope
Figure 3.3.5: a pie chart on assets owned by NGOs
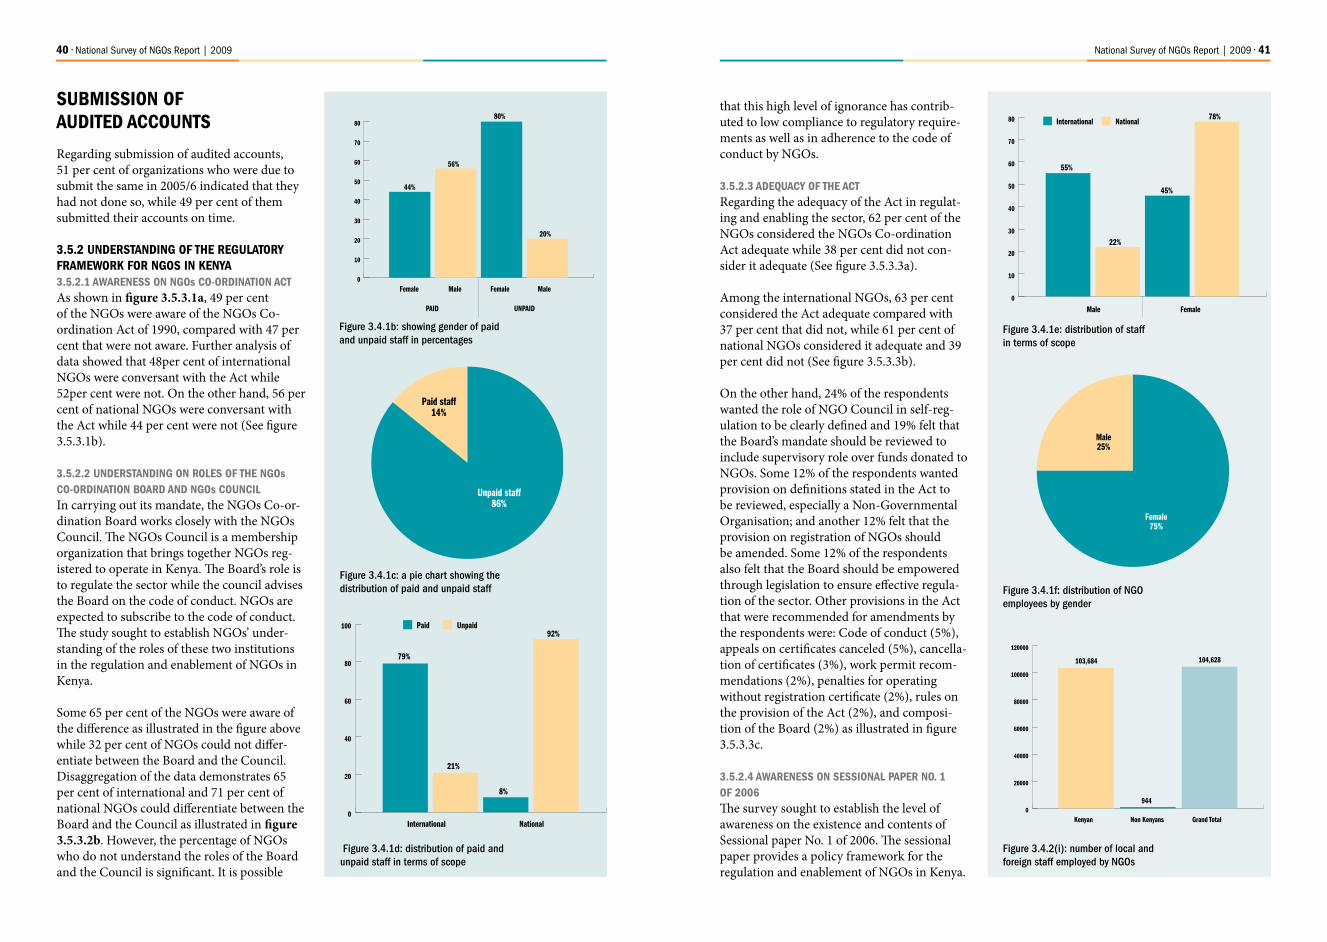
40 • National Survey of NGOs Report | 2009 National Survey of NGOs Report | 2009 • 41
that this high level of ignorance has contrib-uted to low compliance to regulatory require-ments as well as in adherence to the code of conduct by NGOs.
3.5.2.3 ADEQUACY OF THE ACT Regarding the adequacy of the Act in regulat-ing and enabling the sector, 62 per cent of the NGOs considered the NGOs Co-ordination Act adequate while 38 per cent did not con-sider it adequate (See figure 3.5.3.3a).
Among the international NGOs, 63 per cent considered the Act adequate compared with 37 per cent that did not, while 61 per cent of national NGOs considered it adequate and 39 per cent did not (See figure 3.5.3.3b).
On the other hand, 24% of the respondents wanted the role of NGO Council in self-reg-ulation to be clearly defined and 19% felt that the Board’s mandate should be reviewed to include supervisory role over funds donated to NGOs. Some 12% of the respondents wanted provision on definitions stated in the Act to be reviewed, especially a Non-Governmental Organisation; and another 12% felt that the provision on registration of NGOs should be amended. Some 12% of the respondents also felt that the Board should be empowered through legislation to ensure effective regula-tion of the sector. Other provisions in the Act that were recommended for amendments by the respondents were: Code of conduct (5%), appeals on certificates canceled (5%), cancella-tion of certificates (3%), work permit recom-mendations (2%), penalties for operating without registration certificate (2%), rules on the provision of the Act (2%), and composi-tion of the Board (2%) as illustrated in figure 3.5.3.3c.
3.5.2.4 AWARENESS ON SESSIONAL PAPER NO. 1 OF 2006The survey sought to establish the level of awareness on the existence and contents of Sessional paper No. 1 of 2006. The sessional paper provides a policy framework for the regulation and enablement of NGOs in Kenya.
SUBMISSION OF AUDITED ACCOUNTS
Regarding submission of audited accounts, 51 per cent of organizations who were due to submit the same in 2005/6 indicated that they had not done so, while 49 per cent of them submitted their accounts on time.
3.5.2 UNDERSTANDING OF THE REGULATORY FRAMEWORK FOR NGOS IN KENYA3.5.2.1 AWARENESS ON NGOs CO-ORDINATION ACTAs shown in figure 3.5.3.1a, 49 per cent of the NGOs were aware of the NGOs Co-ordination Act of 1990, compared with 47 per cent that were not aware. Further analysis of data showed that 48per cent of international NGOs were conversant with the Act while 52per cent were not. On the other hand, 56 per cent of national NGOs were conversant with the Act while 44 per cent were not (See figure 3.5.3.1b).
3.5.2.2 UNDERSTANDING ON ROLES OF THE NGOs CO-ORDINATION BOARD AND NGOs COUNCIL In carrying out its mandate, the NGOs Co-or-dination Board works closely with the NGOs Council. The NGOs Council is a membership organization that brings together NGOs reg-istered to operate in Kenya. The Board’s role is to regulate the sector while the council advises the Board on the code of conduct. NGOs are expected to subscribe to the code of conduct. The study sought to establish NGOs’ under-standing of the roles of these two institutions in the regulation and enablement of NGOs in Kenya.
Some 65 per cent of the NGOs were aware of the difference as illustrated in the figure above while 32 per cent of NGOs could not differ-entiate between the Board and the Council. Disaggregation of the data demonstrates 65 per cent of international and 71 per cent of national NGOs could differentiate between the Board and the Council as illustrated in figure 3.5.3.2b. However, the percentage of NGOs who do not understand the roles of the Board and the Council is significant. It is possible
Female
PAID
44%
56%
80%
20%
UNPAID
Male Female Male0
10
20
30
40
50
60
70
80
55%
22%
45%
78%
Male Female
International National
0
10
20
30
40
50
60
70
80
Unpaid staff86%
Paid staff14%
Female75%
Male25%
79%
21%
8%
92%
International
Paid Unpaid
National0
20
40
60
80
100
103,684
944
104,628
Kenyan Non Kenyans Grand Total0
20000
40000
60000
80000
100000
120000
Figure 3.4.1b: showing gender of paid and unpaid staff in percentages
Figure 3.4.1c: a pie chart showing the distribution of paid and unpaid staff
Figure 3.4.1d: distribution of paid and unpaid staff in terms of scope
Figure 3.4.1e: distribution of staff in terms of scope
Figure 3.4.1f: distribution of NGO employees by gender
Figure 3.4.2(i): number of local and foreign staff employed by NGOs

42 • National Survey of NGOs Report | 2009 National Survey of NGOs Report | 2009 • 43
NGOs Co-ordination Regulations of 1992.
Majority of the NGOs (60 per cent) inter-viewed were aware of the Regulations and the Code of Conduct. This is evident in the study findings since most of international (60 per cent) and national (66 per cent) NGOs indicated that they knew of the Regulations and Code of Conduct as illustrated in figure 3.5.3.5b.
3.6 GOVERNANCENGOs operate by a set of rules prescribed in the NGOs Co-ordination Act 1990 and its attendant Regulations of 1992. In addition, NGOs are regulated substantially through enforcement of the organization’s founding documents. They are required to hold regular meetings to discuss progress as well as annual general meetings to bring out renewal in their leadership as provided for in their constitu-tions. The study sought to establish the extent to which NGOs adhered to this requirement. Regular meetings by NGOs to report to stakeholders as well as regular elections are a good practice that is a prerequisite for good governance. The survey sought to determine regularity of elections, date of last elections and date of last AGMs. According to study findings, 88 per cent of the NGOs had not held an AGM during the period in review. This demonstrates that a significant number of NGOs do not comply with the provisions of their constitution in governing themselves. It also shows that many NGOs do not renew themselves through regular elections neither do they account to members as required through AGMs.
3.7 PROJECT IMPLEMENTATIONThe Board has a responsibility to quantify the contribution by NGOs in national develop-ment and concurrently enable NGOs to ensure they operate optimally. The study consequent-ly sought to involve NGOs in a self assessment to establish their successes and challenges in project implementation.
Most of the NGOs (68 per cent) were not aware of the Sessional Paper No. 1 of 2006 on Non-Governmental Organizations as indi-cated in figure 3.5 4(a). Amongst the interna-tional NGOs, 25 per cent indicated that they were aware of the sessional paper and 75 per cent were not. On the other hand, 32 per cent of national NGOs were aware of the sessional paper, compared with 68 per cent that were not (For more details see figure 3.5.3.4b).
This survey was also aimed at assisting the Board to determine the best way to communi-cate with and disseminate to NGOs informa-tion regarding policy and regulatory matters. NGOs were asked how they learnt about the sessional paper. The survey findings showed that majority of the NGOs learnt about the sessional paper by accessing the information posted on the Board’s website (26 per cent) and through guidance workshops and semi-nars organized by the Board (26 Per cent). Some 24 per cent of the respondents learnt about the sessional paper through newspa-pers, 22 per cent through other Government departments and two per cent through the Hansard.
3.5.2.5 AWARENESS ON CODE OF CONDUCT AND NGOs REGULATIONS OF 1992
NGOs are expected to self regulate without any interference from either the regulator or the government as stipulated under part IV of the Act. NGOs have time and again become victims of abuse from bad leadership, greed, corruption, criminal abuse, external inter-ference, money laundering and all the ills that bedevil the society. On the other hand, they are supposed to be answerable to their members through their constitutions and by adhering to the Code of Conduct and Regula-tions. Previously, the Council was to develop a Code of Conduct for NGOs; however this has changed after the Miscellaneous Amendments Act of 2007. Currently, the Board develops the Code of Conduct with advice from the NGO Council. Thus, this study sought to establish the level of awareness on Code of Conduct and
INTERNATIONAL
Kenyan91%
NonKenyans
9%
AWARE87%
NOT AWARE13%
NATIONAL
Kenyan100%
Non Kenyans0%
INTERNATIONAL
AWARE84%
NOT AWARE16%
21
34
28
52
40
16
Male Female
2004 2005 2006
Male Female Male Female0
10
20
30
40
50
60
AWARE78%
NOT AWARE22%
Figure 3.4.2(ii): percentage of Kenyans and non-kenyans employed by International and National NGOs
Figure 3.4.3b: Work permit renewals
Figure 3.5.1.1a: awareness on functions and existence of the Board
Figure 3.5.1.1b: awareness on functions and existence of the Board by National and International NGOs
Figure 3.5.1.2a: awareness on submission of Annual Returns
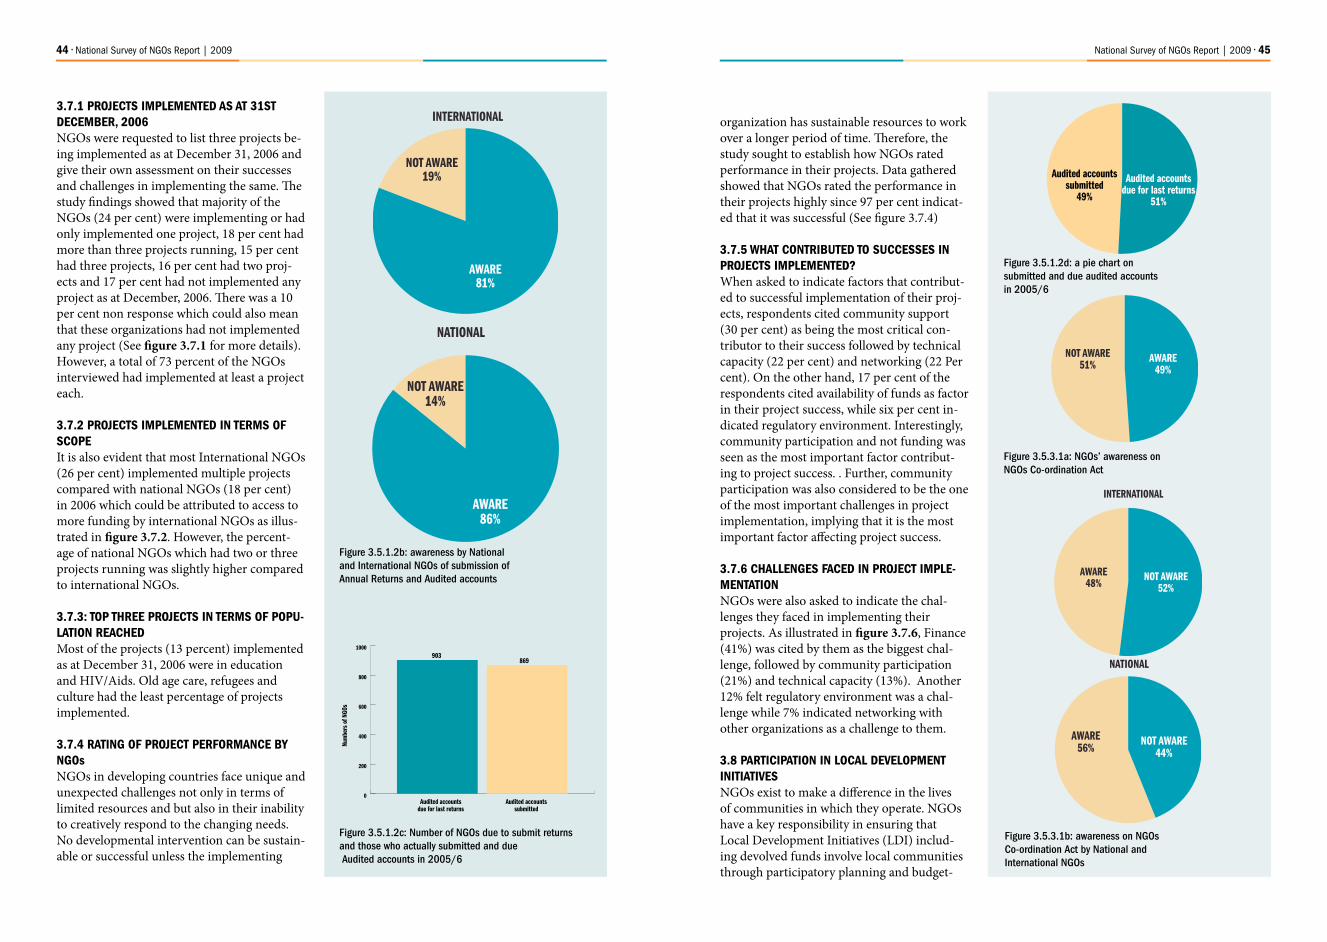
44 • National Survey of NGOs Report | 2009 National Survey of NGOs Report | 2009 • 45
organization has sustainable resources to work over a longer period of time. Therefore, the study sought to establish how NGOs rated performance in their projects. Data gathered showed that NGOs rated the performance in their projects highly since 97 per cent indicat-ed that it was successful (See figure 3.7.4)
3.7.5 WHAT CONTRIBUTED TO SUCCESSES IN PROJECTS IMPLEMENTED?When asked to indicate factors that contribut-ed to successful implementation of their proj-ects, respondents cited community support (30 per cent) as being the most critical con-tributor to their success followed by technical capacity (22 per cent) and networking (22 Per cent). On the other hand, 17 per cent of the respondents cited availability of funds as factor in their project success, while six per cent in-dicated regulatory environment. Interestingly, community participation and not funding was seen as the most important factor contribut-ing to project success. . Further, community participation was also considered to be the one of the most important challenges in project implementation, implying that it is the most important factor affecting project success.
3.7.6 CHALLENGES FACED IN PROJECT IMPLE-MENTATIONNGOs were also asked to indicate the chal-lenges they faced in implementing their projects. As illustrated in figure 3.7.6, Finance (41%) was cited by them as the biggest chal-lenge, followed by community participation (21%) and technical capacity (13%). Another 12% felt regulatory environment was a chal-lenge while 7% indicated networking with other organizations as a challenge to them.
3.8 PARTICIPATION IN LOCAL DEVELOPMENT INITIATIVES NGOs exist to make a difference in the lives of communities in which they operate. NGOs have a key responsibility in ensuring that Local Development Initiatives (LDI) includ-ing devolved funds involve local communities through participatory planning and budget-
3.7.1 PROJECTS IMPLEMENTED AS AT 31ST DECEMBER, 2006NGOs were requested to list three projects be-ing implemented as at December 31, 2006 and give their own assessment on their successes and challenges in implementing the same. The study findings showed that majority of the NGOs (24 per cent) were implementing or had only implemented one project, 18 per cent had more than three projects running, 15 per cent had three projects, 16 per cent had two proj-ects and 17 per cent had not implemented any project as at December, 2006. There was a 10 per cent non response which could also mean that these organizations had not implemented any project (See figure 3.7.1 for more details). However, a total of 73 percent of the NGOs interviewed had implemented at least a project each.
3.7.2 PROJECTS IMPLEMENTED IN TERMS OF SCOPEIt is also evident that most International NGOs (26 per cent) implemented multiple projects compared with national NGOs (18 per cent) in 2006 which could be attributed to access to more funding by international NGOs as illus-trated in figure 3.7.2. However, the percent-age of national NGOs which had two or three projects running was slightly higher compared to international NGOs.
3.7.3: TOP THREE PROJECTS IN TERMS OF POPU-LATION REACHEDMost of the projects (13 percent) implemented as at December 31, 2006 were in education and HIV/Aids. Old age care, refugees and culture had the least percentage of projects implemented.
3.7.4 RATING OF PROJECT PERFORMANCE BY NGOsNGOs in developing countries face unique and unexpected challenges not only in terms of limited resources and but also in their inability to creatively respond to the changing needs. No developmental intervention can be sustain-able or successful unless the implementing
INTERNATIONAL
AWARE81%
NOT AWARE19%
NATIONAL
AWARE86%
NOT AWARE14%
903
Audited accounts due for last returns
Num
bers
of N
GOs
869
Audited accounts submitted
0
200
400
600
800
1000
Figure 3.5.1.2b: awareness by National and International NGOs of submission of Annual Returns and Audited accounts
Figure 3.5.1.2c: Number of NGOs due to submit returns and those who actually submitted and due Audited accounts in 2005/6
Audited accounts due for last returns
51%
Audited accounts submitted
49%
AWARE49%
NOT AWARE51%
NATIONAL
NOT AWARE44%
AWARE56%
INTERNATIONAL
NOT AWARE52%
AWARE48%
Figure 3.5.1.2d: a pie chart on submitted and due audited accounts in 2005/6
Figure 3.5.3.1b: awareness on NGOs Co-ordination Act by National and International NGOs
Figure 3.5.3.1a: NGOs’ awareness on NGOs Co-ordination Act

46 • National Survey of NGOs Report | 2009 National Survey of NGOs Report | 2009 • 47
Figure 3.5.3.3a: adequacy of the Act
Understood65%
Did Not Understand
35%
INTERNATIONAL
Did Not Understand
35%
Understood65%
NATIONAL
Did NotUnderstand
29%
Understood71%
NotAdequate
38%Adequate
62%
Figure 3.5.3.2b: NGOs’ understanding of the role of NGOs Co-ordination Board and NGOs Council
Figure 3.5.3.2a: NGOs’ understanding of the role of NGOs Co-ordination Board and NGOs Council
Self-regulation (Sect 23)24%
Board’s mandate (Sect 7)19%
De�nitions (Sect 2)12%
Code of Conduct (Sect 24)5%
Board’s Power (Sect 8)12%
Cancellation of cert appeals (Sect 19)
5%
Cancellation of certi�cates (Sect 16)
3%
Work permit recommendation (Sect 17)
2%
Penalties for operating without cert (Sect 22)
2%
Rules on provision of the Act (Sect 32)
2%
Boards’s composition (Sect 4)2%
Registration (Sect 10)12%
INTERNATIONAL
Not Adequate37%Adequate
63%
NATIONAL
Not Adequate39%
Adequate61%
Figure 3.5.3.3b: percentage of National and International NGOs that considered the Act adequate
Figure 3.5.3.3c: sections of the NGO Act respondents wanted amended
ing and foster local public decision-making and accountability of Governments to citizens. The survey sought to establish the extent to which NGOs participate in LDIs. Data gathered showed that 69% of the NGOs interviewed participated in the initiatives and 23% did not. However, 8% of the NGOs did not respond to this question and it might be concluded that they did not participate in local development initiatives. .
Further analysis of data gathered showed that 30% of NGOs participated in (District Develop-ment Committees (DDCs), 20% in Constitu-ency Aids Co-ordinating Committees (CACCs); Constituency Development Fund (CDF), 13%; Area Advisory Council (AAC), 10%; Local Au-thority Service Delivery Action Plan (LASDAP), 8%; and District Aids Co-ordinating Committees (DACC), 4% as detailed in the figure below. From the foregoing, it is apparent that there was higher participation in DDCs and CACCs. . In general participation of NGOs in LDIs was low and it is particularly disturbing that only 13% NGOs par-ticipate in the CDF yet, it is the most important mode of devolved funds at community level. This implies that NGOs as an important arm of civil society are not carrying out their oversight role in how public funds are managed at community level.
3.9 COLLABORATORSThis study also sought to determine the catego-ries of organisations NGOs collaborated with in furtherance of their objectives. Survey findings showed that most of the NGOs collaborated with other NGOs (41%), followed by Government agencies (28%), Faith Based Organizations (11%) and Community Based Organizations (10%). Some three per cent of NGOs collaborated with academic and research institutions, multinational corporations (3%) and foreign missions (1%). Figure 3.9 illustrates the foregoing.
3.9.1 NATURE OF COLLABORATIONThe study further sought to determine the nature of collaborations entered into by NGOs. Most of the collaborations involved capacity building (42 percent), information exchange (20 percent) and
INTERNATIONAL
Aware25%
Not Aware75%
NATIONAL
Aware38%
Not Aware62%
Aware27%
Not Aware73%
Other government departments
22%Newspapers
24%
Workshops/Seminars
26%
Hansard2%
Board’s website26%
Figure 3.5.3.4a: NGOs awareness on Sessional Paper No. 1 of 2006
Figure 3.5.3.4: awareness by National and International NGOs’ on Sessional Paper No. 1 of 2006
Figure 3.5.3.4c: How NGOs learnt about the Sessional Paper No. 1 of 2006

48 • National Survey of NGOs Report | 2009 National Survey of NGOs Report | 2009 • 49
funding of partner organizations (16 percent). Limited collaborative relationships were also noted through the provision of equipment and materials (4%), networking (3%) and consul-tancy (1%). (See figure 3.9.1 for more details).
4.0 RATING OF BOARD SERVICES BY NGOsThe Board is committed to providing efficient services in the registration and enablement of NGOs. The study sought to establish the level of satisfaction with Board services. Respon-dents were asked to rate the following services frequently sought by them:
• File Search• Work Permit Recommendation• Tax Exemption Recommendation• Filing Documents for Registration• Bank letter• Change of File Details• Letter of Confirmation of Registration• Filing of ComplaintsThey were given the following options: Excel-lent, Good, Fair or poor. On overall they rated the Board’s services as follows: 28% rated Board’s services as Excellent, 44 percent Good, 17 percernt Fair and 11 percent poor (See Figure 4.0). It is possible to conclude that 72 percent of the NGOs were satisfied with services provided by the Board.
4.0.1 RECOMMENDATION LETTERS FOR OPEN-ING BANK ACCOUNTSNGOs wishing to operate bank account are issued with a letter of authorisation from the NGOs Co-ordination Board upon payment of a fee. The study findings indicated that 32 percent of the NGOs rated the service as excel-lent, 46 percent Good, 14 percent Fair and 8 percent poor as shown in figure 4.0.1.
4.0.2 WHERE NGOs BANKED THEIR MONEY (TOP TEN BANKS) NGOs were requested to list banks and respec-tive branches where they operated bank ac-counts. Data gathered showed that most of the NGOs banked with Kenya Commercial Bank
Figure 3.5.3.5a: NGOs’ awareness of code of conduct and NGOs regulations of 1992
Figure 3.5.3.5b: awareness of Code of Conduct and NGOs regulations of 1992 by National and International NGOs
NATIONAL
Not Aware34%
Aware66%
InternationalNational
18%
26%
17%
13%
19%
18%
26%21%
20%
22%
More than three
Three
Two
One
None
0 5 10 15 20 25 30
CommunitySupport
30%
Availability of funds
19%
TechnicalCapacity
22%
Networking22%
Regulatory environment
7%
Aware60%
Not Aware40%
Held AGM12%
Did Not Hold AGM88%
Educatioin13%
HIV/AIDS13%
Other sectors12%
Health9%
Cildren8%
Agriculture8%
Water & Sanitation7%
Micro-Finance6%
EnvironmentalConservation
5%
Relief 4%
Welfare2%
Human Rights2%
Youth2%
Population& Reproductive Health
1%
Advocacy & Legal Aid1%
Governance1% Information
1%
Housing & Human Settlement
1% Disability1% Sports
1%Energy
1%Peace Building
1%
Old Age Care, Refugees, Culture0%
INTERNATIONAL
Not Aware40%
Aware60%
None17%
One24%
Two16%
Three15%
More than three18%
No response10%
Very well39%
Well45%
Somehow successful
13%
Poorly2%
Have not1%
Figure 3.6: the percentage of NGOs that held Annual General Meeting in 2005/6
Figure 3.7.1: the number of projects implemented by NGOs as at 31st December, 2006
Figure 3.7.2: percentage of National and International NGOs that implemented projects as at 31st December, 2006
Figure 3.7.3: a pie chart top three projects implemented in terms of population reached
Figure 3.7.4: success in project
Figure 3.7.5: factors that contributed to success in projects

50 • National Survey of NGOs Report | 2009 National Survey of NGOs Report | 2009 • 51
DDC30%
CDF13%
LASDAP8%
AAC10%
CACC20%
DACC4%
OTHERS15%
CommunitySupport
21%
Availability of funds
41%
TechnicalCapacity
13%
Networking7%
Regulatory environment
12%
Other factors6%
Did notParticipate
31%
Participated69%
Filing Annual Returns
Excellent Good Fair Poor
Filing of Complaints
Registration
Tax Exemption Recommendation
Work Permit Recommendation
Change of File Details
File Search
Letter of Con�rmation of Registration
Filing Documents for Registration
Bank Letter
0 20 40 60 80 100
37% 37%
32%
56%
33%
48%
43%
44%
54%
46%
46% 14%
18%
15%
16%
18%
23%
19%
16%
18%
13% 13%
20%
9%
24%
7%
9%
6%
8%
7%
8%
30%
19%
24%
22%
30%
34%
23%
29%
32%
GOOD46%
FAIR18%
POOR7%
EXCELLENT29%
NGOs41%
Governmentof Kenya
28%
Agency FBOs11%
FBOs10%
AcademicInstitution
3%
Research3%
Donor Agencies3%
Foreign Missions1%
GOOD46%
FAIR14%
POOR8%
EXCELLENT32%
KCB
Barc
lays
Co-o
pera
tive
Stan
dard
Cha
rter
ed
Equi
ty
Natio
nal B
ank
CBA
CFCS
tanb
ic
K-Re
p
CitiB
ank
28%
21%
16%
12%
8%
4% 4%3%
2% 1%
0
5
10
15
20
25
30
Capacity Building42%
Information Exchange
20%
Funding16%
Others14%
Consultancy3%
Materials & Equipments
4% Networking1%
(28%), followed by Barclays Bank (21%), Co-operative Bank (16%), Standard and Chartered Bank (12%) and Equity Bank (8%) (See figure 4.0.2).
4.0.3 FILING DOCUMENTS FOR REGISTRATIONAll organizations which fit the description of an NGO as defined in Part I of the NGOs Co-ordi-nation Act of 1990 are required to seek registra-tion as provided for in section 9(1) of the NGOs Co-ordination Regulations of 1992. A registration fee is charged for the service. According to data collected, they rated the service as follows: 29%, excellent, 46% Good, 18% Fair and 7% Poor.
4.0.4 FILE SEARCHAll registered NGOs have files which are in the custody of the Board. The files are public docu-ments and under section 31 of NGOs Co-ordina-tion Regulation of 1992, any person may during working hours and upon payment of a fee inspect the NGOs register and any other documents re-lating to any registered NGO. Most of the NGOs were satisfied with the service (78 percent), while 16 percent considered the service as fair and 6 percent as poor.
4.0.5 FILING OF COMPLAINTSMembers of the public, NGO staff or officials can lodge a complaint against any NGO which contravenes the Code of Conduct, the NGOs Co-ordination Act or any other law in Kenya. The Board receives and investigates complains regard-ing the management of NGOs. Issues that are criminal in nature are referred to the relevant arm of Government. Most of the NGOs were satisfied (62 percent) with the service, compared with 38 percent that were not.
4.0.6 LETTER OF CONFIRMATION OF REGISTRATIONOnce an organization is registered as an NGO in accordance with the NGOs Co-ordination Act of 1990, the Board informs the NGO on the same. Among the NGOs that were interviewed, 23 percent indicated that the service was excellent, 54 percent Good, 15 percent Fair and 8 percent Poor.
Figure 3.7.6: challenges faced in project
Figure 3.8(i): NGOs’ participation in local development initiatives
Figure 3.8(ii): a pie chart showing NGOs’ participation in various local development initiatives
Figure 3.9 a pie chart on NGOs’ collaborations with other organizations or agencies
Figure 3.9.1: nature of collaboration
Figure 4.0: rating of Board services
Figure 4.0.1: bank letter
Figure 4.0.2: most preferred banks by NGOs
Figure 4.0.3: filing documents for registration

52 • National Survey of NGOs Report | 2009 National Survey of NGOs Report | 2009 • 53
4.0.7 Tax Exemption RecommendationNGOs seeking exemption from tax may apply through the Board for a letter of recommenda-tion to the Ministry of Finance. Respondents rated the service as follows: Excellent, 24 percent; Good, 33 percent; Fair, 19 percent; and Poor, 24 percent.
4.0.8 Work permit RecommendationAs indicated earlier, all NGOs wishing to engage foreign or international staff are required to apply for letters of recommendation to the Immigra-tion Department for the purpose of obtaining a work permit. The study findings indicated that 70 percent of NGOs were satisfied with the service while 23 percent indicated that it was fair and 7 percent rated it as poor.
4.0.9 What could be done to improve services at the Board? This survey also sought suggestions from NGOs on how to improve the Board’s service delivery. Some 37 percent of the respondents who gave their opinion suggested that the Board should improve communication with them, and 24 per-cent recommended decentralization of services to other regions. On the other hand, 15 percent wanted the time taken to serve them reduced; 13% suggested improvement in staff responsive-ness; while 8 percent suggested a reduction in registration period. 3% of the respondents felt the fees for services offered at the Board should be reduced.
EXCELLENT
23%
GOOD54%
FAIR15%
POOR8%
GOOD44%
FAIR16%
POOR6%
EXCELLENT34%
EXCELLENT30%
GOOD32%
FAIR18%
POOR20%
Impr
ove
com
mun
icat
ion
Dece
ntra
lize
serv
ices
Redu
ce ti
me
take
n to
be
serv
ed
Impr
ove
staf
f res
pons
e
Redu
ce re
gist
ratio
n pe
riod
Redu
ce s
ervic
e ch
arge
37%
24%
15%13%
8%
3%
0
5
10
15
20
25
30
35
40
EXCELLENT24%
GOOD33%
FAIR19%
POOR24%
GOOD48%
FAIR23%
POOR7%
EXCELLENT22%
Figure 4.0.4: file search
Figure 4.0.5: Filing of complaints
Figure 4.0.6: letter of confirmation of registration
Figure 4.0.7: tax exemption recommendation
Figure 4.0.8: work permit recommendation
Figure 4.0.9: respondents’ recommendations on how to improve service delivery

54 • National Survey of NGOs Report | 2009 National Survey of NGOs Report | 2009 • 55
Lack of transparency and accountability: Lack of transparency and accountability among NGO of-ficials and cases of embezzlements of project funds were also cited. For instance, it was observed that some organizations employed relatives regardless of minimum qualification required in certain jobs thereby compromising professionalism in the management of NGOs. While some NGO officials used projects funds for personal gains at the expense of the beneficiaries.
Awareness of Sector’s regulatory framework and NGOs’ activities: Data collected revealed that most provincial administrators and DDOs were not aware of the Board’s mandate and its role in regulating NGO activities. On the other hand, they had little knowledge of NGOs operating in their districts hence lack of awareness of the role NGOs play in the country’s development.
Lack of structures to monitor and evaluate NGO activities at the district level: It was also observed that there were no structures at the district level to monitor and evaluate NGO activities at the grass-roots. Generally, they felt that the Board needs to strengthen monitoring and evaluation of NGOs so as to make them more accountable on how they use donor funds.
Duplication of activities by NGOs: They noted that most of the NGOs were engaged in similar activi-ties, hence the need to advise them on deserving and underserved sectors and regions. They also indi-cated that some NGOs changed their programmatic activities based on perceived availability of funding despite insufficient technical capacity to implement such projects.
A SUMMARY OF DISCUSSIONS WITH THE KEY INFORMANTS
Key informant interviews were conducted with the provincial administration and DDOs to explore their perception of the sector and establish the following:
• Familiarity with NGO operations in their respective districts• Records of NGOs in the district• The performance of NGOs in the district• The factors that influence the performance of NGOs in the district• The NGOs involvement in local development initiatives• What could be done to improve the collaboration between NGOs and the Government
The issues that emerged from the interviews are summarised as follows:
NGOs’ sustainability: Data gathered from the key informants showed that some NGOs mainly de-pended on the founder members or the chief executives for sustainability and their survival relied on individuals and not institutional systems, thereby affecting their performance.
Networking/collaborations: The importance of collaboration by NGOs with Government departments and other organizations in improving livelihoods in the community was noted. Community involve-ment in NGO activities was also identified as being critical in influencing their performance. How-ever, lack of collaboration between some NGOs, Government and other stakeholders in planning and implementation of various projects was cited by the provincial administration and the DDOs. They also indicated that some NGOs only approached them when faced with problems.
Chapter Four4
56 • National Survey of NGOs Report | 2009 National Survey of NGOs Report | 2009 • 57
quoted problem of the “founder syndrome” that has been noted as a major hindrance to the growth of NGOs. It would appear then, that the transparency and accountability challenges evident in the sector can to a large extent be attributed to the failure to embrace internal democracy and the core principles that relate to good governance. .
5.2 Recommendations
5.2.1 Board’s mandate It is evident that some organisations did not provide the correct information during the study. The survey for instance pointed to an inordinate large number of “volunteer” staff which is not consistent with the total amounts spent on personnel costs. The foregoing raises two fundamental issues; firstly, that these organisations have difficulties in opening themselves up for scrutiny despite the fact that the Act and the code of conduct requires them to be accountable to their multiple stakeholders, including the Government. Secondly, it exposed the fact that the Board lacks adequate powers to compel NGOs to open themselves up for public scrutiny. It is proposed that the Board be given authority to compel NGOs to provide information where appropriate, on their activities. This would make the Board effec-tive in its role of ensuring NGOs provide a public benefit and pursue only the objectives for which they have been registered.
5.2.2 Proportionate and Risk based approachThe study exposed the disparate nature of the sector in terms of type of activities, access to resources such as staff, finances and basic infrastructure. This diversity implies that the uniform approach used by the Board in its regulation of the sector needs to be reviewed since it places an unbearable regulatory burden on the smaller organisations while in some instances demanding relatively little of the more endowed larger organisations. It is imperative that the Board adopts a proportionate approach in its regulation to ensure that it provides an enabling legal and regulatory environment for all NGOs. The heterogeneous nature of the sector also means that different organisations depending on size and nature of their activities pose different levels of risk. This will require that the Board develops a risk analysis framework that recognises the foregoing factors to ensure effective and efficient regulation
5.2.3 Legal and Regulatory Framework (Review of the Act).The study has demonstrated that NGOs are making an immense contribution to Kenya’s GDP. A total of KES 68 Billion was spent in various projects across the country. Clearly, this is a sector that needs to be effectively regulated and enabled to thrive. The Act does not provide for adequate regulatory and legal provisions for the enablement and regulation of the sector. It is, therefore, imperative that adequate investment be made in ensuring an appropriate legislative and regulatory environment. This requires that sufficient resources and capacity be provided to enable the review of the NGOs Coordination Act of 1990.
5.2.4 NGO sustainability and relations with the Government The dependency on external funding by NGOs as evidenced by the survey is worrying and seems to imply that the sector is largely unsustainable. This is further confirmed by the fact that only 12% of the organisations had capital assets such as land and buildings. None of the organisations interviewed in-dicated they drew an income from endowments. It is important that partnerships be engaged in by the government, the corporate sector, donors and civil society to come up with innovative ways of promot-ing local giving to charity. Local organisations could also be assisted to set up endowments. More posi-tively, the survey noted that KES 118 Million of funding for NGOs was from government agencies. This is provides a firm basis for improved partnerships and engagements between government and NGOs.
5.0 CONCLUSIONS AND RECOMMENDATIONS
5.1 ConclusionsThe overarching aim of this study was to validate existing data on organisations registered under the Act. The study established that 82% of organisations registered with the NGOs Board were either inactive or had ceased to exist. Additionally, 3% of NGOs that were interviewed did not have offices as required by the law. There is also a possibility that some organisations could have provided false infor-mation about their physical address or changed the same without informing the Board, thereby making it difficult to track them. It is recommended that the Board gives all the organisations that could not be traced notice to prove that they exist as provide for under section 18 of the Act.
On the other hand, some NGOs did not wish to be interviewed while others declined to provide some information (mostly financial). In some instances, some NGOs made it especially difficult for the in-terviewers giving them appointments which they did not keep. It was particularly disturbing that these happened despite the Board having publicised the survey in advance, and followed up by contacting each organisation to book an appointment in advance. It is notable that a number of the organisations that were uncooperative were international NGOs. In addition, it would appear that even during the study, a number of NGOs did not provide accurate information on the actual number of paid staff they had.
Further, the survey established that 88% of NGOs had not conducted elections as required by their con-stitution in the one year preceding the study. This implies widespread disregard for the basic precepts of good governance. The failure to hold elections further, denied these organisations the necessary infu-sion of new ideas brought about by regular renewal of its leadership. It also goes to confirm the often
Chapter Five5

58 • National Survey of NGOs Report | 2009 National Survey of NGOs Report | 2009 • 59
5.2.5 Compliance and decentralisation of Board’s services It is apparent from the survey, that a sizeable number of NGO practitioners are either ignorant of their legal obligations or choose not to comply. From the survey, 22% of respondents said they were not aware of the requirement to submit annual returns. It is proposed that the Board be supported to enhance its guidance to NGOs through the development of relevant materials and outreach services. Further, it is important that the Board be capacitated to decentralise its services to ensure increased engagements with NGOs. This is intended to improve compliance. This will require increased resources for the Board.
APPENDICESI) CITED LAWS AFFECTING NGOs IN KENYA
1. NGO Co-ordination Act, 1990,_Kenya2. NGOs Regulations, 1992, _ Kenya3. Children’s Act of, 2001,_Kenya4. Children’s Regulations, 2006,_ Kenya5. Microfinance Act, 2006_ Kenya
II) KEY INFORMANT INTERVIEW GUIDE1. Are you familiar with the NGOs’ operations in their respective districts?2. Do you have records of NGOs in the district?3. How would rate the performance of NGOs in the district?4. What are some of the factors that influence the performance of NGOs in the district?5. Are NGOs involved in local development initiatives6. What can be done to improve the collaboration between NGOs and the Government
III) QUESTIONNAIRE
THE SURVEY TEAM: ROLES AND RESPONSIBILITIES
National Coordinator/Former Executive Director1. Provided overall oversight monitoring and evaluation of the survey process2. Ensured adequate resources for the conduct of the exercise3. Liaised with the government and other institutions and stakeholders nationally to facilitate the suc-
cess of the exercise4. Advised the government on the progress of the exercise5. Received progress reports from the Technical Coordinator and provided feedback and advice Technical Coordinator1. Coordinated, designed, monitored and managed the survey process including data management
and report writing2. Liaised with the Provincial Administration and relevant institutions to ensure the success of the
study3. Coordinated induction for the Supervisors and Enumerators4. Ensured that appropriate data collection tools and equipment were available for the conduct of the
survey5. Led the development of an implementation plan for the survey exercise, monitored its implementa-
tion and ensured adherence to specified time frames 6. Ensured adequate logistical support for the implementation of the survey7. Provided a framework for ensuring proper data management8. Supervised and provided technical support to the Regional Coordinators and the survey exercise at
large
Data Management Supervisor/ICT Officer1. Coordinated and monitored pre and post survey data entry2. Monitored data quality 3. Supervised data entry clerks4. Provided technical support to the Data Entry Clerks and the overall survey exercise5. Ensured adequate questionnaires for the field exercise

60 • National Survey of NGOs Report | 2009 National Survey of NGOs Report | 2009 • 61
Regional Coordinators1. Organized, coordinated and monitored the collection of data at regional level2. Developed an implementation plan and report on a regular basis on its implementation 3. Supervised the Supervisors at district level4. Ensured that data collected were of the required quality5. Organised and conducted awareness workshops at regional level for NGOs 6. Made necessary logistical arrangements for the successful conduct of the survey at regional and
district level7. Liaised with the Provincial Administration and other relevant institutions to ensure the success of
the study8. Liaised with the TC and the Logistician to secure maps for all the districts and provided the same to
the Supervisors9. Provided regular feedback including reports to the TECHNICAL COORDINATOR on the survey10. Ensured availability of resources at district level to carry out the survey
Supervisors1. Organized, coordinated and monitored the collection of data at district level2. Ensured that data collected were of the relevant quality by checking on a daily basis all question-
naires brought in by the enumerators3. Provided technical support to the enumerators4. Made necessary logistical arrangements for the successful conduct of the survey at district level
including availability of questionnaires and transport5. Liaised with the Provincial Administration and other relevant institutions to ensure the success of
the study6. Provided regular feedback including reports to the Regional Coordinator on the survey7. Secured data collected
Enumerators• CarriedoutdutiesasassignedbytheSupervisors.• Followedtheestablishedworkschedule.• VerifiedwhetherornotmaterialsdeliveredtotheSupervisorwerecompleteandensuredtheirap-
propriate maintenance.• RevisitedNGOsifresponsiblepersonswerenotfoundorbecausetheinterviewcouldnotbecarried
out.• Madeverificationsandrepeatedinterviewsasrequired.
Finance Coordinator And Logistician• Coordinatedlogisticalsupporttotheexercise• Ensuredtherewasanimplementationplanfordeliveringlogisticalandadministrativesupporttothe
survey and monitored its implementation• Deployedstafftoprovidelogisticalandadministrativesupport(ensuredSecretarialandRegistry
staff were available to provide support to the field exercise)• Ensuredavailabilityoffinances,materialsandtransportforthefieldexercise• Supervisedtheestablishmentofacallcentretoreceiveandrespondtoenquiriesfromthefield• Exercisedoversightonthebudget• Establishedallrequirementsforgoodsandservicesforthesurveyexercisesandmadeatimelypro-
curement of the same• Madearrangementsforthedeliveryofgoodstotheofficeorfieldasappropriate• Madearrangementstoexerciseadequatecontrolandsafetyoforganizationalpropertyandassets
used in the exercise
Communications Coordinators• Developedanoverallcommunicationsstrategyforthevalidationexercise• Plannedactivitiestopublicisethevalidationexercise• Documentedprocessesandeventsinthevalidationexerciseusedforpublicityexercisesforthe
Board• Developedmediapackagesanddisseminatedthesametoappropriatemediahouses• ProvidedoverallguidancetoenhancetheBoard’spublicimagethroughthevalidationexercise• Supervisedandprovidedtechnicalsupporttothecallcentre• Inductedstaffinvolvedinthecallincentre• DevelopedcommunicationpackageforcontactingNGOs
Secretarial Coordinator• Setupacallcentertorespondtofieldenquiriesandprovidedinformation• CalledNGOsinliaisonwiththeDataManagementCoordinatortoestablishtheirphysicaladdress
and other details and provided this information to the TC for transmission to the field survey team• Coordinatedtheactivitiesofateamofstafftoreceiveandrespondtocalls• CoordinatedwiththeTC,DataManagementCoordinator,Registryandotherpersonneltogetinfor-
mation and relayed it appropriately
Registry Clerk• Ensuredavailabilityoffilesfordataentry• Organizedtheregistrytoprovideinformationrequiredinthefieldinatimelymanner
1 Ben Dolla2 Josephine Moraa Begi3 Ahmed Athumani Mwinyi4 Josephat Mainga5 Willis T. Nalwenge6 Romanus Mwaniki Maosa7 Zainab Ali8 Kihiu Ricky Rugani9 Kylen Muiruiki10 Jackline Munyoki11 Ibrahim Matich Nyamboga12 Frank Nyaoma13 Osinyu Leonard T.Ole Sawoyo14 James Okello Wagalla15 Elizaphan O. Nuguti16 George Otieno Kauma
17 Fanice Nyasuguta Ombega18 Rogers Mong’are Ombachi19 Zilpah Kwamboka20 Daniel Kamande 21 Enosh Bolo22 Lewis Nyaribo23 Bonifice Mutua24 Anunda Mandere25 Ascar Sagini26 Rebecca Ombete27 Frida Nalienya28 Eunice Adhiambo Aloo29 Betty Otunga30 Yusuf Abdi Nunow31 Irine Kamau
LIST OF SUPERVISORS

62 • National Survey of NGOs Report | 2009 National Survey of NGOs Report | 2009 • 63

64 • National Survey of NGOs Report | 2009 National Survey of NGOs Report | 2009 • 65

66 • National Survey of NGOs Report | 2009 National Survey of NGOs Report | 2009 • 67

68 • National Survey of NGOs Report | 2009 National Survey of NGOs Report | 2009 • 69
