2. ijmmse - on the mechanical properties and fracture.pdf
TRANSCRIPT

www.tjprc.org [email protected]
ON THE MECHANICAL PROPERTIES AND FRACTURE
CHARATERISTICS OF AL-2%CU BASED CAST ALLOYS
E.M. ELGALLAD 1, S.A. ALKAHTANI 2, H.W. DOTY3& F.H. SAMUEL 4 1,4Université du Québec à Chicoutimi, Québec, Canada
2Industrial Engineering Program, Department of Mechanical Engineering, College of
Engineering, Prince Sattam bin AbdulAziz University, Al Kharj, Riyadh, KSA 3General Motors, Department of Materials Engineering, Washington, USA
ABSTRACT
Based on the quality index charts and impact properties inferred from the present data, the results show that,
because of the low Si content in the present Al-2%Cu alloy series, the effects of Sr on the mechanical properties with
respect to the modification of silicon eutectic do not come into play. The role of Sr in refining the morphology of the α-
Fe Chinese script phase, however, contributes to a slight improvement in the ductility and toughness. The addition of Zr
produces a significant improvement in the mechanical properties in the as-cast and heat-treated conditions as a result of
its grain-refining action. An excess amount of Fe increases the precipitation of α-Fe Chinese script particles thereby
reducing the impact properties. The addition of Sn lessens the strength properties but raises the ductility and toughness
in the as-cast condition as a result of the softening effect of the soft Sn-bearing phases. The presence of Bi as
undissolved brittle particles mechanically reduces the tensile and impact properties in the as-cast condition. These
particles, in conjunction with the Bi-Mg interaction which consumes the amount of free Mg available to form the Mg-
hardening phases, are responsible for the reduction caused in the mechanical properties in the heat-treated conditions.
KEYWORDS: Quality Index Tensile Properties, Impact Properties, Fractography, Additives
Received:Nov 05, 2015; Accepted:Dec 19, 2015; Published:Jan 05, 2016; Paper Id.:IJMMSEFEB20162
INTRODUCTION
Aluminum-copper alloys represent a significant category of aluminum alloys based on their distinctive
age-hardening response which is attributed to the precipitation of the effective hardening θ-Al 2Cu phase in such
alloys. Poor casting properties, however, restrict the application of high strength binary Al-Cu casting alloys.
These alloys are therefore usually inoculated with Si in order to increase their fluidity and to curtail their tendency
to hot tearing. Magnesium may also be added to Al-Cu casting alloys to stimulate the aging process and to form
the S-Al 2CuMg hardening phase as well as β-Mg2Si and/or Q-Al 5Mg8Si6Cu2 hardening phases in the presence of
Si [1,2].
Addition of alloying elements is one of the major techniques used to improve the quality of aluminum
casting alloys in the form of better structure and mechanical properties. Traces of Sr are added to Al casting alloys
containing Si to modify the morphology of Si particles from coarse flakes to a finer spherical morphology [3,4]. In
addition, recent studies show that the absorption of Sr by iron intermetallics can refine their morphology
considerably [5,6]. Titanium and boron are added either individually or in combination to refine the grain structure
of α-Al by providing large numbers of nuclei in the melt; this in turn induces the formation of small equiaxed
Research A
rticle International Journal of Metallurgical & Materials Science and Engineering (IJMMSE) ISSN(P): 2278-2516; ISSN(E): 2278-2524 Vol. 6, Issue 1, Feb 2016, 15-34 © TJPRC Pvt. Ltd
16 E.M. Elgallad, S.A. Alkahtani, H.W. Doty & F.H. Samuel
Impact Factor (JCC): 3.3529 Index Copernicus Value (ICV): 3.0
grains of α-Al which otherwise solidifies with a coarse, columnar grain structure [7,8]. Zirconium is used as a grain refiner
and can also be used to form the fine coherent Al3Zr dispersoids. These coherent particles are observably stable at high
aging temperatures and they resist coarsening due to the low solubility and diffusivity of Zr in the Al matrix [9,10]. Silver
is added to Al-Cu-Mg alloys to enhance their age-hardening response. It has been reported that Ag and Mg atoms attract
each other forming atom clusters which serve as nucleation sites for the Ω phase [11]. This phase is a variant of the
equilibrium θ-Al 2Cu phase and substantially improves high-temperature strength values because of its considerable thermal
stability [12,13].
All elements which are not classified as alloying additives are termed impurities. The percentage of such
impurities must be controlled carefully to avoid their negative effects on the castability and mechanical properties of
aluminum alloys. Iron is the most common impurity to be found in aluminum alloys appearing in the form of intermetallic
second phases in combination with aluminum as well as other elements. The most deleterious Fe-rich intermetallic phase is
the brittle platelet-like β-Al 5FeSi [14,15]. It has been reported that the presence of Mn promotes the development of a more
compact, less harmful α-Al 15(Fe,Mn)3Si2 phase at the expense of the β-Al 5FeSi phase [16,17].
The applicability of the quality index concept proposed by Drouzy et al.[18] for Al-7%Si-Mg alloys was
examined by Din et al.[19] with regard to the Al-Cu alloys, specifically A201 and A206 alloys.It was concluded from this
study that the quality factor does not apply to A201 and A206 in an analogous manner. Cáceres et al.[20] demonstrated that
when the A201 alloy is aged, a plot of the tensile strength versus the elongation to fracture follows a circular pattern; this is
in contrast with Al-Si-Mg alloys, which show a linear relationship between these two parameters when aged.
This study was undertaken to examine the effects of certain additives on the mechanical properties and fracture
behaviour of a new Al-2%Cu-1.3%Si-0.4%Mg casting alloy intended for automotive applications; this is known as the 220
alloy. This alloy may be proposed as a potentially promising companion to the notable alloys of both the Al-Cu and Al-Cu-
Si-Mg systems.Based on the additives used, the alloys prepared from the Al-Cu base alloyare divided into three groups:
Group I: Will examine the effects of melt treatment (in terms of chemical modification and grain refining)
through the addition of Sr, Ti, Sr + Ti, and Ti + Zr.
Group II: Will examine the effects of iron intermetallics and hardening alloying elements by adding Fe, Fe + Mn,
and Ag.
Group III: Will examine the effects of free-cutting elements through the addition of Sn, Bi, and Sn + Bi.
Experimental Procedures
The actual chemical composition of the alloys used in this study is listed in Tables 1.The base alloy A was
supplied in the form of 12.5-Kg ingots The melting temperature was maintainedat 750 ± 5ºC. The melt was grain-refined
and modified using Al-5%Ti-1%B and Al-10%Sr master alloys, respectively. Iron, manganese, silver, zirconium, and
bismuth were added in the form of Al-25%Fe, Al-25%Mn, Al-50%Ag, Al-15%Zr, and Al-50%Bi master alloys,
respectively, whereas Sn was introduced as a pure metal. The melt was poured at ~ 735ºC into an ASTM B-108 permanent
mold to obtain castings for tensile test bars, and a starlike mild-steel mold to obtain castings for impact test bars. Both
molds were preheated to 450ºC prior to casting. Samples were solution heat-treated at 495˚C for 8 h, quenched in warm
water at 65˚C, and then artificially aged. The artificial aging was carried out at 180˚C and 220˚C for T6 and T7 tempers,
respectively, for aging times of 2, 4, 6, 8, 12, 16, 20, 24, and 48 h.

On the Mechanical Properties and Fracture Charateristics of Al-2%Cu Based Cast Alloys 17
www.tjprc.org [email protected]
The tensile test bars were pulled to fracture at room temperature at a strain rate of 4 x 10⁻⁴ s-1, using a
Servohydraulic Mechanical Testing machine. A strain gauge extensometer (with a 50.8 mm range) was used to measure
percentage elongation as the load was applied. The data were analyzed using the Test Works 4 software designed for tensile
testing.
A computer-aided instrumented Universal Impact Testing Machine was used to carry out the impact test. The
Dynatup Impulse Data Acquisition and Analysis System had earlier been connected to the impact machine to determine the
total absorbed energy during the test, the crack initiation and propagation energies, total time, and maximum load required
to break the specimens. Furthermore, the load-time and energy-time curves were also obtained at the same time. The
average values of the energies obtained from the five bars tested for each alloy condition were taken as the representative
values for that particular condition.Fracture surfaces of selected tensile and impact tested were examined using an FE-SEM
equiped with EDX facilites to identfy the fracture details as well as the precipitated phases.
RESULTS AND DISCUSSIONS
Precipitation-Hardening Characteristics
The precipitation-hardening characteristics of Al-Cu alloys containing Si and Mg often appear to be quite
complex. This particularity may be attributed to the formation of several hardening phases including θ-Al 2Cu, β-Mg2Si, S-
Al 2CuMg and the quaternary phase which is designated Q-Al 5Mg8Si6Cu2 or λ-Al 5Mg8Si5Cu2 [21,22].The formation of
these phases depends to a large extent on the Cu/Mg and Mg/Si ratios as well as the total solute content of the alloy [23].
The precipitation-hardening characteristics of the alloys prepared in this study can be understood by investigating
the tensile properties and hardness values of alloying group I as an example of this type of alloys. Figures 1 and 2 show the
variation of the tensile properties and hardness of alloying group I with the aging time at 180˚C and 220˚C, respectively. It
will be observed that all the alloys display almost the same hardening trend with the progress of aging time for both 180˚C
and 220˚C tempers, regardless of the additives introduced. Age-hardening at 180˚C results in alloy-hardening with aging
for times ranging from 2 to 16 hours, whereas age-hardening at 220˚C causes overaging and alloy-softening after 2 hours
of aging. In the 180˚C temper, the alloys attain the highest hardness peak after 2 hours of aging with age-hardening ability,
∆BHN, of 30 BHN calculated using the following equation
∆BHN = BHNmax – BHNSHT (1)
whereBHNmax is the peak hardness and BHNSHT is the hardness value in the solution-treated condition. It may
therefore be suggested that aging at180˚Cfor times ranging from 2 to 8 hours,can be applied to these new 220 based-alloys
in order to obtain a satisfactory compromise between the strength and ductility.
The presence of a number of hardening phases in the Al-Cu-Si-Mg alloy system, including θ-Al 2Cu, β-Mg2Si, and
Q-Al 5Mg8Si6Cu2, which need not all yield to coarsening simultaneously, may explain why the strength properties and
hardness values of the 220 based-alloys remain at high levels without any significant decline for up to 16 hours of aging at
180ºC. Kang et al.[24] observed that both the plate-like θ'-Al 2Cu and the needle-like λ'-Al 5Mg8Si5Cu2 precipitates were
contained in the peak-aged specimens of Al-7.15%Si-2.8%Cu-0.43%Mg alloy. Moreover, the precipitation ofthe λ' phase
was found to improve the age-hardening ability, since this phase precipitates homogeneously in α-Al contrary to the θ'
phase which precipitates preferentially on the dislocations around eutectic Si particles. Wang et al.[25] demonstrated that,
with regard to the Al-8%Si-1%Cu-0.4%Mg alloy age-hardening was caused by the precipitation of the dot-shaped Q''phase
18 E.M. Elgallad, S.A. Alkahtani, H.W. Doty & F.H. Samuel
Impact Factor (JCC): 3.3529 Index Copernicus Value (ICV): 3.0
which is the precursor of the Q phase. For the Al-8%Si-3%Cu-0.4%Mg alloy, age-hardening resulted from the co-
precipitation of the dot-shaped Q'' phase and rod shaped θ' phase.
Field emission scanning electron micrography was carried out on A4 alloy samples cut from tensile test bars
corresponding to different aging conditions with the aim of investigating the evolution in size, shape, and density of the
strengthening precipitates throughout the course of the aging process as shown in Figure 3. Aging at 180°C for 2 hours
resulted in densely distributed fine precipitates approximately 25 to 100 nm in diameter. Increasing the aging time to 48
hours at 180°C did not significantly alter the size or the density of the precipitates.). As will be observed, in this aging
condition, the diameter of the precipitates ranges from 45 to 130 nm. Aging at 220°C for 2 hours seems to have the same
effect as aging at 180°C for 48 hours with regard to the characteristics of the precipitates; the precipitates are
approximately 40 to 100 nm in diameter.Prolonged aging at 220°C for 48 hours coarsens the precipitates thereby increasing
their diameter to a range of between 60 and 160 nm.
Impact Toughness
Toughness is a measure of the amount of energy a material can absorb before fracturing. It thus becomes
important from an engineering point of view that the ability of a material to withstand an impact load without fracturing be
considered. The border applications of Al casting alloys may be impeded by their low fracture toughness which originates
in the microstructure of these alloys, and is influenced by α-Al dendrite arm spacing and grain size. Any improvement
occurring in impact toughness will necessarily be dictated by type, shape, size, and distribution of second-phase particles
present in the alloy microstructure [26,27]This section will discuss the effects of additives which were introduced for the
purposes of the current study regarding the relevant aspects of impact properties.
The effects of additives on the impact energies of the Alloying Groups I are illustrated in Figures 4a and 4b
respectively, for both 180˚C and 220˚C tempers. Both the values for the crack initiation energy, Ei, and for the total
absorbed energy, Et, were plotted simultaneously on the same graph in order to facilitate deducing their difference, namely
the crack propagation energy Ep. The most common feature observed for all the alloy conditions studied is that the impact
energies vary over the aging time according to a similar trend displayed by the %El. Moreover, these impact energies are
not significantly affected by aging time in the 180˚C tempered condition. On the contrary, the softening effect associated
with the 220˚C tempered condition causes a proportional increase in the impact energy values in line with the progress of
aging time.
With regard to the melt treatment group, it will be observed that the grain refining action resulting from the
combined addition of TiB2 and Zr to the A4 alloy (Figures 5a and 5b) produces the highest values for impact energies in
this alloying group. The improvement observed in the impact toughness of the Sr-containing A1 and A3 alloys is attributed
to the positive role of Sr in refining the morphology of α-Fe phase particles as previously explained for the effects of Sr
addition on the %El. Richard [28] indicated that impact energy values of the Al-Si alloys are more sensitive to the
variations in the microstructure than the tensile properties. Calculating the difference between the total absorbed energy, Et,
and the crack initiation energy, Ei, for the alloys involved in the melt treatment group reveals that the crack propagation
energy, Ep, is not significantly affected by the additives introduced.
Results obtained from the evaluation of the fracture toughness of the Alloying Group II shows that increasing the
Fe content, either individually or in combination with Mn, producing A31 and A32 alloys, respectively, leads to a drastic

On the Mechanical Properties and Fracture Charateristics of Al-2%Cu Based Cast Alloys 19
www.tjprc.org [email protected]
reduction in the impact energies of these alloys. The crack initiation energy of the A31 was reduced over the aging times of
the 180˚C and 220˚C tempered conditions by average values of 29% and 33%, respectively, compared to the reference A3
alloy. For the A32 alloy, the average reduction ratios were calculated to be ~36% for both tempered conditions.
The decreased ductility of the A31 and A32 alloys could be attributed to the presence of a high fraction of Fe
intermetallic phasesas shown in Figures 6a and 6b, respectively.This was also manifested through the reduction caused in
the crack propagation energy of these alloys. The crack propagation energy of the A31 alloy was reduced by average ratios
of 17% and 20% corresponding to the 180˚C and 220˚C tempered conditions, respectively, compared to the A3 alloy,
whereas for the A32 alloy, the average reduction ratios were found to equal ~24% in both tempered conditions. The effects
of iron on the mechanical properties of Al-Si casting alloys were investigated by Komastuet al. [29]. Their results show
that iron has a detrimental effect on the impact strength of such alloys because of the formation of Al-Si-Fe compounds.
The Ag-containing A33 alloy displays a slight reduction in impact energies compared to the reference A3 alloy. This
reduction is consistent with the increase in the strength properties and hardness values of the A33 alloy produced by the
hardening effect of Ag.
It will be seen with regard to the Alloying Group III that the addition of Sn, producing A41 alloy, does not bring
about any substantial change in impact energies. This observation is interpreted in terms of the fact that the increase in
impact toughness resulting from the softening effect of Sn may compensate for the reduction caused by the increase in the
percentage porosity arising from the melting of the β-Sn phase particles during solution heat treatment as shown in Figure
7. The impact toughness of both Bi-containing A42 and A43 alloys was observed to have become remarkably deteriorated.
The free Bi particles which are brittle in nature act as internal stress risers in the alloy microstructure and provide an easy
path to fracture. The total absorbed energy of the A42 and A43 alloys was reduced by average values of 23% and 18%,
respectively, for both 180˚C and 220˚C tempered conditions.
Quality Index Charts
Quality index charts are used to correlate the tensile properties of the 220 based-alloys, which were reported in
our previous study [30], aiming at understanding the effects of additives on the alloy quality. The plot of the tensile
strength versus the elongation to fracture prepared for the alloys introduced in the present study did not show the linearity
observed for Al-Si-Mg type alloys. This observation implies that the quality index (Q) proposed by Drouzyet al.[18] is not
applicable to the 220 based-alloys under investigation. On the other hand, the universal applicability of the following
equationswhich were used to draw the “iso-YS” lines and “iso-q” lines, respectively, of the quality map introduced by
Cáceres [31-33] makes it possible to use this map to assess the quality of the 220 based-alloys.
P = Kε ne-εt ≈ Ks ne-s (2)
P = Ks s / qe-s (3)
In these equations,P is the engineering stress, ε is the true plastic strain, n is the strain-hardening exponent, K is
the strength coefficient,εt is the total true strain, and q is the relative ductility parameter. Equation (2) can be used to draw
the family of solid flow curves for different n-values called “iso-YS” lines. Equation (3) can be used to generate the lines
representing contours of constant relative ductility called “iso-q” lines each identified by a q-value.The alloy quality will
be expressed by the relative ductility parameter, q, based on the correlation between the “iso-q” lines of Cáceres’ map and
the “iso-Q” lines of Drouzy’s map [34, thesis].The quality maps of the alloys prepared for this study which were

20 E.M. Elgallad, S.A. Alkahtani, H.W. Doty & F.H. Samuel
Impact Factor (JCC): 3.3529 Index Copernicus Value (ICV): 3.0
constructed on the basis of Cáceres’ model, are shown in Figures 8 to 13. As will be observed, each alloying group has two
maps corresponding to both 180˚C and 220˚C tempered conditions.
The quality maps of the melt treatment group are shown in Figures 8 and 9 for the 180˚C and 220˚C tempers,
respectively. It will be observed that the A4 alloy containing the combination of TiB2 and Zr displays the best alloy quality
of the alloys in the melt treatment group (Table 2). This alloy possesses a q-value ranging from 0.60 to 0.27 in the 180˚C
tempered condition and from 0.65 to 0.29 in the 220˚C tempered condition. The Sr-modified A1 alloy and the grain-refined
A2 alloy display comparable alloy quality, particularly in the 220˚C tempered case. This observation indicates that the
increase in the %El caused by Sr addition, namely A1 alloy, may balance out the increase in the UTS caused by the
addition of TiB2, namely A2 alloy, with regard to the alloy quality so that both alloys end up having the same combination
of strength and ductility. The base A alloy and the modified grain-refined A3 alloy also display comparable alloy quality. In
spite of the fact that A alloy has higher UTS values compared to the A3 alloy, the slight improvement caused in the %El of
the latter alloy raises its quality to approximately the same level as that of the A alloy. This observation may suggest the
fact that the alloy quality is more susceptible to the changes occurring in the %El than those which occur in the UTS.
The quality maps of the iron intermetallics and hardening alloying elements group (Table 2) are shown in Figures
10 and 11 for the 180˚C and 220˚C tempers, respectively. It will be observed that the A31 and A32 alloys with higher Fe
and Fe + Mn content, respectively, display the least desirable alloy quality of all the alloys studied. The A31 alloy has a q-
value ranging from 0.31 to 0.15 in the 180˚C tempered condition and from 0.29 to 0.16 in the 220˚C tempered condition,
whereas for the A32 alloy this value ranges from 0.30 to 0.18 and from 0.29 to 0.16 in the two respective conditions. The
deterioration observed in the q-value of each of these alloys can undoubtedly be attributed to the negative effects of iron
with respect to the tensile properties, particularly ductility. Addition of Ag, producing A33 alloy, did not bring about any
considerable change in alloy quality. This finding may be interpreted in terms of the fact that the increase in the UTS
caused by the addition of Ag was dampened by the associated reduction in the %EL and thus the alloy quality was
ultimately not affected by this addition.
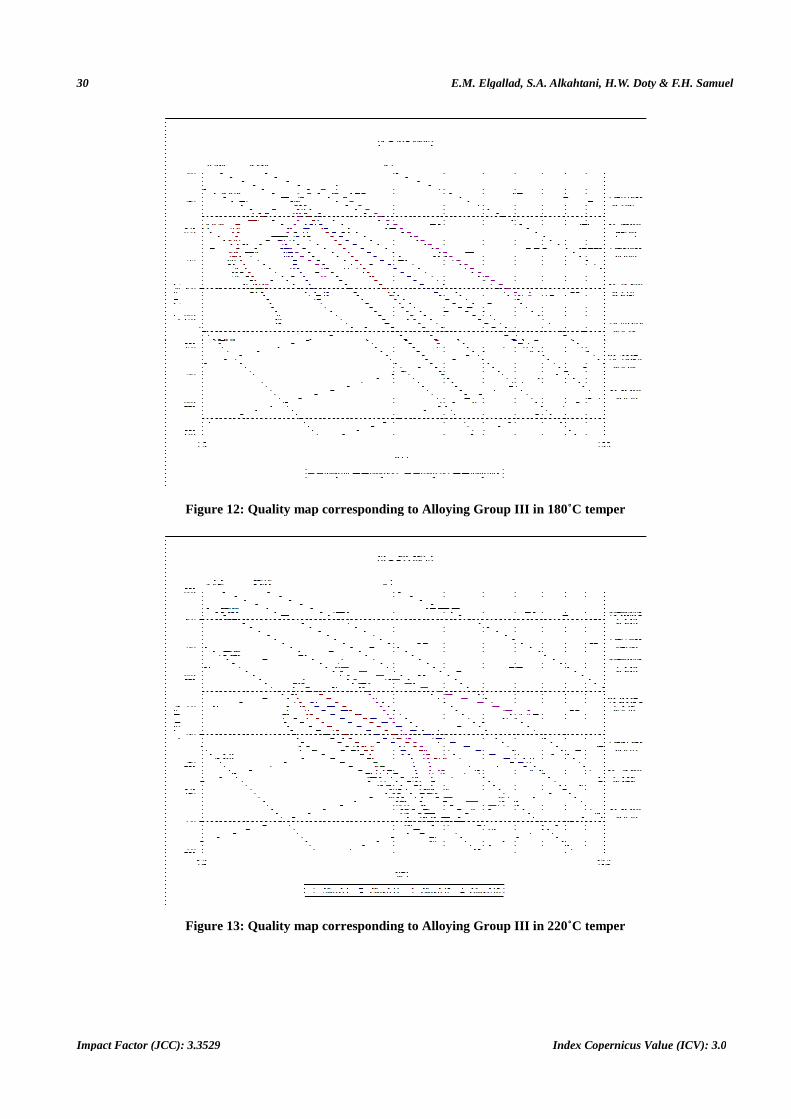
The quality maps for the free-cutting elements group (Table 2) are illustrated in Figures 12 and 13 for the 180˚C
and 220˚C tempers, respectively. It will be observed that each of the A41 and A42 alloys displays an alloy quality which is
lower than that of the reference A4 alloy; this can be ascribed to the reduction in the tensile properties of these alloys
resulting from the addition of Sn and Bi, respectively. The A41 alloy in which the %El was not significantly affected by Sn
addition, however, has a q-value which is higher than that of the Bi-containing A42 alloy. The aggregated deterioration to
be observed in the tensile properties of the A43 alloy caused by the combined addition of Sn and Bi makes this alloy one of
the least desirable of the alloys studied in terms of alloy quality. This alloy possesses a q-value ranging from 0.24 to 0.18
and from 0.23 to 0.19 in the 180˚C and 220˚C tempered conditions, respectively.
It is interesting to note, with regard to the quality maps discussed above, that the curves representing the UTS-
%El relation have the tendency to follow a reversible path, and thus the alloys may regain their as-cast properties after
prolonged aging times. This tendency results from the transition from the high q-value in the underaged and peak aged
conditions to the lower q-value associated with the overaged conditions. Din et al.[19] and Cácereset al.[20]concluded for
both A201 and A206 alloys that the plot of the tensile strength versus the elongation to fracture comes full circle after long
aging times so that the property combination displayed by the original as-cast alloys was reproduced.

On the Mechanical Properties and Fracture Charateristics of Al-2%Cu Based Cast Alloys 21
www.tjprc.org [email protected]
Fractography
Fractography is generally used for upgrading material specifications, improving product design, and analyzing
potential for failure with the intention of improving product liability [35]. The fractographs presented in this section are
back-scattered electron images which were deemed suitable for highlighting the various features observed on the fracture
surfaces of both the tensile-tested and impact-tested alloy samples. This part will focuse on the fracture behavior of both
the base A alloy and the Bi-containing A42 alloy in tensile testing. The fractographic investigation will be conducted on
tensile-tested samples of the above alloys. For each alloy composition,three tensile-tested samples were used
corresponding to: (i) the as-cast condition; (ii) aging at180˚C for 4 hours; and (iii) aging at220˚C for 4 hours.
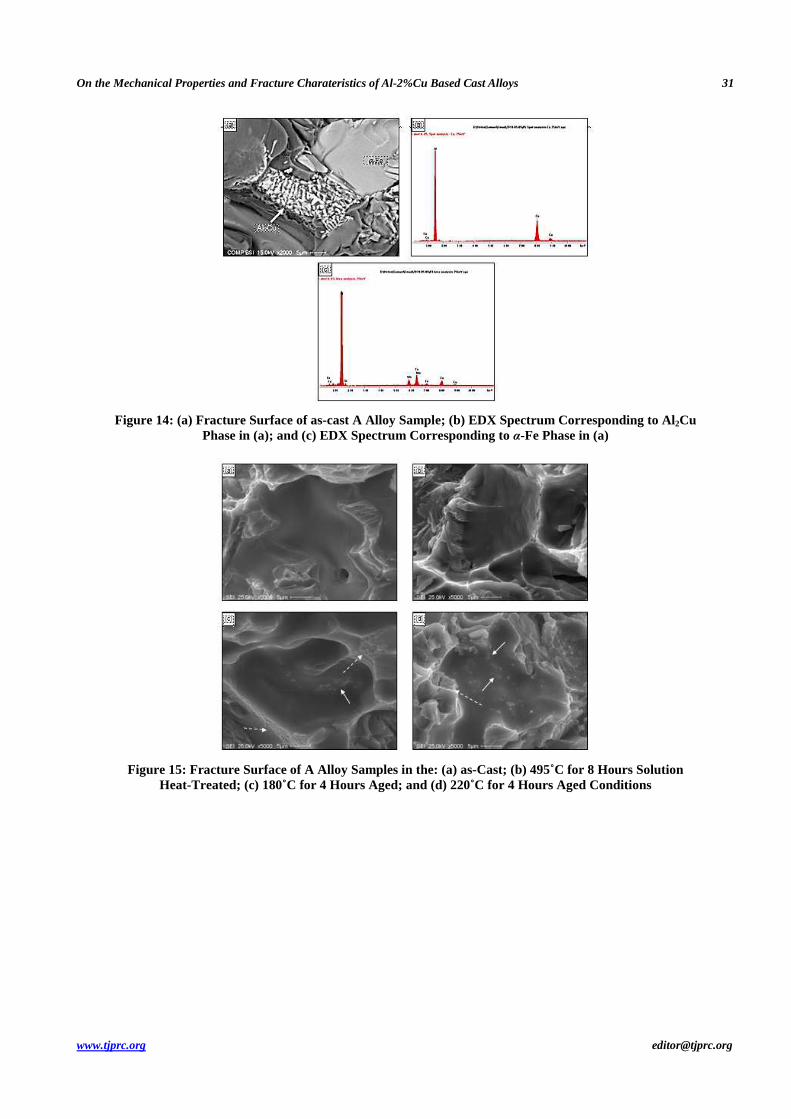
Figure 14a shows the fracture surface of the as-cast base A alloy sample. This figure reveals the presence of two
main intermetallic phases, namely θ-Al 2Cu and α-Al 15(Fe,Mn)3Si2. This was confirmed by the corresponding EDX
spectrums shown in Figures 14b and 14c, respectively. Solution heat-treatment of this alloy resulted in the dissolution of
the Al2Cu phase whereas the α-Fe phase was unaffected. Figure 15 presents high magnification micrographs showing the
fracture surface of the base A alloy samples corresponding to different conditions. In the as-cast and solution heat-treated
conditions represented by the micrographs shown in Figures 15a and 15b, respectively, neither ultra-fine particles nor
associated dimples may be observed.The ultra-fine particles (mostly Al2Cu) which precipitated after aging the alloy for 4
hours at 180°C and 220°C may be observed in the micrographs depicted in Figures 15c and 15d, respectively, as indicated
by the solid arrows. It should be noted here that the precipitation of these particles is associated with the formation of a
network of dimples of less than a micron in diameter marked with the dashed arrows.
The micrograph obtained from the fracture surface of the as-cast A42 alloy sample shown in Figure 16a reveals
the presence of bright AlMgBi phase particles together with the Al2Cu phase particles marked by solid and dashed arrows,
respectively. The latter phase appears less luminous than the former because of the difference in their atomic numbers, 83
and 29, respectively. Solution heat-treatment of alloy A42 at 495°C for 8 hours resulted in the dissolution of the Al2Cu
phase while both the AlMgBi and α-Fe intermetallics were not affected, as shown in Figure 16b. The higher magnification
backscattered image depicted in Figure 16c shows the Chinese-script morphology of the α-Fe phase circled in Figure 16b.
Figures 17a and 17b are high magnification fractographs of two A42 alloy samples corresponding to 180°C and
220°C aging conditions, respectively. In these figures, the solid arrows refer to the presence of large AlMgBi particles
inside the dimples, whereas the dashed arrows refer to the presence of networks of ultra-fine dimples. Figure 17c is a
higher magnification micrograph for the area marked A in Figure 17b clearly showing the fineness of the dimples which
are normally associated with the precipitation of fine particles similar to those shown previously.
This part will discuss the fracture behavior of A1, A4, A32, and A41 alloys in impact testing. The fractographic
investigation will be conducted on the impact-tested samples corresponding to these alloy compositions. For each alloy,
one impact-tested sample originally aged at 180˚C for 4 hours was used.For each alloy sample, several backscattered
images were taken from the edge and the centre of its fracture surface in order to discern crack initiation and crack
propagation characteristics. In addition, interesting features appearing on the fracture surface will also be noted.The
fracture surface of the Sr-modified A1 alloy sample is shown in Figure 18. The area of fine dimples marked A in Figure
18a seems to be dominating the fractured surface. The arrow in Figure 18b refers to the fracture of the α-Fe intermetallic
phase. The crack was observed to propagate through the formation of secondary cracks marked by the arrows in Figure
18c.

22 E.M. Elgallad, S.A. Alkahtani, H.W. Doty & F.H. Samuel
Impact Factor (JCC): 3.3529 Index Copernicus Value (ICV): 3.0
Figure 19a shows the crack initiation in the A4 alloy sample. The area marked A in this figure reveals the presence
of fine bright particles. These are Al3Zr particles as identified by EDX analysis, which confirms the precipitation of Al3Zr
phase in the A4 alloy. Figure 19c is a higher magnification micrograph of the area marked by the arrow in Figure 19a
displaying a deep secondary crack surrounded by fragments of the fractured α-Fe phase. The crack propagated through
such fragments and associated dimples.
Increasing both Fe and Mn in the A32 alloy resulted in an increase in the volume fraction of the α-Fe phase.
Figure 20(a) shows the crack initiation in the sample of this alloy with the formation of several secondary cracks, as
indicated by the arrows. The higher magnification micrograph depicted in Figure 20(b) is a good example showing the
fracture of the α-Fe phase in A32 alloy. The crack continued to propagate through the fracturing of the intermetallics, as
well as the formation of secondary cracks marked by the arrows in Figures 20(c).
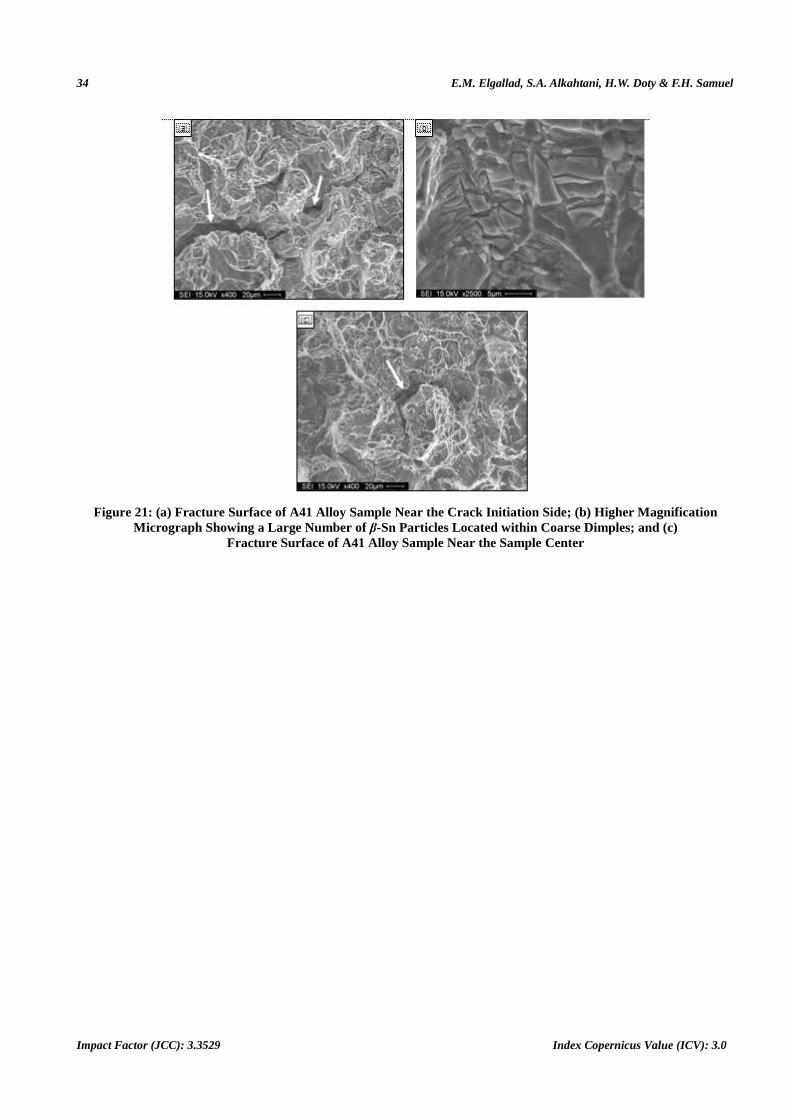
The fracture of the A41 alloy sample initiated with formation of several deep secondary cracks marked by arrows
in Figure 21(a). The higher magnification fractograph shown in Figure 21(b) reveals the presence of a large number of β-
Sn particles inside the coarse dimples, as confirmed by EDX analysis. The crack was observed to propagate in the usual
manner, as mentioned above, through the formation of several secondary cracks. One of these cracks is indicated by the
arrow in Figure 21(c).
CONCLUSIONS
Based on the mechanical properties and Q-charts obtained in the present work, the following conclusions may be
drawn in
• The addition of Zr increases the strength properties as a result of its grain-refining action together with the
dispersive strengthening caused by the precipitation of Al3Zr phase particles. However, both the ductility and
impact toughness remain at a high level.
• Increasing the Fe content, individually or in combination with Mn,also increases the precipitation of α-Fe Chinese
script particles which, in turn, reduces the tensile and impact properties.
• The addition of silver does not produce any considerable increase in the strength properties or in the hardness
values for the heat-treated conditions. Such results may be ascribed to the presence of Si which suppresses the
vital role of silver in the precipitation-hardening of Al-Cu-Mg-(Ag) alloys.
• The deterioration observed in the impact properties of the Sn-containing alloys in the heat-treated conditions may
be attributed mainly to the formation of porosity associated with the melting of Sn during solution heat treatment.
• The Bi-Mg interaction, which consumes the amount of Mg required to form the Mg-hardening phases, is
responsible for the reduction caused in the alloy strength.
• With regard to the fracture mechanism of the impact-tested samples, crack initiation occurs through the
fragmentation of the α-Al 15(Fe,Mn)3Si2 phase and the formation of several secondary cracks. The crack
propagates through the formation of a mixture of fine and coarse dimples, as well as through the fracturing of
such insoluble intermetallics as α-Fe, Al3Zr, and AlMgBi.
• The fracture surface of the tensile-tested Bi-containing alloy sample reveals the presence of large AlMgBi

On the Mechanical Properties and Fracture Charateristics of Al-2%Cu Based Cast Alloys 23
www.tjprc.org [email protected]
particles inside the coarse dimples as well as particles of θ-Al 2Cu and α-Al 15(Fe,Mn)3Si2 phases. Solution heat-
treatment results in the dissolution of the Al2Cu phase, whereas neither the AlMgBi nor the α-Fe intermetallics
were affected.
ACKNOWLEDGEMENTS
The authors would like to thank Ms Amal Samuel for enhancing the art work used in the present study.
REFERENCES
1. Reif W., Yu S., Dutkiewicz J., Ciach R., Krol J., Pre-Ageing of AlSiCuMg Alloys in Relation to Structure and Mechanical
Properties, Materials and Design, 1997, 18, 253-256.
2. Mishra R.K., Smith G.W., Baxter W.J., Sachdev A.K., Franetovic, V., The Sequence of Precipitation in 339 Aluminum Castings,
Journal ofMaterials Science, 2001, 36, 461-468.
3. Lu S.Z., Hellawell A., The Mechanism of Silicon Modification in Aluminum Silicon Alloys: Impurity Induced Twinning,
Metallurgical Transactions, 1987, 18,1721-1733.
4. Dahle A.K., Nogita K., McDonald S., Dinnis C., Lu L., Eutectic modification and microstructure development in Al-Si Alloys,
Materials Science and Engineering A, 2005, 413,243-248.
5. Samuel A.M., Samuel F.H., Doty H.W., Observations on the Formation of ß-AIsFeSi Phase in 319 Type Al-Si Alloys, Journal of
Materials Science, 1996, 31, 5529-5539.
6. Shabestari S.G., Gruzleski J.E., Modification of Iron Containing Precipitates in AlSi 12 Alloys with Strontium, Giesserei-
Praxis (Germany), 1997, 17, 385-394.
7. Cibula A., The Grain Refinement of Al Alloy Castings by Addition of Ti and B, Journal of the Institute of Metals, 1951-52, 90,
1-16.
8. McCartney D.G., Grain Refining of Aluminum and its Alloys Using Inoculants, International Materials Reviews, 1989, 34,
247-260.
9. Nes E., Precipitation of the Metastable Cubic AlsZr-Phase in Subperitectic Al-Zr Alloys, ActaMetallurgìa, 1972, 20, 499-506.
10. Sepehrband P., Mahmudi R., Khomamizadeh F., Effect of Zr Addition on the Ageing Behavior of A3 19 Aluminum Cast Alloy,
ScriptaMaterialia, 2005,52, 253-257.
11. Garg A., Chang Y.C., Howe J.M., Precipitation of the Omega Phase in an Al-4.0Cu-0.5Mg Alloy,
ScriptaMetallugicaetMaterialia, 1990, 24, 677-680.
12. Polmear I.J., The Effects of Small Additions of Silver on the Ageing of Some Aluminium Alloys, Transactions of Metals Society,
1964, 230, 1331-1339.
13. Vietz J.T., Polmear, I.J., The Influence of Small Additions of Silver on the Ageing of Aluminum Alloys: Observations on Al-Cu-
Mg Alloys, Journal of the Institute of Metals, 1966, 94, 410-416.
14. Crepeau P.N., Effect of Iron in Al-Si Casting Alloys: A Critical Review," AFS Transactions, 1995, 103, 361-366.
15. Couture, A., Iron in Aluminum Casting Alloys, AFS International Cast Metals Journal, 1984, 6, 9-17.
16. Bonsack W., Discussion on the Effect of Minor Alloying Elements on Aluminum Casting Alloys, ASTM Bulletin, 1942, 45-51.
17. Lakshmanan A.N., Shabestari S.G., Gruzleski J.E., Microstructure Control of Iron Intermetallics in Al-Si Casting Alloys,
ZeitschriftfürMetallkunde, 1995, 86, 457-464.
24 E.M. Elgallad, S.A. Alkahtani, H.W. Doty & F.H. Samuel
Impact Factor (JCC): 3.3529 Index Copernicus Value (ICV): 3.0
18. Drouzy, M., Jacob S., Richard M., Interpretation of Tensile Results by Means of Quality Index and Probable Yield Strength,
International Cast Metals Journal, 1980, 5, 43-50.
19. Din T., Rashid A.K.M.B., Campbell J., High Strength Aerospace Casting Alloys: Quality Factor Assessment, Materials Science
and Technology, 1996, 12, 269-273.
20. Cáceres C.H., Din T., Effect of Ageing on the Quality Index of an Al-Cu Alloy, Materials Science and Technology, 1999, 15,
711-716.
21. Suzuki H., Arai L., Kanno M., Itoi K., Effect of Silicon Addition on the Aging Behavior of an Al-2%Cu-0.9%Mg Alloy, Journal
of the Japan Institute of Metals, 1977, 27, 239-245.
22. Yao J-Y., Edwards G.A., Graham D.A., Precipitation and Age-Hardening in Al-Si-Cu-Mg-Fe Casting Alloys, Materials Science
Forum, 1996, 217, 777-782.
23. Li Y.J., Brusethaug S., Olsen A., Influence of Cu on the Mechanical Properties and Precipitation Behavior of AlSi7Mg0.5 Alloy
During Aging Treatment, ScriptaMaterialia, 2006, 54, 99-103.
24. Kang H.G., Kida M., Miyahara H., Ogi K., Hoyt Memorial Lecture: Age-Hardening Characteristics of Al-Si-Cu-Base Cast
Alloys, AFS Transactions, 1999, 107, 507-515.
25. Wang G., Sun Q., Feng L., Hui L., Jing C, Influence of Cu Content on Ageing Behavior of AlSiMgCu Cast Alloys, Materials
and Design, 2007, 28, 1001-1005.
26. Brechet Y., Embury J.D., Tao S., Luo L., Damage initiation in metal matrix composites, ActaMetallurgica et Materialia, 1991,
39, 1781-1786.
27. Sonsino C.M., Ziese J., Fatigue Strength and Application of Cast Aluminum Alloys with Different Degrees of Porosity,
International Journal of Fatigue, 1993, 15, 75-84.
28. Richard M., Impact Strength of Aluminum Alloy Casting, Fonderie, 1980, 35, 397-400.
29. Komastu N., Nakamura M., Yamamoto Y., Metallurgical Structure and Impact Strength of Al-Si Alloys, Technical Report of
Toyota R&D Center, TR-Il, 1975, 1-46.
30. Elgallad E.M., Samuel F.H., Samuel A.M., Doty H.W., Effects of Additives on the Microstructures and Tensile Properties of a
New Al-Cu Based Alloy Intended for Automotive Castings, AFS Transactions, 2010, 118,39-56.
31. Cáceres C.H., A Rationale for the Quality Index of Al-Si-Mg Casting Alloys, Internationaljournal of Cast Metals Research,
2000, 12, 385-391.
32. Cáceres C.H., A Phenomenological Approach to the Quality Index of Al-Si-Mg Casting Alloys, International Journal of Cast
Metals Research, 2000, 12, 367-375.
33. Cáceres C.H., Material Properties and Quality Index in Al-Si-Mg Alloys, AFS Transactions, 1998, 106, 601-604.
34. Elgallad E.M., Effect of Additives on the Mechanical Properties and Machinability of a New Aluminum-Copper Base Alloy,
Ph.D. Thesis, Université du Québec à Chicoutimi, Canada, 2010.
35. Gerberich W.W., Metals Handbook, 9th Edition, vol. 8, ASM, Metals Park, OH, 1985.

On the Mechanical Properties and Fracture Charateristics of Al-2%Cu Based Cast Alloys 25
www.tjprc.org [email protected]
APPENDIXES
Table 1: Actual Chemical Compositions for the Alloys of the Mechanical Test Samples
Alloy Code Chemical Composition (% wt)
Cu Si Mg Fe Mn Sr Ti Zr Ag Sn Bi Al A 2.09 1.32 0.42 0.58 0.59 0.000 0.07 0.00 0.00 0.00 0.00 bal. A1 2.13 1.28 0.42 0.58 0.60 0.013 0.08 0.00 0.00 0.00 0.00 bal. A2 2.18 1.23 0.40 0.61 0.61 0.000 0.15 0.00 0.00 0.00 0.00 bal. A3 2.11 1.23 0.40 0.52 0.60 0.011 0.16 0.00 0.00 0.00 0.00 bal. A4 2.24 1.28 0.41 0.61 0.58 0.000 0.15 0.20 0.00 0.00 0.00 bal. A31 2.17 1.22 0.40 0.84 0.59 0.014 0.16 0.00 0.00 0.00 0.00 bal. A32 2.09 1.17 0.39 0.82 0.79 0.010 0.18 0.00 0.00 0.00 0.00 bal. A33 2.09 1.21 0.39 0.57 0.60 0.010 0.16 0.00 0.50 0.00 0.00 bal. A41 2.31 1.33 0.43 0.63 0.59 0.000 0.16 0.20 0.00 0.22 0.00 bal. A42 2.31 1.26 0.45 0.52 0.61 0.000 0.18 0.20 0.00 0.00 0.51 bal. A43 2.24 1.24 0.47 0.45 0.61 0.000 0.17 0.20 0.00 0.24 0.55 bal.
Table 2: Nominal Composition and Codes of the Alloys Prepared for the Present Study
Melt Treatment Group(I) Iron Intermetallic Group(II) Free-Cutting Elements Group(III) Alloy Code
Composition Alloy Code
Composition Alloy Code
Composition
A Base alloy A3 A + Sr + 0.15%Ti A4 A + 0.15%Ti + 0.20%Zr A1 A + Sr A31 A3 + 0.20%Fe A41 A4 + 0.15%Sn
A2 A + 0.15%Ti A32 A3 + 0.20%Fe + 0.2%Mn A42 A4 + 0.50%Bi
A3 A + Sr + 0.15%Ti A33 A3 + 0.50%Ag A43 A4 + 0.15%Sn + 0.5%Bi
A4 A + 0.15%Ti + 0.20%Zr
Note:Sr level = 100-150 ppm
Figure 1: Variation in Tensile Properties and Hardness values of Alloying Group I after Aging at 180˚C: (a) YS; (b) UTS; (c) %El; and (d) Hardness Values

26 E.M. Elgallad, S.A. Alkahtani, H.W. Doty & F.H. Samuel
Impact Factor (JCC): 3.3529 Index Copernicus Value (ICV): 3.0
Figure 2: Variation in Tensile Properties and Hardness Values of Alloying Group I after Aging at 220˚C: (a) YS; (b) UTS; (c) %El; and (d) Hardness Values
Figure 3: Field Emission Scanning Electron Micrographs Obtained from A4 Alloy Samples: (a) Aged at 180˚C for 2
Hours; (b) Aged at 180˚C for 48 Hours; (c) Aged at 220˚C for 2 Hours; (d) Aged at 220˚C for 48 Hours

On the Mechanical Properties and Fracture Charateristics of Al-2%Cu Based Cast Alloys 27
www.tjprc.org [email protected]
Figure 4: Variation in impact energies of Alloying Group I after aging at: (a) 180˚C; (b) 220˚C
Figure 5 (a): Micrographs Obtained from :a) the Non-Grain Refined Base Alloy A, and (b) the Grain Refined A4 Alloy with Ti and Zr
Figure 6: Micrographs Obtained from: (a) A31 (A3 Alloy + 0.2%Fe), and (b) A32
(A3 Alloy + 0.2%Fe+ 0.2%Mn) in the as-Cast Condition
Figure 7: β-Sn particle Undergone Incipient Melting in A43 Alloy after Solution Treatment

28 E.M. Elgallad, S.A. Alkahtani, H.W. Doty & F.H. Samuel
Impact Factor (JCC): 3.3529 Index Copernicus Value (ICV): 3.0
Figure 8: Quality Map Corresponding to Alloying Group I in 180˚C Temper
Figure 9: Quality Map Corresponding to Alloying Group I in 220˚C Temper

On the Mechanical Properties and Fracture Charateristics of Al-2%Cu Based Cast Alloys 29
www.tjprc.org [email protected]
Figure 10: Quality Map Corresponding to Alloying Group II in 180˚C Temper
Figure 11: Quality map corresponding to Alloying Group II in 220˚C Temper
30
Impact Factor (JCC): 3.3529
Figure 12: Quality map corresponding to All
Figure 13: Quality map
E.M. Elgallad, S.A. Alkahtani, H.W. Doty & F.H. Samuel
Impact Factor (JCC): 3.3529 Index Copernicus Value (ICV): 3.0
Quality map corresponding to Alloying Group III in 180˚C temper
Quality map corresponding to Alloying Group III in 220˚C temper
E.M. Elgallad, S.A. Alkahtani, H.W. Doty & F.H. Samuel
Index Copernicus Value (ICV): 3.0
˚C temper
˚C temper
On the Mechanical Properties and Fracture Charateristics of Al-2%Cu Based Cast Alloys 31
www.tjprc.org [email protected]
Figure 14: (a) Fracture Surface of as-cast A Alloy Sample; (b) EDX Spectrum Corresponding to Al2Cu Phase in (a); and (c) EDX Spectrum Corresponding to α-Fe Phase in (a)
Figure 15: Fracture Surface of A Alloy Samples in the: (a) as-Cast; (b) 495˚C for 8 Hours Solution Heat-Treated; (c) 180˚C for 4 Hours Aged; and (d) 220˚C for 4 Hours Aged Conditions

32 E.M. Elgallad, S.A. Alkahtani, H.W. Doty & F.H. Samuel
Impact Factor (JCC): 3.3529 Index Copernicus Value (ICV): 3.0
Figure 16: Fracture Surface of A42 Alloy in the; (a) as-Cast, (b) Solution-Treated Conditions, and (c) High Magnification Image of α-Fe Phase Observed in 16b
Figure 17: (a) Fracture Surface of A42 Alloy Sample aged at 180˚C for 4 Hours; (b) Fracture Surface of A42 Alloy
Sample Aged at 220˚C for 4 hours; and (c) Higher Magnification Micrograph of Area A Shown in (b)

On the Mechanical Properties and Fracture Charateristics of Al-2%Cu Based Cast Alloys 33
www.tjprc.org [email protected]
Figure 18: (a) Fracture Surface of A1 Alloy Sample Near the Crack Initiation side; (b) Fracture of α-Fe Phase; and (c) Fracture Surface of A1 Alloy Sample Near the Sample Center
Figure 19: (a) Fracture Surface of A4 Alloy Sample Near the Crack Initiation Side; and (b) Higher Magnification Micrograph of the Crack Arrowed in (a)
Figure 20: (a) Fracture Surface of A32 Alloy Sample Nearthe Crack Initiation Side; (b) Higher Magnification Micrograph Showing the Fractured α-Fe Phase; and (c) Fracture Surface of
A32 Alloy Sample Nearthe Sample Center
34 E.M. Elgallad, S.A. Alkahtani, H.W. Doty & F.H. Samuel
Impact Factor (JCC): 3.3529 Index Copernicus Value (ICV): 3.0
Figure 21: (a) Fracture Surface of A41 Alloy Sample Near the Crack Initiation Side; (b) Higher Magnification Micrograph Showing a Large Number of β-Sn Particles Located within Coarse Dimples; and (c)
Fracture Surface of A41 Alloy Sample Near the Sample Center