2-designing a school map for expanding public primary ... · pdf fileobafemi awolowo...
TRANSCRIPT
US-China Education Review B, July 2017, Vol. 7, No. 7, 329-344 doi: 10.17265/2161-6248/2017.07.002
Designing a School Map for Expanding Public Primary Schools
in Osun State, Nigeria (2018-2022)
Adelokun Adedapo Solomon, Adewole Israel Boluwatise
Obafemi Awolowo University, Ile-Ife, Nigeria
This study identified the location of existing public primary schools in Osun State, Nigeria, investigated the school
age population of the study area, and projected the expected school age population between 2018 and 2022 by using
the existing data. The study also estimated the number of classrooms that would be required and designed a school
map between 2018 and 2022 for the study area. These were with a view to designing a school map for Osun State
public primary schools by the year 2022. The study adopted descriptive survey design with a focus on a population
of 1,205 public elementary schools, 1,205 head teachers across the three senatorial districts of Osun State, Nigeria,
a sample of 30 public primary schools using simple random sampling technique, while 30 head teachers using total
enumeration sampling technique. The results showed the location of the existing schools on the geographical maps
of the local government areas (LGAs) for the study as supplied by National Population Commission (NPC) through
Osun State Planning Commission Oshogbo. The projected school age populations in 2022 were 35,690, 32,530,
24,900, 23,710, 37,320, and 31,550 respectively for Ife Central, Ife North, Ede North, Ede South, Irepodun, and
Orolu LGAs. Projected enrolments in 2022 will require 566, 495, 524, 525, 476, and 395 classrooms in these areas.
Osun State would require 230, 276, 287, 337, 255, and 170 classrooms in these areas in 2022. The study
recommended, among others, that Osun State government should be prepared to host quite a number of pupils in
the educational enterprise by 2022, and ensure the supply of sufficient facilities to match the projected enrolments
for 2022 to avoid deficiencies and wastage.
Keywords: school mapping, coordinates, school age population
Introduction
Education is a veritable tool which develops an individual and society functionally and economically. This
can only be so, however, if it is properly planned and executed in order to avoid wastage of limited human and
material resources. As a right of every child, achieving inclusive education requires deliberate efforts at
planning and execution of such plans. The United Nations Educational Scientific and Cultural Organisation
(UNESCO, 2007) had reiterated this position. This has caused most governments have abiding faith in the
efficacy of education as an instrument for reconstruction and economic development (Niles & Harries-Bowlbey,
2003).
In a bid to provide education, governments are saddled with the responsibility of establishing educational
institutions necessitating school buildings to accommodate and serve the demand for education per region in a
Adelokun Adedapo Solomon, Ph.D., Department of Educational Management, Obafemi Awolowo University. Adewole Israel Boluwatise, M.Ed., Department of Educational Management, Obafemi Awolowo University.
DAVID PUBLISHING
D
DESIGNING A SCHOOL MAP FOR EXPANDING PUBLIC PRIMARY SCHOOLS
330
given state or region. But the alarming situation at present is that several linear expansions in the educational
enterprise have been made in some areas by the government of Osun State (one of the 36 states in Nigeria),
without a proper consideration of those that would be served by the expansions. Viewing education from the
democratic nature of the social demand approach used by the state, one might say that those expansions were
for political success and not necessarily meeting educational needs of the citizenry. In fact, for the education
sector of Osun State, Nigeria has attracted a lot of attention in form of criticisms and controversies because of
various innovations introduced in recent years since 2011. Such innovations which are in the areas of sitting of
schools, structural designs of schools, and erection of school buildings (blocks of classrooms) appears to have
been introduced without a conscious effort to effectively plan using appropriate data.
Literature Review
The National Policy on Education (NPE) (Federal Republic of Nigeria [FRN], 2013) stated that primary
education refers to education given to children aged 6-11+ in primary schools. It also stipulated that the primary
level is the key to the success or failure of the whole system since the rest of the education system is built upon
it. Education at this level strengthens the learner’s feet to climb the educational ladder to the zenith of academic
attainment if a good foundation is laid. This statement confirms the fact that the primary level of education is
most crucial to the success of other levels, hence, the need for the stakeholders to do everything possible to lay
a solid foundation for its sustainability.
Primary education, as defined in the NPE (FRN, 2013), had the following objectives which cannot be
achieved except it is planned and mapped. They are to:
1. Inculcate permanent literacy and numeracy, and ability to communicate effectively;
2. Lay a sound basis for scientific and reflective thinking;
3. Give citizenship education as a basis for effective participation in and contribution to life of the society;
4. Mould the character and develop sound attitude and morals in the child;
5. Develop in the child the ability to adapt to the child’s changing environment;
6. Giving the child the opportunities for developing manipulative skills that will enable a child function
effectively in the society within the limits of the child’s capacity;
7. Provide the child with basic tools for further educational advancement, including preparation for trades
and the craft of the locality. However, this makes the issue of effective schools to be of concern to the
government, teachers, parents, and even the pupils themselves.
There is no doubt that the achievement of the aforementioned objectives hinges majorly on the availability
of adequate resources which must not only be available, but also be usable and free of wastage or
encumbrances if the other sectors of education are not to be starved of adequate funding.
In order to avoid the wastage which could be in form of over-invoicing on materials, incidence of idle
facilities, and early depreciation of facilities (caused by use of substandard materials in the building process),
proper planning, through an articulate understanding of the variables associated with planning of physical
facilities in the school system. One of these is school-mapping.
Map could mean a design, an outline, or a sketch of a phenomenon, while mapping is the process of
designing, sketching, or strategising. School-mapping has been misunderstood by many educationists and
statisticians. The misconception made them to see school-mapping as a matter of taking a conventional
landscape map alone and to locate different educational institutions in their different regions or locale. On the
DESIGNING A SCHOOL MAP FOR EXPANDING PUBLIC PRIMARY SCHOOLS
331
contrary, the concept is beyond the meaning or interpretation given to it.
It is a process that involves obtaining, analysing data, and using the data to make projections of future
expansions defined school-mapping as the dynamic process of diagnosing and estimating school requirements
and identifying the communities and sites where new schools are to be located and where additional facilities
are required. It is also seen as designing, outlining, and fashioning out all that will aid formal education. It can
therefore be concluded that school-mapping is the locational planning of educational institutions, the allocation
as well as the optimal utilisation of the required resources in the institutions.
According to available accounts, school-mapping originated in France in 1963 (Caillods, 1983; Da Graca,
1998). It is a well-accepted and long-standing approach to the planning of school locations which is also used
to investigate and ensure the efficient and equitable distribution of resources within and between school
systems when large-scale reform or significant expansion of an education system takes place. It is also seen as a
dynamic process of identifying the site where educational facilities are to be located. It involves more than the
preparation of scale maps with conventional sign showing the location of educational institutions.
School-mapping involves the application of thought processes and critical analysis of techniques to foresee
what educational institutions are likely to be and what type of educational future a society or community may
have by the end of a planning period. Location of schools is function of school-mapping.
Therefore, school-mapping is the process of estimating and diagnosing school requirements and identifying
the ideal communities and sites where new schools are to be located and where additional educational resources
are to be provided. Chesswas (1969) viewed school-mapping as school location planning which is a technique
for evaluation of use-efficiency, re-organization, and re-distribution of resources (physical and human) that are
required for meeting the current and future needs of education in the society. Location-planning is a term often
applied to the set administrative policies and procedure that are used in planning, distribution, size, and spacing
of schools. This involves efficient planning of the site and school resources to ensure greater access and
efficient use of the school by the community it served. School-mapping is an essential planning tool to
overcome possibilities of regional inequities arising from the investment policies of the public authorities.
Caillods (1983) and Varghese et al. (1997) advanced some uses of school-mapping. These are to:
1. Create the necessary conditions for achieving universal primary education (UPE) and universal
secondary education (USE);
2. Increase access for females and members of other traditionally under-represented socioeconomic groups;
3. Promote the equitable distribution of educational benefits within and between different regions and
populations;
4. Improve the quality of educational efforts;
5. Optimise the efficient use of existing capital, human, and financial resources;
6. Organise, coordinate, and rationalise efforts at technical, vocational, and post-secondary education
(Caillods, 1983; Varghese, 1997).
School-mapping incorporates spatial and demographic dimensions into the educational planning process
(Hite, 2006; 2008).
It is necessary to map schools but it is sufficient to plan the school-mapping process and this planning is
not done without figures or data. Planning a school map (if it must be holistic) may involve determination of
school sites, school architectural design, policy considerations for school establishment, demographic variables
considerations in school-mapping, agents of school-mapping, political factors in school-mapping, and
DESIGNING A SCHOOL MAP FOR EXPANDING PUBLIC PRIMARY SCHOOLS
332
school-mapping finance, administration, maintenance utilisation, and constraints. They will serve as a yardstick
for effective school map planning. The methodology of planning a school map envisages specification of norms,
diagnosis of the existing educational facilities, projection of future population, deciding the location of schools,
estimates of facilities required in all the (existing and new) educational institutions, and estimation of financial
resources required. School-mapping can now be planned with thought processes and analytical techniques, and
forecast on what educational institutions have to be and a dynamic process of identifying logically and
systematically the community, where educational facilities are to be located.
In mapping schools in Osun State, Nigeria, there is a need to know the status of each of the following
parameters in the state: promotion/survival rate, repeater rate, dropout rate, birth rate, and death rate.
The Statement of the Problem
Many efforts have been made globally to address inequities (inaccessibility and learning outcomes) in
education particularly since the Sustainable Development Goal Four (SDG IV) was formulated in 2015.
Beyond diagnosis of this defect, the Osun State government has erected new blocks of classrooms in different
locations in the three senatorial districts of the state. Such structures are found in all the 30 local government
areas (LGAs) in the state. The schools are sited in various locations particularly in the urban centres of the state.
However, it is observed that the existing schools before the establishment of the new ones are still in existence
creating a gamut of idle classrooms in the new structures. One might suggest that the existing school structures
should be abandoned (though this would result in a waste) while the new structures are put to use. The distance
from home (which the United Nations International Children’s Emergency Fund [UNICEF] puts at two
kilometers) of those new structures constitutes a breach as most of the new structures are not within the range
particularly in the highly urban centres. Not only is that, the new structures mostly structures along the
highways, creating the feeling of unsafe environment in parents and guardians.
An easy explanation of this situation is to have greater access to primary education, facilitating the
achievement of SDG IV which is to encourage inclusive and equitable quality education and promote learning
opportunities for all. This cannot be achieved in an atmosphere of waste typified in the existence of idle
classrooms and the probable deterioration as a consequence of disuse. In order to avert this wastage therefore in
the future (2022), there would be a need to design a school map within the period (2018-2022) under reference.
The Objectives of the Study
The study aimed at designing a school map for optimum utilisation in the educational system of Osun
State, Nigeria. The specific objectives were to:
1. Identify the locations of the existing schools in Osun State, Nigeria;
2. Examine the school age populations in the study area;
3. Project the expected school age population between 2018 and 2022 by using the existing data;
4. Estimate the number of classrooms required for the study area between 2018 and 2022;
5. Design a school map for the study area between 2018 and 2022.
Research Questions
The following questions were raised to guide the study:
1. Where are the existing schools located in the Osun State, Nigeria?

DESIGNING A SCHOOL MAP FOR EXPANDING PUBLIC PRIMARY SCHOOLS
333
2. What are the school age populations of the study area?
3. What are the expected school age populations between 2018 and 2022?
4. What number of classrooms will be required between 2018 and 2022?
5. What is the expected design of school map for Osun State, Nigeria in 2022?
The Significance of the Study
It is expected that exposures on planning school-mapping will facilitate people’s understanding of the
basic needs of every community realising the fact that what community “A” needs is different from what
community “B” requires. Specifically, the study would be useful for decision making on provision of facilities
and infrastructure reveal the extent of over-utilization and under-utilisation of existing instructional facilities,
provide guidelines for the reorganisation of such instructional facilities as well as serve as a blueprint for
medium planning of physical plant in primary schools.
Theoretical Framework
The study is based on Hull’s Need Reduction Theory (NRT) which recognises that there are societal primary
and secondary needs in Osun State, Nigeria. These needs lead to felt needs which might be primary and/or
secondary. The need to achieve 100% attendance in primary schools agrees with the SDG IV which stresses
inclusive education. The construction new buildings to expand the enrolment can only meet the secondary needs
of the children if they can attend with minimal discomfort. This is captured in Figure 1:
Figure 1. Need Reduction Theory (NRT) (Source: Clark Hull, 1933).
Thus, school-mapping is an exercise useful to rationally allocate educational facilities of any type related
to any level of education. According to existing literature, school-mapping originated in France in 1963
(Caillods, 1983; Da Graça, 1998; Galabawa, Agu, & Miyazawa, 2002; Govinda, 1999). School-mapping is a
normative approach to the micro planning of school locations.
In developing countries, school-mapping has been used at various times to attain or consolidate universal
primary education as in Morocco, Burundi, and the Sudan.
Determinants of School-Mapping
In determining the school map, consideration is given to some factors. These are demographic, educational,
geographical, political, economic, manpower, and economic activity factors (Hite, 2011). Policy considerations
also form a core issue in the process of school establishment. These considerations are land acquisition policy,
structure of the building, size (land and classroom), enrolment school infrastructure, and the national policy on
education (in this case, primary education). The education planner has a duty to have a detailed knowledge of
these in carrying out a school-mapping exercise for a state.
Needs
Primary needs
Secondary needs
Felt needs
Secondary needs
Met needs
Basic needs
Felt needs
Education
Attendance
Punctuality
Drives
100% attendance
High performance
Parental burden reduction
DESIGNING A SCHOOL MAP FOR EXPANDING PUBLIC PRIMARY SCHOOLS
334
Empirical Review
Several works have been done on school-mapping in different countries at different times especially at
times when countries were recovering from the World War II. The educational systems of those countries
experienced a great turn around, because planners engaged in post war child-centred education. School-based
planning is then seen as the most important means through which this is done.
A case study, found in the study of Galabawa, Agu, and Miyazawa (2002) discussed the impact of
school-mapping in Tanzania and studied its after effects on education. Another work on school-mapping was
carried out in Indian context that helped the decision maker in identifying the new school locations (Govinda,
1999). In this connection, the school map could be the means for carrying out administrative reforms at the
local level aiming at a re-grouping of institutions in clusters, such as the “nuclei” in Latin America or the
“clusters” in Thailand and Sri Lanka.
Appraisal of Literature
One of the greatest challenges for educational planners and administrators has been to equalize educational
opportunities for all and provide easy access to educational facilities to all children. If all habitations/villages
are to be provided with schools. Then, the question of equality does not arise. But in real life situations, we
locate schools in such villages, so that other habitations and villages also benefit. How do we decide on the
village/habitations where schools are to be opened so as to ensure equality of educational opportunities?
Most of the literatures do not focus on providing data on projected enrolments and facilities. This was the
aim of this study: designing a school map for Osun State, Nigeria with a view of ensuring efficiency in the
execution of building projects across the state.
Enrolment projections are important to decide on the opening of new schools, up-grading of existing schools
and to estimate the number of teachers required. The techniques of enrolment projections can broadly be
classified into two-mathematical and analytical methods. Mathematical methods require aggregate enrolment
data at least for five to 10 years, and only total enrolment can be projected. What is more, analytical methods
require promotion, dropout, repetition, and apparent entry rates. The two methods in this study were used to
design a school map for the state.
Methodology
The study adopted the descriptive survey research design. A sample representative of a large population to
generalize and plan for the state was selected. Osun State is one of the 36 states in Nigeria with three senatorial
districts (Osun East, Osun West, and Osun Central) and 30 local governments. The population of the study
involved 1,205 public elementary schools in Osun State with 1,205 head teachers across the three senatorial
districts in the state (Template for elementary schools in 2014/2015). The sample comprised six LGAs (using
cluster sampling technique), 30 public primary schools (using simple random sampling technique), and 30 head
teachers (using total enumeration sampling technique). Students’ flow which is a key area of intra educational
diagnosis in school-mapping was used. A map of Osun State, Nigeria was acquired from the Ministry of Lands,
Survey Department, Oshogbo Osun State, and local governments’ maps were drawn by using the geospatial
information system (GIS) for explicit information about the locations of the existing schools. Secondary data on
students flow (enrolments, promotion rate, repeater rate, and dropout rate of pupils) was collected from the
Ministry of Education Oshogbo to corroborate the information that was supplied from the selected schools,

DESIGNING A SCHOOL MAP FOR EXPANDING PUBLIC PRIMARY SCHOOLS
335
while mortality rate, population growth rate, and school-age population in the study area were collected from
the National Population Commission (NPC) and Osun State Planning Commision. Data were analysed for
projection purpose by using the projection formula as provided in the International Institute of Educational
Planning Publications.
PN t+1k+1 = St+1
k-1 + Rt+1k-1 – Dt+1
k+1 + U (1)
Where PN t+1k+1 is the projected enrolments to the succeeding class in the succeeding year. St+1
k-1 is the
survivors from the preceding class in the year. Rt+1k-1 is the repeaters in the succeeding year. Dt+1
k+1 is the
dropout from the succeeding class in the succeeding year. U is the error term.
A self-designed questionnaire titled “Questionnaire on Pupils’ Flow in Osun State Schools (QPFOSS)”
was also administered on the head teachers of selected schools to get information on the current enrolment
figures and the number of classrooms available for pupils in each selected school. The QPFOSS was validated
with the assistance of some experts in demography. Its reliability coefficient of 0.68 was also ascertained by
using re-test approach.
Data Analysis
The researchers used geographic information analysis to interpret the coordinates of the latitudinal and
longitudinal directions of the schools and made necessary projections (based on the existing data) by using a
projection formula as provided in the International Institute of Educational Planning Publications.
Results
Research Question 1: Where are the Existing Schools Located in?
Table 1 is the global position system (GPS) coordinates of the new elementary and neighbouring sampled
public primary schools.
Table 1
Locations of Existing and Newly Built Schools in Osun State (Study Area)
S/N Senatorial districts
LGA New elementary school buildings Neighbouring schools Longitude Latitude
1 Osun East
Ife Central
Baptist Central Elementary School, Ilare Ile Ife Longitude: 4.528306 Latitude: 7.518694
Christ Apostolic Church (CAC) Elementary Primary School, Ojoyi, Ife
4.549923 7.482614
Los Angeles (L.A.) Primary School, Eleyele, Ife
4.54571 7.490542
Igboya Community Primary School, Igboya, Ife
4.558748 7.517421
Community Primary School, Oluorogbo, Ife
4.548212 7.514722
Community P/S Olonade, Ife 4.547596 7.506297
Ife North
St. Augustine Elementary School, Ipetumodu Longitude: 4.472345 Latitude: 7.524266
L.A. School, Ipetumodu 4.493866 7.343221
St. Micheal’s School, Ebuabon
4.529601 7.395253
St. Thomas School, Edunabon 4.5091123 7.358743
CAC Government Elementary School
4.481048 7.401342
St. Jude School, Ipetumodu 4.451309 7.305879

DESIGNING A SCHOOL MAP FOR EXPANDING PUBLIC PRIMARY SCHOOLS
336
(Table 1 to be continued)
Note. GPS coordinates template for the study area.
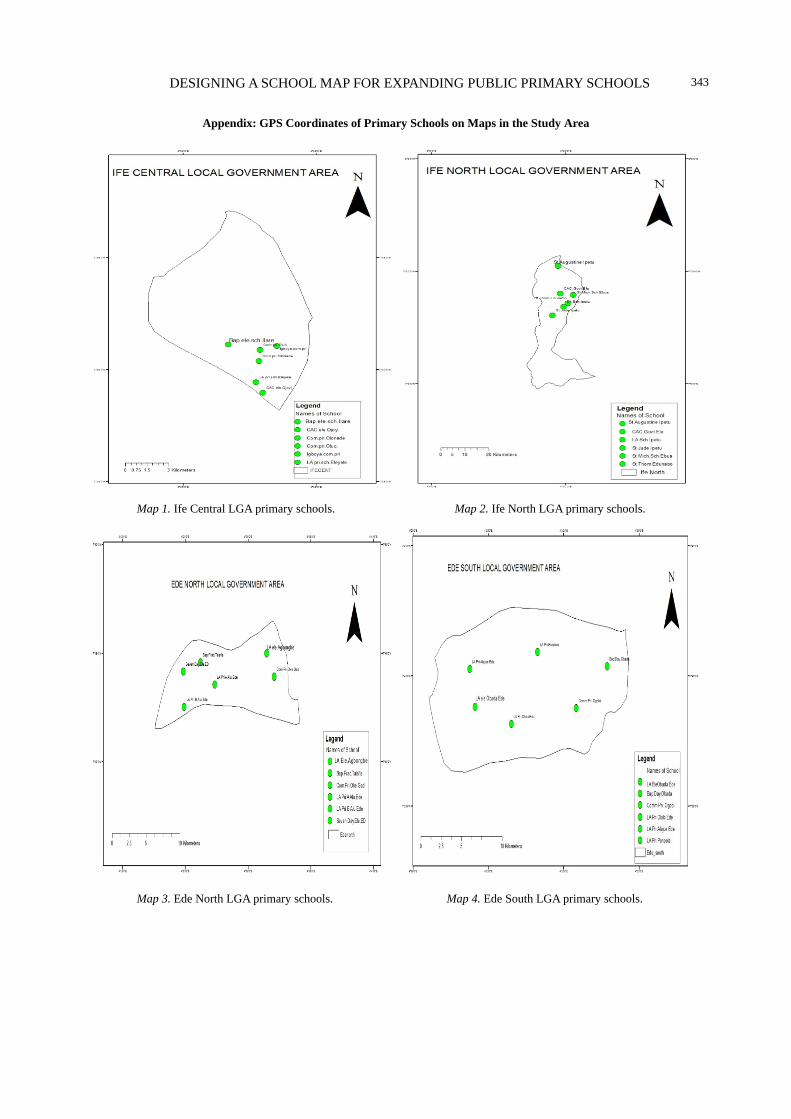
The maps interpreting the coordinates are presented in Maps 1-6 in the Appendix.
Ife Central LGA is a LGA in Osun State which has 111 km2 (43 sq mi) with coordinates 7°33’ N, 4°32’ E
and a population of 167,254 at the 2006 census. The schools sampled are closely located as shown in the map
which translates to a not very far walking distance from home to school. From Map 1, it is observed that the
neighbouring schools are very close to the new elementary school building. Based on the field report, few
classrooms were empty in each school visited sending a signal that there was no need for a new school building
when the existing ones have not been fully utilised.
Map 2 shows Ife North LGA and its primary schools. Ife North is a LGA in Osun State having Ipetumodu as
its headquarters which has 899 km2 (343 sq mi) with coordinates 7°22’ N, 4°30’ E and a population of 153,694 at
the 2006 census. The schools sampled are closely located as shown in the map which translates to a not very far
2 Osun West
Ede North
L.A. Elementary School, Agbongbe, Ede Longitude: 4.525363 Latitude: 7.754352
Baptist Practising School A., Talafia, Ede
4.437352 7.743734
L.A. Primary School A., Alusekere, Ede
4.456123 7.726263
L.A. Primary School B., Alusekere, Ede
4.415634 7.709223
Community Primary School, Oke-Gada, Ede
4.535253 7.732166
Seventh Day Adventist Government Elementary School, Ede
4.414122 7.736311
L.A. Primary School, Alajue, Ede
4.396356 7.671321
L.A. Primary School, Oloki, Ede
4.442173 7.636933
L.A. Primary School, Ponpola, Ede
4.471255 7.6822153
Ede South
L.A. Elementary School, Obada, Ede Longitude: 4.402733 Latitude: 7.647534
Baptist Day School, Obada, Ede
4.548277 7.673832
Community Primary School, Ogobi
4.514196 7.646326
3 Osun Central
Irepodun
A.U.D Elementary School, Laaro, Ilobu Longitude: 4.492243 Latitude: 7.852342
St. Micheal Anglican Primary School, Ilobu
4.485365 7.841163
L.A. Primary School A., Gbobamu, Ilobu
4.513275 7.861624
Isale Imole Community. Primary School, Ilobu
4.534217 7.903263
Methodist Primary School B., Ilobu
4.523053 7.877177
Aromiwe Comm Primary School, Ilobu
4.507268 7.858362
St. John’s Anglican Primary School, Ifon-Osun
4.483534 7.896311
A.U.D. Primary School A., Ifon-Osun
4.464742 7.872844
Molufon Community Primary School, Ifon-Osun
4.499423 7.909312
Orolu
St. John’S Rcm Elementary School, Ifon-Osun Longitude: 4.438325 Latitude: 7.891180
Baptist Primary School, Ifon-Osun
4.505076 7.926003
CAC Government Elementary School, Ifon-Osun
4.466316 7.848627
DESIGNING A SCHOOL MAP FOR EXPANDING PUBLIC PRIMARY SCHOOLS
337
walk-able distance from home to school. It also shows that the neighbouring schools are very close to the new
elementary school building. Field report also shows that few classrooms were empty in each school visited
justifying that no need for a new school building when the existing ones have not been fully utilised. This is
captured in Map 2 in the Appendix.
Map 3 shows Ede North LGA and its primary schools. Ede North is a LGA in Osun State having Oja Timi as
its headquarters which has 899 km2 (343 sq mi) with coordinates 7°44’ N, 4°29’ E and a population of 83,831 at
the 2006 census. The postal code area is 232. The schools sampled have a scattered distribution. From Map 3, one
can see that the neighbouring schools are not very close to the new elementary school building and based on the
field report, quite a number of classrooms were locked up in each school visited thereby posing a question on how
the need for a new school building arose in the first place when the existing ones were not optimally utilised. This
is captured in Map 3 in the Appendix.
Ede South LGA and its primary schools are presented in Map 4. Ede South is a LGA in Osun State having
Ede Town as its headquarters which has 219 km2 (85 sq mi) with coordinates 7°42’ N, 4°27’ E and a population
of 103,494 at the 2006 census. The postal code area is 232. In Map 4, one can see that the existing schools are not
that close to the new elementary school building compared. Based on the field report, some classrooms were
empty of pupils in each school visited which invariably means there was no need for new schools to be
established.
Irepodun is a LGA in Osun State having Ilobu as its headquarters which has 64 km2 (25 sq mi)
with coordinates 7°50’ N, 4°29’ E and a population of 119,497 at the 2006 census. The postal code area is 230.
The schools sampled are serially sited as shown in the map above which translates to a not very far walk-able
distance from home to school for residents on the extremes. In Map 5, it is shown that the neighbouring schools
are very close to the new elementary school building and based on the field report, few classrooms were not
utilised.
Orolu is a LGA in Osun State having Ifon Osun as its headquarters which has 80 km2 (30 sq mi) with
coordinates 7°52’ N, 4°29’ E and a population of 103,077 at the 2006 census. The postal code area is 230. The
schools sampled have a scattered distribution as shown in the Map 6. One can see that the existing schools are far
from the new elementary school building and based on the field report, quite a number of classrooms were locked
up in each school visited.
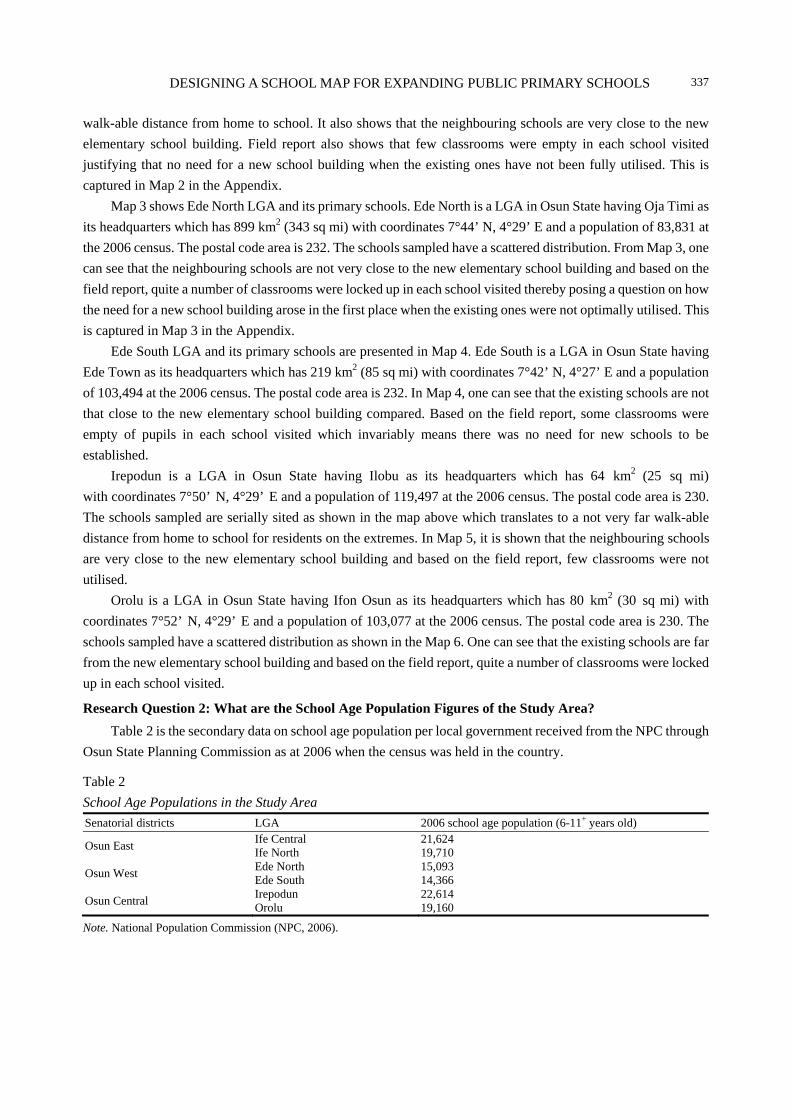
Research Question 2: What are the School Age Population Figures of the Study Area?
Table 2 is the secondary data on school age population per local government received from the NPC through
Osun State Planning Commission as at 2006 when the census was held in the country.
Table 2
School Age Populations in the Study Area
Senatorial districts LGA 2006 school age population (6-11+ years old)
Osun East Ife Central Ife North
21,624 19,710
Osun West Ede North Ede South
15,093 14,366
Osun Central Irepodun Orolu
22,614 19,160
Note. National Population Commission (NPC, 2006).
DESIGNING A SCHOOL MAP FOR EXPANDING PUBLIC PRIMARY SCHOOLS
338
From Table 2, the school age population figures are displayed, showing the number of children (both males
and females) between 6 and 11+ years old. The figures are the combination of children in school and those that
were out of school age population.
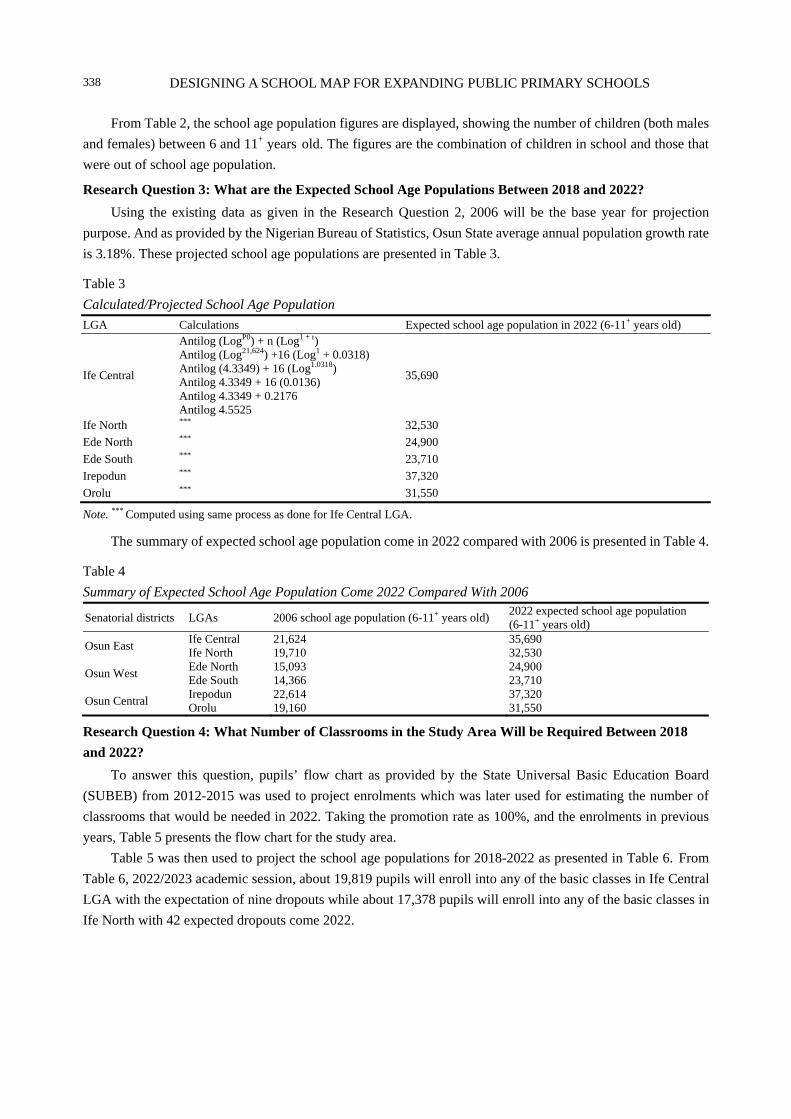
Research Question 3: What are the Expected School Age Populations Between 2018 and 2022?
Using the existing data as given in the Research Question 2, 2006 will be the base year for projection
purpose. And as provided by the Nigerian Bureau of Statistics, Osun State average annual population growth rate
is 3.18%. These projected school age populations are presented in Table 3.
Table 3
Calculated/Projected School Age Population
LGA Calculations Expected school age population in 2022 (6-11+ years old)
Ife Central
Antilog (LogP0) + n (Log1 + r) Antilog (Log21,624) +16 (Log1 + 0.0318) Antilog (4.3349) + 16 (Log1.0318) Antilog 4.3349 + 16 (0.0136) Antilog 4.3349 + 0.2176 Antilog 4.5525
35,690
Ife North *** 32,530
Ede North *** 24,900
Ede South *** 23,710
Irepodun *** 37,320
Orolu *** 31,550
Note. *** Computed using same process as done for Ife Central LGA.
The summary of expected school age population come in 2022 compared with 2006 is presented in Table 4.
Table 4
Summary of Expected School Age Population Come 2022 Compared With 2006
Senatorial districts LGAs 2006 school age population (6-11+ years old) 2022 expected school age population (6-11+ years old)
Osun East Ife Central Ife North
21,624 19,710
35,690 32,530
Osun West Ede North Ede South
15,093 14,366
24,900 23,710
Osun Central Irepodun Orolu
22,614 19,160
37,320 31,550
Research Question 4: What Number of Classrooms in the Study Area Will be Required Between 2018
and 2022?
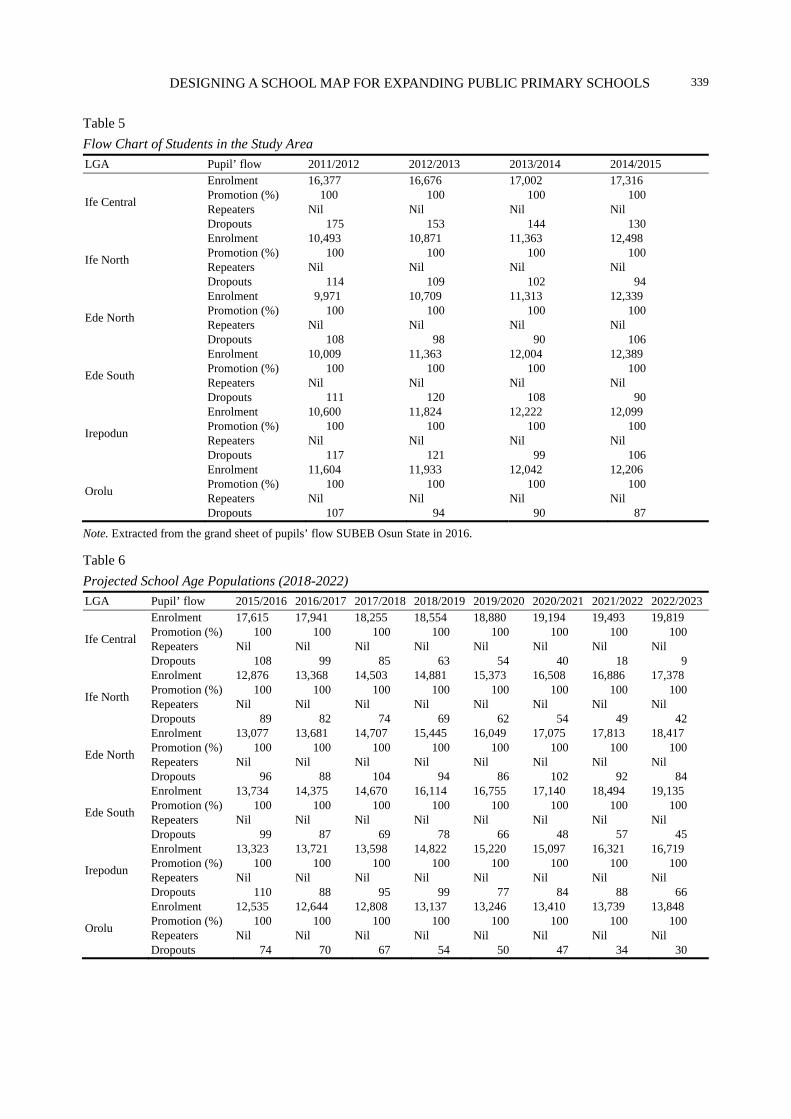
To answer this question, pupils’ flow chart as provided by the State Universal Basic Education Board
(SUBEB) from 2012-2015 was used to project enrolments which was later used for estimating the number of
classrooms that would be needed in 2022. Taking the promotion rate as 100%, and the enrolments in previous
years, Table 5 presents the flow chart for the study area.
Table 5 was then used to project the school age populations for 2018-2022 as presented in Table 6. From
Table 6, 2022/2023 academic session, about 19,819 pupils will enroll into any of the basic classes in Ife Central
LGA with the expectation of nine dropouts while about 17,378 pupils will enroll into any of the basic classes in
Ife North with 42 expected dropouts come 2022.
DESIGNING A SCHOOL MAP FOR EXPANDING PUBLIC PRIMARY SCHOOLS
339
Table 5
Flow Chart of Students in the Study Area
LGA Pupil’ flow 2011/2012 2012/2013 2013/2014 2014/2015
Ife Central
Enrolment Promotion (%) Repeaters Dropouts
16,377 100
Nil 175
16,676 100
Nil 153
17,002 100
Nil 144
17,316 100
Nil 130
Ife North
Enrolment Promotion (%) Repeaters Dropouts
10,493 100
Nil 114
10,871 100
Nil 109
11,363 100
Nil 102
12,498 100
Nil 94
Ede North
Enrolment Promotion (%) Repeaters Dropouts
9,971 100
Nil 108
10,709 100
Nil 98
11,313 100
Nil 90
12,339 100
Nil 106
Ede South
Enrolment Promotion (%) Repeaters Dropouts
10,009 100
Nil 111
11,363 100
Nil 120
12,004 100
Nil 108
12,389 100
Nil 90
Irepodun
Enrolment Promotion (%) Repeaters Dropouts
10,600 100
Nil 117
11,824 100
Nil 121
12,222 100
Nil 99
12,099 100
Nil 106
Orolu
Enrolment Promotion (%) Repeaters Dropouts
11,604 100
Nil 107
11,933 100
Nil 94
12,042 100
Nil 90
12,206 100
Nil 87
Note. Extracted from the grand sheet of pupils’ flow SUBEB Osun State in 2016.
Table 6
Projected School Age Populations (2018-2022)
LGA Pupil’ flow 2015/2016 2016/2017 2017/2018 2018/2019 2019/2020 2020/2021 2021/2022 2022/2023
Ife Central
Enrolment Promotion (%) Repeaters Dropouts
17,615 100
Nil 108
17,941 100
Nil 99
18,255 100
Nil 85
18,554 100
Nil 63
18,880 100
Nil 54
19,194 100
Nil 40
19,493 100
Nil 18
19,819 100
Nil 9
Ife North
Enrolment Promotion (%) Repeaters Dropouts
12,876 100
Nil 89
13,368 100
Nil 82
14,503 100
Nil 74
14,881 100
Nil 69
15,373 100
Nil 62
16,508 100
Nil 54
16,886 100
Nil 49
17,378 100
Nil 42
Ede North
Enrolment Promotion (%) Repeaters Dropouts
13,077 100
Nil 96
13,681 100
Nil 88
14,707 100
Nil 104
15,445 100
Nil 94
16,049 100
Nil 86
17,075 100
Nil 102
17,813 100
Nil 92
18,417 100
Nil 84
Ede South
Enrolment Promotion (%) Repeaters Dropouts
13,734 100
Nil 99
14,375 100
Nil 87
14,670 100
Nil 69
16,114 100
Nil 78
16,755 100
Nil 66
17,140 100
Nil 48
18,494 100
Nil 57
19,135 100
Nil 45
Irepodun
Enrolment Promotion (%) Repeaters Dropouts
13,323 100
Nil 110
13,721 100
Nil 88
13,598 100
Nil 95
14,822 100
Nil 99
15,220 100
Nil 77
15,097 100
Nil 84
16,321 100
Nil 88
16,719 100
Nil 66
Orolu
Enrolment Promotion (%) Repeaters Dropouts
12,535 100
Nil 74
12,644 100
Nil 70
12,808 100
Nil 67
13,137 100
Nil 54
13,246 100
Nil 50
13,410 100
Nil 47
13,739 100
Nil 34
13,848 100
Nil 30
DESIGNING A SCHOOL MAP FOR EXPANDING PUBLIC PRIMARY SCHOOLS
340
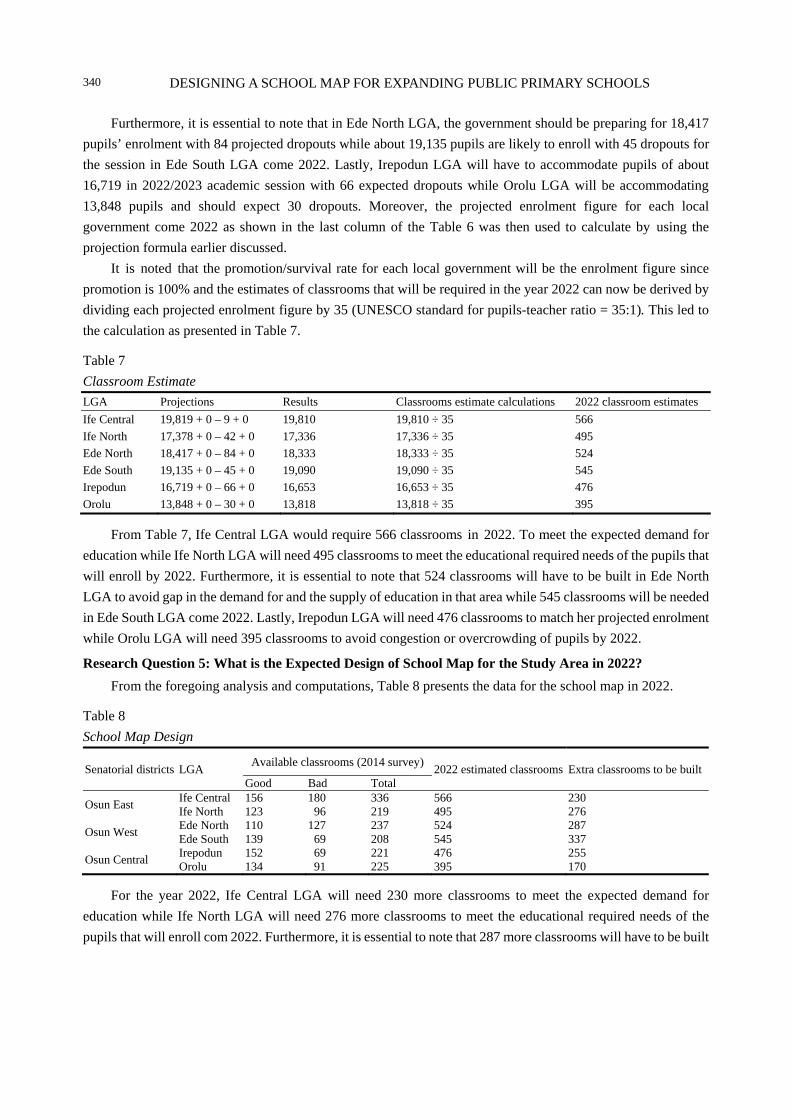
Furthermore, it is essential to note that in Ede North LGA, the government should be preparing for 18,417
pupils’ enrolment with 84 projected dropouts while about 19,135 pupils are likely to enroll with 45 dropouts for
the session in Ede South LGA come 2022. Lastly, Irepodun LGA will have to accommodate pupils of about
16,719 in 2022/2023 academic session with 66 expected dropouts while Orolu LGA will be accommodating
13,848 pupils and should expect 30 dropouts. Moreover, the projected enrolment figure for each local
government come 2022 as shown in the last column of the Table 6 was then used to calculate by using the
projection formula earlier discussed.
It is noted that the promotion/survival rate for each local government will be the enrolment figure since
promotion is 100% and the estimates of classrooms that will be required in the year 2022 can now be derived by
dividing each projected enrolment figure by 35 (UNESCO standard for pupils-teacher ratio = 35:1). This led to
the calculation as presented in Table 7.
Table 7
Classroom Estimate
LGA Projections Results Classrooms estimate calculations 2022 classroom estimates
Ife Central 19,819 + 0 – 9 + 0 19,810 19,810 ÷ 35 566
Ife North 17,378 + 0 – 42 + 0 17,336 17,336 ÷ 35 495
Ede North 18,417 + 0 – 84 + 0 18,333 18,333 ÷ 35 524
Ede South 19,135 + 0 – 45 + 0 19,090 19,090 ÷ 35 545
Irepodun 16,719 + 0 – 66 + 0 16,653 16,653 ÷ 35 476
Orolu 13,848 + 0 – 30 + 0 13,818 13,818 ÷ 35 395
From Table 7, Ife Central LGA would require 566 classrooms in 2022. To meet the expected demand for
education while Ife North LGA will need 495 classrooms to meet the educational required needs of the pupils that
will enroll by 2022. Furthermore, it is essential to note that 524 classrooms will have to be built in Ede North
LGA to avoid gap in the demand for and the supply of education in that area while 545 classrooms will be needed
in Ede South LGA come 2022. Lastly, Irepodun LGA will need 476 classrooms to match her projected enrolment
while Orolu LGA will need 395 classrooms to avoid congestion or overcrowding of pupils by 2022.
Research Question 5: What is the Expected Design of School Map for the Study Area in 2022?
From the foregoing analysis and computations, Table 8 presents the data for the school map in 2022.
Table 8
School Map Design
Senatorial districts LGA Available classrooms (2014 survey)
2022 estimated classrooms Extra classrooms to be builtGood Bad Total
Osun East Ife Central Ife North
156 123
180 96
336 219
566 495
230 276
Osun West Ede North Ede South
110 139
127 69
237 208
524 545
287 337
Osun Central Irepodun Orolu
152 134
69 91
221 225
476 395
255 170
For the year 2022, Ife Central LGA will need 230 more classrooms to meet the expected demand for
education while Ife North LGA will need 276 more classrooms to meet the educational required needs of the
pupils that will enroll com 2022. Furthermore, it is essential to note that 287 more classrooms will have to be built

DESIGNING A SCHOOL MAP FOR EXPANDING PUBLIC PRIMARY SCHOOLS
341
in Ede North LGA to avoid gap in the demand for and the supply of education in that area while 337 more
classrooms will be needed in Ede South LGA come 2022. Lastly, Irepodun LGA will need 255 extra classrooms
to match her projected enrolment while Orolu LGA will need 170 more classrooms to avoid congestion or
overcrowding of pupils come 2022.
Summary, Conclusion, and Recommendations
Summary
The projected number of classrooms required by Osun State government in Nigeria by 2022 would go
along way to prevent wastage. Furthermore, from the projected number of students who would enroll in the
year 2022, the number of classrooms was estimated and showed that 566, 495, 524, 525, 476, and 395
classrooms will be required to meet the projected enrolments of Ife Central, Ife North, Ede North, Ede South,
Irepodun, and Orolu LGAs, respectively. Lastly, the design of school map was done through the representation
of GPS coordinates on GIS and the comparison of the existing classrooms with the projected required
classrooms to know what more classrooms would be needed by 2022.
Conclusion
Based on the findings from the field experience, it is indisputable that linear expansions in the educational
enterprise have been made by the government of Osun State. It is therefore necessary to ensure that adequate
school-mapping should be done on existing schools before new schools are established to be able to ascertain
the likely enrolments by knowing the school age population and the gap between the school age population and
enrolments in schools to avoid wastage of resources and facilities that we have presently in the state. Unlike
other findings that show inadequacy on the part of the government, this study showed excessive provision of
facilities for low enrolments. In fact, existing schools are better renovated with few classrooms added to the
structures on the available land space than building new ones.
Recommendations
This study has shown that Osun State government has excessively provided facilities in a way that
classrooms are more than enrolled pupils would need. Therefore, in a bid to plan for the state, the following
recommendations are made to the government of Osun State:
1. With the projection made on the school age population compared to the existing one, Osun State
government should be prepared to host quite a number of pupils in the educational enterprise by 2022.
2. With the estimated number of classrooms that will be required by 2022 in the study area, Osun State
government must ensure sufficient facilities to match the projected enrolments for 2022 to avoid deficiencies
and wastage.
3. With the design of school map for the study area, Osun State Government with the help of educational
planners should add to the available facilities to match the expected number of enrolment by 2022.
Preparation against 2022 should start now to avoid hasty project execution which cannot be devoid of
errors.
References Caillods, F. (1983). Module I: School mapping and micro-planning concepts and processes. In F. Caillods, J. Casselli, T. N. Châu,
& G. Porte (Eds.), Training materials in educational planning, administration, and facilities: School mapping and micro-planning in education. Paris: IIEP-UNESCO.
DESIGNING A SCHOOL MAP FOR EXPANDING PUBLIC PRIMARY SCHOOLS
342
Chesswas, J. D. (1969). Methodologist of educational planning for development countries. Paris: UNESCO. Da Graça, P. (1998). Décentralisation, partenariat et carte scolaire: Le cas français, série carte scolaire et planification au
niveau local (Decentralization, partnership, and school map: The French case, school map series, and local planning). Paris: IIEP-UNESCO.
De Grauwe, A. (2002). Planning and analysis of educational facilities using GIS: A case study of Busia County, Kenya. In I. Attfield, M. Tamiru, B. Parolin, & A. De Grauwe (Eds.), Improving micro-planning in education through a geographical information system: Studies on Ethiopia and Palestine (pp. 7-17). Paris: IIEP-UNESCO.
Federal Republic of Nigeria (FRN). (2013). National policy on education (Revised ed.). Abuja: NERDC. Galabawa, J. C., Agu, A. O., & Miyazawa, I. (2002). The impact of school mapping in the development of education in Tanzania:
An assessment of the experiences of six districts. Evaluation and Program Planning ERIC, 25(1), 23-33. Govinda, R., (1999). Reaching the unreached through participatory planning: School mapping in Lok Jumbish, India. Paris:
UNESCO Publishing IIEP. Halls, P. J., Bulling, M., White, P. C., Garland, L., & Harris, S. (2001). Dirichlet neighbours: Revisiting Dirichlet tessellation for
neighborhood analysis. Computers, Environment and Urban Systems, 25(1), 105-117. Hite, S. J. (2006). GIS-generated school mapping materials of two counties in Hungary (mimeo). Paris: IIEP-UNESCO. Hite, S. J. (2008). School mapping and GIS in education micro-planning. Paris: UNESCO Publishing IIEP. Hite, S. J. (2011). School mapping and geographical information systems. In M. Bray, & A. O.Varghese (Eds.), Directions in
educational planning international experiences and perspectives. Paris: UNESCO Publishing. Hull, C. (1933). Drive reduction theory of motivation. Retrieved October 23, 2017, from https://www.psychologynoteshq.com/
drive-reduction-theory/ International Institute of Educational Planning. (2006). Improving micro-planning in education through a geographical. Retrieved
July 25, 2017, from https://www.researchgate.net/publication/44829661_Improving_microplanning_in_education Mendelson, J. (2012). Development and application of school mapping in Palestine. Retrieved July 25, 2017, from
http://www.raison.com.na/Palestine%20-%20Report%20on%20school%20mapping%202 Niles, S. G., & Harris-Bowlsbey, J. (2003). Career development interventions in the 21st century. Retrieved July 25, 2017, from
https://www.pearson.com/us/higher.../Niles...in.../9780133155389.html United Nations Educational Scientific and Cultural Organization (UNESCO). (2007). Education for all global monitoring report.
Retrieved from https://www.en.wikipedia.org/wiki/Education_for_All_Global_Monitoring_Report Varghese, A. O., Juwarkar, A. A., Singh, S. K., Aher, A. A., & Thawale P. R. (1997). Mapping of realized and fundamental
niches of threatened tree species. Retrieved July 27, 2017, from http://www.scholar.google.com/citations?user= ubdWa2sAAAAJ&hl=en
Zhao, D., & Parolin, B. (2012). School mapping restructure in rural China: Achievements, problems, and implications. Asia Pacific Review, 13(4), 713-726.
DESIGNING A SCHOOL MAP FOR EXPANDING PUBLIC PRIMARY SCHOOLS
343
Appendix: GPS Coordinates of Primary Schools on Maps in the Study Area
Map 1. Ife Central LGA primary schools. Map 2. Ife North LGA primary schools.
Map 3. Ede North LGA primary schools. Map 4. Ede South LGA primary schools.
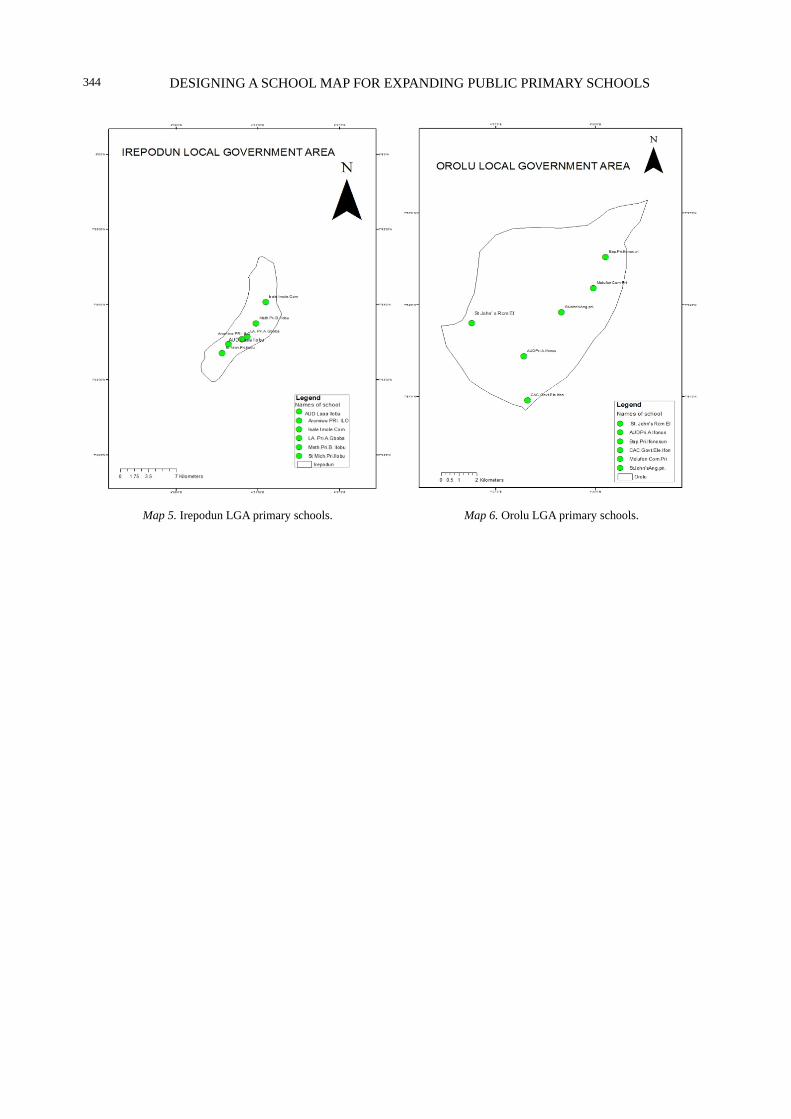
DESIGNING A SCHOOL MAP FOR EXPANDING PUBLIC PRIMARY SCHOOLS
344
Map 5. Irepodun LGA primary schools. Map 6. Orolu LGA primary schools.