2. comparative economic development
DESCRIPTION
Comparative Economic DevelopmentTRANSCRIPT
Copyright © 2012 Pearson Addison-Wesley. All rights reserved.
Chapter 2
Comparative Economic Development
Copyright © 2012 Pearson Addison-Wesley. All rights reserved. 2-2
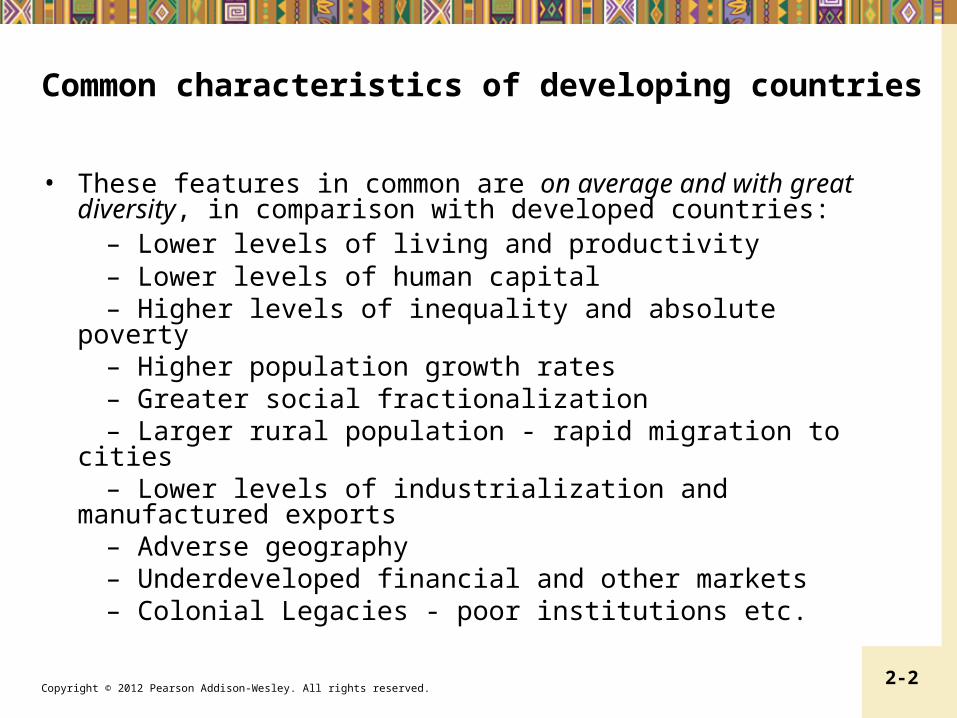
Common characteristics of developing countries
• These features in common are on average and with great diversity, in comparison with developed countries:
– Lower levels of living and productivity – Lower levels of human capital – Higher levels of inequality and absolute poverty – Higher population growth rates – Greater social fractionalization – Larger rural population - rapid migration to cities – Lower levels of industrialization and manufactured exports – Adverse geography – Underdeveloped financial and other markets – Colonial Legacies - poor institutions etc.
Copyright © 2012 Pearson Addison-Wesley. All rights reserved. 2-3
2.1 Defining the Developing World
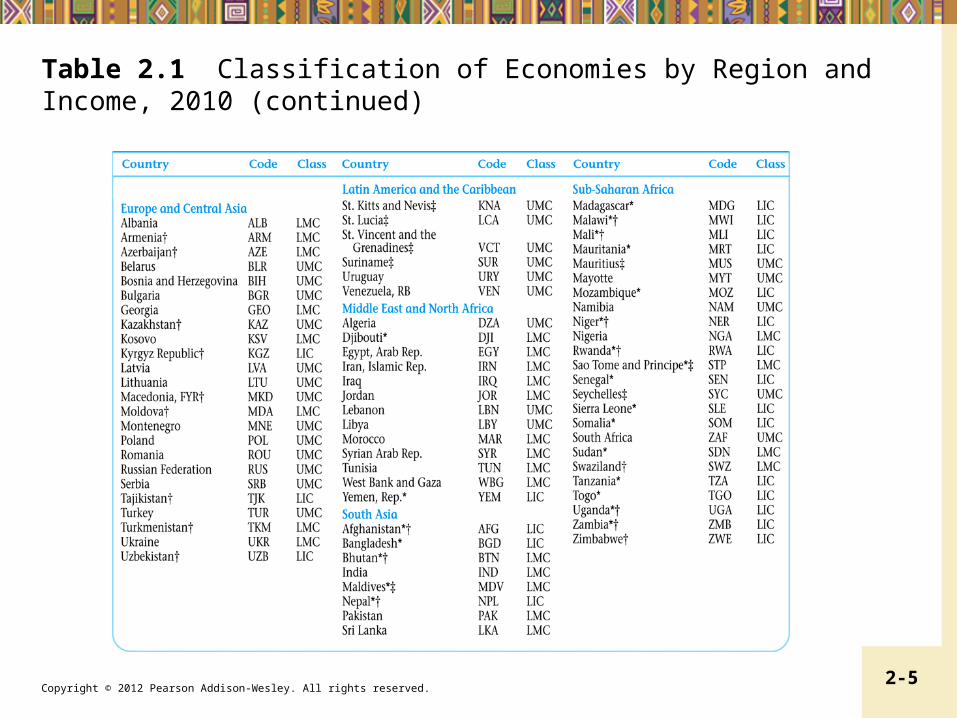
• World Bank Scheme- ranks countries on GNP/capita– LIC, LMC, UMC, OECD (see Table 2.1 and Figure
2.1)
Copyright © 2012 Pearson Addison-Wesley. All rights reserved. 2-4
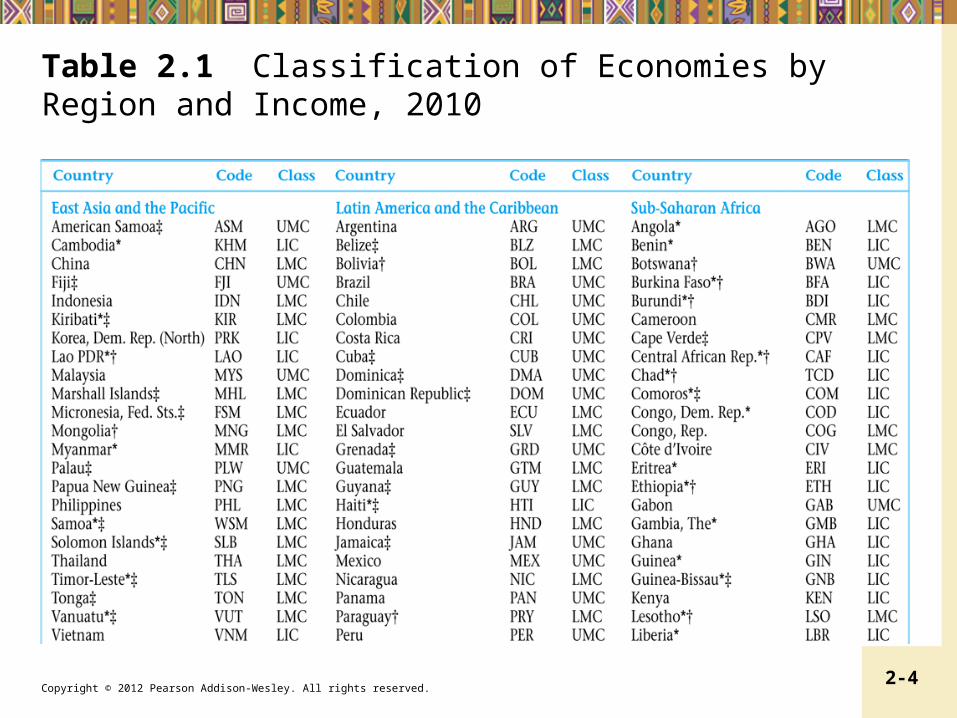
Table 2.1 Classification of Economies by Region and Income, 2010
Copyright © 2012 Pearson Addison-Wesley. All rights reserved. 2-5
Table 2.1 Classification of Economies by Region and Income, 2010 (continued)

Copyright © 2012 Pearson Addison-Wesley. All rights reserved. 2-6
Table 2.1 Classification of Economies by Region and Income, 2010 (continued)
Copyright © 2012 Pearson Addison-Wesley. All rights reserved. 2-7
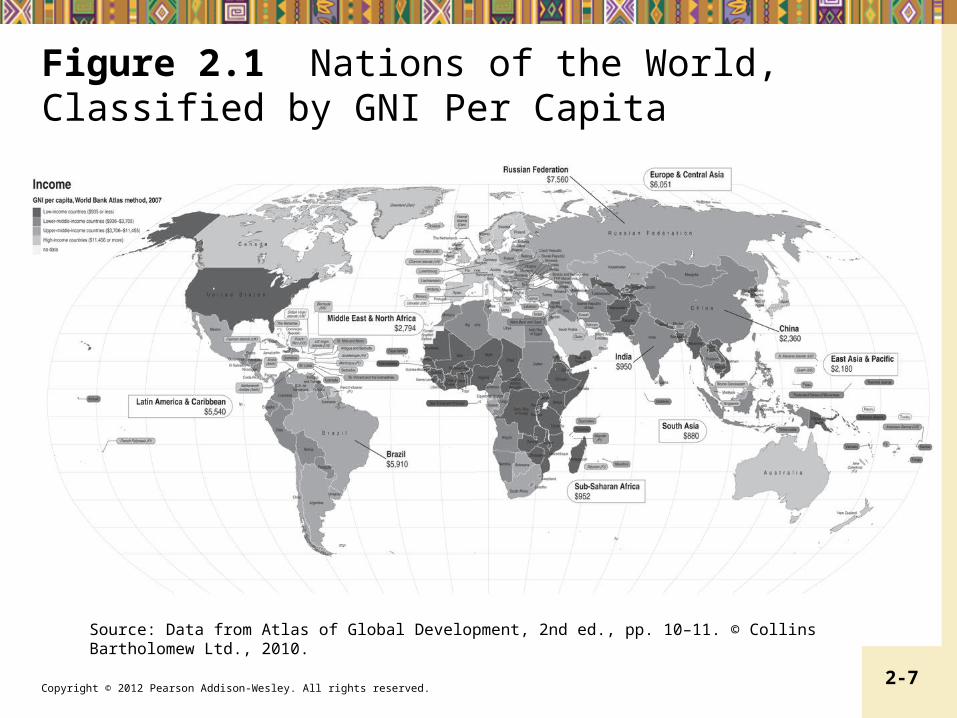
Figure 2.1 Nations of the World, Classified by GNI Per Capita
Source: Data from Atlas of Global Development, 2nd ed., pp. 10–11. © Collins Bartholomew Ltd., 2010.
Copyright © 2012 Pearson Addison-Wesley. All rights reserved. 2-8
2.2 Basic Indicators of Development: Real Income, Health, and Education
• Gross National Income (GNI)• Gross Domestic Product (GDP)• PPP method instead of exchange rates as
conversion factors (see Figure 2.2)

Copyright © 2012 Pearson Addison-Wesley. All rights reserved. 2-9
Figure 2.2 Income Per Capita in Selected Countries (2008)
Copyright © 2012 Pearson Addison-Wesley. All rights reserved. 2-10
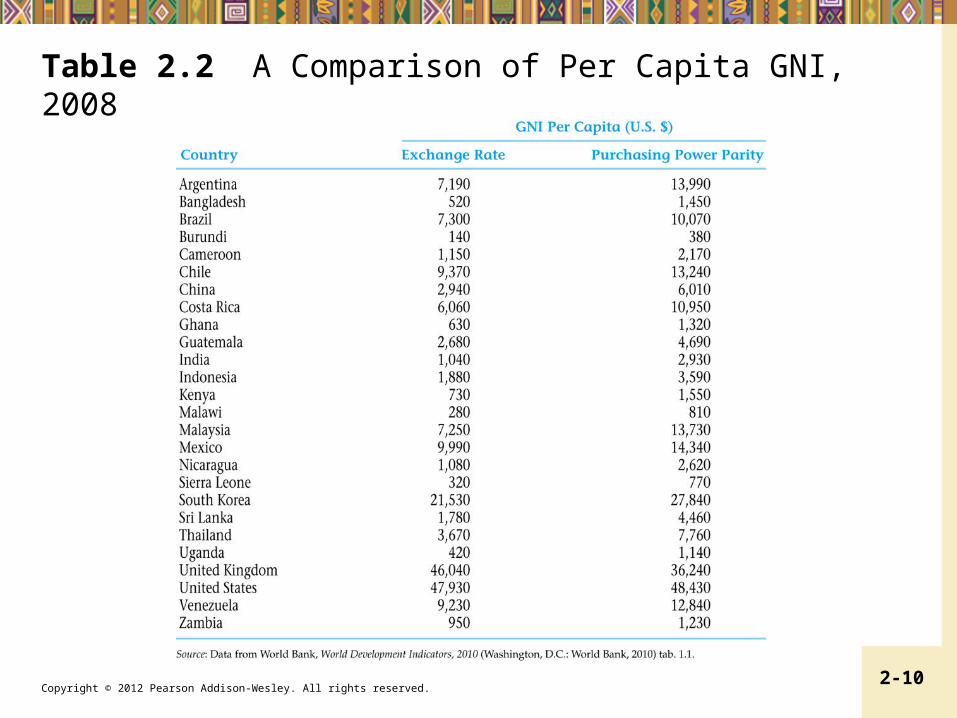
Table 2.2 A Comparison of Per Capita GNI, 2008
Copyright © 2012 Pearson Addison-Wesley. All rights reserved. 2-11
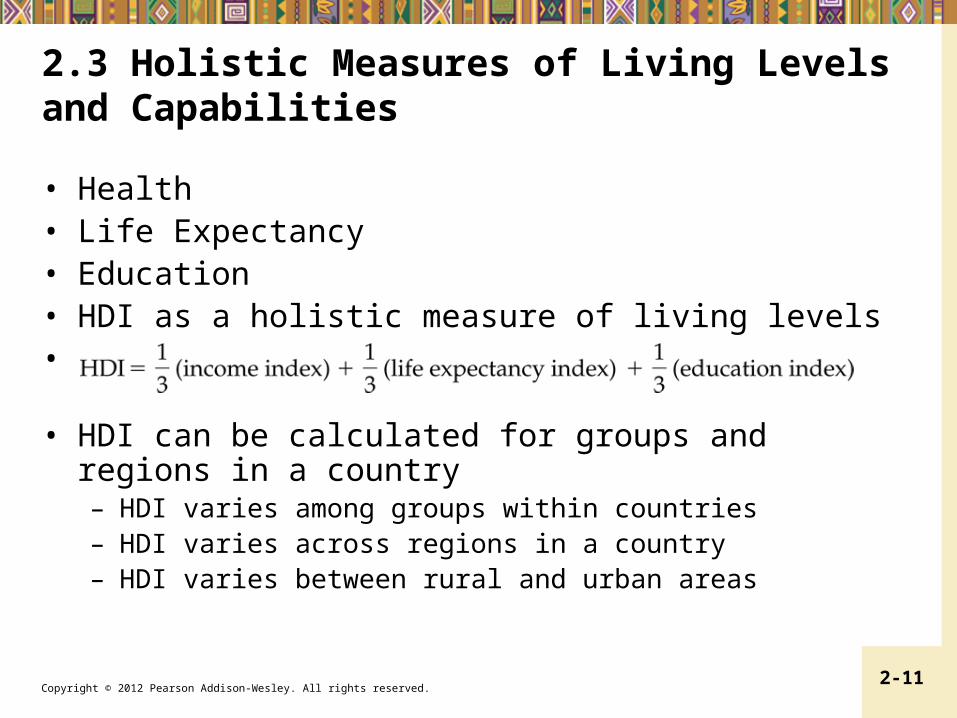
2.3 Holistic Measures of Living Levels and Capabilities
• Health• Life Expectancy• Education • HDI as a holistic measure of living levels•
• HDI can be calculated for groups and regions in a country– HDI varies among groups within countries– HDI varies across regions in a country – HDI varies between rural and urban areas
Copyright © 2012 Pearson Addison-Wesley. All rights reserved. 2-12
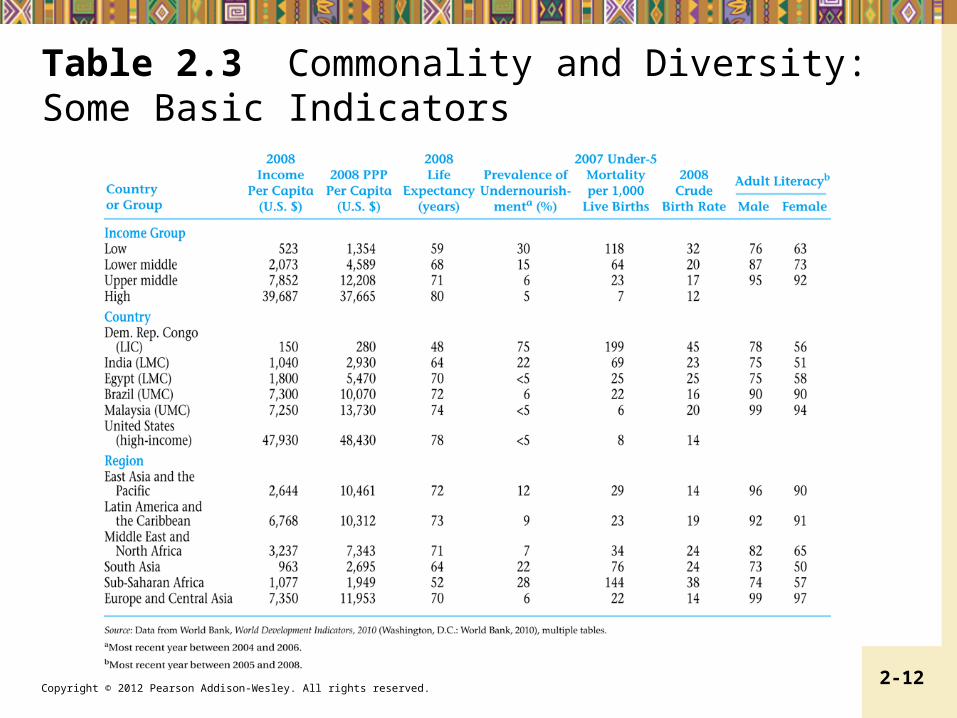
Table 2.3 Commonality and Diversity: Some Basic Indicators
Copyright © 2012 Pearson Addison-Wesley. All rights reserved. 2-13
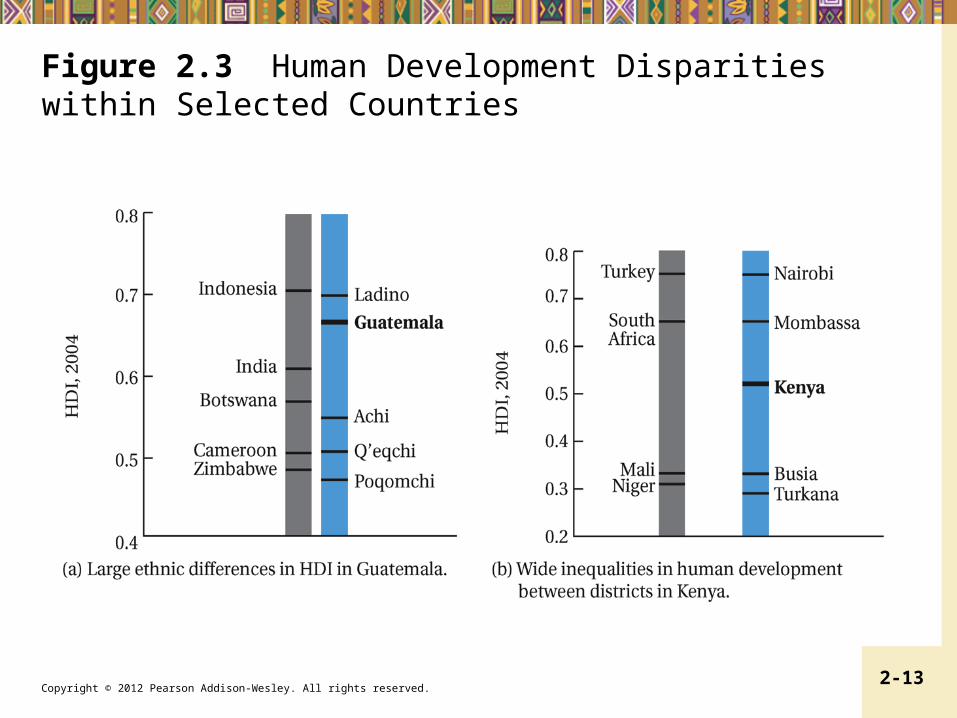
Figure 2.3 Human Development Disparities within Selected Countries
Copyright © 2012 Pearson Addison-Wesley. All rights reserved. 2-14
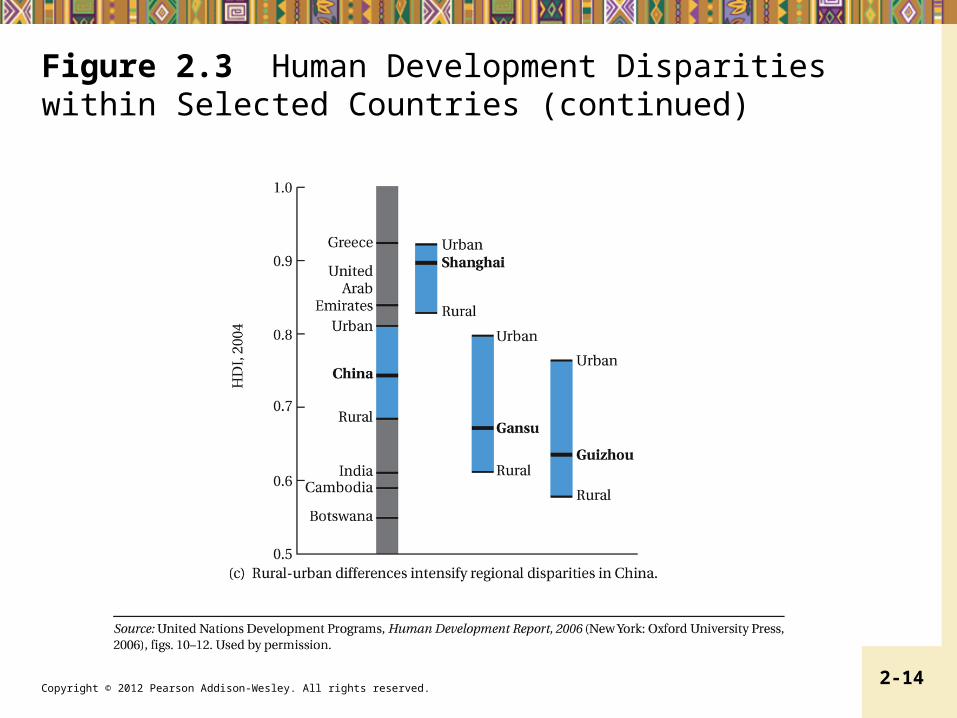
Figure 2.3 Human Development Disparities within Selected Countries (continued)
Copyright © 2012 Pearson Addison-Wesley. All rights reserved. 2-15
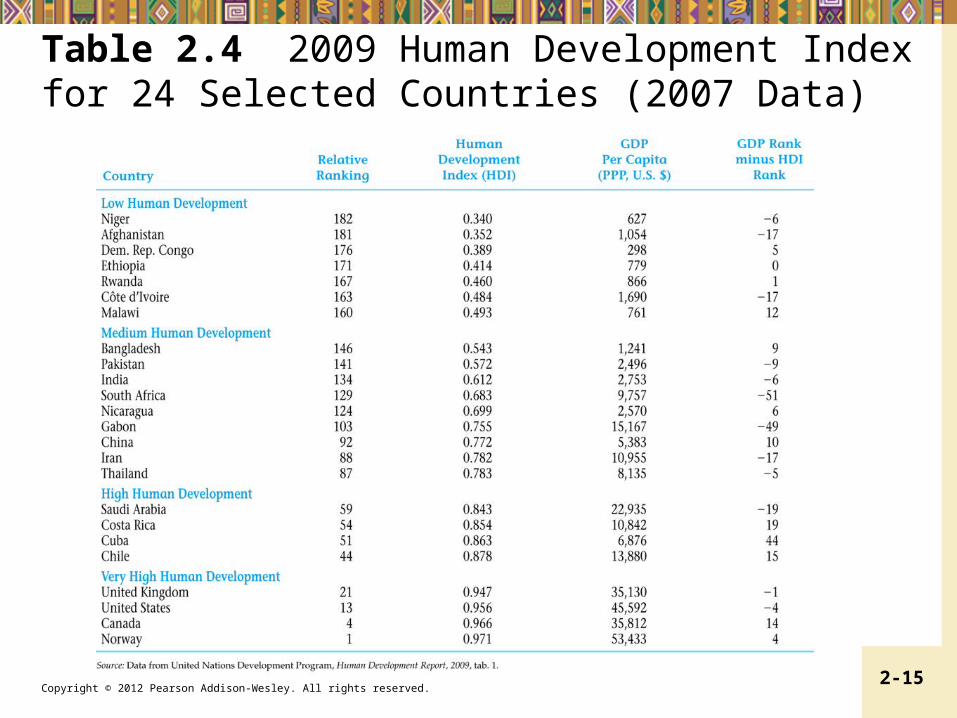
Table 2.4 2009 Human Development Index for 24 Selected Countries (2007 Data)
Copyright © 2012 Pearson Addison-Wesley. All rights reserved. 2-16
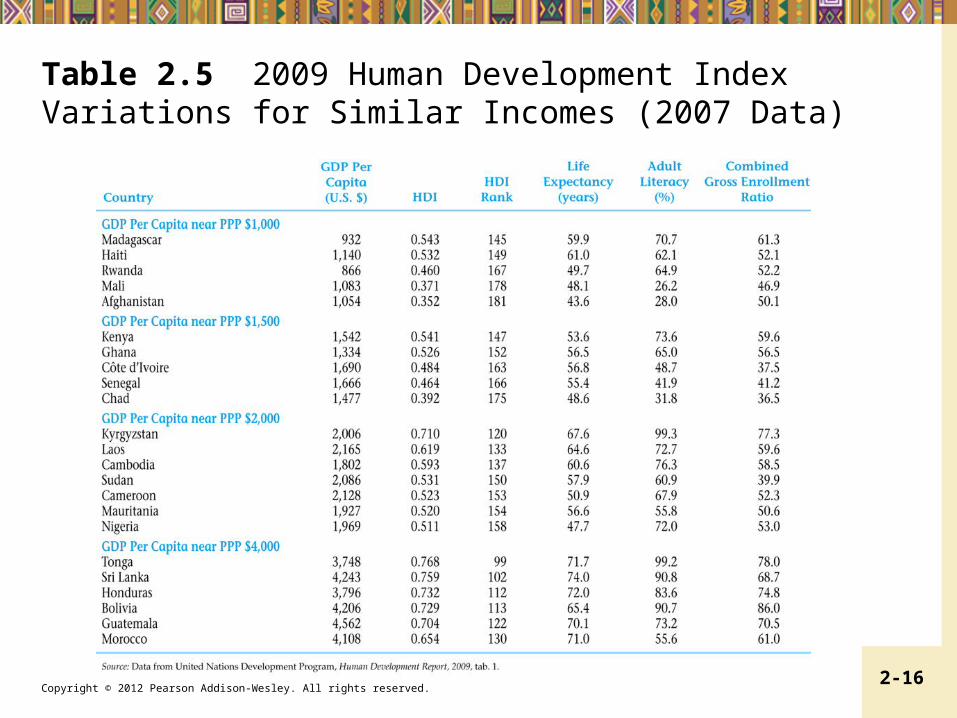
Table 2.5 2009 Human Development Index Variations for Similar Incomes (2007 Data)
Copyright © 2012 Pearson Addison-Wesley. All rights reserved. 2-17
2.3 Holistic Measures of Living Levels and Capabilities
• The New Human Development Index• Introduced by UNDP in November 2010
Copyright © 2012 Pearson Addison-Wesley. All rights reserved. 2-18
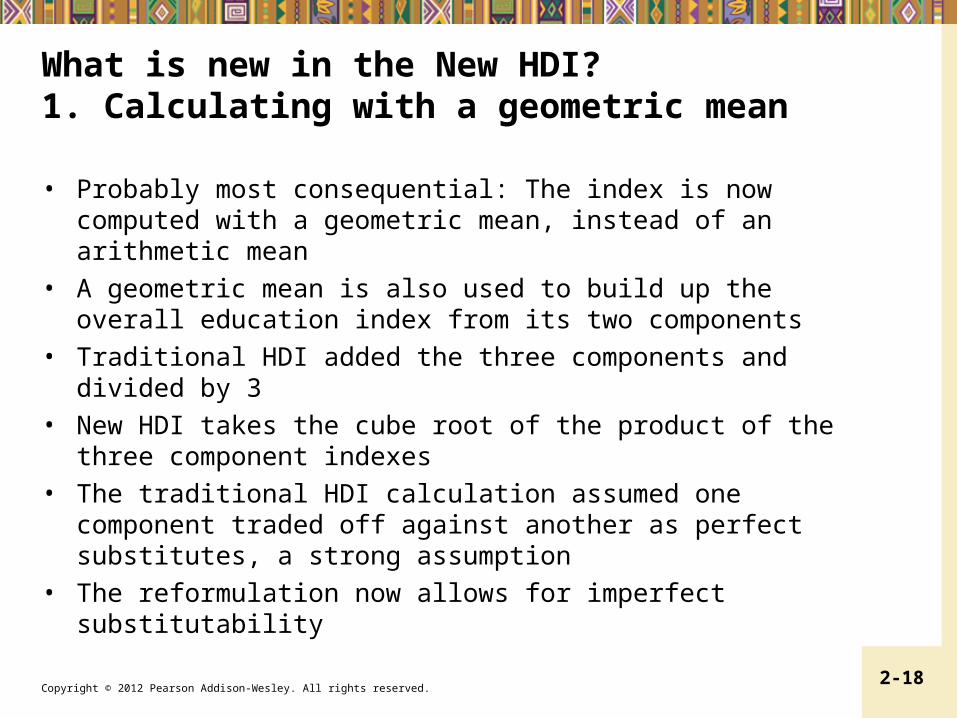
What is new in the New HDI? 1. Calculating with a geometric mean
• Probably most consequential: The index is now computed with a geometric mean, instead of an arithmetic mean
• A geometric mean is also used to build up the overall education index from its two components
• Traditional HDI added the three components and divided by 3
• New HDI takes the cube root of the product of the three component indexes
• The traditional HDI calculation assumed one component traded off against another as perfect substitutes, a strong assumption
• The reformulation now allows for imperfect substitutability

Copyright © 2012 Pearson Addison-Wesley. All rights reserved. 2-19
What is new in the New HDI? 2. Other key changes:
• Gross national income per capita replaces gross domestic product per capita
• Revised education components: now using the average actual educational attainment of the whole population, and the expected attainment of today’s children
• The maximum values in each dimension have been increased to the observed maximum rather than given a predefined cutoff
• The lower goalpost for income has been reduced due to new evidence on lower possible income levels
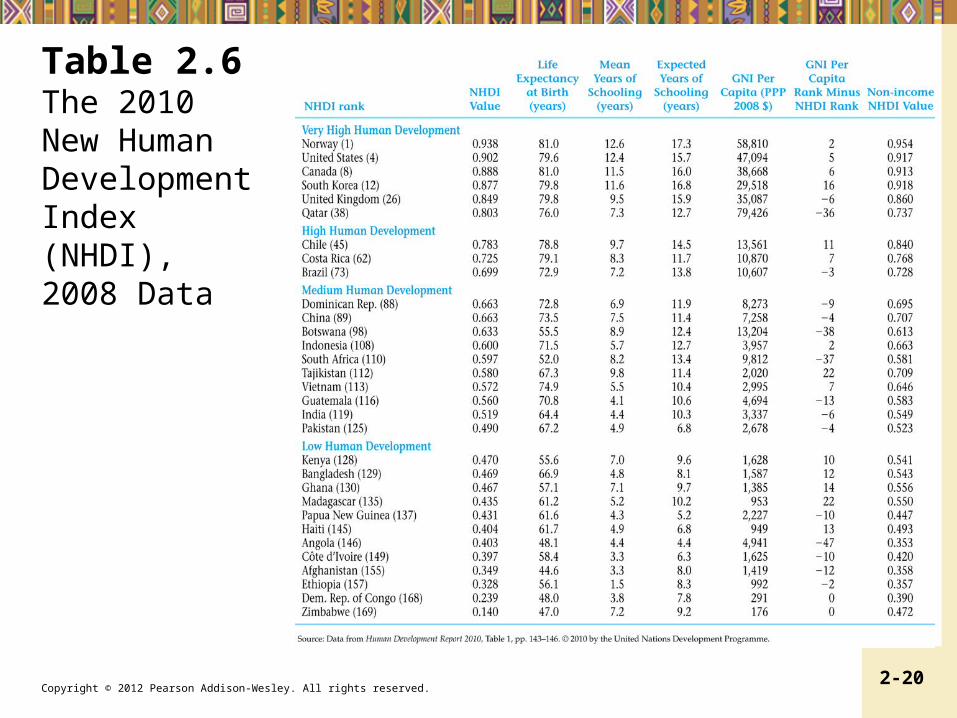
Copyright © 2012 Pearson Addison-Wesley. All rights reserved. 2-20
Table 2.6 The 2010 New Human Development Index (NHDI), 2008 Data

Copyright © 2012 Pearson Addison-Wesley. All rights reserved. 2-21
2.4 Characteristics of the Developing World: Diversity within Commonality
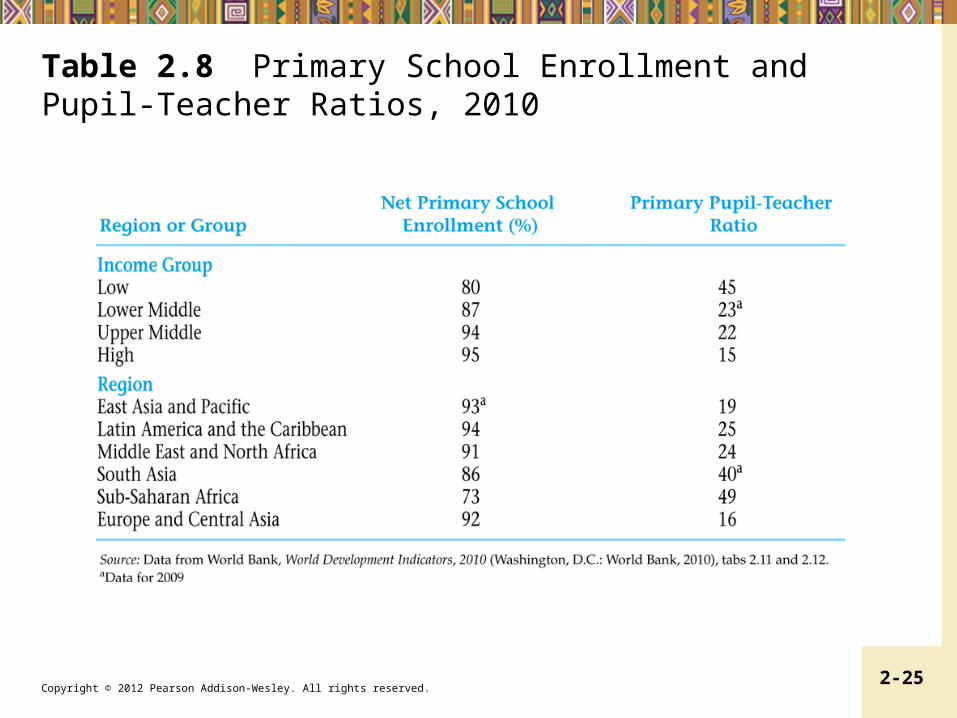
1. Lower levels of living and productivity2. Lower levels of human capital (health,
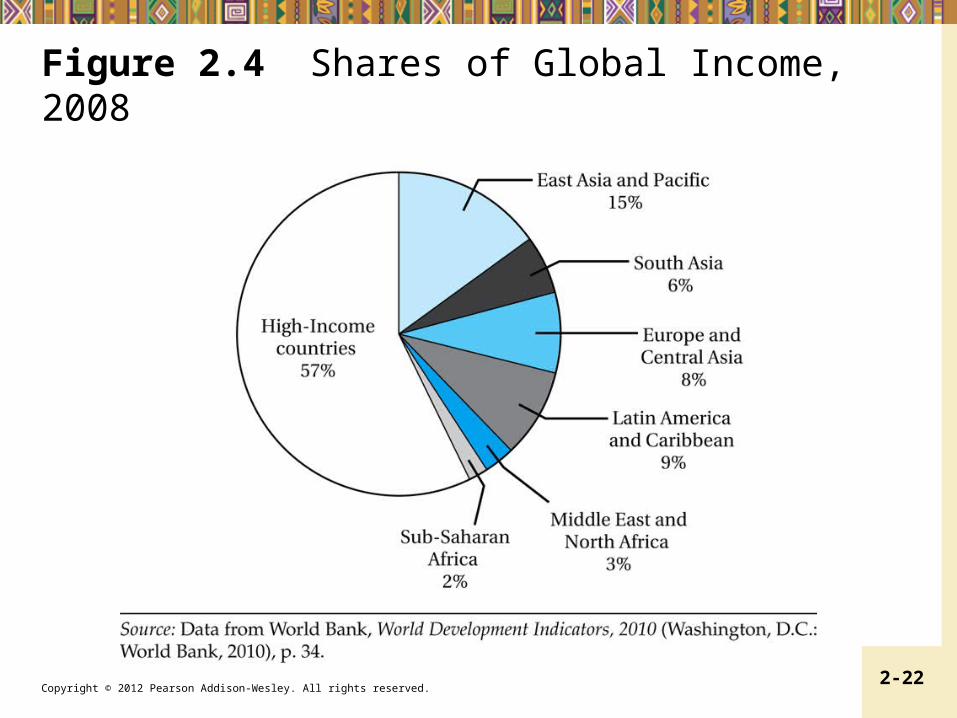
education, skills)3. Higher Levels of Inequality and Absolute
Poverty– Absolute Poverty– World Poverty
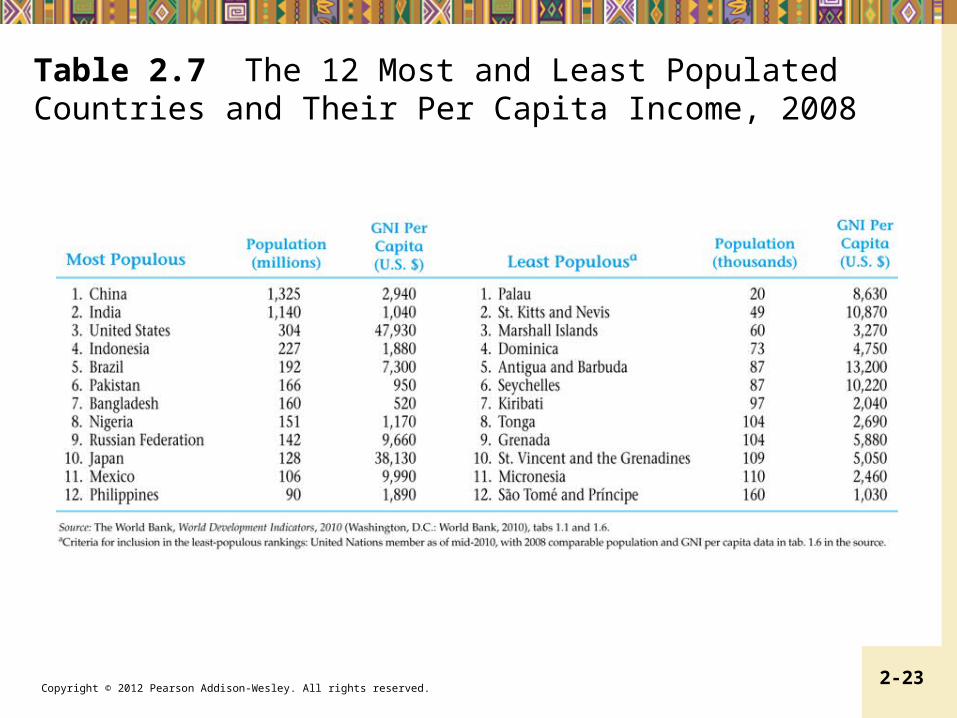
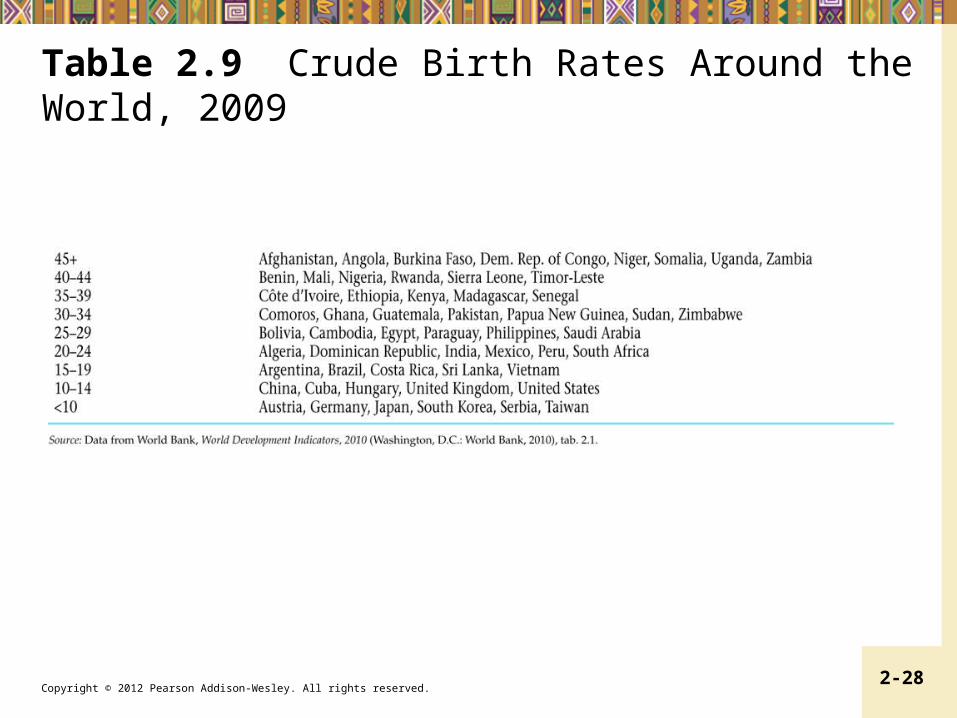
4. Higher Population Growth Rates– Crude Birth rates
Copyright © 2012 Pearson Addison-Wesley. All rights reserved. 2-22
Figure 2.4 Shares of Global Income, 2008
Copyright © 2012 Pearson Addison-Wesley. All rights reserved. 2-23
Table 2.7 The 12 Most and Least Populated Countries and Their Per Capita Income, 2008

Copyright © 2012 Pearson Addison-Wesley. All rights reserved. 2-24
Figure 2.5 Under-5 Mortality Rates, 1990 and 2005
Copyright © 2012 Pearson Addison-Wesley. All rights reserved. 2-25
Table 2.8 Primary School Enrollment and Pupil-Teacher Ratios, 2010

Copyright © 2012 Pearson Addison-Wesley. All rights reserved. 2-26
Figure 2.6 Correlation between Under-5 Mortality and Mother’s Education
Copyright © 2012 Pearson Addison-Wesley. All rights reserved. 2-27
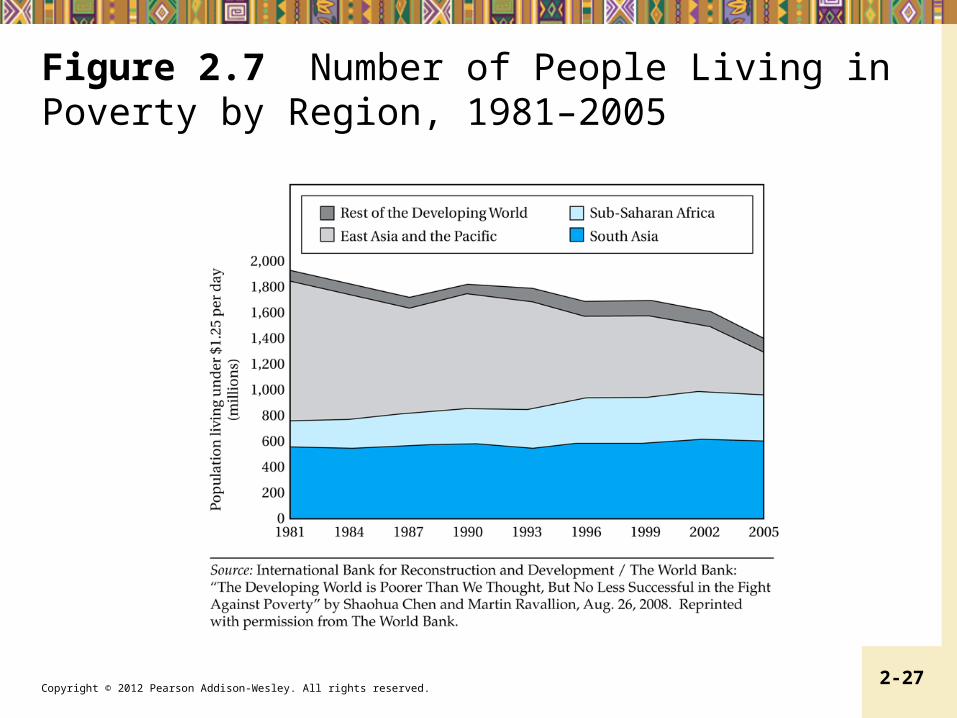
Figure 2.7 Number of People Living in Poverty by Region, 1981–2005
Copyright © 2012 Pearson Addison-Wesley. All rights reserved. 2-28
Table 2.9 Crude Birth Rates Around the World, 2009
Copyright © 2012 Pearson Addison-Wesley. All rights reserved. 2-29
2.4 Characteristics of the Developing World: Diversity within Commonality
5. Greater Social Fractionalization6. Larger Rural Populations but Rapid Rural-
to-Urban Migration7. Lower Levels of Industrialization and
Manufactured Exports8. Adverse Geography
– Resource endowments
Copyright © 2012 Pearson Addison-Wesley. All rights reserved. 2-30
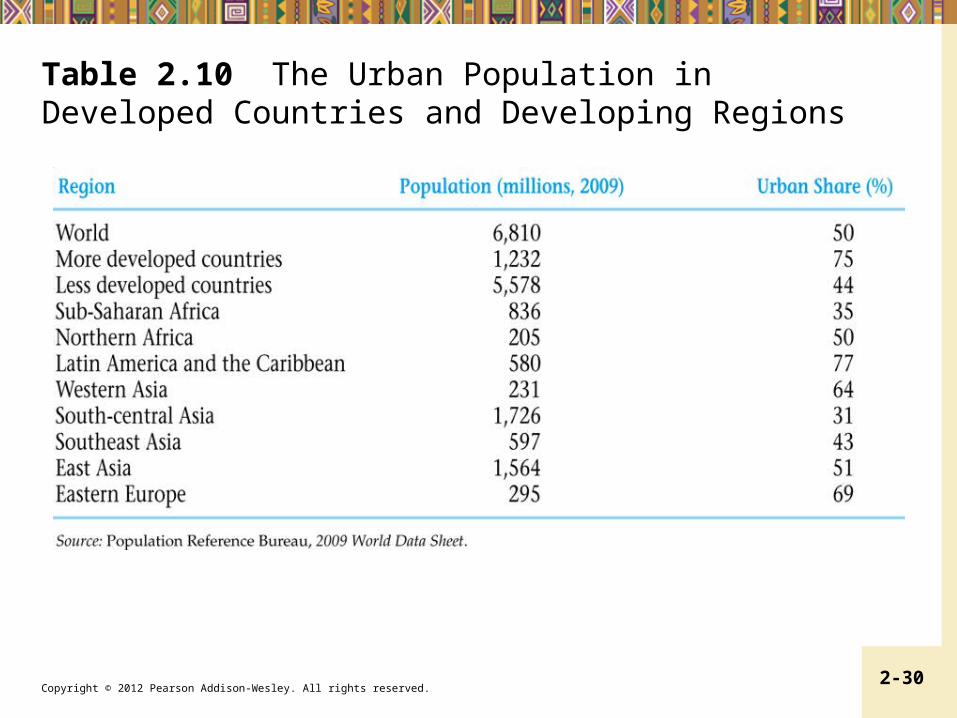
Table 2.10 The Urban Population in Developed Countries and Developing Regions

Copyright © 2012 Pearson Addison-Wesley. All rights reserved. 2-31
Table 2.11 Share of the Population Employed in the Industrial Sector in Selected Countries, 2004-2008 (%)

Copyright © 2012 Pearson Addison-Wesley. All rights reserved. 2-32
2.4 Characteristics of the Developing World: Diversity within Commonality
9. Underdeveloped Financial and Other markets
– Imperfect markets– Incomplete information
10. Colonial Legacy and External Dependence
– Institutions– Private property– Personal taxation– Taxes in cash rather than in kind

Copyright © 2012 Pearson Addison-Wesley. All rights reserved. 2-33
2.5 How Low-Income Countries Today Differ from Developed Countries in Their Earlier Stages
• Eight differences – Physical and human resource endowments– Per capita incomes and levels of GDP in relation to the
rest of the world– Climate– Population size, distribution, and growth– Historic role of international migration– International trade benefits– Basic scientific/technological research and development
capabilities– Efficacy of domestic institutions

Copyright © 2012 Pearson Addison-Wesley. All rights reserved. 2-34
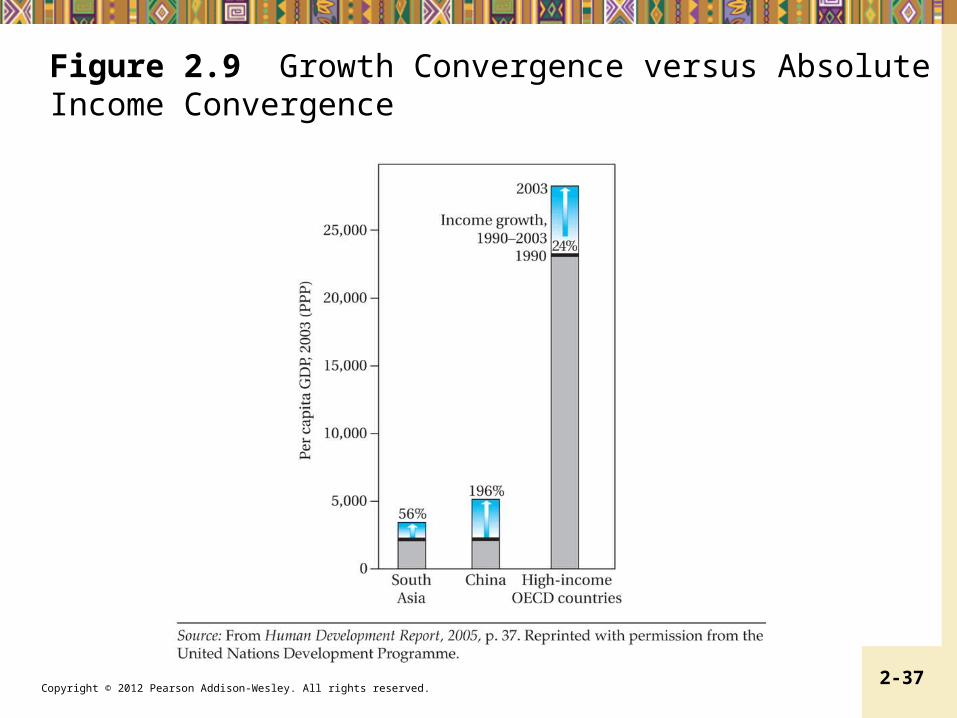
2.6 Are Living Standards of Developing and Devolved Nations Converging?
• Evidence of unconditional convergence is hard to find
• But there is increasing evidence of “per capita income convergence,” weighting changes in per capita income by population size

Copyright © 2012 Pearson Addison-Wesley. All rights reserved. 2-35
Figure 2.8 Relative Country Convergence: World, Developing Countries, and OECD

Copyright © 2012 Pearson Addison-Wesley. All rights reserved. 2-36
Figure 2.8 Relative Country Convergence: World, Developing Countries, and OECD (cont’d)
Copyright © 2012 Pearson Addison-Wesley. All rights reserved. 2-37
Figure 2.9 Growth Convergence versus Absolute Income Convergence

Copyright © 2012 Pearson Addison-Wesley. All rights reserved. 2-38
Figure 2.10 Country Size, Initial Income Level, and Economic Growth

Copyright © 2012 Pearson Addison-Wesley. All rights reserved. 2-39
2.7 Long-Run Causes of Comparative Development
• Schematic Representation– Geography– Institutional quality- colonial and post-colonial– Colonial legacy- pre colonial comparative
advantage– Evolution and timing of European development– Inequality- human capital – Type of colonial regime

Copyright © 2012 Pearson Addison-Wesley. All rights reserved. 2-40
Figure 2.11 Schematic Representation of Leading Theories of Comparative Development

Copyright © 2012 Pearson Addison-Wesley. All rights reserved. 2-41
Nature and Role of Economic Institutions
• Institutions provide “rules of the game” of economic life • Provide underpinning of a market economy• Include property rights; contract enforcement• Can work for improving coordination, • Restricting coercive, fraudulent and anti-competitive
behavior • Providing access to opportunities for the broad population-• Constraining the power of elites, and managing conflict • Provision of social insurance • Provision of predictable macroeconomic stability

Copyright © 2012 Pearson Addison-Wesley. All rights reserved. 2-42
Role of Institutions
• Acemoglu, Johnson, and Robinson’s “reversal of fortune” and extractive institutions
• Bannerjee and Iyer, “property rights institutions.” Landlords versus cultivators

Copyright © 2012 Pearson Addison-Wesley. All rights reserved. 2-43
Concepts for Review
• Absolute poverty• Brain drain• Capital stock• Convergence• Crude birth rate• Dependency burden• Depreciation (of the capital
stock)• Diminishing Marginal Utility• Divergence
• Economic Institutions• Fractionalization• Free trade• Gross domestic product
(GDP)• Gross national income
(GNI)• Human capital• Human Development Index
(HDI)

Copyright © 2012 Pearson Addison-Wesley. All rights reserved. 2-44
Concepts for Review (cont’d)
• Imperfect market• Incomplete information• Infrastructure• Least developed countries • Low-income countries
(LICs)• Middle-income countries• Newly industrializing
countries (NICs)
• Purchasing power parity (PPP)
• Research and development (R&D)
• Resource endowment• Terms of trade• Value added• World Bank