2 annual report 2009 - indiana · french lick resort ca ... it is patterned after the process used...
TRANSCRIPT

2 Annual Report 2009
THE INDIANA GAMING COMMISSION
Tim Murphy (Chairman) of Carmel is the retired Chief Financial Officer of the Irwin Mortgage Cor‐poration, formerly a subsidiary of the Irwin Financial Corporation. Prior to joining Irwin he was a Special Agent with the FBI, serving in the Indianapolis and Chicago field offices. Mr. Murphy graduated from Indiana University in 1973 with a degree in Accounting and is a Certified Public Accountant in the State of Indiana. Mr. Murphy was appointed to the Commission in December 2005.
Tom Swihart (Vice‐Chair) of Valparaiso is a Certified Public Accountant and has worked in the firm of Weichmann and Associates in Munster, Indiana for the past sixteen years. He graduated from Valparaiso University in 1968 with a degree in Business Administration. Mr. Swihart has also earned a Masters degree in Public Administration and Urban Planning from Pepperdine University and a MBA in Accounting and Tax from Fairleigh Dickinson University. Mr. Swihart was appointed to the Commission in July 2006.
Mary H. Shy of Lawrenceburg is the PMO/Quality Manager of Omnicare, which provides pharma‐ceutical services to long term health care centers. She retired from the information technology indus‐try with over twenty‐five years experience with Procter & Gamble and Hewlett‐Packard. She has extensive experience in global expansion, service management, and quality improvement. Ms. Shy graduated from the University of Cincinnati in 1977 with a degree in Marketing. Ms. Shy was appointed to the Commission in September 2007.
Robert Morgan of Schererville studied Labor/Management Relations at Confederation College in Thunder Bay, Canada. After college, Mr. Morgan worked for the Ontario Housing Corporation. In 1981, Mr. Morgan joined Thomas Equipment Ltd., a subsidiary of McCain Foods, Inc., in various regional management positions. In 1999, Mr. Morgan left McCain and founded his own business, Docu‐tech Services, Inc., which currently provides litigation support services to large law firms throughout the U.S. Mr. Morgan was appointed to the Commission in July 2008.
Marc D. Fine (Secretary) of Evansville is a founding partner of the law firm of Rudolph, Fine, Porter & Johnson, LLP. Mr. Fine graduated from Indiana University in 1981 with a degree in Finance, with distinction, and graduated from the University of Illinois College of Law in 1984. He was one of the founders of American Community Bancorp and the Bank of Evansville, where he is a member of the Board of Directors and also serves as the corporate Secretary. Mr. Fine was appointed to the Commission in October 2007.
Justin Christian of Indianapolis is the President/CEO of Bucher + Christian Consulting. Bucher + Christian is an Indianapolis‐headquartered, 600‐person, global business solutions firm. After Mr. Christian graduated from DePauw University, he spent three years as a systems analyst for Eli Lilly prior to founding Bucher + Christian. Mr. Christian currently serves on various boards including the Indianapolis Bond Bank, Greater Indianapolis Progress Committee, and Goodwill of Central Indi‐ana. Mr. Christian was appointed to the Commission in December 2008.
Annual Report 2009 3
FORMER COMMISSIONERS
2008 William Barrett (Chair) Tim Murphy Mary Shy James Cummings Jr. Tom Swihart Marc Fine 2007 William Barrett (Chair) Tim Murphy Donald Vowels James Cummings Jr. Tom Swihart Marc Fine 2006 Harold Calloway (Chair) Scott Newman (Chair) Bryan Robinson Donald Raymond Marya Rose Tim Fesko Tim Murphy William Barrett 2005 Harold Calloway (Chair) Bryan Robinson Donald Vowels Marya Rose Ann Marie Bochnowski Tim Fesko 2004 Donald Vowels (Chair) Ann Marie Bochnowski Thomas Milcarek Dale Gettelfinger Marya Rose Maurice Ndukwu Robert Barlow Norman Melhiser
2003 Donald Vowels (Chair) Ann Marie Bochnowski Thomas Milcarek Dale Gettelfinger Marya Rose Maurice Ndukwu David Ross 2002 Donald Vowels (Chair) Ann Marie Bochnowski Thomas Milcarek David Ross Richard Darko David Carlton Dale Gettelfinger 2001 Donald Vowels (Chair) Ann Marie Bochnowski David Carlton Richard Darko Thomas Milcarek David Ross Dale Gettelfinger 2000 Donald Vowels (Chair) Ann Marie Bochnowski David Carlton Richard Darko Thomas Milcarek David Ross Robert Swan 1999 Donald Vowels (Chair) Ann Marie Bochnowski Richard Darko Thomas Milcarek David Ross Robert Swan 1998 Donald Vowels (Chair) Ann Marie Bochnowski Richard Darko Thomas Milcarek David Ross Robert Sundwick Robert Swan
1997 Donald Vowels (Chair) Ann Marie Bochnowski Richard Darko David Ross Robert Sundwick Robert Swan 1996 Alan Klineman (Chair) Ann Marie Bochnowski Donald Vowels Thomas Milcarek David Ross Robert Sundwick Robert Swan 1995 Alan Klineman (Chair) Ann Marie Bochnowski Donald Vowels Thomas Milcarek David Ross Bob Sundwick 1994 Alan Klineman (Chair) Ann Marie Bochnowski Gilmore Hensley David Ross Robert Sundwick Donald Vowels 1993 Alan Klineman (Chair) Ann Marie Bochnowski Gilmore Hensley David Ross Robert Sundwick Donald Vowels Robert Gilmore

4 Annual Report 2009
Executive Director’s Report Tax and Revenue Overview Organizational Chart MBE/WBE Utilization Divisions
Audit Division
Compliance Division
Legal Division
Charity Gaming Division
Enforcement Division
Gaming Control Division
Information Technology Division
License Control Division
Background and Financial Investigations Division Indiana’s Casinos
Casino Map
Property Summaries
Gaming in Other States
Gaming Revenue Comparison
Other States
Appendix
5
9 12 14
16
17
21
25
27
29
30
31 32
33 34 47 48 54
CONTENTS

Annual Report 2009 5
EXECUTIVE DIRECTOR’S REPORT While the nation’s casinos continued to struggle in FY 2009 due to the recession and other factors, Indiana’s gaming revenues were buoyed as a result of capital investment by our licensees.
Economic Development Horseshoe Hammond opened a new $500 million facility in August. The new 350,000 square foot gaming vessel has 4,223 gaming positions, a 700‐seat buffet, and a 2,500‐seat multipurpose entertain‐ment facility.
In March, Indiana Live in Shelbyville opened its permanent casino, a $200 mil‐lion facility with 2,000 machines, includ‐ing electronic blackjack, roulette, and three‐card poker. The 233,000 square foot casino also features six dining and enter‐tainment venues.
In Lawrenceburg, the new $336 million Hollywood Casino opened in June, re‐placing the former Argosy property, in‐
cluding a name change and complete re‐branding. The new vessel has 150,000 of ca‐sino square footage, 4,400 gaming positions, and a 108‐seat restaurant.
In addition to new casinos, other major projects were also completed. Blue Chip opened its new $130 million, 22‐story hotel in January. The Spa Blu Tower has 302‐rooms, including sixty suites, and it is complemented by new dining and entertain‐ment venues, including the new Stardust Event Center, a 20,000 square‐foot, multi‐purpose entertainment venue that holds up to 1,200 guests. French Lick Resort Ca‐sino opened its new Pete Dye golf course in April and was selected to host the 43rd PGA Professional National Championship in 2010. The previously refurbished Don‐ald Ross course will also be used for this event. In addition, French Lick completed substantial renovations to its casino floor to accommodate non‐smoking patrons and continued to modify its exterior aesthetics.
Ernest E. Yelton Executive Director

6 Annual Report 2009
Legislation This year was an unusually busy legislative session for the Gaming Commission (“Commission”). During the regular session, there were two charity gaming bills that passed. The first, SEA 414, allows workers at a festival event to participate in events except in the one that he or she is conducting and prohibits workers from participating in any PPT event during the calendar day he or she conducts the event. The act also requires charity gaming patrons to provide their names, signatures, and dates of birth upon winning $250 or more on any PPT and allows qualified organizations to share reusable licensed supplies that were acquired prior to January 1, 2009. Finally, the act allows individuals to serve as operators for three qualified organizations per month rather than only one.
HEA 1286 removes civic organizations from the eligibility list for an annual char‐ity game night license, but added fraternal organizations. This act also allows qualified organizations which totally restructure to be eligible for licensure with‐out waiting five years and limits the use of facilities and locations for annual charity gaming nights to only three calendar days per week. The act also makes qualified and winner take all drawings eligible for roll‐overs under specific con‐ditions that do not increase the frequency of the drawing or the maximum limit of award. Lastly, driver’s license information acquired by the Commission is now deemed confidential. HEA 1285 authorizes the Commission to require identification of a trustee for each casino licensee to be poised to assume operational control of any casino that has a license revocation, a license non‐renewal or a failure to transfer the license in a block sale of other casinos. It is patterned after the process used in Evans‐ville by agreement between the Commission and Tropicana. HEA 1285 also clari‐fies that only one supplier license is required to conduct business with both casi‐nos and racinos and increased the annual supplier license fee from $5,000 to $7,500. Finally, it authorizes the Commission to issue occupational licenses for periods of one, two, or three years rather than only one and required the horse racing integrity fund assessed to the racinos to be paid directly to the Horse Rac‐ing Commission rather than the Gaming Commission.

Annual Report 2009 7
The last bill was SEA 160. In 2005, Governor Daniels’ Probe Report for Efficiency in Government recommended, among many other changes, the relocation of the Boxing Commission from the Professional Licensing Agency to the Commission. SEA 160 abolished the Boxing Commission and created the State Athletic Com‐mission which will license and regulate not only boxing but mixed martial arts. While the new commission is independent of the Gaming Commission, it will be staffed by existing agency personnel, with minimal new staff. The Athletic Com‐mission is funded by a new dedicated fund center consisting of license fees, pen‐alties, and a percentage of gate receipts. Because the legislature failed to pass a budget during the regular session, Gover‐nor Daniels called a special session in June. Inserted in the budget that ultimately passed and was signed by the governor were provisions related to a study com‐mittee for gaming‐related issues. The gaming study committee was charged with examination of seventeen topics. They are as follows:
1) Admission taxes for riverboats. 2) Competition from out of state gaming entities. 3) Waivers for gaming tournaments. 4) Land‐based gaming. 5) Non‐smoking accommodations. 6) Restrictions on alcohol prizes. 7) Authority to regulate type 2 gaming in for‐profit ventures. 8) A referendum concerning gaming in the city of Fort Wayne. 9) Competition from tribal‐operated casinos. 10)Issues related to the riverboat in French Lick, including modification of
trust payments, subsidies paid by other gaming facilities, and land based gaming.
11)The movement of riverboats in the city of Gary to new locations. 12)The need to retain United States Coast Guard compliant marine navigation
systems. 13)Whether permit holders holding a gambling license issued under IC 4‐35‐5
(racinos) are properly promoting and supporting horse racing activities at the site.
14)Issues related to permit holders holding a gambling game license issued under IC 4‐35‐5 (racinos) including table games, double taxation, amounts

8 Annual Report 2009
paid to horsemen’s associations, bonds, slot machines, and satellite locations. 15) Gaming license fees and suppliers’ license fees. 16) Parity of confidentiality rules for riverboat gaming licensees and permit holders holding a gambling game license issued under IC 4‐35‐5 (racinos). 17) Campaign contribution ban for riverboat gaming licensees.
I have been asked to serve as an ex officio member of this commission, whose work is scheduled to be completed prior to the beginning of the 2010 legislative session. Staff Update In the Controller Division, Drewella Anderson was hired as an Account Clerk. Darlene Johnson was hired as Receptionist and Patricia Poteet was hired as Clerical Assistant in Charity Gaming. In the Audit Division, Ellana Nelson and Anne Rady were hired as Field Auditors. Jeffrey Neuenschwander was hired as a Staff Attor‐ney in the Legal Division. Wade Lowhorn transferred from a Deputy Director po‐sition at the Indiana Professional Licensing to become the Director of the newly created State Athletic Commission. Julien Agnew was promoted to Director of License Control and Marian Coffey transferred from the Front Desk Receptionist to Secretary of Gaming Control Divi‐sion. In the Enforcement Division, Mark Mathews transferred from Supervisor to Investigator in the Central Region and Anthony Chapa was promoted from Agent at Ameristar to Supervisor at Grand Victoria. In addition, 15 Gaming Agents were hired to fill vacancies throughout the State. Every year presents new challenges for the Commission, and 2010 will not be an exception. It is anticipated that the Legislative Gaming Study Committee will pro‐pose several initiatives for the General Assembly to debate. Breathing life into the State Athletic Commission and creating mixed martial arts rules will demand con‐siderable effort while keeping an eye on gaming competition in Illinois, Ohio, Michigan, and Kentucky is in an of itself a full‐time job. I am confident that our professional, knowledgeable, and diligent staff will continue to rise to the occasion and serve the interests of the State of Indiana admirably. Respectfully Submitted,

Annual Report 2009 9
FY 2009 TAX OVERVIEW In FY 2009, gaming operations at Indiana casinos generated $796,795,855 in wagering tax and $78,883,872 in admission tax, for a total of $875,679,727.
FY 2009 Win Wagering Admission Total
Ameristar $289,739,288 $86,328,464 $9,815,766 $96,144,230
Belterra $156,980,465 $40,009,755 $5,509,296 $45,519,051
Blue Chip $186,075,228 $50,170,573 $7,243,152 $57,413,725
Aztar $115,273,602 $27,100,743 $3,917,706 $31,018,449
Grand Victoria $118,136,165 $27,902,651 $4,672,236 $32,574,887
Horseshoe $525,937,424 $169,558,651 $15,797,835 $185,356,486
Horseshoe Southern Indiana
$302,876,206 $91,208,373 $8,404,314 $99,612,687
Majestic Star I $119,870,564 $28,496,495 $4,262,532 $32,759,027
Majestic Star II $98,474,750 $22,118,181 $4,262,532 $26,380,713
French Lick $89,549,019 $19,390,156 $4,670,880 $24,061,036
Hoosier Park $202,201,775 $55,808,319 n/a $55,808,319
Indiana Live $188,827,529 $51,953,316 n/a $51,953,316
Totals $2,799,326,555 $796,795,855 $78,883,872 $875,679,727
Hollywood $405,384,540 $126,750,178 $10,327,623 $137,077,801

10 Annual Report 2009
FY 2009 TAX COMPARISON TO FY 2008
WAGERING TAX FY 2008 FY 2009 DIFFERENCE %
July 37,648,767 40,670,589 3,021,822 8.03%
August 45,674,857 51,603,612 5,928,755 12.98%
September 53,108,785 53,869,011 760,226 1.43%
October 53,105,332 60,356,464 7,251,132 13.65%
November 59,696,023 64,935,241 5,239,218 8.78%
December 63,112,706 62,589,241 (523,465) ‐0.83%
January 64,035,298 69,387,970 5,352,672 8.36%
February 68,741,815 76,361,986 7,620,171 11.09%
March 74,450,865 81,719,660 7,268,795 9.76%
April 72,335,660 79,737,714 7,402,055 10.23%
May 74,641,907 82,884,661 8,242,754 11.04%
June 72,371,392 72,679,706 308,314 0.43%
TOTAL $738,923,407 $796,795,855 $57,872,448 7.83%
ADMISSION TAX FY 2008 FY 2009 DIFFERENCE % July 7,797,306 6,818,158 (979,148) ‐12.56% August 7,283,224 7,217,407 (65,817) ‐0.90% September 6,971,287 6,152,216 (819,071) ‐11.75% October 6,649,684 6,385,975 (263,709) ‐3.97% November 6,243,003 6,203,302 (39,701) ‐0.64% December 6,112,348 5,820,303 (292,045) ‐4.78% January 6,091,069 6,155,248 64,179 1.05% February 6,399,157 6,652,478 253,321 3.96% March 6,820,270 7,193,670 373,400 5.47% April 6,514,106 6,796,498 282,392 4.34% May 6,870,695 7,013,732 143,037 2.08% June 6,300,632 6,474,885 174,253 2.77% TOTAL $80,052,781 $78,883,872 ($1,168,909) ‐1.46%

Annual Report 2009 11
Expenditures Commission Administration Salary & Wages $3,290,240 Other Operating & Encumbrances $ 748,641 Less Reimbursements $(746,033) Subtotal $3,292,848 Charity Gaming Enforcement Salary & Wages $2,538,645 Other Operating & Encumbrances $ 830,157 Subtotal $3,368,802 Net Total Expenditures $6,661,650 Expenditures and Reimbursements for Gaming Enforcement** Salary & Wages $11,519,342 Other Operating & Encumbrances $ 794,806 Total Expenditures/Encumbrances $12,314,148 *Does not include Charity Gaming Excise Tax of $1,401,380 collected by IDOR. **Fully reimbursed by the riverboat casinos and horse track facilities.
REVENUES & EXPENDITURES
Fees Occupational Licensing Applications $835,045 Permanent/Renewal $691,096 Other (replacement Badges) $ 0 Subtotal $1,526,141 Riverboat Licensing Applications $ 0 Permanent/Renewal $ 50,000 Other—License Transfer $ 0 Subtotal $ 50,000 Supplier Licensing Applications $ 20,000 Permanent/Renewal $155,000 Other‐ (Transfer) $ 0 $175,000 Charity Gaming* Licensing $4,778,831 Penalties/Misc. $ 79,870 Subtotal $4,858,701 Racinos County Slot Wagering Fee $ 11,494,992 Supplemental Fee $ 3,831,664 Initial License Fee $200,000,000 Subtotal $215,326,656 Total Fees $221,936,498 Fines Riverboats $690,488 Suppliers $ 1,500 Voluntary Self Exclusion $ 83,569 Total Fines $775,557

12 Annual Report 2009
ORGANIZATIONAL CHART

Annual Report 2009 13

14 Annual Report 2009
MBE/WBE UTILIZATION
The Riverboat Gambling Act and Indiana Code 4‐
35 contain provisions regarding the use of
minority business enterprises (“MBE”) and
women’s business enterprises (“WBE”) in the
casino industry. Only purchases made from a
certified MBE or WBE may be counted toward
credit for statutory compliance. The Department
of Administration’s Minority and Women’s
Business Enterprise Division is the agency
responsible for certification of MBEs and WBEs. The casinos are required to file both
quarterly reports and a report with the Commission in January of each year
containing a summary of expenditures made in the previous calendar year. Within
these reports, each casino details the amount of its overall expenditures paid to
certified MBEs and WBEs. The following page contains MBE and WBE utilization
information for CY 2008.
Jennifer Reske Deputy Director

Annual Report 2009 15
16 Annual Report 2009
AUDIT DIVISION
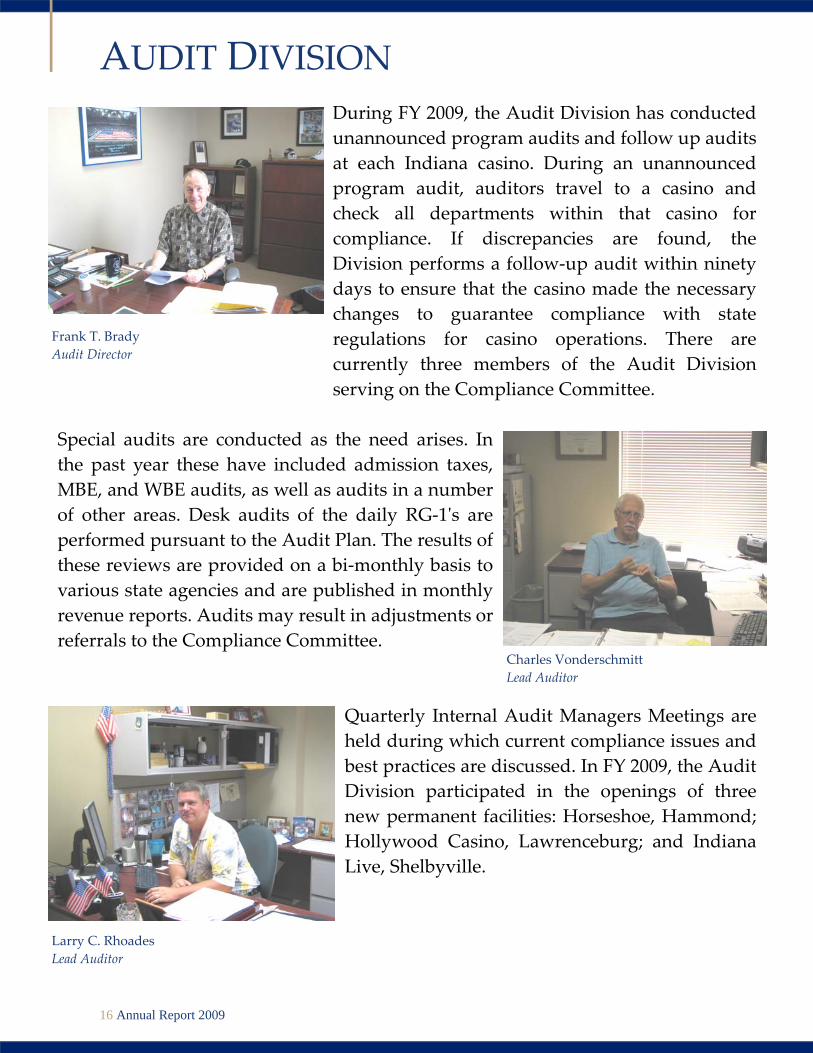
During FY 2009, the Audit Division has conducted unannounced program audits and follow up audits at each Indiana casino. During an unannounced program audit, auditors travel to a casino and check all departments within that casino for compliance. If discrepancies are found, the Division performs a follow‐up audit within ninety days to ensure that the casino made the necessary changes to guarantee compliance with state regulations for casino operations. There are currently three members of the Audit Division serving on the Compliance Committee.
Special audits are conducted as the need arises. In the past year these have included admission taxes, MBE, and WBE audits, as well as audits in a number of other areas. Desk audits of the daily RG‐1ʹs are performed pursuant to the Audit Plan. The results of these reviews are provided on a bi‐monthly basis to various state agencies and are published in monthly revenue reports. Audits may result in adjustments or referrals to the Compliance Committee.
Quarterly Internal Audit Managers Meetings are held during which current compliance issues and best practices are discussed. In FY 2009, the Audit Division participated in the openings of three new permanent facilities: Horseshoe, Hammond; Hollywood Casino, Lawrenceburg; and Indiana Live, Shelbyville.
Charles Vonderschmitt Lead Auditor
Frank T. Brady Audit Director
Larry C. Rhoades Lead Auditor

Annual Report 2009 17
COMPLIANCE DIVISION The Compliance Division is comprised of the Director of Compliance, the Assistant Director of Compliance, the Promotions/Compliance Coordinator, the Problem Gaming Coordinator and the Electronic Gaming Device (“EGD”) Manager. The Compliance Division is responsible for the regulation of promotions and tournaments, EGDs, table games, the Voluntary Exclusion Program, and patron complaints. The Director of Compliance heads the Compliance Committee.
The Compliance Committee contains members of the Compliance Division, as well as representatives from the Audit, Legal, and Enforcement Divisions. The Committee meets regularly with the goal of optimizing the efficiency and effectiveness of the regulatory process. During FY 2009, the Committee made recommendations on all pending regulatory waivers and violations. The Committee issued 150 recommendations on waiver requests and disciplinary actions against casino and supplier licensees. The Committee was also involved in recommendations on rule changes and policy directives. In FY 2009, there were nine table games submitted for approval. Two new games and seven variations or side bets to pre‐existing table games were reviewed and approved. There are currently two new table games pending review. In addition to the new table game approvals, numerous table games moves and shipments have been reviewed and approved.
Chris Gray Director of Compliance
Angela Bunton Assistant Director of Compliance

18 Annual Report 2009
Electronic Gaming Devices Fiscal Year 2009 marks the fourth year that the Compliance Division was responsible for oversight of the Electronic Gaming Device System (“EGDS”). The EGDS contains a catalogue of all gaming laboratory tested and approved hardware as well as associated software. Compliance staff also monitors and approves all movements, purchases, and sales of EGDS, ensuring that only authorized parties are involved in these processes.
The Compliance staff stays in frequent contact with EGD manufacturers and gaming laboratories to ensure that the Commission is abreast of the latest technologies in electronic gaming. Compliance’s communications with gaming laboratories, EGD departments at the properties, and the Enforcement Division, ensures that all EGDs are in compliance at Indiana’s properties.
Promotions In order to maintain the integrity of casino gaming in Indiana, all promotional activities conducted by casino licensees are subject to review by the Commission. All gaming related promotional activities, such as any tournaments involving EGDs or table games, must be approved by the Promotions/Compliance Coordinator. Any non‐gaming related promotional activities, such as concerts, giveaways, or parties, must be reviewed by the Promotions Coordinator.
In FY 2009, the Compliance staff received 1,206 submissions. Non‐Gaming Related (Reviewed) 901 Gaming Related (Approved) 299 Pending 3 Disapproved 3
George Carey Electronic Gaming Device Manager
Tracy Sanders Promotions/Compliance Coordinator

Annual Report 2009 19
Through the Voluntary Exclusion Program (“VEP”), individuals may voluntarily exclude themselves from Indiana casinos by requesting to enter the VEP. The primary goal of the VEP is to address problem gambling in Indiana, allowing those with such a problem to exclude themselves from all casinos within the State. The Commission has administered the VEP since
its inception in 2003. Individuals wishing to exclude themselves from Indiana casinos can do so in person at the Commission office in Indianapolis or at any Indiana casino. In order to qualify, the interested individual must fill out the “Request for Voluntary Exclusion” form in the presence of a gaming enforcement agent or a Commission staff member. The request form must be completed voluntarily, and may not be completed while under the influence of alcohol, controlled substance, or prescription medication. The individual may elect an exclusion period of one year, five years, or for life. The request form and the identity of the applicant remains confidential. It is the participant’s responsibility to avoid gambling. A person electing the one‐year or five‐year exclusion option may request to be removed from the program at the end of the exclusion period. Participants wishing to be removed must complete a removal form in the presence of a gaming agent or a Commission staff member. After Commission approval, the participant will be removed from the exclusion list. To date, 482 individuals have been removed from the voluntary exclusion list. During FY 2009, 651 new participants enrolled in the VEP and 176 participants chose to remove themselves from the program. This past year, the Commission amended the current VEP forms, including both the enrollment and removal applications.
Matthew Shouse VEP Coordinator
VOLUNTARY EXCLUSION PROGRAM

20 Annual Report 2009
54%46% Male
Female
3%
31%14%
15%
37%
Indiana
IllinoisKentucky
Ohio Other States
2%
10%
25%
30%
22%
11%
30 and under31 to 40
41 to 50
51 to 60
61 to 70
71 and above
There were 3,609 active members from twenty‐two different states in the Voluntary Exclusion Program as of June 30, 2009. The graphs below display the program partici‐pants, categorized by age, sex, home state, and length of exclusion.
VEP STATISTICS
Member Exclusion Length Summary Member Sex Summary
Member State Summary Member Age Summary
23%
41%36%
One Year
Five Years
Life
Annual Report 2009 21
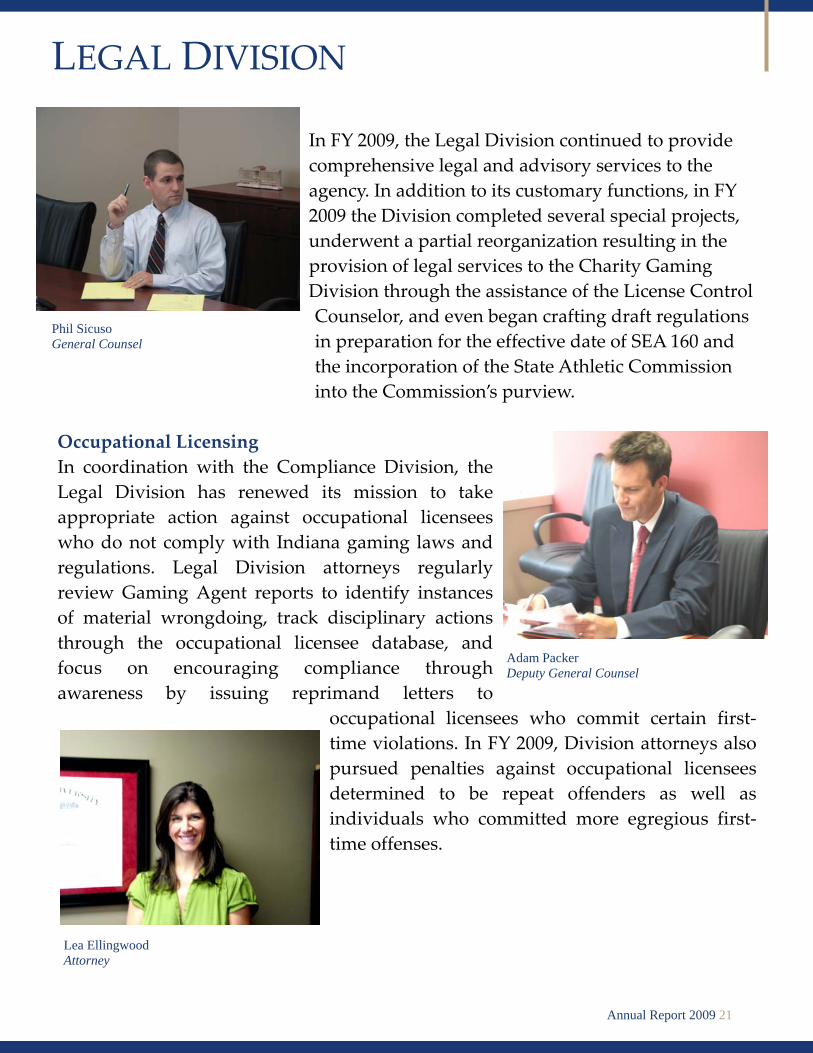
In FY 2009, the Legal Division continued to provide comprehensive legal and advisory services to the agency. In addition to its customary functions, in FY 2009 the Division completed several special projects, underwent a partial reorganization resulting in the provision of legal services to the Charity Gaming Division through the assistance of the License Control Counselor, and even began crafting draft regulations in preparation for the effective date of SEA 160 and the incorporation of the State Athletic Commission into the Commission’s purview.
Occupational Licensing In coordination with the Compliance Division, the Legal Division has renewed its mission to take appropriate action against occupational licensees who do not comply with Indiana gaming laws and regulations. Legal Division attorneys regularly review Gaming Agent reports to identify instances of material wrongdoing, track disciplinary actions through the occupational licensee database, and focus on encouraging compliance through awareness by issuing reprimand letters to
occupational licensees who commit certain first‐time violations. In FY 2009, Division attorneys also pursued penalties against occupational licensees determined to be repeat offenders as well as individuals who committed more egregious first‐time offenses.
LEGAL DIVISION
Phil Sicuso General Counsel
Adam Packer Deputy General Counsel
Lea Ellingwood Attorney

22 Annual Report 2009
FY 2009 Occupational Licensee Summary Temporary Licenses Issued: 5,366 Permanent Licenses Issued: 5,471 License Renewals: 11,155 Felony Denials: 19 Felony Waiver Applications: 2 Felony Waivers Granted: 0 Other Denials: 8 Ongoing Disciplinary Actions: 1 Closed Disciplinary Actions: 21 Settlements in Lieu of Discipline: 6 Licensee Reprimands: 21 Reinstatement of License: 4
Supplier Licensing The Legal Division is the initial contact for all prospective supplier licensees. If the Commission receives an inquiry about becoming a supplier licensee, the Division will determine whether a supplier license is necessary by analyzing the company and applicable gaming laws, regulations, and Commission policies. In FY 2009, the Legal Division created a supplier inquiry form to assist in processing and responding to licensure inquiries from companies wishing to do
business with Indiana casinos. The form is available on the Commission website (at http://www.in.gov/Commission/2619.htm), and it allows the Legal Division to make quicker and better informed decisions regarding whether Indiana law requires a company to acquire a supplier’s license. To date, the Commission has received twenty‐nine inquiries. Of those, the Legal Division determined that six would need to be licensed before they could sell their products and services to casinos.
Joseph Hoage Attorney
Jeff Neuenschwander Attorney

Annual Report 2009 23
FY 2009 Supplier Licensee Summary Permanent Supplier Licenses granted: 5 Renewal of Supplier Licenses granted: 23 Temporary Supplier Licenses issued: 4 Expired Supplier Licenses: 1 Administrative Rules The Legal Division continued to review the Commission’s regulations to reflect updated policies, new technologies, and changing industry standards. The Legal Division researched, drafted, and guided seven final rules through the
full promulgation process as well as three other rules through the emergency rule process during FY 2009. The rules included: an update of MBE and WBE standards; an overhaul of the exclusion process; junketeer certification procedures; standards for patron counting systems; charity gaming updates; a new civil fine system for regulatory violations; and other general language updates. Exclusion The exclusion list is comprised of individuals
who have been barred by the Commission from entering any Indiana casino as a result of their actions while at an Indiana gaming facility. The Legal Division conducts a regular review of all criminal case reports filed by gaming agents and takes administrative action to exclude individuals as deemed appropriate by the Executive Director. After placement on the exclusion list, an individual must wait three years before applying for removal. To date, the Commission has excluded 108 individuals for offenses ranging from cheating at a gambling game to theft from another patron. In FY 2009, the Commission added nine individuals to the exclusion list and granted one application for removal.
Kesha Rich Occupational Licensing Coordinator
Kyle Shapiro Secretary

24 Annual Report 2009
Public Records During FY 2009, the Division, primarily through the efforts of the Commission’s Information Analyst, received and responded to approximately forty public records
requests, resulting in about 3,500 pages of disclosed documents. The Information Analyst also researched and drafted several substantive updates to the Commission’s records retention schedule with plans to fully implement the changes in FY 2010. Junket Operators and Junketeers In FY 2009, the Commission created a pilot program for the certification of junket operators and junketeers. In addition to drafting forms and regulations regarding certification standards, the Legal Division administers the junket operator and
junketeer certification program on an ongoing basis. During the fiscal year, a total of eight junket operator and junketeer certifications were issued.
Andrew Means Information Analyst

Annual Report 2009 25
Indiana Code 4‐32.2 allows bona fide religious, educational, senior citizens, veterans, fraternal, civic organizations, hospitals, health facilities, psychiatric facilities, and political organizations to apply for qualification to conduct charitable gaming in Indiana. The Charity Gaming Division is responsible for the licensing and regulatory enforcement of charity gaming in Indiana. Its goal is to ensure compliance
with applicable statutes and regulations in a manner that promotes the integrity of charitable gaming in Indiana. The staff is dedicated to providing instruction and guidance to organizations so that they may utilize charitable gaming to meet their fundraising needs for the furtherance of their lawful purposes. During FY 2009, eight charitable gaming seminars were conducted to educate non‐profit organizations regarding legislative changes, regulation updates, financial reporting, qualification, and license requirements. Seminars were held in Indianapolis and attended by approximately 581 representatives either from qualified organizations or organizations seeking information about how to become qualified and conduct their allowable events. Currently, 3,032 organizations are qualified to conduct charity gaming in Indiana. Of that number, 227 organizations became qualified during FY 2009. The Division issued 3,189 gaming licenses, eighteen manufacturer and forty‐six distributor licenses during FY 2009. Three hundred‐fifty eight approval notices for non‐licensed events were issued for the same period.
CHARITY GAMING DIVISION
Diane Freeman Director of Charity Gaming
Larry Delaney Deputy Director of Charity Gaming

26 Annual Report 2009
The National Association of Fundraising Ticket Manufacturers has rated Indiana fifth out of all gaming states in gross income reported. Gross income reported by Indiana qualified organizations for FY 2009 was $542,954,567, with total prize payouts of $435,764,498. The field staff conducted 103 compliance investigations, eighty ‐seven pre ‐ l icense investigations, which are required when obtaining an annual bingo or annual charity game night license, and thirty‐nine site inspections. Based on the violations cited during these investigations and inspections, seven organizations were denied a license, fines were levied against nineteen organizations, five organizations owed additional license fees and one organization’s license was revoked. Disciplinary actions are pending as the administrative appeal process continues.

Annual Report 2009 27
There are 150 Gaming Enforcement Agents assigned to various casinos throughout the state of Indiana. Each casino is assigned ten Agents and one Supervisor. The Agency has five Enforcement Investigators, two assigned to northern Indiana, one assigned to southern Indiana, one assigned to central Indiana, and one assigned to southeast Indiana. Three Assistant Directors are each responsible for a designated area of the state. The primary responsibility of the enforcement agents is to ensure that casino gaming is conducted in strict compliance with the laws and regulations in Indiana.
In FY 2009, the Enforcement Division experienced another busy year with the opening of the permanent facility of Indiana Live!, and the opening of Hollywood Casino in Lawrenceburg, Indiana (formerly “Argosy”). During FY 2009, the Enforcement Division has been working to improve the Gaming Enforcement Academy. The balance between regulatory oversight and gaming and criminal investigations training has been paramount. First, during our academy classes an Enforcement Agent has been assigned to act as a liaison between the recruits and the Indiana Law Enforcement Academy staff. Second, as part of their training, agents are sent to a casino for a week to receive instruction from a Field Training Officer in table games and slot machines, as well as daily regulatory issues, gaming crimes, and criminal investigations. The Enforcement Division strives to give the recruits a better understanding of the responsibilities of an enforcement agent while they receive training at the Gaming Enforcement Academy.
ENFORCEMENT DIVISION
Kenny Rowan Director of Enforcement
Tom McCord Assistant Director– South Units
28 Annual Report 2009
The Enforcement Division has also conducted numerous regulatory and criminal investigations. In April, agents and investigators conducted an investigation of an alleged card‐marking team. The team used this method of cheating at twenty‐six casinos throughout the country, resulting in a loss of approximately $500,000 to the casinos. On April 25th agents at Majestic Star casino arrested three members of the alleged team. The investigation is ongoing.
Jim Regan Assistant Director– North Units
Brad McQuitty Assistant Director– Central/Southeast Units

Annual Report 2009 29
GAMING CONTROL DIVISION The Gaming Control Division conducted 160 investigations during FY 2009. The investigations led to the confiscation of 578 illegal gambling devices. Additionally, enforcement action was taken against six illegal poker establishments. Six bookmaking operations have also been raided, resulting in criminal charges filed and financial information turned over to the Internal Revenue Service, as well as the Indiana Department of Revenue. A total of 1,675 inspections were conducted at retail businesses to ensure that illegal gambling devices were not present. Prosecutors have successfully filed a forfeiture action on a box truck, a cargo trailer outfitted as a mobile casino, and more than $2000.00 in cash as a result of our investigations. The box truck is now being used by the Gaming Control Division to transport evidence and by the Indiana Department of Corrections for various tasks. Twenty‐six vending and amusement machine businesses have also been interviewed. Based on these interviews, the number of illegal gambling devices that have been removed by distributors is conservatively estimated at 3,289. Combining the number of illegal gambling devices seized by the Gaming Control Division and the conservative estimate of devices removed by distributors, a total of 4,648 are no longer operating in Indiana. The Gaming Control Division also worked with Indiana State Excise Police, Indiana State Police, and various local and sheriff police departments on thirteen different investigations. One investigation of particular interest was in Pulaski County. A Gaming Control Officer successfully assisted the sheriff’s department in a murder for hire case. The individual received a thirty year sentence. Additionally, as a result of these investigations, individuals have been charged with weapons violations, drug violations, and two have been arrested on outstanding warrants. The Division currently has thirty‐six active investigations.
Larry Rollins Gaming Control Director

30 Annual Report 2009
INFORMATION TECHNOLOGY DIVISION
In FY 2009, the Information Technology Division played a significant role in various Commission projects. The Division made several enhancements to the Occupational Licensing System to allow the system the flexibility to meet the needs of the Legal and Investigations Divisions.
The Division’s design and development of a new Charity Gaming Application had started in earnest. This new application will replace an older, outdated system that the Charity Gaming Division brought with them when they transferred to the Commission from the Department of Revenue. The Division also coordinated several network changes as a result of casinos moving into new structures. These moves also required changes to systems to accommodate casino name changes and the creation of new photo ID badges for
casino employees. The Division installed new software for the Gaming Control Division so that its officers now are able to issue citations directly from their laptop computers. Finally, with the assistance of central office staff, the Division conducted a study to determine document handling requirements. This study helped identify many processes that could be handled in an electronic method to eliminate the need to print documents.
Robert Paugh Application System Analyst/Programmer - Senior
Michael Stokes Application Developer—Senior
Tom S. Stuper Systems Administration Manager

Annual Report 2009 31
LICENSE CONTROL DIVISION
The primary purpose of the License Control Division is to conduct administrative enforcement actions against licensed entities engaged in unlawful gambling. In addition, the Division assists the Gaming Control Division in its mission to investigate suspected violations of the unlawful gambling laws by providing legal support, drafting search warrants, and helping to obtain subpoenas. The Division also works as a liaison with local county prosecutors to advocate the filing of criminal and civil charges when appropriate. During FY 2009, the Division drafted several search warrants which have been successfully executed and have resulted in the confiscation of numerous illegal gambling devices and proceeds of illegal gambling activity. The Division also consulted with many of the State’s elected prosecuting attorneys in furtherance of the filing of criminal charges for violations of Indiana’s gambling laws, which has resulted in numerous misdemeanor and felony criminal charges being filed in appropriate circumstances.
Julien Agnew Director of License Control

32 Annual Report 2009
In FY 2009, the Background and Financial Investigations Divisions stayed busy with the submission of applications for ten new suppliers to Indiana Casinos. These companies provide a variety of goods and services, from slot machines to currency counters and surveillance equipment to electronic poker tables. Pursuant to IC 4‐33‐7‐8, the holder of an Indiana supplier’s license must submit to a complete re‐investigation every three years to remain in compliance with Indiana law. During FY 2009, ten of Indiana’s thirty‐five supplier licensees were required to submit to a re‐investigation, which included over seventy individual key person investigations. In FY 2009, the Divisions completed a total of 191 Level 1 investigations associated with casinos, suppliers, and corporate investigations. The Divisions completed 2,744 Level 2 and 3,027 Level 3 investigations of those individuals employed at casino property. These numbers increased with the opening of larger facilities at Horseshoe Hammond and Hollywood Casino. The Commission receives reimbursement from applicants for hours spent working on their investigations. In FY 2009, a total of 13,298 hours were logged. Keeping with efficiency standards, the Divisions maintained a billable rate of 69.1%.
BACKGROUND AND FINANCIAL INVESTIGATIONS
Garth Brown Director of Background Investigations

Annual Report 2009 33
INDIANA CASINO LOCATIONS

34 Annual Report 2009
‐
1,000,000
2,000,000
3,000,000
4,000,000
5,000,000
6,000,000
7,000,000
1997 1998 1999 2000 2001 2002 2003 2004 2005 2006 2007 2008 2009
$0
$50,000,000
$100,000,000
$150,000,000
$200,000,000
$250,000,000
$300,000,000
$350,000,000
1997 1998 1999 2000 2001 2002 2003 2004 2005 2006 2007 2008 2009
Matt Schuffert General Manager 777 Ameristar Drive East Chicago, IN 46312 (877) 496-1777 Date Opened: April 18, 1997 Gaming Space: 53,492 sq. ft. Electronic Gaming Devices: 1,926 Table Game Positions: 383 Restaurants: 5 Hotel: 290 Rooms Admissions: 3,271,922 Total Taxes: $45,519,051 Local Economic Impact: $10,996,930 Total Employment: 1,381 Minority Employment: 65.53% County Employment: 76.76% Indiana Employment: 85.73%
Yearly Win Since Inception
Yearly Turnstile Admissions Since Inception
AMERISTAR CASINO

Annual Report 2009 35
$0
$20,000,000
$40,000,000
$60,000,000
$80,000,000
$100,000,000
$120,000,000
$140,000,000
$160,000,000
$180,000,000
$200,000,000
2001 2002 2003 2004 2005 2006 2007 2008 2009
‐
500,000
1,000,000
1,500,000
2,000,000
2,500,000
3,000,000
2001 2002 2003 2004 2005 2006 2007 2008 2009
BELTERRA CASINO Kevin Kaufman General Manager 777 Belterra Drive Bellterra, IN 47020 (888) 235-8377 Date Opened: October 27, 2000 Gaming Space: 40,200 sq. ft. Electronic Gaming Devices: 1,557 Table Game Positions: 417 Restaurants: 7 Hotel: 608 Rooms 18-Hole Championship Golf Course Convention Center Admissions: 1,836,432 Total Taxes: $96,144,230 Local Economic Impact: $1,840,015 Total Employment: 1,140 Minority Employment: 5% County Employment: 42% Indiana Employment: 65%
Yearly Turnstile Admissions Since Inception
Yearly Win Since Inception

36 Annual Report 2009
-
500,000
1,000,000
1,500,000
2,000,000
2,500,000
3,000,000
3,500,000
4,000,000
4,500,000
1998 1999 2000 2001 2002 2003 2004 2005 2006 2007 2008 2009
$‐
$50,000,000
$100,000,000
$150,000,000
$200,000,000
$250,000,000
$300,000,000
$350,000,000
1998 1999 2000 2001 2002 2003 2004 2005 2006 2007 2008 2009
BLUE CHIP Ted Bogich General Manager 2 Easy Street Michigan City, Indiana 46360 (888) 624-9618 Date Opened: August 22, 1997 Gaming Space: 65,000 sq. ft. Electronic Gaming Devices: 1,940 Table Game Positions: 450 Restaurants: 3 Hotel: 184 Rooms Convention Center Admissions: 2,414,384 Total Taxes: $57,413,725 Local Economic Impact: $3,045,018 Total Employment: 1,224 Minority Employment: 23.7% County Employment: 57.8% Indiana Employment: 93.6% Capital Improvement Summary: In January 2009, Blue Chip Casino opened a new $130 million hotel.
Yearly Win Since Inception
Yearly Turnstile Admissions Since Inception

Annual Report 2009 37
‐
500,000
1,000,000
1,500,000
2,000,000
2,500,000
3,000,000
19 9 6 199 7 199 8 19 99 2 00 0 2 0 01 2 00 2 2 00 3 20 04 20 0 5 20 06 2 00 7 2 00 8 20 0 9
$0
$20,000,000
$40,000,000
$60,000,000
$80,000,000
$100,000,000
$120,000,000
$140,000,000
1996 1997 1998 1999 2000 2001 2002 2003 2004 2005 2006 2007 2008 2009
CASINO AZTAR Tom Dingman General Manager 421 NW Riverside Drive Evansville, IN 47708 (800) 342-5386 Date Opened: December 8, 1995 Gaming Space: 38,360 sq. ft. Electronic Gaming Devices: 1,031 Table Game Positions: 312 Restaurants: 5 Hotel: 251 Rooms Conference Center Admissions: 1,305,902 Total Taxes: $31,018,449 Local Economic Impact: $4,016,735 Total Employment: 973 Minority Employment: 17.16% County Employment: 76.46% Indiana Employment: 90.44%
Yearly Win Since Inception
Yearly Turnstile Admissions Since Inception
38 Annual Report 2009
-
200,000400,000
600,000800,000
1,000,000
1,200,0001,400,000
1,600,000
2007 2008 2009
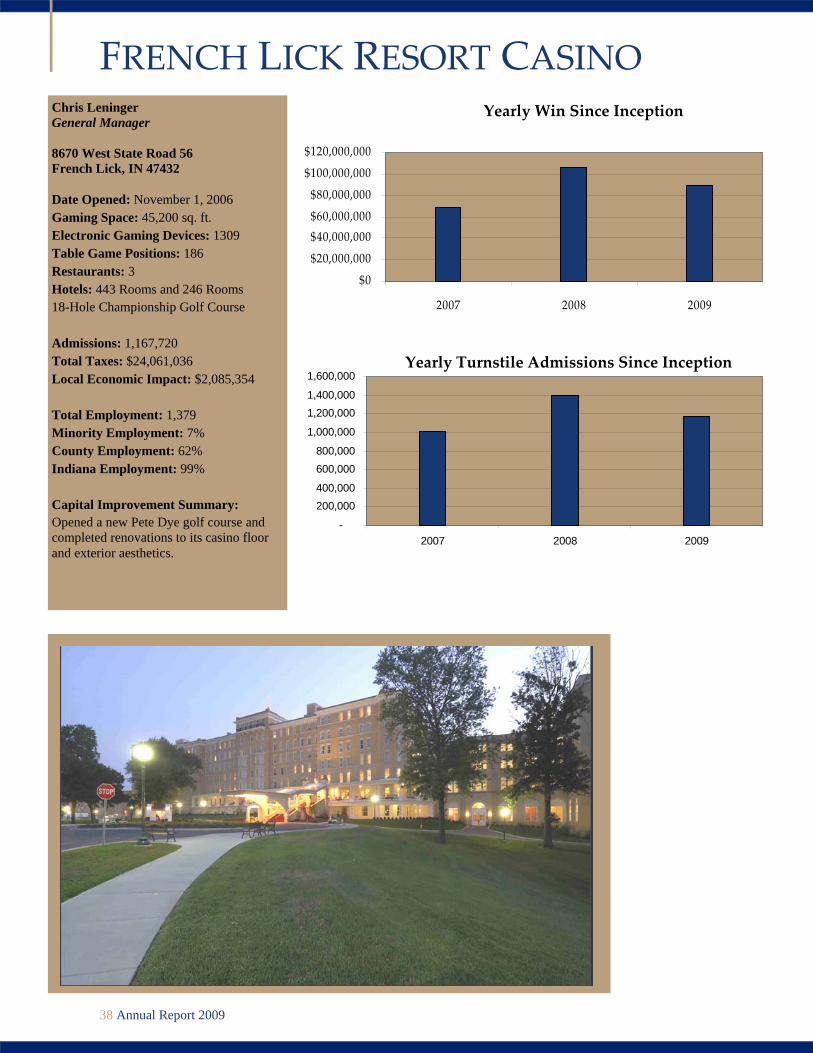
Yearly Win Since Inception
FRENCH LICK RESORT CASINO Chris Leninger General Manager 8670 West State Road 56 French Lick, IN 47432 Date Opened: November 1, 2006 Gaming Space: 45,200 sq. ft. Electronic Gaming Devices: 1309 Table Game Positions: 186 Restaurants: 3 Hotels: 443 Rooms and 246 Rooms 18-Hole Championship Golf Course Admissions: 1,167,720 Total Taxes: $24,061,036 Local Economic Impact: $2,085,354 Total Employment: 1,379 Minority Employment: 7% County Employment: 62% Indiana Employment: 99% Capital Improvement Summary: Opened a new Pete Dye golf course and completed renovations to its casino floor and exterior aesthetics.
Yearly Turnstile Admissions Since Inception
$0
$20,000,000
$40,000,000$60,000,000
$80,000,000
$100,000,000
$120,000,000
2007 2008 2009

Annual Report 2009 39
‐
500,000
1,000,000
1,500,000
2,000,000
2,500,000
3,000,000
3,500,000
4,000,000
1997 1998 1999 2000 2001 2002 2003 2004 2005 2006 2007 2008 2009
$0
$20,000,000
$40,000,000
$60,000,000
$80,000,000
$100,000,000
$120,000,000
$140,000,000
$160,000,000
$180,000,000
1997 1998 1999 2000 2001 2002 2003 2004 2005 2006 2007 2008 2009
GRAND VICTORIA CASINO Steve Jimenez General Manager 600 Grand Victoria Drive Rising Sun, IN 47040 (800) 472-6311 Date Opened: October 4, 1996 Gaming Space: 40,000 sq. ft. Electronic Gaming Devices: 1410 Table Game Positions: 251 Restaurants: 6 Hotels: 201 Rooms 18-Hole Championship Golf Course Admissions: 1,557,412 Total Taxes: $32,574,887 Local Economic Impact:: $1,829,168 Total Employment: 797 Minority Employment: 5% County Employment: 30% Indiana Employment: 84% Capital Improvement Summary: Constructed the Tiki Deck and Bar. The Tiki Deck provides for Indiana’s first out-door gaming environment featuring six slot machines and three blackjack tables.
Yearly Win Since Inception
Yearly Turnstile Admissions Since Inception

40 Annual Report 2009
‐
1,000,000
2,000,000
3,000,000
4,000,000
5,000,000
6,000,000
7,000,000
8,000,000
1997 1998 1999 2000 2001 2002 2003 2004 2005 2006 2007 2008 2009
$ 0
$ 100,000,000
$ 200,000,000
$ 300,000,000
$ 400,000,000
$ 500,000,000
$ 600,000,000
1997 1998 1999 2000 2001 2002 2003 2004 2005 2006 2007 2008 2009
HOLLYWOOD CASINO Anthony Rodio General Manager 777 Hollywood Boulevard Lawrenceburg, IN 47025 (888) 274-6797 Date Opened: December 13, 1996 Gaming Space: 150,000 sq. ft. Electronic Gaming Devices: 3216 Table Game Positions: 1064 Restaurants: 6 Hotels: 300 Banquet and Meeting Facilities Admissions: 3,442,541 Total Taxes: $137,077,801 Local Economic Impact: $40,025,659 Total Employment: 1,931 Minority Employment: 8.3% County Employment: 41.1% Indiana Employment: 56.2% Capital Improvement Summary: Opened a new $335 million facility replacing the Argosy Casino.
Yearly Win Since Inception
Yearly Turnstile Admissions Since Inception

Annual Report 2009 41
$0
$50,000,000
$100,000,000
$150,000,000
$200,000,000
$250,000,000
2008 2009
HOOSIER PARK CASINO Jim Brown General Manager 4500 Dan Patch Circle Anderson, IN 46013 (800) 526-7223 Date Opened: May 29, 2008 Gaming Space: 54,000 sq. ft. Electronic Gaming Devices: 2,000 Table Game Positions: N/A Restaurants: 1 Banquet and Meeting Facilities Admissions: N/A Total Taxes: $55,808,318 Local Economic Impact: N/A Total Employment: 781 Minority Employment: 16% County Employment: 71% Indiana Employment: 98% Capital Improvement Summary: Opened two new restaurants, Naked Tchopstix and Homestretch Steakhouse, an e-Poker room, and two performance ven-ues, a casino floor stage and the Terrace Showroom.
Yearly Win Since Inception

42 Annual Report 2009
‐
1,000,000
2,000,000
3,000,000
4,000,000
5,000,000
6,000,000
7,000,000
1996 1997 1998 1999 2000 2001 2002 2003 2004 2005 2006 2007 2008 2009
$0
$100,000,000
$200,000,000
$300,000,000
$400,000,000
$500,000,000
$600,000,000
1996 1997 1998 1999 2000 2001 2002 2003 2004 2005 2006 2007 2008 2009
HORSESHOE CASINO HAMMOND Rick Mazer General Manager 777 Casino Center Drive Hammond, IN 46320 (866) 711-7463 Date Opened: June 29, 1996 Gaming Space: 108,000 sq. ft. Electronic Gaming Devices: 3,229 Table Game Positions: 1010 Restaurants: 5 Banquet and Meeting Facilities Admissions: 5,265,945 Total Taxes:$185,356,486 Local Economic Impact: $27,579,863 Total Employment: 2,463 Minority Employment: 58.6% County Employment: 62.5% Indiana Employment: 68% Capital Improvement Summary: In August 2008, Horseshoe Casino unveiled a $500 million expansion.
Yearly Win Since Inception
Yearly Turnstile Admissions Since Inception

Annual Report 2009 43
-
1,000,000
2,000,000
3,000,000
4,000,000
5,000,000
6,000,000
7,000,000
1999 2000 2001 2002 2003 2004 2005 2006 2007 2008 2009
$0
$50,000,000
$100,000,000
$150,000,000
$200,000,000
$250,000,000
$300,000,000
$350,000,000
$400,000,000
1999 2000 2001 2002 2003 2004 2005 2006 2007 2008 2009
HORSESHOE SOUTHERN INDIANA Rick Mazer General Manager 11999Casino Center Drive, S.E. Elizabeth, IN 47117 (888) 766-2648 Date Opened: November 20, 1998 Gaming Space: 86,600 sq. ft. Electronic Gaming Devices: 1,974 Table Game Positions: 660 Restaurants: 8 18-Hole Championship Golf Course Conference Center Admissions: 2,801,438 Total Taxes: $99,612,687 Local Economic Impact: $16,652,382 Total Employment: 1,756 Minority Employment: 15% County Employment: 23% Indiana Employment: 69%
Yearly Win Since Inception
Yearly Turnstile Admissions Since Inception

44 Annual Report 2009
$0
$20,000,000
$40,000,000
$60,000,000
$80,000,000
$100,000,000
$120,000,000
$140,000,000
$160,000,000
$180,000,000
$200,000,000
2008 2009
INDIANA LIVE CASINO Richard Kline General Manager 4200 North Michigan Road Shelbyville, IN 46176 (877) 386-4463 Date Opened: June 6, 2008 Gaming Space: 75,000 sq. ft. Electronic Gaming Devices: 1,998 Table Game Positions: N/A Restaurants: 1 Banquet and Meeting Space Admissions: N/A Total Taxes: $51,953,316 Local Economic Impact: N/A Total Employment: 905 Minority Employment: 9.05% County Employment: 40.99% Indiana Employment: 99.55% Capital Improvement Summary: Opened a $200 million permanent casino on June 6, 2008.
Yearly Win Since Inception

Annual Report 2009 45
‐
500,000
1,000,000
1,500,000
2,000,000
2,500,000
3,000,000
3,500,000
1996 1997 1998 1999 2000 2001 2002 2003 2004 2005 2006 2007 2008 2009
$0
$20,000,000
$40,000,000
$60,000,000
$80,000,000
$100,000,000
$120,000,000
$140,000,000
$160,000,000
1996 1997 1998 1999 2000 2001 2002 2003 2004 2005 2006 2007 2008 2009
MAJESTIC STAR CASINO I Larry Buck General Manager One Buffington Harbor Drive Gary, IN 47406 (888) 225-8259 Date Opened: June 11, 1996 Gaming Space: 43,000 sq. ft. Electronic Gaming Devices: 1,027 Table Game Positions: 471 Restaurants: 4 Admissions: 1,420,844 Total Taxes: $32,759,027 Local Economic Impact: $3,684,132 Total Employment: 964 Minority Employment: 74% County Employment: 78% Indiana Employment: 87% Capital Improvement Summary: Majestic Star Casino is in the process of investing almost $10 million to renovate and update the facilities and equipment in the casinos and land-based facilities.
Yearly Win Since Inception
Yearly Turnstile Admissions Since Inception

46 Annual Report 2009
‐500,000
1,000,0001,500,0002,000,000
2,500,0003,000,0003,500,0004,000,0004,500,000
1996 1997 1998 1999 2000 2001 2002 2003 2004 2005 2006 2007 2008 2009
$0
$20,000,000
$40,000,000
$60,000,000
$80,000,000
$100,000,000
$120,000,000
$140,000,000
$160,000,000
1996 1997 1998 1999 2000 2001 2002 2003 2004 2005 2006 2007 2008 2009
MAJESTIC STAR CASINO II Larry Buck General Manager One Buffington Harbor Drive Gary, IN 47406 (888) 225-8259 Date Opened: June 11, 1996 Gaming Space: 40,261 sq. ft. Electronic Gaming Devices: 1,154 Table Game Positions: 296 Restaurants: 1 Hotel: 300 Rooms Admissions: 1,420,844 Total Taxes: $26,380,713 Local Economic Impact: $2,982,365 Total Employment: 417 Minority Employment: 74% County Employment: 80% Indiana Employment: 89% Capital Improvement Summary: (See page 45)
Yearly Win Since Inception
Yearly Turnstile Admissions Since Inception

Annual Report 2009 47
AGR
Gaming Space (Square Footage)
Admissions Casinos
Nevada $10,786,629,677 unavailable unavailable unavailable
New Jersey $4,152,178,994 unavailable unavailable 11
Louisiana $3,214,147,113 415,000 35,237,921 14
Indiana* $2,663,955,493 573,492 27,537,337 13
Mississippi $2,584,890,618 402,838 35,502,745 14
Pennsylvania $1,754,002,790 489,332 unavailable 7
Missouri $1,703,637,656 774,800 52,335,276 12
Illinois $1,474,460,000 297,535 14,262,077 9
Iowa $1,412,817,242 402,838 22,955,618 14
2009 GAMING REVENUE COMPARISON These charts, along with the following pages, summarize the status of gaming in other similarly situated states.
Total Taxes Admission Tax Wagering Tax Highest Marginal
Pennsylvania $964,701,535 None Flat 45%
Indiana* $875,679,727 $3 or $4 Graduated 40%
Nevada $665,443,319 None Graduated 6.75%
Illinois $532,147,000 Graduated, $2‐$3 Graduated 50%
Missouri $445,398,083 $2 Flat 20%
New Jersey $326,961,450 None Flat 8%
Mississippi $312,123,081 None Flat 12%
Iowa $204,202,800 None Graduated 22%
* Two Indiana facilities, Hoosier Park and Indiana Live, do not collect admissions.

48 Annual Report 2009
Number of Casinos 9 Total Square Footage 297,535 Total Admissions (FY 2009) 14,262,077 Adjusted Gross Revenue (FY 2009) $1,474,460,000 per Admission $103
per Square Foot $4,955 Taxes Collected (FY 2009) $532,147,000 State $443,982,000 Local $88,165,000
ILLINOIS GAMING BOARD
Tax Schedule Graduated admissions tax based on previous calendar year admissions totals: • $2 for one million visitors or less; • $3 for more than one million visitors. A graduated wagering tax: • 15% of AGR up to and including $25 million; • 22.5% of AGR in excess of $25 million but not exceeding $50 million; • 27.5% of AGR in excess of $50 million but not exceeding $75 million; • 32.5% of AGR in excess of $75 million but not exceeding $100 million; • 37.5% of AGR in excess of $100 million but not exceeding $150 million; • 45% of AGR in excess of $150 million but not exceeding $200 million; • 50% of AGR in excess of $200 million. An amount equal to 5% of the AGR and $1 of the admission tax is credited to local govern‐ment
160 North LaSalle, Suite 300 Chicago, IL 60601 (312) 814‐4700
Mark Ostrowski Administrator
The Illinois Gaming Board provides regulatory oversight to the riverboat casinos in the form of audit, legal, enforcement, investigative, and financial analysis activities. They are assisted in their enforcement and investigative duties by a division of the Illinois State Police.
Annual Report 2009 49
Number of Casinos 14 Total Square Footage 402,838
Total Admissions (FY 2009) 22,955,618 Adjusted Gross Revenue (FY 2009) $1,412,817,242 per Admission $61
per Square Foot $3,507 Taxes Collected (FY 2009) $204,202,800 State $193,961,736 Local $10,241,064 Tax Schedule No admission tax. A graduated wagering tax: • 5% of AGR up to $1 million; • 10% of AGR between $1 million and $3 million; • 22% of AGR above $3 million. Of this, 1% of AGR is distributed to local government.
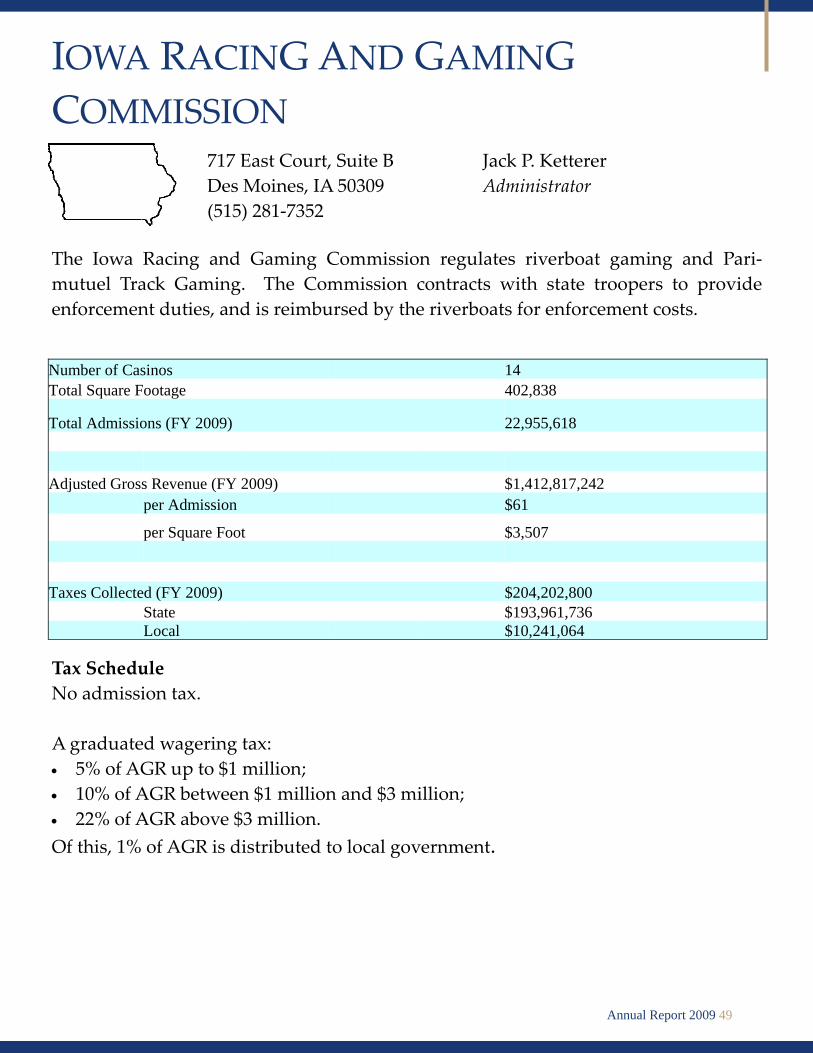
717 East Court, Suite B Des Moines, IA 50309 (515) 281‐7352
Jack P. Ketterer Administrator
The Iowa Racing and Gaming Commission regulates riverboat gaming and Pari‐mutuel Track Gaming. The Commission contracts with state troopers to provide enforcement duties, and is reimbursed by the riverboats for enforcement costs.
IOWA RACING AND GAMING COMMISSION

50 Annual Report 2009
Number of Casinos 13 Total Square Footage 415,000
Total Admissions (FY 2009) 23,188,205 Adjusted Gross Revenue (FY 2009) $1,763,914,052 per Admission $76 per Square Foot $4,250
Taxes Collected (FY 2008) $452,618,007
State $381,122,463 Local $71,495,544 Tax Schedule • No admissions tax. A graduated wagering tax for Bally’s Casino: • 18.5% of AGR up to $6 million per month; • 20.5% of AGR between $6 million and $8 million per month; • 21.5% of AGR above $8 million per month. A flat wagering tax for all other licensees: • 21.5% of AGR
9100 Bluebonnet Centre Boulevard, Suite 500 Baton Rouge, LA 70809 (225) 295‐8450
The Louisiana Gaming Control Board shares responsibility for riverboat gaming with the Louisiana State Police Gaming Enforcement Division. It is also responsible for all other aspects of gaming in Louisiana, including video gaming machines, racetracks, and a single land‐based casino.
LOUISIANA GAMING CONTROL BOARD
Dane K. Morgan Chairman

Annual Report 2009 51
Number of Casinos 14 Total Square Footage 402,838 Total Admissions (FY 2009) 35,502,745 Adjusted Gross Revenue (FY 2009) $2,584,890,618 per Admission $73 per Square Foot $6,416 Taxes Collected (FY 2009) $312,123,081 State $208,382,616 Local $103,741,162
Tax Schedule No admission tax. A flat wagering tax: • 8% of AGR to state government; • 4% of AGR to local government
620 North St., Suite 200 Jackson, MS 39225 (601) 576‐3800
Larry Gregory Executive Director
MISSISSIPPI GAMING COMMISSION
The Mississippi Gaming Commission regulates and enforces both riverboat gaming and charitable gaming activities.

52 Annual Report 2009
Number of Casinos 12 Total Square Footage 774,800 Total Admissions (FY 2009) 52,335,276 Adjusted Gross Revenue (FY 2009) $1,703,637,656
per Admission $32 per Square Foot $2,198 Taxes Collected (FY 2009) $445,398,083 State $358,990,054 Local $86,408,029 Tax Schedule An admissions tax of $2: • $1 to state government; • $1 to local government. A flat wagering tax: • 20% of AGR 10% of the wagering tax (2% of AGR) is transferred to local government.
3417 Knipp Drive, Box 1847 Jefferson City, MO 65109 (573) 526‐4080
The Missouri Gaming Commission regulates riverboat gaming and charitable bingo. The Commission contracts with the Missouri Highway Patrol to provide enforcement and regulatory services, although the salaries of enforcement officers are paid from the Commission budget.
MISSOURI GAMING COMMISSION
Gene McNary Executive Director

Annual Report 2009 53
Number of Casinos 7 Total Square Footage 489,332 Total Admissions (FY 2009) N/A Adjusted Gross Revenue (FY 2009) $1,754,002,790.46 per Admission N/A per Square Foot $3,584 Taxes Collected (FY 2009) $964,701,535.35
State $894,541,423.76 Local $70,160,111.59 Tax Schedule No admissions tax. A flat wagering tax: • 34% to state gaming fund; • 12% to horse racing industry; • 5% to economic development; • 4% to local and county governments
PENNSYLVANIA GAMING CONTROL BOARD
Gregory C. Fajt Chairman
P.O. Box 69060 Harrisburg, PA 17106 (717) 346‐8300
The Pennsylvania Gaming Control Board is responsible for ensuring the integrity of legalized gaming, fulfilling the objectives of limited gaming in Pennsylvania to deliver a significant source of revenue, assisting the horse racing industry, providing broad economic opportunities, and enhancing tourism.

54 Annual Report 2009
APP
ENDIX
55 Annual Report 2009
HOLLYW
OOD
BELTERRA
BLUE CHIP
HORSESHOE
SI
AZTAR
GRAND
VICTORIA
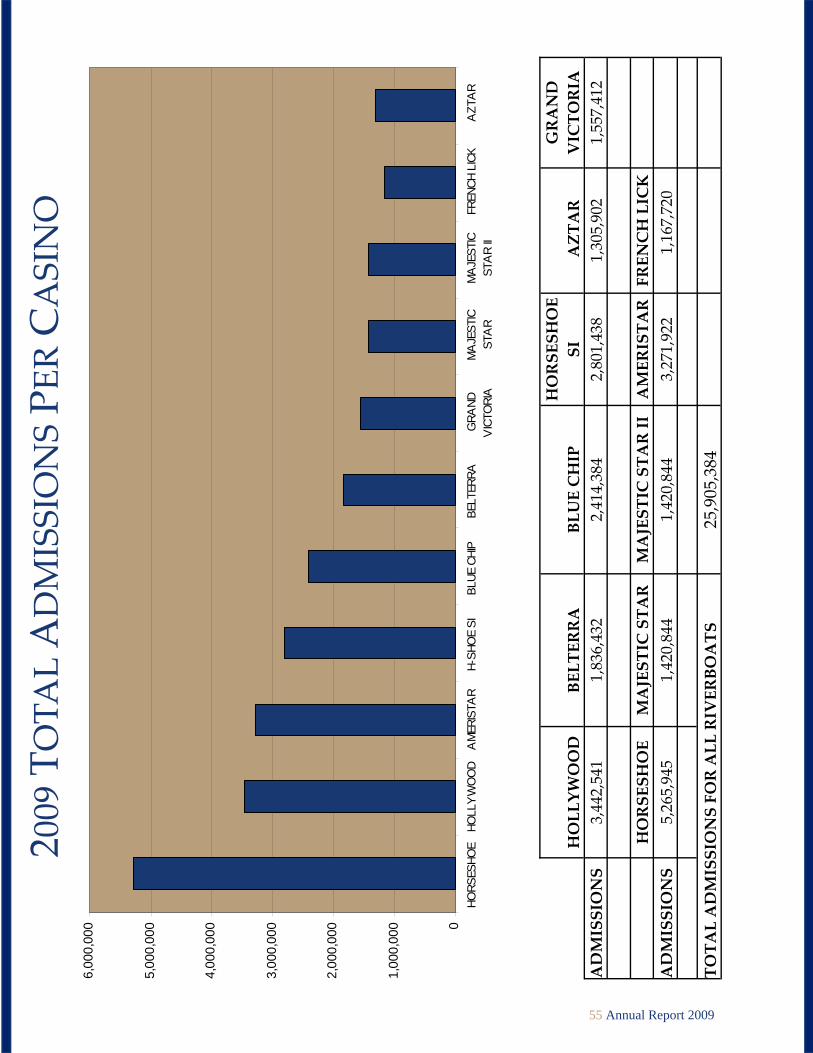
ADMISSIONS
3,442,541
1,836,432
2,414,384
2,801,438
1,305,902
1,557,412
HORSESHOE MAJESTIC STAR MAJESTIC STAR II AMERISTAR FRENCH LICK
ADMISSIONS
5,265,945
1,420,844
1,420,844
3,271,922
1,167,720
TOTAL ADMISSIONS FOR ALL RIVERBOATS
25,905,384
0
1,00
0,00
0
2,00
0,00
0
3,00
0,00
0
4,00
0,00
0
5,00
0,00
0
6,00
0,00
0
HORS
ESHO
E HO
LLY
WO
OD
AM
ERIS
TAR
H-SH
OE
SI
BLUE
CHI
P
BELT
ERRA
G
RAND
VIC
TORI
AM
AJE
STIC
STA
RM
AJE
STIC
STA
R II
FREN
CH L
ICK
AZT
AR
2009 TOTA
L ADMISSIONS PE
R CASINO

56 Annual Report 2009
20
09 ADMISSION TAX RE
PORT
ED
TAX
REPORTED
BELTERRA
BLUE CHIP
HORSESHOE SI CASINO AZTAR
GRAND
VICTORIA
HOLLYW
OOD
HORSESHOE
MAJESTIC STAR
MAJESTIC
STAR II
AMERISTAR
FRENCH LICK
GRAND
TOTAL
JULY
532,140
624,762
834,021
358,992
433,527
926,385
794,379
401,109
401,109
1,027,254
484,480
6,818,158
AUGUST
500,235
608,094
763,599
361,242
427,896
944,439
1,523,997
362,931
362,931
849,891
512,152
7,217,407
SEPT
EMBE
R 393,372
517,983
640,884
312,555
372,339
804,567
1,340,178
323,307
323,307
712,464
411,260
6,152,216
OCTO
BER
407,955
540,807
660,732
299,100
371,982
857,544
1,399,056
344,670
344,670
746,427
413,032
6,385,975
NOVEM
BER
414,174
501,189
653,841
310,083
369,582
811,827
1,353,195
343,353
343,353
765,981
336,724
6,203,302
DEC
EMBE
R 390,600
444,435
636,948
323,541
333,033
813,372
1,190,052
314,802
314,802
719,502
339,216
5,820,303
JANUARY
430,137
512,601
650,391
317,121
343,029
822,345
1,265,112
344,844
344,844
797,640
327,184
6,155,248
FEBR
UARY
461,517
665,415
771,603
335,625
382,860
862,482
1,313,085
345,756
345,756
832,071
336,308
6,652,478
MARC
H
528,165
755,895
766,917
348,486
416,001
911,550
1,475,640
366,501
366,501
890,370
367,644
7,193,670
APR
IL
473,259
720,840
637,857
309,015
394,464
850,902
1,513,032
361,884
361,884
821,409
351,952
6,796,498
MAY
504,135
719,355
692,586
341,688
416,907
907,410
1,410,624
390,798
390,798
851,355
388,076
7,013,732
JUNE
473,607
631,776
694,935
300,258
410,616
814,800
1,219,485
362,577
362,577
801,402
402,852
6,474,885
TOTAL
$5,509,296
$7,243,152
$8,404,314
$3,917,706
$4,672,236
$10,327,623
$15,797,835
$4,262,532
$4,262,532
$9,815,766
$4,670,880
$78,883,872
HORS
ESHOE SI
11%
BLUE CHIP
9%
BELT
ERRA
7%
FREN
CH LICK
6%AMER
ISTA
R12
%
MAJEST
IC STA
R II
5%
MAJEST
IC STA
R5%
HORS
ESHOE
21%
HOLL
YWOOD
13%
GRA
ND V
ICTO
RIA
6%
CASINO A
ZTAR
5%
57 Annual Report 2009
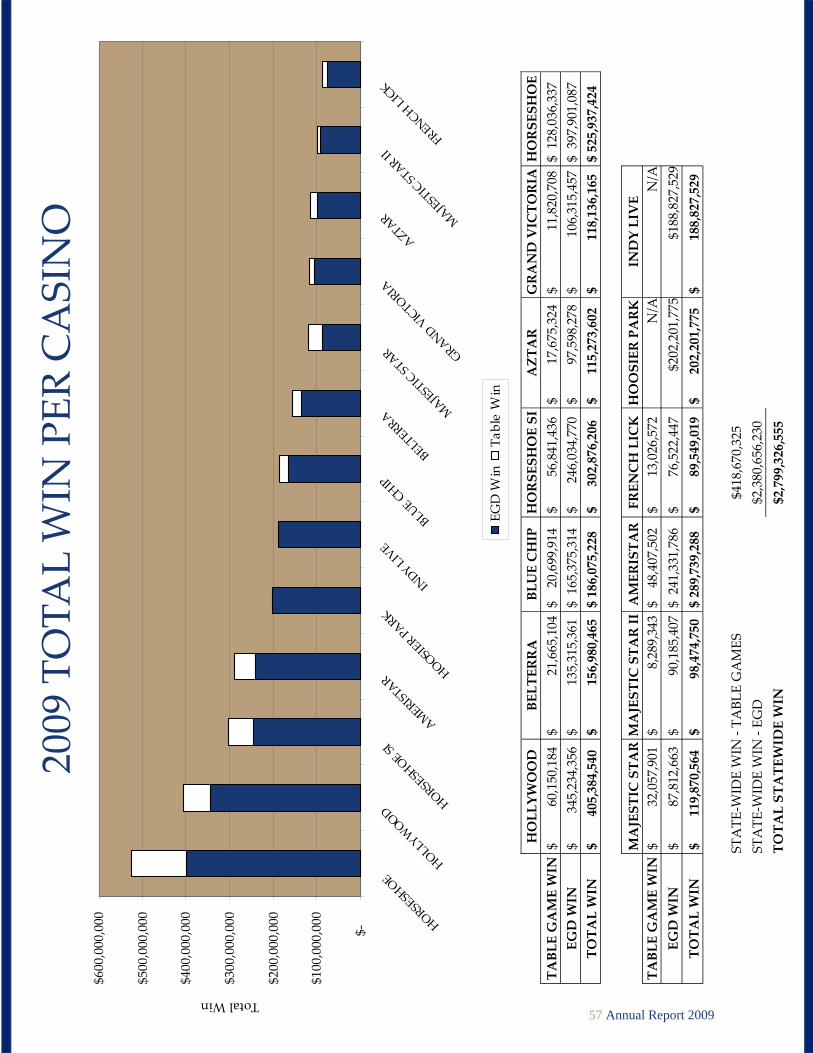
HOLLYW
OOD
BELTERRA
BLUE CHIP HORSESHOE SI
AZTAR
GRAND VICTORIA HORSESHOE
TABLE GAME WIN $ 60,150,184 $ 21,665,104 $ 20,699,914 $ 56,841,436 $ 17,675,324 $ 11,820,708 $ 128,036,337
EGD WIN
$ 345,234,356 $ 135,315,361 $ 165,375,314 $ 246,034,770 $ 97,598,278 $ 106,315,457 $ 397,901,087
TOTAL WIN
$ 405,384,540 $ 156,980,465 $ 186,075,228 $ 302,876,206 $ 115,273,602 $ 118,136,165 $ 525,937,424
MAJESTIC STAR MAJESTIC STAR II AMERISTAR FRENCH LICK HOOSIER PARK
INDY LIVE
TABLE GAME WIN $ 32,057,901 $ 8,289,343 $ 48,407,502 $ 13,026,572
N/A
N/A
EGD WIN
$ 87,812,663 $ 90,185,407 $ 241,331,786 $ 76,522,447
$202,201,775
$188,827,529
TOTAL WIN
$ 119,870,564 $ 98,474,750 $ 289,739,288 $ 89,549,019 $ 202,201,775 $ 188,827,529
ST
ATE‐W
IDE WIN ‐ TA
BLE GAMES
$418,670,325
STATE‐W
IDE WIN ‐ EG
D
$2,380,656,230
TOTAL STATEWIDE WIN
$2,799,326,555
$‐
$100,000,000
$200,000,000
$300,000,000
$400,000,000
$500,000,000
$600,000,000 HO
RSES
HOE
HOLL
YWOO
DHO
RSES
HOE S
I
AMER
ISTAR
HOOS
IER P
ARK
INDY
LIVE
BLUE
CHIP
BELT
ERRA
MAJES
TIC S
TAR GR
AND
VICT
ORIA
AZTA
R MAJES
TIC S
TAR I
IFR
ENCH
LICK
Total Win
EGD W
inTa
ble W
in
2009 TOTA
L WIN PER CASINO
58 Annual Report 2009
20
09 G
AMIN
G O
PERA
TIONS
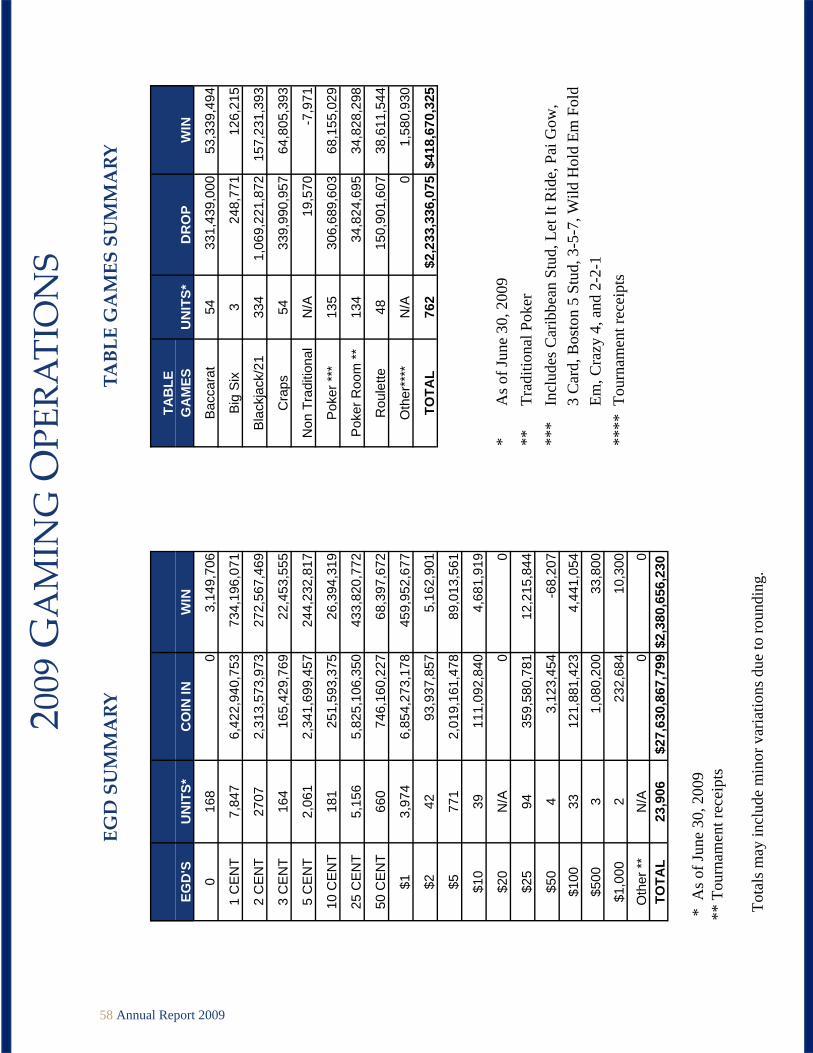
EGD SUMMARY
TA
BLE
U
NIT
S*
DR
OP
WIN
EG
D'S
U
NIT
S*
CO
IN IN
W
IN
G
AM
ES
0 16
8 0
3,14
9,70
6
Bac
cara
t 54
33
1,43
9,00
0 53
,339
,494
1 C
EN
T 7,
847
6,42
2,94
0,75
3 73
4,19
6,07
1
Big
Six
3
248,
771
126,
215
2 C
EN
T 27
07
2,31
3,57
3,97
3 27
2,56
7,46
9
Bla
ckja
ck/2
1 33
4 1,
069,
221,
872
157,
231,
393
3 C
EN
T 16
4 16
5,42
9,76
9 22
,453
,555
Cra
ps
54
339,
990,
957
64,8
05,3
93
5 C
EN
T 2,
061
2,34
1,69
9,45
7 24
4,23
2,81
7
Non
Tra
ditio
nal
N/A
19
,570
-7
,971
10 C
EN
T 18
1 25
1,59
3,37
5 26
,394
,319
Pok
er **
* 13
5 30
6,68
9,60
3 68
,155
,029
25 C
EN
T 5,
156
5,82
5,10
6,35
0 43
3,82
0,77
2
Pok
er R
oom
**
134
34,8
24,6
95
34,8
28,2
98
50 C
EN
T 66
0 74
6,16
0,22
7 68
,397
,672
Rou
lette
48
15
0,90
1,60
7 38
,611
,544
$1
3,97
4 6,
854,
273,
178
459,
952,
677
O
ther
****
N
/A
0 1,
580,
930
$2
42
93,9
37,8
57
5,16
2,90
1
TOTA
L 76
2 $2
,233
,336
,075
$41
8,67
0,32
5
$5
771
2,01
9,16
1,47
8 89
,013
,561
$10
39
11
1,09
2,84
0 4,
681,
919
$20
N
/A
0 0
*
A
s of J
une
30, 2
009
$25
94
35
9,58
0,78
1 12
,215
,844
**
Trad
ition
al P
oker
$50
4
3,12
3,45
4 -6
8,20
7 **
*
Incl
udes
Car
ibbe
an S
tud,
Let
It R
ide,
Pai
Gow
, $1
00
33
121,
881,
423
4,44
1,05
4
3 C
ard,
Bos
ton
5 St
ud, 3
-5-7
, Wild
Hol
d Em
Fol
d
$500
3
1,08
0,20
0 33
,800
Em
, Cra
zy 4
, and
2-2
-1
$1
,000
2
232,
684
10,3
00
****
Tou
rnam
ent r
ecei
pts
O
ther
**
N/A
0
0
TOTA
L 23
,906
$2
7,63
0,86
7,79
9 $
2,38
0,65
6,23
0
* A
s of J
une
30, 2
009
**
Tou
rnam
ent r
ecei
pts
T
otal
s may
incl
ude
min
or v
aria
tions
due
to ro
undi
ng.
TABLE GAMES SUMMARY

59 Annual Report 2009
2009 SUMMARY O
F TA
BLE GAME ACTIVITY
GRAND
MAJESTIC
MAJESTIC
FRENCH
UNITS*
Hollywood
BELTERRA
BLUE CHIP
HORSESHOE SI
AZTAR
VICTORIA
HORSESHOE
STAR
STAR II
AMERISTAR
LICK
Baccarat
4 N/A
2 3
N/A
N/A
18
14
N/A
12
1
Big Six
1 N/A
N/A
1 N/A
1 N/A
N/A
N/A
N/A
N/A
Black Jack
47
27
29
45
27
25
41
32
7 29
25
Craps
8 4
4 8
4 3
11
2 2
4 4
Non Traditional
N/A
N/A
N/A
N/A
N/A
N/A
N/A
N/A
N/A
N/A
N/A
Poker***
41
11
9 16
6 8
19
9 2
6 8
Poker Room**
20
9 8
30
12
N/A
34
N/A
21
0 N/A
Roulette
8 3
4 7
3 2
11
2 1
4 3
Other
N/A
N/A
N/A
N/A
N/A
N/A
N/A
N/A
N/A
N/A
N/A
TOTAL
129
54
56
110
52
39
134
59
33
55
41
DROP
Baccarat
10,445,075
563,284
4,838,915
13,734,986
N/A
8,170
154,192,730
71,182,686
N/A
76,319,126
154,028
Big Six
22,083
N/A
N/A
197,687
N/A
29,001
N/A
N/A
N/A
N/A
N/A
Black Jack
146,219,207
70,179,235
55,365,482
145,897,418
41,776,144
34,120,882
296,497,027
92,168,957
14,479,394
134,356,540
38,161,586
Craps
45,152,288
23,447,850
12,776,578
52,247,172
13,588,507
15,863,432
109,205,905
14,592,354
6,529,752
33,190,486
13,396,633
Non Traditional
N/A
N/A
N/A
19,570
N/A
N/A
N/A
N/A
N/A
N/A
N/A
Poker***
52,601,868
24,189,967
23,897,096
44,398,279
14,276,415
12,916,359
75,059,275
21,394,796
3,825,430
18,066,854
16,063,264
Poker Room**
7,015,797
1,355,999
1,454,246
5,158,702
1,939,462
290,427
11,859,359
N/A
3,213,097
2,537,606
N/A
Roulette
22,787,830
8,774,414
6,105,637
18,421,923
6,792,943
3,430,373
54,440,713
6,426,793
2,791,217
15,499,191
5,430,573
Other
N/A
N/A
N/A
N/A
N/A
N/A
N/A
N/A
N/A
N/A
N/A
TOTAL
284,244,148
128,510,749
104,437,954
280,075,737
78,373,471
66,658,644
701,255,009
205,765,586
30,838,890
279,969,803
73,206,084
WIN
Baccarat
2,192,582
355,455
797,367
2,553,468
N/A
4,579
25,400,167
10,666,177
N/A
11,317,982
51,717
Big Six
11,353
N/A
N/A
102,999
N/A
11,863
N/A
N/A
N/A
N/A
N/A
Black Jack
23,190,038
9,421,861
7,583,709
24,643,162
6,966,930
4,713,690
41,384,590
11,904,498
2,301,643
20,105,769
5,015,503
Craps
10,523,162
3,630,255
2,451,616
9,327,288
3,129,792
2,978,637
19,607,331
3,391,275
1,197,183
5,684,041
2,884,813
Non Traditional
N/A
N/A
N/A
(7,971)
N/A
N/A
N/A
N/A
N/A
N/A
N/A
Poker***
10,809,338
4,917,519
6,697,506
10,209,165
3,787,801
2,923,126
15,609,959
4,436,996
372,047
4,759,533
3,632,039
Poker Room**
7,015,797
1,355,999
1,454,246
5,162,302
1,939,462
290,427
11,859,362
N/A
3,213,097
2,537,606
N/A
Roulette
6,070,219
1,984,015
1,633,020
4,833,230
1,851,339
882,520
13,598,468
1,658,955
657,827
3,999,451
1,442,500
Other
337,695
N/A
82,450
17,793
N/A
15,866
576,460
N/A
547,546
3,120
N/A
TOTAL
60,150,184
21,665,104
20,699,914
56,841,436
17,675,324
11,820,708
128,036,337
32,057,901
8,289,343
48,407,502
13,026,572
* As o
f 6/30/09
** T
radi
tiona
l Pok
er
***
Incl
udes
Car
ibbe
an S
tud/
Dra
w, L
et It
Rid
, Pai
Gow
, 3 C
ard,
Bos
ton
5 St
ud, 3
-5-7
, Wild
Hol
d’Em
Fol
d’EM
, Cra
zy 4
and
2-2
-1

60 Annual Report 2009
2009 SUMMARY O
F EG
D A
CTIVITY
61 Annual Report 2009
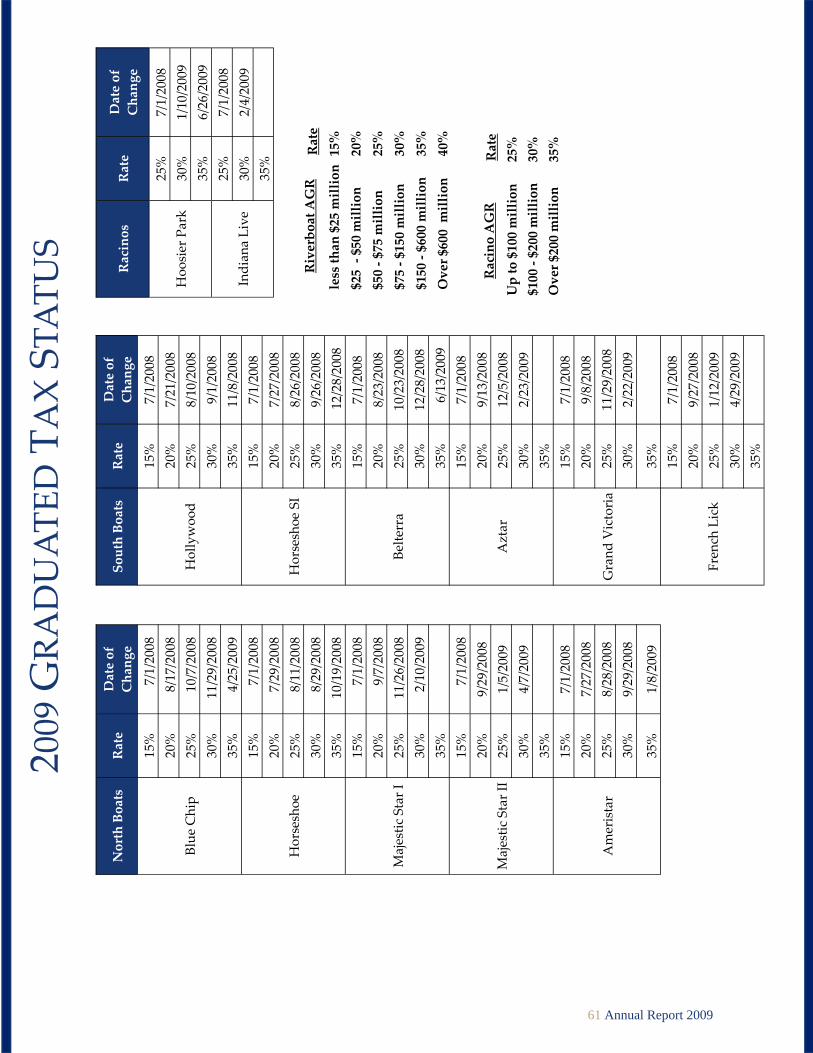
20
09 G
RADUATE
D TAX ST
ATU
S North Boats
Rate
Date of
Change
South Boats
Rate
Date of
Change
Blue Chip
15%
7/1/2008
Hollywoo
d
15%
7/1/2008
20%
8/17/2008
20%
7/21/2008
25%
10/7/2008
25%
8/10/2008
30%
11/29/2008
30%
9/1/2008
35%
4/25/2009
35%
11/8/2008
Horseshoe
15%
7/1/2008
Horseshoe SI
15%
7/1/2008
20%
7/29/2008
20%
7/27/2008
25%
8/11/2008
25%
8/26/2008
30%
8/29/2008
30%
9/26/2008
35%
10/19/2008
35%
12/28/2008
Majestic Star I
15%
7/1/2008
Belte
rra
15%
7/1/2008
20%
9/7/2008
20%
8/23/2008
25%
11/26/2008
25%
10/23/2008
30%
2/10/2009
30%
12/28/2008
35%
35%
6/13/2009
Majestic Star II
15%
7/1/2008
Aztar
15%
7/1/2008
20%
9/29/2008
20%
9/13/2008
25%
1/5/2009
25%
12/5/2008
30%
4/7/2009
30%
2/23/2009
35%
35%
Ameristar
15%
7/1/2008
Grand Victoria
15%
7/1/2008
20%
7/27/2008
20%
9/8/2008
25%
8/28/2008
25%
11/29/2008
30%
9/29/2008
30%
2/22/2009
35%
1/8/2009
35%
French Lick
15%
7/1/2008
20%
9/27/2008
25%
1/12/2009
30%
4/29/2009
35%
Riverboat AGR Rate
less than $25 million 15%
$25 ‐ $50 million
20%
$50 ‐ $75 million
25%
$75 ‐ $150 million
30%
$150 ‐ $600 million
35%
Over $600 million
40%
Racinos
Rate
Date of
Change
Hoo
sier Park
25%
7/1/2008
30%
1/10/2009
35%
6/26/2009
Indian
a Live
25%
7/1/2008
30%
2/4/2009
35%
Racino AGR
Rate
Up to $100 million
25%
$100 ‐ $200 million
30%
Over $200 million
35%

The Indiana Gaming Commission would like to thank its summer intern, Nicholas Moline, for his contribution toward the creation of this report.

Indiana Gaming Commission
101 W. Washington Street East Tower, Suite 1600 Indianapolis, IN 46204
Phone: (317) 233-0046 Fax: (317) 233-0047
http://www.in.gov/igc