2 3 2.0 8 6 r e m
TRANSCRIPT

2 3 2 . 0
8 6 R E
§m
Iff
Hague, The Netherlands
;;-'- a-K'v!>!?':.••;' •:';&
2-2>2'O-<g£f>e~
INTERNATIONAL REFERENCE CENTRE FOR COMMUNITY WATERSUPPLY AND SANITATION s
IRC is an internationally operating independent, non-profit organization dealingwith information and technology support for water and sanitation improvement.With its partners in developing countries and with United Nations agencies, donororganizations, and non-governmental organizations, IRC assists in the generation,transfer and application of relevant knowlegde. The focus of this co-operation is onthe rural and urban fringe areas where the need for technical assistance is greatest.
Support is provided by means of publications, training and education, evaluationand advice, and development and demonstration. IRC's information-orientedprogrammes include: community participation including the role of women;hygiene education; human resources development; appropriate technologyincluding operation and maintenance; programme evaluation; and community-based financial management.
•iRequests for information about TRC should be addressed to IRC, P.O. Box 93190,2509 AD The Hague, The Netherlands.

Renewable Energy Sourcesfor Rural Water Supply
RENEWABLE ENERGY SOURCESFOR RURAL WATER SUPPLY
E.H. Hofkes and J.T. Visscher
15
Technical Paper 23
International Reference Centre for CommunityWater Supply and Sanitation,The Hague, The Netherlands
1986

Renewable energy sources for rural water supply: Hofkes, E.H. and Visscher,J.T. (1986) Renewable energy sources for rural water supply. (TP series no. 23).The Hague, The Netherlands, IRC, 184 pp, including 20 tables, 66 figures, and aselected bibliography.
ISBN 90-6687-007-9
AbstractThe potential of using renewable energy sources (solar energy, wind energy,hydropower, biomass energy) to power water pumping systems for rural watersupply is receiving increased attention. Assessment and selection of theseenergy sources and pumping systems require careful analysis of a wide range offactors. This book provides guidance and information to support the systematicconsideration of renewable energy sources and devices for rural supplypumping. In Part I (Chapters 1-3), the various factors to be considerd and theselection methodology to be followed in energy sources assessment andpumping system selection are discussed. In Part II (Chapters 4-8), state-of-the-art information on the technology of solar pumps, wind pumps, hydro-poweredpumps, and pumping systems using biomass energy are presented.
Keywords: water lifting devices / rural supply systems / energy / feasibilitystudies / comparative analyses / costs / solar energy / wind-powered pumps /hydropower / biomass / selection criteria.
Copyright © by the International Reference Centre for Community WaterSupply and Sanitation (IRC).
IRC enjoys copyright under Protocol 2 of the Universal Copyright Convention.Nevertheless, permission is hereby granted for reproduction of this material, inwhole or part, for educational, scientific, or development-related purposesexcept those involving commercial sale, provided that (a) full citation of thesource is given and (b) notification is given in writing to IRC, P.O. Box 93190,2509 AD The Hague, The Netherlands.
IV

TABLE OF CONTENTS
PagePreface xmAcknowledgements xiv
Part I: SELECTION OF ENERGY SOURCE AND WATERPUMPING SYSTEM
1 Energy Sources for Small Community Water Supplies 1
1.1 Energy requirement 11.2 Conventional energy sources 41.3 Renewable energy sources 6
Bibliography 13
2 Considerations for Selection of Energy Source 14
2.1 Environmental feasibility 152.2 Technical and social feasibility 182.3 Economic feasibility 242.4 Pilot plant studies 272.5 Local selection 27
Bibliography 30
3 Comparative Cost Analysis 31
3.1 Cost categories 313.2 Calculation of comparable costs 323.3 Cost analysis using adjusted cost data 353.4 Estimation of recurrent costs 363.5 Pumping systems using conventional energy sources 363.6 Pumping systems using renewable energy sources 373.7 Storage tanks 403.8 Cost comparison 413.9 Effect of assumptions made on cost calculation results 44
Bibliography 45
V

Part II: THE TECHNOLOGIES
4 Basics of Water Pumping and Pump Selection 46
4.1 Specification of pumping duty 464.2 Characteristics of water source 494.3 Power requirement and pumping efficiency 504.4 Maintenance and repair requirements 524.5 Types of pumps 524.6 Main characteristics of various types of pumps 60
Bibliography 64
5 Solar Energy 65
5.1 Solar-powered water pumping systems 685.2 Photovoltaic pumping systems 695.3 Photovoltaic cells, modules, and arrays 735.4 Motor-and-pump subsystem 765.5 Ancillary equipment 775.6 Conversion efficiencies 795.7 Matching motor/pump and array power output
characteristics 805.8 Water storage requirement 815.9 Approximate sizing of photovoltaic pumping systems 815.10 Thermodynamic pumping systems 84
Bibliography 86
6 Wind Energy 87
6.1 Wind-powered water pumping systems 886.2 Wind rotors 906.3 Towers 916.4 Transmission systems 926.5 Control mechanisms 946.6 Basic theory of wind-powered pumping 946.7 Data collection and wind regime 986.8 Site selection 986.9 Design 100
VI

6.10 Estimation of hydraulic output 101
6.11 Maintenance 103
Bibliography 104
7 Hydropower 106
7.1 Hydraulic ram pumps 1067.2 Turbine pumps 114
7.3 River-current pumps 115
Bibliography 117
8 Biomass Energy 118
8.1 Biogas production process 1188.2 Biogas production plant 1218.3 Engines using biogas as fuel 1278.4 Gasification 1288.5 Engines using producer gas as fuel 1308.6 Ethanol production 1308.7 Engines using ethanol as fuel 131Bibliography 132
Appendices 135
A - Glossary of terms 135B - Calculation of unit costs 142C - Manufacturers and suppliers 148D - Sources of information on renewable energy sources and
the application for small-scale water supply systems 156
VII

LIST OF TABLESpage
1.. 1 Time required for water pumping 5
2.1 Indication of minimum requirements for environmental feasibility of usingrenewable energy sources 16
2.2 Frequency of maintenance attention and level of technical skills required forvarious types of pumping devices 19
2.3 Indication of back-up service requirements for various types of pumpingsystems 20
2.4 Level of capital and recurrent costs of various types of pumping systems 25
3.1 Capital and recurrent costs of a water pumping system 31
3.2 Capital recovery factors for various combinations of discount rate andlifetime 34
3.3 Adjustment factors used to convert market prices to real costs forthe Morogoro region of Tanzania 35
3.4 Indication of capital cost of solar photovoltaic pumps 39
3.5 Indication of water storage requirements for various types of pumping
systems 40
3.6 Cost indication of various types of water storage tanks 41
3.7 Cost comparison of wind pump, solar pump and diesel pump fora particular location 42
4.1 Characteristics of various types of pumps 61
4.2 Advantages and disadvantages of various types of pumps 62
6.1 Indication of power losses in wind pump systems 97
7.1 Water delivery as a proportion of supply flow for hydraulic ram pumpsoperating under various combinations of supply head and delivery head 111
VIII

8.1 Carbon/nitrogen ratios of various biomass materials 121
8.2 Parameters of biogas production and general range of optimal values 121
8.3 Biogas production rates for various types of feed materials 126
8.4 Ethanol production from various types of carbohydrate sources 131
LIST OF FIGURES
1.1 Overview of energy sources and conversion devices for water pumping
systems 2
1.2 Indication of energy losses in the water pumping system 3
1.3 Main features of a hydraulic ram pump installation 7
1.4 Wind pump with multi-blade rotor 8
1.5 Vertical-axis wind rotor 9
1.6 Solar photovoltaic water pumping system 10
1.7 Main features of biogas digester 11
2.1 Systematic assessment of relevant factors in selection of energy sources
for water pumping 15
2.2 Comparison of time profile of costs for solar pump and diesel pump 24
2.3 Estimated range of economic feasibility of energy sources for a particularwater pumping duty 26
2.4 Selection chart for determination of energy source(s) andpumping system(s) to be considered for a particular location 29
4.1 Components of total pumping head 48
4.2 Drawdown effect caused by abstraction of water from borehole 49
4.3 Pump performance curves for centrifugal pump 51
4.4 Principle of operation of rcciprocating-plunger pump 53
IX

4.5 Principle of operation of diaphragm pump 54
4.6 Main features of helical-rotary pump 55
4.7 Stage of centrifugal pump 56
4.8 Submersible pump 57
4.9 Deep well turbine pump 58
4.10 Main features of axial-flow pump 59
4.11 General indication of application for various types of pumps 60
5.1 The paths of solar radiation 65
5.2 Average daily global irradiation (M,T/m2/d) on the horizontal plane 66
5.3 Annual, monthly and daily variation in solar irradiation at an arid and
a humid tropical location 67
5.4 Configurations for photovoltaic pumping systems 69
5.5 Power conversion in a solar photovoltaic pumping system 71
5.6 Relationship between irradiance, array power output, and water output,
for photovoltaic solar pump 72
5.7 Configuration of a silicon photovoltaic cell 74
5.8 Mounting framework of photovoltaic array 75
5.9 Current/voltage curves for a photovoltaic array 755.10 Approximate sizing of photovoltaic pumping system 835.11 Basic configuration of a solar thermodynamic pumping system 85
6.1 World wind power distribution 87
6.2 Main features of mechanically coupled wind pump 89
6.3 Main features of electrically coupled wind pump 90
6.4 Types of rotors used in wind pumps 91

6.5 Transmission mechanism for wind pump using plunger pump 92
6.6 Transmission mechanism equipped with a clutch 93
6.7 Air mass flow 95
6.8 Power conversion in a wind pump installation 97
6.9 Effect of various obstructions and topographical features on wind speeds 99
6.10 Zone of turbulence behind an obstruction 99
6.11 Power curve of wind pump 100
6.12 Estimation of average hydraulic power output of wind pump 102
6.13 Determination of hydraulic energy output of wind pump 103
7.1 Hydraulic ram pump installation 106
7.2 Example of hydraulic ram pump 107
7.3 Example of low-cost hydraulic ram pump 108
7.4 Example of hydraulic ram pump made from off-the-shelf components 108
7.5 Operation of hydraulic ram pump 110
7.6 Design parameters of hydraulic ram pump installation 111
7.7 Hydraulic ram pumps operating in parallel 113
7.8 Main features of turbine pump developed in China 114
7.9 ITDG river-current pump 116
8.1 Biogas production as a function of retention period and temperature 120
8.2 Basic biogas production plant using digester drums 122
8.3 Circular fixed-dome digester used in China 123
8.4 KVIC digester with floating gas holder 124
8.5 Janata digester with fixed dome 124
XI

1.6 Digester with water-sealed floating gas holder 125
1.7 Flexible bag digester 125
1.8 Two-compartment digester with floating gas holder, the Philippine 126
1.9 Diesel engine modification for dual-fuel operation 127
1.10 Carburettor designed for petrol engine running on biogas 128
1.11 Schematic diagram of gasifier 129
XII

Preface
In larger communities, the water requirement is greater than a hand pump watersupply can provide. In these cases, pumping systems based on diesel or electricpumps are most commonly used. However, particularly in remote rural areas ofdeveloping countries, the use of diesel or electric pumps meets withconsiderable difficulties, including high costs in securing regular supplies of fuelor power, inadequate infrastructure and skills for operation and maintenance,and organizational limitations. As a result, increasing attention is directed to thepotential of using alternative power sources for medium-size rural watersupplies.
These energy sources, which arc collectively referred to as renewable energysources, are solar energy, wind energy, hydropower, and biomass fuels.Research and development, supported by field trials, have advanced pumpingsystems using these energy sources to a stage where they are competitive withthe conventional diesel and electric pumping devices.
However, lack of practical information is a serious limitation for decision-makers, planners, and engineers, in the assessment of pumping systems usingrenewable energy sources for large-scale application in national water supplyprogrammes. Therefore, this book has been produced for the guidance ofrenewable energy pumping devices. The book is divided in two parts. The firstpart deals with the systematic pre-selection of the most appropriate pumpingsystems for a particular country or region. The considerations covered includeenvironmental, technical, social, and economic feasibility. Comparative costanalysis is presented as a useful tool in the pre-selection process. The secondpart of the book provides detailed information to support further considerationof the pumping systems pre-selected using procedure given in the first part.
At the end of each chapter the reader can find a bibliography. This is acombination of references and further reading, selected from a wealth ofsources.
XIII

Acknowledgements
Many have contributed to the compilation of material and the preparation ofthis book, which is the end product of a knowledge synthesis project, carried outwith financial support from the Netherlands' Ministry of Housing, PhysicalPlanning, and Environment, and the Ministry for Development Cooperation.The project was guided by a Steering Committee composed of Messrs. J.Haijkcns, E.J. Eshuis, A.F.L. Snob from the Ministry of Housing, PhysicalPlanning, and Environment, and Messrs. J. Boer and A.P. Hamburger from theMinistry for Development Cooperation.
In the initial stages, a group of consultants were engaged to select and compileinformation on the various renewable energy devices dealt with in the book:
Messrs. P.L. Fraenkel, A. Derrick, and J.F. Kenna, of IntermediateTechnology Ltd., Reading, UK, on solar-powered pumping systems; Messrs.W.A.M. Jansen and S.J. de Boer, of Consultancy Services Wind PowerDeveloping Countries, Amersfoort, The Netherlands, on wind pumps; Messrs.J. Tacke and J. Walter, of the Centre for International Cooperation andAppropriate Technology, Delft University of Technology, Delft, TheNetherlands, on hydropowered pumping systems; Mr. H.C. van de Mandele, ofInternational Water Supply Consultants, Rotterdam, The Netherlands; and Mr.A.M. Mueller, of the International Land Reclamation and Irrigation Institute,Wageningcn, The Netherlands, on comparative cost analysis of pumpingsystems.
Various members of the IRC professional staff have contributed substantiallyto the preparation of the book:
Mr. S. Vcenstra assisted in the selection and evaluation of source materials, andcontributed to the writing of several sections; Ms. Christine van Wijk-Sijbesmareviewed the draft and contributed specifically to the sections on planning,community involvement, and health education; Dr. A.T. White contributedmaterial for various sections, specifically on the selection process for renewableenergy pumping devices.
XIV

IRC is particularly grateful for the critical review and constructive commenton the final draft document, given by:
Mr. J. Freedman, of the World Bank, Washington, DC, USA; Dr. J. Christmas,of UNICEF, New York, USA; Mr. J. Boer, of the Ministry of Foreign Affairs(Directorate General for International Cooperation), The Hague, TheNetherlands; Mr. R. Trietsch, of DHV Consulting Engineers, Amersfoort, TheNetherlands; Mr. T. Lium, of Norconsult Consulting Engineers, Sandvik,Norway; and Mr. P. Bruy&re, of the Groupe de Recherche et d'Echanges dcTechnologie, Paris, France.
XV


1. Energy sources for small communitywater supplies
In developing countries, sources of energy commonly used for community watersupplies are human muscle, diescl fuel, and electricity. Hand pumps may beused in small rural communities, but in larger communities the waterrequirement is usually far beyond the capacity of a single hand pump. In suchcases, additional hand pumps may be provided, but one larger pumping systembased on a diesel pump or electric pump may be more attractive. However, thehigh costs, difficulties of ensuring regular fuel supplies and meeting theoperation and maintenance requirements, make the use of these pumps lessattractive for communities in remote areas.
Thus, interest in renewable sources of energy, such as solar energy, windenergy, hydropower and biomass fuels has increased. Pumping systems basedon these energy sources have become technically reliable and economicallyattractive, particularly for small water supply systems with a capacity of up toabout 250 nvVd. The number of people to be served by a pumping system of thissize varies, depending on climate, water use practices and convenience ofsupply. Usually, water use is between 20 and 100 litres per person per day, butmay be higher if the system is also used for watering livestock or for small-plotirrigation.
1.1 ENERGY REQUIREMENT
To lift water from its source to a higher elevation requires a source of energy, adevice for energy conversion, and a water pumping device. For example, toconvert wind energy to a form suitable for the pump, a rotor is used to producemechanical shaft power which can be transmitted to the pump. In solar-powered, photovoltaic pumping systems, the electricity generated by the solarcells is transmitted to an electric motor which drives the pump. An overview ofenergy sources used for water pumping and devices for energy conversion ispresented in Figure 1.1.

human energy
animal energy
fossil fuel
electricity (grid)
hydropower
wind energy
solar energy
biomass energy
HANDLE MECHANISM
TRANSMISSION RACK
COMBUSTION ENGINE
ELECTRIC MOTOR
HYDRAULIC RAM PUMP
TURBINE OR RIVER-CURRENT ROTOR
LOW SPEEDMULTI-BLADEWIND ROTOR
HIGHSPEEDELECTRICITYGENERATINGWIND ROTOR+ELECTRIC MOTOR
PHOTOVOLTAICARRAY+ELECTRIC MOTOR
DIGESTER+COMBUSTION ENGINE
GASIFIER+COMBUSTION ENGINE
ALCOHOL FERMENTER+COMBUSTION ENGINE
Figure 1.1: Overview of energy sources and conversion devices for water pumpingsystems

ENERGY SOURCES
The energy requirement for water pumping is determined by the quantity ofwater to be lifted, the head over which it is to be lifted, and the overall energyconversion efficiency of the pumping system. The energy requirement isproportional to the first two factors, and inversely related to conversionefficiency, which indicates how much of the energy input is actually used to liftthe water (Figure 1.2).
Energy losses in conversion
y ^ " -•- ^ Energy losses in pump
vHydraulic energy output
Figure 1.2: Indication of energy losses in the water pumping system (Kenna, 1985)
The energy requirement per second, that is the power required tor pumpingwater, can be calculated with the following equation:
r _ pw - g • Q • HT]
where:P = power requirement (watt)Qw = specific weight of water (kg/1)g = gravity acceleration factor (m/s2)Q = output rate (1/s)H = pumping head (m)n = overall efficiency of pumping system (%)

For example, to pump water having a specific weight of 1 kg/1, at a rate of onelitre per second through a head of 10 m, using a pumping system of 20% overallefficiency, at a location where the gravity acceleration factor is 9.8 m/s2, wouldrequire a power input of 500 watt (W), or 0.5 kilowatt (kW). If thispumping system operates eight hours a day, the daily water output would be8 x 3600 = 28 800 1/d = 28.8 m3/d against a head of 10 m, for an energyrequirement of 8 x 0.5 = 4 kilowatt-hour (kWh).
1.2 CONVENTIONAL ENERGY SOURCES
Human energy
The use of hand pumps or foot-operated pumps is limited to where the waterrequirement, and thus the energy requirement for pumping, is fairly low.
Little information is available on human energy output for work, such aswater pumping. This will depend on the strength and age of the pump user, theduration of the task, and the ambient conditions. At a comfortable level, thehuman power output over a prolonged period may be estimated to be 50-75 W.Thus, individuals can produce an energy output of 0.4-0.6 kWh in eight hours.With this energy output, about 8-12 m3 of water can be pumped against apumping head of 10 m, assuming the mechanical efficiency of the pump to be50%. As the muscles of the legs are more powerful, foot pumps can producemore water than hand pumps. However, these pumps are not very popular withwomen and children, and because of the mode of operation, their reliability islimited.
Field experience indicates that hand pumps are being operated up to 12, oreven 16, hours per day, but because they are not used continuously, the effectivepumping time is about half. Using the maximum of eight hours effectivepumping as the criterion, one hand pump on a well 20-30 m deep could supplybetween 4 and 5 m3 water, serving 150-200 people with 25 litres per person perday (Table 1.1).
Animal energy
Over a period of eight to ten hours per day, the average energy output of adraught animal is generally five to ten times greater than that of a man. Ananimal of 500 kg body weight, driving a suitable pumping device, can thus lift25-50 m3 of water against a head of 10 m in eight to ten hours, assuming an

ENERGY SOURCES
Table 1.1: Time required for water pumping*
Pumping depth(m)
51020304050
Pumping time (hours) to supply20 litres/person/day
2m3
0.71.52.94.55.97.4
3m'
1.12.24.56.78.6
4m'
1.52.95.98.9
5m'
1.83.77.4
Power output of pump users: 50 W (average)Efficiency of pumping: 50%Number of effective hours operation per day: 8
efficiency of 20%. Animals are used mostly with slow-moving pumping devicesto lift water for irrigation, for example, water wheels, chain pumps, and bucketand rope devices. Animal power is not used very often for community drinkingwater supplies, possibly because animals are owned by individuals. Therefore,animal power is not considered further.
Diesel fuel
In small-scale pumping systems, low-speed diesel engines are used. A suitablepower transmission, such as a gearbox or belt drive, and a clutch mechanism arerequired to connect the engine to the pump. Small diesel engines have anefficiency of about 10-15%. Because of additional power losses in powertransmission and in the pump, the conversion efficiency is normally 5-10%, butactual efficiency under field conditions depends heavily on the level ofmaintenance of the engine. Diesel engines require extensive maintenance and aregular supply of fuel and spare parts, which small communities have difficultiesin meeting. Moreover, the lifetime of diesel pumps is limited. Diesel poweredpumps also have the disadvantage that the power output is relatively high forsmall community water supplies, since engines of less than 3 kW rated poweroutput are not available. Petrol and kerosene engines are less efficient and moreexpensive to operate than diesel engines, and therefore are rarely used forcommunity water supply.

Electricity
Electric motors are produced in various sizes and to a wide range ofspecifications. The energy conversion efficiency, that is "wire-to-water", of anelectric motor pump is about 30-40%. Electricity as a source of energy for waterpumping is only economical if a reliable power supply from the mains grid isavailable close to the pump installation, say within one kilometre. In mostdeveloping countries this is rarely the case, and electricity is not a very attractiveenergy source because of frequent interruptions to the supply, and large voltagefluctuations. Therefore, its use for small-scale water pumping is generallylimited, mostly to small communities in close proximity to larger towns.
1.3 RENEWABLE ENERGY SOURCES
The technical reliability, performance, and cost of pumping systems usingrenewable sources of energy has now reached the point of being competitivewith pumping systems using conventional sources. This is particularly the case insmall-scale water supplies with a capacity of less than 250 m3/d. The capital costof renewable energy pumping devices is relatively high, but they can be cost-effective because of their low running costs. There are no costs for fuel supply,and the recurrent costs for operation and maintenance are limited. Localmanufacture within the country or region could reduce the capital cost, and inmany situations would then make these pumping systems cost-effective incomparison with conventional systems. However, most renewable energydevices require a high level of production technology for their manufacture, andskilled technicians for maintenance and servicing.
Hydropower
A wide range of water pumping devices have been developed which use theenergy of flowing water. Here, attention is focused on small hydro-poweredpumping devices which convert the energy of flowing water directly intomechanical power to drive a pump. These systems pump water from surfacesources, and can operate continously. There are three main types of hydro-powered pumps for small community water supply:- hydraulic ram pumps;- turbine pumps;- river-current pumps.

ENERGY SOURCES
Hydraulic ram pumps use the kinetic energy of water running through a drivepipe to lift a small proportion of that water to a higher level than the supplysource (Figure 1.3).They can operate reliably where there is a steady andcontinuous supply of water with a fall of 0.8 m or more. Ram pumps haveconsiderable potential to lift water for small community supplies fromunpolluted streams or springs in hilly or mountainous areas.
Storage tank
Supply source
Figure 1.3: Main features of a hydraulic ram pump installation (Watt, 1975)
Turbine pumps have a submerged runner coupled to a pump on the same shaftso that the rotational power is directly transmitted to the pump. In contrast toslow-moving water wheels, they operate at relatively high speeds, and can worksatisfactorily under a head as low as 0.5 m, for example, at a weir in a river.

River-current pumps are mounted on a floating platform. They have a partlysubmersed rotor which rotates by the force of the river current. The rotor shaftpower is transmitted to the pump by a transmission mechanism, such as gears ora drive belt, which also multiplies the rotational speed to the required level forefficient pumping.
Wind energy
Wind energy has been used for various purposes for more than 2000 years, and iswidely used today in many countries for irrigation and drainage. Since the early19th century, the windmill with four large blades has been used in theNetherlands for drainage. The potential for using wind power to pump water insmall-scale systems is greatly affected by the local wind speeds and the windregime. For example, at a wind speed of 5 m/s, a power output double that at a
Rotor
Figure 1.4: Wind pump with multi-blade rotor (Brown, 1978)
ENERGY SOURCES
wind speed of 4 m/s can be generated. A wind-powered pumping system, orwind pump, consists of a rotor, a pump, and a power transmission mechanismconnecting the rotor to the pump. The most common type of wind pump has amulti-bladed rotor mounted on a horizontal axis which transmits the power tothe pump through a rod (Figure 1.4). Most wind pumps of this type operate "upwind", that is facing the wind. Generally, they have a control system to protectthe rotor against overspeeding, that is, rotating too fast in high winds. Thecontrol system either stops the rotor or turns it out of the wind when wind speedsbecome excessive.
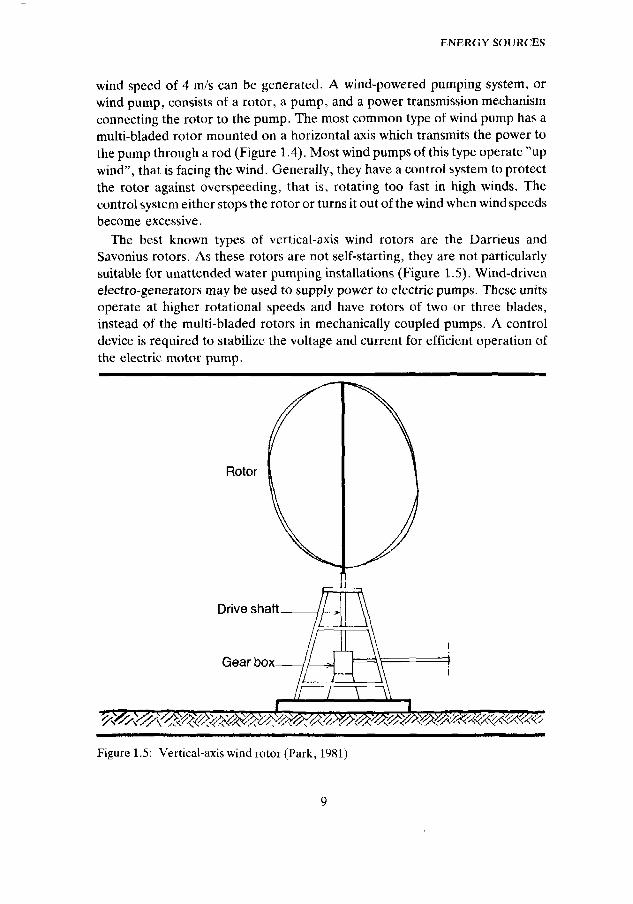
The best known types of vertical-axis wind rotors are the Darrieus andSavonius rotors. As these rotors are not self-starting, they are not particularlysuitable for unattended water pumping installations (Figure 1.5). Wind-drivenelectro-generators may be used to supply power to electric pumps. These unitsoperate at higher rotational speeds and have rotors of two or three blades,instead of the multi-bladed rotors in mechanically coupled pumps. A controldevice is required to stabilize the voltage and current for efficient operation ofthe electric motor pump.
Rotor
Drive shaft
Gear box
I \ V
Figure 1.5: Vertical-axis wind rotor (Park, 1981)
Although the capital costs of wind pumps are higher than for diesel pumps orelectric pumps of the same output capacity, lower running costs and longerservice life can make wind pumps economically attractive in areas of sufficientwind and suitable wind regime. In areas with relatively long windless periods,large water storage tanks are required and wind pumps are then unlikely to beeconomical.
Solar energy
There are two fundamentally different devices to use solar energy for waterpumping, namely thermodynamic devices and photovoltaic systems. Forthermodynamic conversion of solar energy, several types of heat engines can beused to produce mechanical energy to drive a pump, the most well-known beingthe steam engine and Rankine engine. However, small thermodynamic pumpingsystems generally have a low efficiency, are quite complicated, and to date, havenot performed adequately under field conditions.
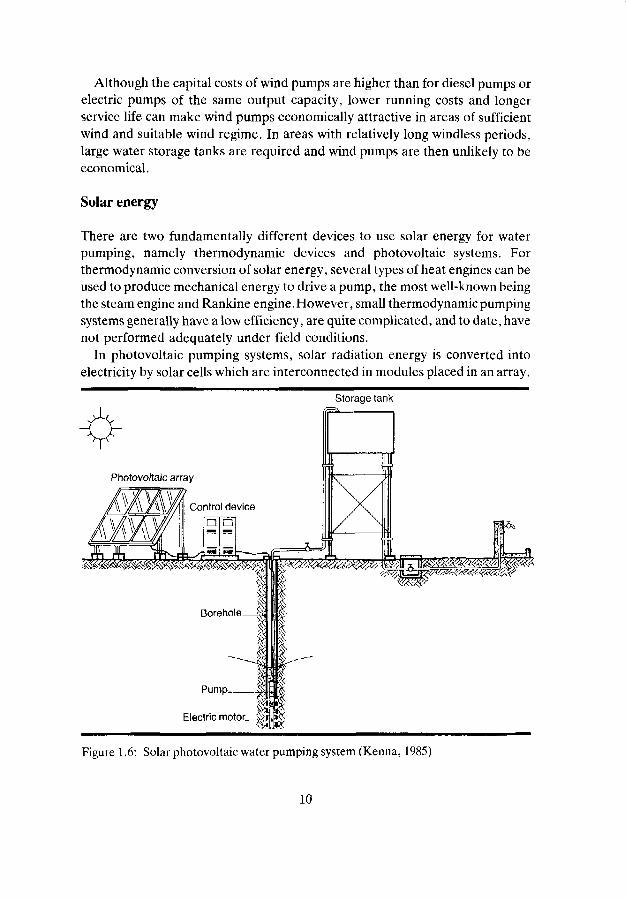
In photovoltaic pumping systems, solar radiation energy is converted intoelectricity by solar cells which are interconnected in modules placed in an array.
Storage tank
Photovoltaic array
Control device
Electric motor.
Figure 1.6: Solar photovoltaic water pumping system (Kenna, 1985)
10

ENERGY SOURCES
A number of these systems arc commercially available, technically reliable, andhave performed well under field conditions. A control device is usually, but notalways, incorporated to stabilize the fluctuating voltage and current of theenergy output of the array. If the electric motor used is designed for alternatingcurrent, then an inverter is required to convert the direct current supplied by thearray into alternating current (Figure 1.6). The modularity of photovoltaicpumping systems is a distinct advantage. If more power is required, the solararray can be easily expanded by adding more modules. By contrast, a largerdiesel engine would have to be installed for greater output if this was the powersource. Photovoltaic pumps have considerable potential for remote areas wheresolar conditions are favourable.
Energy from biomass
Biomass is widely used as a source of energy, mainly for cooking and heating, inmany developing countries, especially in rural areas. Human and animalexcreta, household waste, wood, crop residues, or aquatic weeds, can beprocessed to combustible gases, such as biogas and producer gas, or combustibleliquids, such as alcohol, methanol or vegetable oil. These gases and liquids canbe used as fuel for small engines to drive water pumps.
Biogas is produced in a digester, a specially constructed tank in which a slurryof biomass mixed with water reacts. The biogas produced consists mainly ofmethane (50-60%) and carbon dioxide (40-50%).The main features of a
Gas delivery pipe
Inlet
Digester.
Figure 1.7: Main features of biogas digester (Hall, 1982)
11

digester are shown in Figure 1.7. The feasibility of biogas production dependson the ambient temperature, the regular supply of suitable biomass throughoutthe year, and the availability of skilled manpower to operate and maintain theplant. Often, the main barriers to the use of biogas systems are socio-culturaland organizational.
The process of gasification involves the partial burning of solid biomass, suchas wood, charcoal, coal, coconut husks or maize cobs, to produce a combustiblegas, known as producer gas. Alcohol can be produced from plants with a highcontent of sugars or starches, such as sugar-cane, sorghum and cassava, and maybe used directly, or after mixing with gasolene, as fuel to drive an engine.Vegetable oils, such as sunflower oil, can also be processed to produce fuel foruse in engines.
12

ENERGY SOURCES
BIBLIOGRAPHY
- Brown, N.L. (ed.) (1978). Renewable energy sources and rural applications in thedeveloping world. New York, USA, American Association for the Advancement ofScience.
- Comite Inter-Etat d'Etudes llydrauliques (1980). Energie au service de l'hydrauliquerural. Ouagadougou, Burkina Faso, Comit6 Inter-Etat d'Etudes llydrauliques.
- Giri, J., and Meunier, B. (1977). Evaluation des energies nouvelles pour ledeveloppement des etats africaines (Collection "Technologies et Developpement"No.l). Paris, France, Ministere dc la Cooperation.
- Gourieres, D. le (1982). Energie eolienne. Paris, France, Editions Eyrolles.
- Hall, D.O., Bernard, G.W., and Moss, P.A. (1982). Biomass energy for developingcountries. Oxford, UK, Pergamon Press.
- Kenna, J.P., andGillet, W.B. (1985). Solar water pumping: a handbook. London, UK,Intermediate Technology Publications Ltd.
- Lysen, E.H. (1983). Introduction to wind energy (CWD Publication 82-1).Amersfoort, The Netherlands, Consultancy Services Wind Energy DevelopingCountries.
- National Academy of Sciences (1976). Energy for rural development: renewableenergy sources and alternative technologies for developing countries. Washington,DC, USA, National Academy of Sciences.
- National Academy of Sciences (1981). Energy for rural development: supplement.Washington, DC, USA, National Academy of Sciences.
- Park, J. (1981). The wind power book. Palo Alto, California, USA, Cheshire Books.
- Sema S.L. (1978). Energies nouvelles et developpement (Collection "Technologies etD6veloppement" No.2). Paris, France, Ministere de la Cooperation.
- Watt, S.B. (1975). Manual on the hydraulic ram for pumping water. London, UK,Intermediate Technology Publications Ltd.
- Wood, A.D. (1976). Water lifters and pumps for the developing world. Tucson,Colorado, USA, Colorado State University.
13

2. Considerations for selection of energysource
In selecting the most appropriate renewable energy source for small waterpumping systems, environmental, social, technical, and economic factors arc tobe considered. Environmental conditions in the area may reduce the feasibilityof certain renewable energy sources, for example, the average wind speed maybe less than required for economic use of wind pumps. The social organization,available skills, and infrastructure may not be adequate to cope with thetechnical requirements of certain pumping systems. In large-scale nationalprogrammes, organizational, technical, and economic limitations are notnecessarily decisive because many of these can be overcome. Tf a large numberof pumping systems arc to be installed, then lack of trained manpower,weakness in organizations, or inadequate maintenance facilities, are no finalconstraints. If a national government is interested in introducing renewableenergy pumping systems, then large-scale application can be prepared throughtraining programmes and the development of infrastructures for the functioningand maintenance of these pumping devices. For a large number of units, it mayalso be feasible to initiate local production of renewable energy pumpingdevices.
For small local projects concerned with installation of one or a few pumpingsystems at individual locations, selection is restricted by the limitations of localinfrastructure, technical capabilities, skills and materials. The installation of apumping device which has operation and maintenance requirements beyondthese limitations, would inevitably lead to failure and wastage of funds, oralternatively make the community dependent on external support.
Systematic assessment of all relevant factors should be made in the selectionof appropriate energy sources for water pumping (see Figure 2.1). In this way,one or more renewable energy sources can be pre-selected. However, availabledata are often neither adequate nor reliable, and a pilot project may be requiredto study and test the feasibility of the pre-selected energy sources and pumpingsystems. These projects are of particular relevance for rural water supplyprogrammes in countries having little experience with the use of renewableenergy devices. On the basis of the present state-of-the-art and cost data from1985, the general order of preference for selection is hydropower, wind energy,solar energy, and biomass energy.
14

CONSIDERATIONS FOR SELECTION
Factors
Environmentalfeasibility
Technicalfeasibility
Socialfeasibility
Economicfeasibility
Selection criteria
Availability ofenergy sources
Existing level oftechnologicalinfrastructure
Social acceptabilityof energy sourceand pumping device
Cost-effectivenessof energy device
Information required
- data on energysources
- hydrology- climate- topography
- design- manufacture- installation- operation- maintenance
- social structure- organization- potential for
productive water use- willingness and- capacity to pay
- cost data- time profile of costs- economies of scale- local manufacture
Figure 2.1: Systematic assessment of relevant factors in selection of energy sources forwater pumping
2.1 ENVIRONMENTAL FEASIBILITY
Data base
A first indication of the availability of renewable energy sources in the studyarea may be obtained from maps showing the world distribution of thesesources. There is a general relationship between availability of renewableenergy and climate (Barnett, 1982). In arid tropical zones encompassing theSahel region, Saudi Arabia, Iran and Pakistan, Peru and Chile, and most ofAustralia, solar energy is abundant, whereas the scope for hydropower andbiomass energy is limited. In humid tropical zones, such as the Amazon andCongo river basins, the southern part of west Africa, central Africa, parts of
15

Kenya and Tanzania, Madagascar, most of Malaysia, parts of Thailand,Indonesia and Papua New Guinea, hydropower and biomass energy are likely tobe promising, but solar energy is less attractive because of the relatively longcloudy periods during the rainy season. Where there is a distinct wet and dryseason, such as in central Africa around the equator, southern Venezuela andeastern Brazil, a detailed analysis of the seasonal variation is required to assessthe potential of renewable energy sources throughout the year. Good windregimes are found mostly in coastal areas where the winds are relatively strongand regular throughout the year. For example, in the coastal areas of SouthAmerica, the Atlantic coast of west Africa, the plains of northern Africa, andalso in Malaysia, Indonesia, the Philippines, and most of the Pacific islands,there is potential for wind power. The minimum requirements forenvironmental feasibility of pumping devices using renewable energy are givenin Table 2.1.
Table 2.1: Indication of minimum requirements for environmental feasibility ofrenewable energy sources
Renewable energy source Minimum requirements for environmental feasibility
Micro-hydropower
hydraulic ram pumps
Wind energy
wind pumps
average monthly flow rate of at least 3-5 1/s in combinationwith a hydraulic head of at least 1 m
river-current pumps minimum current speed of 1 m/s
average annual wind speed greater than 3.5 m/s
average wind speed in least windy month more than 2.5 m/
Solar energy
photovoltaic pumps
Biomass energy
biogas production
gasification
alcohol production
average annual solar irradiation at least 15 MJ/m2/d(4.0 kWh/m2/d)
solar irradiation in least sunny month more than12.5 MJ/m2/d (3.5 kWh/m2/d)
clearness factor (lack of clouds) at least 60%
humid climate, annual average temperature higher than15°C
50-100 kg of dry wood or crop waste of 10-20 ha per day
200-400 ha of land for energy crop production
16
CONSIDERATIONS FOR SELECTION
The initial assessment of the potential of the various energy sources must befollowed by more detailed study to determine the potential within the particularcountry or region. This can be done on the basis of available or collected data,such as wind regime, ambient temperature and solar irradiation. Suchinformation is sometimes available from national institutions andmeteorological stations, or from the World Meteorological Organization,Geneva, Switzerland. Preferably, the data should cover a period of five or moreyears to establish, to a reasonable degree of accuracy, the annual and monthlyaverage values for the particular area.
If sufficient, reliable data are not readily available, data will have to becollected. At least one year's record of essential data is required, from which asufficient indication of monthly and seasonal variation can be obtained. In somecases, it may be possible to extrapolate to a reasonable degree of accuracy usingdata from other locations. For example, an estimate of the monthly averagesolar irradiation may be derived from data for neighbouring countries. Windspeed values cannot be extrapolated from data for other regions however,because they are greatly affected by local topography and are therefore likely toshow considerable variation. Because of the cost, data collection should berestricted to the essential. In some areas, the general conditions may stronglyfavour a particular renewable energy source, and data collection may then berestricted to that option.
Hydropower
The number of locations suitable for the use of hydropowered pumping systemsis limited in most countries and regions. The main requirement is a continuousand adequate flow of water of sufficient fall, throughout the year.For most smallstreams, rivers and springs, flow data for long periods are not available and thus,local measurements must often be made. Further, because hydropoweredpumps draw water from surface water sources or spring-fed streams, thesuitability of the water for drinking and domestic use must be assessed.
Wind energy
In locations where the average wind speed is higher than 3.5 m/s, and the meanwind speed in the least windy month greater than 2.5 m/s, wind can be anadequate and reliable source of energy for water pumping. A record of averagehourly wind speeds over a period of at least one year, and preferably over one-and-a-half years, is required to determine whether wind-powered pumpingsystems are feasible. Wind speed data for the least windy month are necessary to
17

assess whether wind pumps are economically feasible, because the length ofwindless periods determine the storage capacity required to ensure a reasonablyreliable water supply, and thus to a large extent the cost of wind-poweredpumping systems.
Solar energy
Areas with solar irradiation levels and a clearness factor which meet therequirements given in Table 2.1 for solar photovoltaic pumping systems, arefound mostly between the Tropics of Cancer and Capricorn.In arid tropical zones, average daily irradiation is often as high as 15-20 MJ/mz/d(4.0-5.5 kWh/m2/d), which is quite sufficient for solar pumping systems.Irradiation levels are generally less in humid tropical areas, but may still besufficient for operation of solar pumps. Photovoltaic pumping systems areconsidered to be environmentally feasible in areas with an average dailyirradiation greater than 12 MJ/m2/d. Thermodynamic pumping systems have notas yet been developed sufficiently to warrant consideration as a feasible andviable option for small-scale water pumping systems.
Biomass energy
Generally, biomass energy is environmentally feasible in humid tropical areaswhere ambient temperatures throughout the year are above 15°C, and wherethere is sufficient rainfall and sunshine, and favourable soil conditions, to ensurea continuous and generous supply of suitable biomass. Because of the minimumsize of a biomass processing plant and the concomitant economics, biomassenergy is only worth considering for water pumping duties above 150 m3/d.
Biomass conversion is regarded principally as an energy productiontechnology, but has additional environmental benefits because it can improvewaste disposal and produce fertilizer for agricultural production. Wherebiomass energy for water pumping is considered, due attention needs to be givento safeguarding the supply of suitable biomass in the long term.
2.2 TECHNICAL AND SOCIAL FEASIBILITY
Water pumping devices using renewable energy sources vary considerably intechnical complexity, and thus in operational and maintenance requirements. Ingeneral, complex pumping systems, often imported, require more qualified
18

CONSIDERATIONS FOR SELECT ION
attention than simple locally manufactured equipment, but less frequently. Forexample, maintenance of photovoltaic pumping systems requires a visit by amobile team of qualified technicians once or twice a year. By contrast,hydropowered pumps and wind pumps can be maintained on a regular basis bylocal mechanics. Engine pumps running on a mixture of diesel and biomass fuelrequire extensive maintenance and frequent servicing, generally about onceevery two to three months. Most renewable energy pumping systems require awell-established back-up support for maintenance (Table 2.2).
Table 2.2: Frequency of maintenance attention and level of technical skills required forvarious types of pumping devices
Energysource
Renewable
micro-hydropower
wind energy
solar energy
biomass energy
Conventional
human energy
diesel fuel
electricity
Type of pumpingdevice
hydraulic ramturbine pumpriver-current pump
commercially manufacturedintermediate technologyvillage level product
solar photovoltaic
biogas digestergasification unitalcohol fermenter
hand pump
diesel engine
electric motor
Frequency ofmaintenanceattention1
lowlowlow
lowmediumhigh
low
highhighhigh
medium
medium
low
Technicalskills2
lowmediumlow
mediummediumlow
high
mediumhighhigh
low
medium
medium
1 Low, once a month; medium, once a week; high, daily2 Low, locally trained villagers; medium, trained operators (local mechanics,
carpenters, blacksmiths); high, qualified technicians
Provision for operation and maintenance must be made before pumpingequipment is installed. Arrangements should be made so that the usercommunity, the water supply agency, and the local authorities each have clearlydefined responsibilities for management, operation and maintenance of thepumping system. These arrangements must be made in consultations with the
19

user communities so that they are fully informed of, and agree with, theirresponsibilities and rights in each stage of the project.
The back-up service for maintenance and repair may be either centralized ordecentralized, depending on the complexity and frequency of maintenancerequirements. The technical and organizational capacity of user communities isone of the determining factors in the choice of pumping system. Other factorsare the available infrastructure, the social organization of the user communities,transport facilities and costs, and any existing maintenance structure. A generalindication of back-up service requirements is given in Table 2.3.
Table 2,3: Indication of back-up service requirements for various types ofpumping systems
Energy source
Renewable
micro-hydropower
wind energy
solar energy
biomass energy
Conventional
human energy
diesel fuel
electricity
Type of pumpingdevice
hydraulic ramturbine pumpriver-current pump
commercially manufacturedintermediate technologyvillage level product
photovoltaic
biogas digestergasification unitalcohol fermenter
hand pump
diesel engine
electric motor
Frequency ofback-up supportrequired1
lowlowlow
lowmediumlow
low
mediummediumhigh
low
medium
medium
Level ofback-upservicerequired2
lowmediummedium
highmediumlow
high
mediumhighhigh
medium
high
high
1 Low, once a year; medium, once every 3-4 months; high, once a month2 Low, local mechanic; medium, specially trained mechanic; high, qualified technician
Construction and installation of the pumping systems may require specialexpertise, which is often not readily available within the national organization orwater supply agency. Therefore, training will be needed to develop the capacityto ensure quality of construction and reliability of installation.
20
CONSIDERATIONS FOR SELECTION
A guiding principle for rural water supply programmes is that everycommunity involved should participate actively in the choice of pumpingsystem, so that local needs and preferences are taken into account, and theconsequences of the various options are known to the users. The impact of thenew pumping system on the local situation needs to be assessed and this mayrequire extensive discussions with future users, particularly women. Somegroups within the community may benefit more than others if, prior toinstallation, agreement is not reached on the use of water for small-plotirrigation, livestock watering and similar productive uses. For example, systemsrequiring large-scale collection of biomass may disadvantage the poor. In manysocieties, women of poorer groups have the right to collect organic waste, suchas cow dung; they may well lose this benefit if it becomes financially attractivefor other groups to collect this biomass.
It is often necessary to establish some form of local organization, such as awater committee, to participate in the selection and supervision of local pumpcaretakers, and to arrange for collection of water charges and provision oflabour support. The importance of the development of a suitable organization,and of upgrading local skills, is often underestimated. A minimum level oforganization and skills is required at the local level to ensure proper use andmaintenance of pumping systems, and to establish the regular collection ofwater charges. For biomass collection and use, local organization is especiallyimportant, and includes the need to ensure payment to the suppliers of biomass.Pilot projects provide a useful opportunity to experiment with, and establish,the most appropriate ways of involving the community.
Hydropower
Hydropowered pumping devices require only limited maintenance, such asoccasional checks on the moving parts, cleaning the water intake, and routinework, including greasing and bolt tightening. The supply of spare parts forimported hydropowered pumps may be quite difficult to arrange unlessguaranteed by the back-up service organization. In general, these pumpingdevices do not require a full-time operator; an attendant may be appointed tocheck the pump occasionally and to carry out routine maintenance. However,water treatment will often have to be provided because surface water is pumpedand supplied directly, and users are thus exposed to pollution hazards.
Civil works are required to install hydropowered pumping devices, forexample, a small dam or weir to control the flow of water to the pumping device.The extent of the civil works depends on the site, but if building materials areavailable locally, these works can usually be constructed by local labour orcontractors.
21

Hydraulic ram pumps may require the diversion of a considerable proportionof the water from the source. This may lead to conflicts over water use withcommunities downstream. Therefore, the possible consequences of ram pumpsmust be discussed with various communities, and agreement reached beforeimplementation.
Sturdy ram pumps are commercially available from manufacturers in Europe,North America, India, Japan and Taiwan. However, small industries or localworkshops in many developing countries should also be able to manufacturesimple ram pumps, or assemble them from locally available parts. Some simpleram pumps arc actually being manufactured in India, Kenya, Tanzania andZambia.
Turbine pumps are currently manufactured only in the People's Republic ofChina, where they have established a record of proven design and performance.River-current pumps arc of relatively simple design and may be suitable tor localmanufacture from available parts and materials.
Wind energy
At present, most commercially available wind pumps are manufactured inindustrialized countries and shipped to developing countries. These pumps aregenerally well-designed, efficient, and sturdy, but expensive, and maintenanceand repair are difficult because spare parts have to be imported. Wind pumps ofrelatively simple design can be manufactured locally and more cheaply, butrequire more maintenance and repair. If complex parts, such as gears or othertransmission mechanisms are used, these may have to be imported.
Wind turbulence and changing wind speeds produce a fluctuating load on thetower, which can cause fatigue failure of inadequately constructed parts andmaterials. Therefore, proper design and construction of the tower andfoundation, and careful alignment of the transmission mechanism, are essentialfor reliable operation of wind pumps.
The moving parts of wind-powered pumping systems are subjected to varyingloads, fatigue, corrosion and dust, and therefore, regular servicing andmaintenance arc required to ensure reliable performance. A local caretakermust be available to carry out routine maintenance, such as bolt tightening,greasing and lubrication. Locally manufactured wind pumps often requirefrequent maintenance attention. For major repairs, back-up support is requiredfrom a service organization or a local workshop.
Installation of a wind pump sometimes requires the removal of trees aroundthe wind rotor. It may be necessary to compensate those who lose the benefit ofusing these trees by allowing them, for example, to use the excess waterproduced in periods of high wind for small-plot irrigation, livestock watering, orsimilar productive uses.
22

CONSIDERATIONS FOR SELECTION
Solar energy
At present, photovoltaic solar pumping systems are only available frommanufacturers in industrialized countries.These systems are offered as apackage consisting of the solar array, the motor-and-pump subsystem, andancillary equipment.In a number of developing countries, there appears to bescope for local assembly, and in some countries it may be possible to establishlocal manufacture. Photovoltaic pumping systems should be installed by skilledtechnicians, according to the manufacturers' instructions.
Maintenance requirements of these systems are limited. Regular cleaning ofthe transparent surface of the solar array, and checking the electric controls,may be all that is required on a routine basis. In addition, periodic replacementof the brushes is required for brushed motors. Arrangements for reporting faultsor breakdown to the back-up service should be made, because all major repairscan only be carried out by trained mechanics. As the number of photovoltaicsolar pumping systems in operation for domestic water supply increases, moredata on field performance will become available, thus permitting more accurateassessment of the maintenance and servicing requirements.
Biomass energy
Biogas production plants are used in many developing countries, particularly inChina and India. The major components of the plants can be manufacturedlocally, but some of the more complex parts arc only produced in smallindustries. Gasifiers and alcohol fermentation plants are mostly available fromindustrialized countries, but can be manufactured in developing countries. Inthe Philippines, gasifiers are manufactured commercially with governmentsupport, and there is considerable experience in Brazil in the manufacture ofalcohol fermentation plant. Installation of gasifiers and fermentation units isrelatively easy, but careful attention must be given to site selection to avoidproblems of smell, smoke and dust.
In general, a biomass processing plant requires a trained operator and aconsiderable amount of unskilled labour to collect the biomass. In rural areas ofmost developing countries, biomass is a source of fuel for many purposes,including cooking and heating. Therefore, introduction of biomass energyproduction for water pumping may only be feasible if a generous supply ofbiomass is available to avoid creating a scarcity for traditional uses. The use ofbiomass to produce fuel for water pumping must be discussed with thecommunity, to avoid conflicts about present collection and use, often by thepoorest sections. The regular supply of biomass required for water pumping canrarely be assured on a voluntary basis at no cost.
23

The maintenance requirements of pumping systems running on biogas,producer gas, or alcohol, are similar to those of small engines and fuelproduction plant generally.
2.3 ECONOMIC FEASIBILITY
Cost analysis
Cost analysis is a useful tool to support selection of the renewable energy sourceto be used for water pumping systems in the study area. Since both the capitaland the recurrent costs must be assessed, it is necessary to use discountingtechniques because the various types of pumping systems under considerationhave different time profiles of costs. For example, for solar pumps, the capitalcost is relatively high and may represent more than 70-75% of total lifetimecosts, while for diesel pumps, the capital cost is relatively small and may be nomore than 25-30% of total lifetime costs (see Figure 2.2).
Solar pump Diesel pump
Cost Cost
0 1
[ZZ3 Capital cost
N 0
Recurrent costs
'//A1
N: Lifetime
N
Figure 2.2: Comparison of time profile of costs for solar pump and diesel pump
The distribution of capital and recurrent costs can affect the level of thefinancial contribution to be charged to the users. In rural water supplyprogrammes, capital expenditure is often financed from government or donorfunds, while recurrent costs are paid fully or largely by the users. Thus, usercommunities may expect to be charged less for a capital-intensive, low recurrentcost pumping system than for a system with high recurrent costs. An indicationof the distribution of capital and recurrent costs for various pumping systems isgiven in Table 2.4.
24

CONSIDERATIONS FOR SELECTION
Table 2.4: Level of capital and recurrent costs of various types of pumping systems
Energy source
Renewable
micro-hydropower
wind energy
solar energy
biomass energy
Conventional
Human energy
diesel fuel
electricity
Type of pumpingdevice
hydraulic ramturbine pumpriver-current pump
commercially manufacturedintermediate technologyvillage level product
photovoltaicpumping system
biogas digester enginegasification unit enginealcohol fermenter engine
hand pump
diesel engine
electric motor
Capitalcost
lowlowlow
highmediumlow
high
mediummediummedium
medium
medium
medium
Recurrentcosts
lowlowlow
lowmediummedium
low
mediummediummedium
low
high
low
Effect of local manufacture
The capital cost of pumping systems powered from renewable energy sourcescould be reduced in large-scale production for national rural water supplyprogrammes. The minimum number of units required to initiate localmanufacture will vary from country to country. To stimulate local production,research and development of renewable energy technology needs to bepromoted. If research and development capabilities are not available in localindustries, local manufacture may be promoted by involving governmentresearch institutions or technical universities. While it is highly desirable toincrease self-reliance at both national and local level, at present, localmanufacture is often hampered by lack of suitable materials, essentialcomponents, and expertise, and initially the market may be too small to justifylocal production. Therefore, as an intermediate solution, consideration may begiven to local assembly of imported equipment, to reduce shipping and inlandtransport costs.
25

General indication of economic feasibility ranges
As yet, few systematically-collected cost data, based on field experience, areavailable to assess the economic feasibility of water pumping systems usingrenewable energy sources. Nevertheless, the general level of costs of the varioustypes of pumping systems has been calculated from global cost data, and on thisbasis, the economic feasibility ranges for the various energy sources have beenestimated (Figure 2.3). It must be emphasized that these ranges are indicativeonly, and that local cost data may give quite a different result. Thus, theeconomic feasibility of a particular pumping system can only be determinedreliably from local cost data. If several types of pumping systems appear to beeconomically feasible, comparison of unit output costs is important in the finalselection process. These unit costs are calculated per kWh of hydraulic energyoutput, or per cubic metre of water pumped (see Chapter 3).
5, Water output (m3/d)
V
CD
•5.
£
10
15
3 0
/
//
/ J*
^ /
//
/
/
/
/
t
/
10
//
&
/
/
/
/
/
//
/ g
f /
/
5 0
/
//
/
/
/\0
/
/
i
/
/
/
/
Hgure 2.3: Estimated range of economic feasibility of energy sources for a particularwater pumping duty
26

CONSIDERATIONS FOR SELECTION
2.4 PILOT PLANT STUDIES
Usually, the selection process will indicate one or two types of pumping systemshaving potential for use in the area or rural water supply programme understudy. Pilot projects are then essential to assess the performance of these devicesunder field conditions, to adapt technology to local conditions, to support theeconomic appraisal, and to experiment with methods of involving thecommunities.
Testing and monitoring of prototype pumping systems at universities orresearch institutes should be used primarily to gain experience and to improvedesigns. Pilot plants are useful to familiarize national authorities and engineerswith the new types of pumping systems, and to facilitate training of technicalfield-staff. The results of pilot plant studies must be checked by periodicevaluation, at least in the initial stage of full-scale implementation.
2.5 LOCAL SELECTION
If pumping devices powered from renewable energy sources are selected on alocal basis for one or a few locations, then the limitations posed by the technical,social and organizational constraints are much stricter than in largeprogrammes. The type of pumping device to be selected will have to fit into theexisting situation, that is, must be suitable for the available technical skills,workshop facilities, equipment, and capabilities for operation and maintenance.Usually, for these few installations it is neither economical nor possible toinitiate a training programme, or to establish a back-up service system. Theseconstraints are likely to limit severely the technical feasibility of most of thepumping devices under consideration. However, it is preferable to accept thislimitation rather than to install pumping equipment which will break down aftera short period of time. At an early stage, the feasibility of options should bediscussed with the community or its leaders, and they should be involved in thedecision-making.
The flow chart in Figure 2.4 can be used to check the feasibility of energysources for water pumping at a specific location. The entry point to the selectionchart is the available water source. The various sources of energy should beconsidered in the order in which they are generally rated as technically feasibleand economically attractive. Through this stcp-by-step process, the mostpromising type of pumping system is identified. If several energy sources appearto be feasible, a comparison of the costs per unit of water output should be made(see Chapter 3).
27

perennialsurfacewater streamavailable?
yes
waterqualityacceptable?
yes
minimumflow atleast 3 l/s?
yes
minimumhead atleast 0,5 m?
yes
flowexceeds20 l/s?
yes
considerturbine pump
treatmentfeasible?
yes
velocity of currentexceeds 1 m/s?
considerhydraulicram pump
yes
consider rivercurrent pumps
groundwateravailable atacceptable depth(60 m maximum)?
yes
yield of boreholeor well can meetmaximum daily waterrequirement?
yes'
waterqualityacceptable?
yes
reliable electricitysupply availablewithin 1 km?
yes
technical back-stopping for Oand M available?
yes
consider electricpumps
surface wateravailable?
yes
waterqualityacceptable?
no [yes
treatmentfeasible?
28

CONSIDERATIONS FOR SELECTION
- ' —
search forother sourcesc (.]• rain-water
no
treatmentfeasiblo?
yes
average wat least 3.J
nd speedm/s?
yes
minimum monthlyaverage wind speedat least 2.5 m/s?
yes
length and frequencyof calm periodacceptable?
yes
technical back-stopping for 0and M available?
yes
considerwind pumps
no
no
no—=,
no
average solarirradiation atleast 4.0 kWh/m'/d?
yes
minimum monthlyaverage solarirradiation atleast 3.5 kWh/m2/d?
yest
clearness factorexceeds 60%?
yes
can 0 and Mrequirementsbe met?
yes
consider solarpumps
no
no
no
no
minimum averagemonthly temperatureat least 15 "C?
yes
environmentalconditions ensuresufficient biomassresources availabletor use?
yes
technical back -stopping for O andM available?
yes
consider biomassfueled pumpingsystem
no
no
no
small reliablediesel enginesavailable?
yes
supply of fueland skills formaintenance canbe provided?
yes
consider dieselpumps
no
no
can hancbe maint
pumpsained?
yes
consider handpumps
Figure 2.4: Selection chart for determination of energy source(s) and pumpingsystem(s) to be considered for a particular location
29

BIBLIOGRAPHY
Barnett, A., Bell, M., and Hoffman, K. (1982). Rural energy and the third world.Oxford, UK, Pergamon Press.
Cairncross, S., Carruthers, L, andFeachem, R.G. (1980). Evaluation for village watersupply planning (IRC Technical Paper No. 15). The Hague, The Netherlands,International Reference Centre for Community Supply and Sanitation.
Elmendorf, M., and Buckles, P. (1981). Socio-cultural aspects of water supply andsanitation (World Bank Staff Paper No.28). Washington, DC, USA, World Bank.
French, D. (1982). The ten commandments of renewable energy analysis. WorldDevelopment 10,1,71-79.
Hofkes, E.H. (1983). Water pumping for rural water supply. Dakar, Senegal,Environment and Development Association (ENDA).
Saunders, R.J., and Warford, J.J. (1976). Village water supply: economics and policyin the developing world. Baltimore, Maryland, USA, John Hopkins University Press.
Scalafani, J. A. (1981). Popular participation and the Bahr-El-Ghasal domestic watersupply project: lessons and implications for UNICEF policy. Khartoum, Sudan,UNICEF.
Visscher, J.T., and Hofkes, E.H. (1982). Rural water supply development (1982).experiences from the Buba-Tombali Water Project, 1978-1981. The Hague, TheNetherlands, International Reference Centre for Community Water Supply.
White, A.T. (1981). Participation and education in community water supply andsanitation programmes: concepts, strategies and methods (IRC Technical PaperNo.17). The Hague, The Netherlands, International Reference Centre forCommunity Water Supply and Sanitation.
Whyte, A. (1983). Guidelines for planning community participation in water supplyand sanitation projects (Document ETS/83.8). Geneva, Switzerland, World HealthOrganization.
Wijk, C. van (1985). Participation of women in water supply and sanitation: roles andrealities (IRC Technical Paper No. 22). The Hague, The Netherlands, InternationalReference Centre for Community Water Supply and Sanitation.
30

3. Comparative cost analysis
The purpose of comparative cost analysis as presented in this chapter, is to assessthe cost-effectiveness of the pumping systems which have emerged in the pre-selection process. The cost analysis should be specific to the particular countryor region and findings should not be extrapolated to other countries or regions.
3.1 COST CATEGORIES
Basically, two cost categories are distinguished: capital costs and recurrentcosts. Capital costs are all costs incurred when the pumping equipment ispurchased and installed. Recurrent costs are incurred for operation,maintenance and repair throughout the lifetime of the pumping system andinclude the cost of fuel, replacement parts, wages and transport. The variouscosts in these two categories are listed in Table 3.1.
Cost comparison of various pumping devices need not necessarily take intoaccount all the components of the water supply system. The first step is toidentify those components common to the systems being compared, forexample, the distribution system or the borehole. These costs will be the samefor all types of water pumping systems, and therefore can be excluded from thecomparative cost analysis. However, it is useful to estimate the general level of
Table 3.1: Capital and recurrent costs of a water pumping system
Capital costs: landsite preparationfoundationspumping equipmentstorage tankpower supply equipmentprime mover (e.g., diesel engine, electric motor)pipework and appurtenancesinstallation and mounting (e.g., transport, labour)
Recurrent costs: consumables (e.g., fuel, lubricants)salaries and wagesspare parts and replacements
31

these costs when deciding on the type of pumping device. For example, if theconstruction cost of the distribution system and the borehole represent 85% ofthe total capital cost, then a cost difference in two pumping devices of 20%represents only 3% of the overall capital cost of the system.
3.2 CALCULATION OF COMPARABLE COSTS
For a valid comparative cost analysis, the capital costs and recurrent costs haveto be converted into comparable units. Two methods can be used for thispurpose:- present value;- equivalent annual cost.
Present value method
The "present value" of future recurrent costs can be calculated by discountingthem at an appropriate rate, the discount rate. If there is no price inflation, theprevailing interest rate, if not regulated by governmental control measures, maybe used as the discount rate. For example, to cover a cost of US $ 99 formaintenance in the following year, it is sufficient to set aside US $ 90 invested atan interest rate of 10%; and if the expenditure of US $ 99 is required after threeyears, US $ 74 invested at 10% would be adequate. Present value calculationsare more complicated where price inflation occurs, because then it is necessaryto adjust the prevailing interest rate for inflation in order to arrive at a realisticdiscount rate.
The present value of a cost (C), incurred in the year (n) from the present, canbe calculated with the equation:
where:PV = present value of costC = nominal amount of cost incurred
n years from presentn = number of yearsr = discount rate
32

COST ANALYSIS
The present values of all recurrent costs to be incurred over the expectedlifetime are added to the initial capital cost to obtain a total figure, which can becompared for various types of pumping systems.
Method of equivalent annual cost
The capital cost is converted in a series of equivalent annual costs over the totallifetime of the pumping system. The sum of the annual equivalents will begreater than the initial capital cost of the system, because interest over theremaining debt is included in each annual instalment. The equivalent annualcost of a capital investment (C), over an expected lifetime of (n) years, can becalculated with the equation:
E A C _ c x
EAC - C Xwhere:EAC = equivalent annual costC = initial capital costn = expected lifetimer = discount rate
The total annual cost is obtained by adding the annual recurrent costs to theequivalent annual capital cost, to give a figure which can be compared forvarious pumping systems. This method is recommended for comparative costanalysis of pumping systems for the following reasons. Recurrent costs aredifficult to estimate accurately, and it may well be necessary to adjust the costcalculations from time to time. This is more easily done in this method than forthe discounted amounts in present value calculations. Another advantage is thatthe total equivalent annual cost divided by 365 gives the daily cost of thepumping system which, divided by the daily water output, yields the unit cost percubic metre of water pumped. This unit cost figure is particularly useful in thecost comparison of water pumping systems.
Discount rate selection
The discount rate to be used differs from country to country. In general, theWorld Bank applies discount rates in the range of 8 to 15% for developingcountries. When sufficient data are not available, it is advisable to makecalculations for several discount rates to get an indication of the effect of theselected discount rate on the results of the comparative cost analysis.
33

Lifetime estimation
It is difficult to estimate the lifetime of renewable energy pumping devicesbecause very few extended field tests have been carried out. More is knownabout the lifetime of other components, such as pipes and tanks. It isrecommended that the pumping equipment be reviewed and those componentsbe identified, the lifetime of which can be reasonably estimated. For the lifetimeof the other components, a rough estimate of ten years can be used. It may beadvisable to make additional cost calculations, using lifetime estimates of eightand 15 years, to assess the sensitivity of the analysis results for these changes.
Capital recovery factor
The equivalent annual cost can be readily calculated using an appropriatecapital recovery factor, which represents the amount per invested dollar to bepaid annually for full repayment. Capital recovery factors for variouscombinations of lifetime and discount rate are given in Table 3.2.
Table 3.2: Capital recovery factors for various combinations of discount rate andlifetime
Lifetime(years)
5101520
Discount
5
0.230.130.090.08
rate (%)
8
0.250.150.120.10
10
0.260.160.130.12
12
0.280.180.150.13
15
0.300.200.170.16
Example: Investment $ 1000Lifetime 10 yearsDiscount rate 10%
Capital recovery factor 0.16Equivalent annual cost $ 160
34

COST ANALYSIS
3.3 COST ANALYSIS USING ADJUSTED COST DATA
If the comparative cost analysis is made to support selection of the pumpingsystem for one or a few local projects, it is justifiable to base the cost analysis onactual prices or costs in order to avoid complicated calculations. The marketprices of local construction materials, local wages, and the current interest ratemay then be used.However, when comparative cost analyses are made to support nationalauthorities or a rural water supply programme in the selection of pumpingsystems for large-scale use, then market prices or observed costs should beadjusted to reflect the real scarcity and cost of resources. For example, the realcost of skilled staff is related to their actual capacity to contribute to the nationaleconomy, which is often higher than reflected by their salary. Thus, to find thereal cost of using the scarce resource of skilled staff, the financial cost, that is thesalary, should be adjusted for the country concerned.
In some countries, the foreign exchange rate for the national currency isregulated by the authorities and kept artificially high, at an unrealistic level. Thereal cost of purchasing foreign products will then be higher than reflected in thefinancial cost, that is, the local currency amount quoted by the bank.
A set of adjustment factors based on actual cost data obtained in a watersupply project in the Morogoro region of Tanzania, to convert market prices toreal costs, is given in Table 3.3.
Table 3.3: Adjustment factors used to convert market prices to real costs for theMorogoro region of Tanzania
Cost category Adjustment factor
Unskilled labourSkilled staffForeign exchangeLocal materialsDiesel fuelTransport vehicles
0.51.52.01.04.02.5
35
3.4 ESTIMATION OF RECURRENT COSTS
The recurrent costs have to be estimated in order to make valid costcomparisons. Some annual recurrent costs are fixed amounts, for example, thewages of caretakers, whereas other costs are related to the period of time thatthe pumping equipment runs and thus to the water output, for example, fuelconsumption, spare part requirements, and repairs. It is generally best tocalculate the recurrent costs of various pumping systems per kWh hydraulicwater output, or per m3 of water output.For cost comparison purposes, the costper kWh hydraulic water output is preferable because it takes into acount bothwater output and pumping head.
3.5 PUMPING SYSTEMS USING CONVENTIONAL ENERGY SOURCES
In this section, general cost data in US dollars (1985) are presented forconventional pumping systems. The cost data are only indicative, becauseaccurate and reliable cost data are scarce.
Hand pumps
The capital cost of hand pumps varies considerably, depending on size, type, andquality of construction materials. Suppliers' catalogues can be consulted forcurrent prices. The capital cost of a hand pump may be roughly estimated to bein the range $ 300 to $ 500, the annual costs of maintenance and repair varyconsiderably, but may be assumed to be between $ 80 and $ 150 per pump.When more than one hand pump is required to provide the same water output asa single more powerful pumping system using a renewable energy source, theconstruction cost of additional wells or boreholes has to be taken into account inthe cost comparison. These costs may be estimated to be between $ 150 and$ 250 per metre depth of the well or borehole.
Diesel engines
The capital cost of diesel engines is generally estimated to be in the range of$ 500 to $ 1200 per kW rated power. Costs of inland transport, foundationconstruction, and installation are additional. Reliable diesel engines for smallcommunity water supplies are available from 3kW rated power. The life
36

COST ANALYSIS
expectancy of a diesel engine depends on the quality of manufacture andmaintenance, and the number of hours of operation. If field data are notavailable, the useful life of a diesel engine may be taken to be 8000-15 000 hours,or about 4-5 years. However, inadequate maintenance may reduce the usefullifetime by about half. The cost of diesel fuel is a high proportion of the overallrunning costs, and varies widely from country to country, and even within onecountry. National taxes and additional charges for transport generally bring theprice of diesel fuel in the range of $ 0.40 to $ 0.80 per litre. Maintenance andservicing costs may be estimated to be about 20-25% of the fuel costs, or$ 200-400 per 1000 hours of operation.
Electric motors
The capital cost of electric engines for small water supplies ranges from $ 400 to$ 1000 per kW rated power. These motors usually have a lifetime of some20 000-50 000 hours of operation. Maintenance and repairs need to be carriedout by trained caretakers, which may present a problem in many developingcountries.
Running costs include the wages of caretakers and the charges made by theelectric power company, which may be about $ 0.07 per kWh but are likely tovary considerably for different regions. In many countries, the costs of usingelectric power in rural areas is prohibitive. However, on-site generation ofelectricity by solar photovoltaic or wind-electric generators may increase thescope for electric motors.
3.6 PUMPING SYSTEMS USING RENEWABLE ENERGY SOURCES
Because of the limited data from field experience and trials, cost data onpumping devices using renewable energy sources vary even more than data forconventional power pumps.
Hydropower
The pumping equipment in hydropowered pumping systems accounts for only asmall proportion, usually 25-30%, of the initial capital investment because thisincludes the cost of civil works, such as dams, weirs, pipelines, platforms andfoundations. These costs vary greatly according to site conditions. Currentprices for foundry-made hydraulic ram pumps start at $ 700, and generally are
37

between $ 1500 and $ 2500, depending on size and quality of manufacture.Some small locally-made ram pumps are much cheaper, about $ 150-300.However, the cost saving of using low-cost, locally produced ram pumps is likelyto be minor in terms of the overall cost. Chinese turbine pumps are reported tocost between $ 200 and $ 800 for sizes considered in this book, and are thusrelatively inexpensive, but the civil works required are likely to account for up to60-80% of the total cost.
Recurrent costs for operation and maintenance of hydropowered pumps aregenerally low, because there are no fuel costs. The only costs involved are forperiodic cleaning of the intake, occasional adjustment, and some minormaintenance.
Wind power
Multi-blade wind pumps used for drinking water supply systems generally havea rotor in the range of 2 to 6 m diameter. These wind pumps are commerciallyavailable, or can be manufactured within the country or locally. Indicative costranges per m2 rotor swept area are:- imported wind pumps $300-450/m2
- intermediate-technology wind pumps $ 200-300/m2
- locally made wind pumps $ 100-150/m2
Additional costs for shipping, inland transport, taxes and insurance increasethe capital cost, especially of wind pumping equipment imported fromindustrialized countries. The recurrent costs of these wind pumps are relativelylow. For intermediate-technology wind pumps, operation and maintenancerequires daily attention from local attendants with backup from a centralworkshop, and recurrent costs are thus higher. Annual recurrent costs for themore sturdy types of wind pumps can be estimated to be in a range from 3% to6% of capital costs. Low-cost, locally made wind pumps are more susceptible tobreakdown and therefore require more operation and maintenance attention,but this can generally be provided locally.
Solar photovoltaic energy
Solar photovoltaic pumping systems are commercially available in completepackages, including the photovoltaic panels and the motor-pump set. Thecapital cost indicated in Table 3.4. shows that the cost per peak-watt (Wp)decreases with the size of the photovoltaic pumping system. It is expected thatthese costs will be reduced to some extent in the future, as a result of increased
38

COST ANALYSIS
sales volumes, and lower production costs of solar cells. Local manufacture orassembly may also reduce costs in some countries. From the limited data on fieldperformance, it is difficult to estimate recurrent costs of solar pumps, for theguard or attendant, for minor routine maintenance, for occasional visits of amobile maintenance team for servicing, and for major repairs. The World Bank/UNDP project on solar-powered pumps estimates these costs to be $ 50/year formaintenance of the array system, and $ 12 per 1000 hours operation for themotor-pump set.
Table 3.4: Indication of capital cost for solar photovoltaic pumps
Size of pumping system, Cost rangearray rating (Wp) ($ per Wp)
Small less than 500 20 - 25Medium 500 - 3000 15 - 20Large more than 3000 10-15
Biomass energy
Fuel produced by biomass conversion can be used to replace 60-70% of thediesel fuel requirement of engine-driven pumping systems. The capital cost ofdigesters for biogas production ranges from $ 30-45 per m3 digester volume forcommercial plant, to $ 15-30 per m3 for locally constructed digesters, but mayvary according to local costs and conditions. Additional equipment for gascleaning and storage, piping and appurtenances, may add 10-15% to the digestercosts. Recurrent costs are site-specific, and mainly consist of costs for labour andbiomass resources. Annual costs for repair and maintenance may be estimatedat 5-10% of capital costs.
A number of other factors complicate the cost analysis for pumping systemsusing biomass energy. Considerable community involvement in terms of timeand effort is required, the cost of which is difficult to estimate. Benefits, such asprevention of parasitic and microbial diseases, production of fertilizer for cropproduction, and the productive use of local labour are also not easily reflected inthe cost analysis.
The capital cost dominates the economics of using gasifiers for fuelproduction. Where gasifiers can be supplied at less than $ 200 per kW ratedpower, as is now the case in Brazil and in the Philippines, they are competitivewith conventional diesel engines. Gasifiers costing more than $ 400 per kWrated power, as is the case with systems imported from Europe or North
39

America, are rarely economical. Other factors affecting the cost analysis are thecost of the dicsel fuel being replaced, the operating load, the lifetime of theequipment, and the costs of acquiring suitable dry biomass. Costs of operationand maintenance are relatively high, but cannot be specified because of lack ofdata.
It is generally accepted that at present, ethanol production is not a cost-effective substitute for diesel fuel. The unit cost of ethanol is often substantiallyhigher than that of diesel, depending on local costs, such as crop yield perhectare, and process conditions in the distillery. The costs of establishingdistilleries are far beyond the capacity of rural communities and requirefinancing at the national level. Cost calculations for distilleries in Brazil showthat the cost of both cassava and sugar-cane alcohol is in the range of $ 0.35 to$ 0.45 per litre, which is higher than the current price of diesel fuel in thatcountry. When subsidized in national programmes, alcohol production maybecome marginally cheaper.
3.7 STORAGE TANKS
Because of the daily and seasonal variation in availability of renewable energysources, provision for water storage is necessary in order to ensure a continuousand reliable water supply by pumping systems using these energy sources.Storage of pumped water is almost always cheaper than storage of theequivalent amount of electric energy in batteries. An indication of the storagecapacity required for various types of pumping systems is given in Table 3.5, andcosts for types of tanks are given in Table 3.6.
Table 3.5: Indication of water storage requirements for various types of pumpingsystems
Type of pumping system Storage (days)
Hydropowered pumps 1-2Wind pumps 5-7Solar photovoltaic pumps 2-4Biomass-fueled pumps 1-2Diesel pumps 1-2Electrical pumps 1-2Hand pumps 0
40

COST ANALYSIS
Table 3.6: Cost indication of various types of water storage tanks
Type of storage tank
Lined earth boundCompacted soil with cement liningBrickwork with cement liningFerrocementConcreteSteel
Cost per m capacity(US$)
5-108-20
12-2515-3020-3060-80
3.8 COST COMPARISON
Calculation of cost ranges
On the basis of the cost data presented, cost ranges have been calculated forvarious types of pumping systems, for the following output capacities andpumping heads:
- 10 m3/day at a pumping head of 15 m- 50 nrVday at a pumping head of 15 m- 10 m3/day at a pumping head of 50 m- 50 nvVday at a pumping head of 50 m
The general results of these cost calculations have been presented inChapter 2. Details of the calculations are given in Appendix B.
Example of cost comparison
A cost comparison is made for a wind pump, a solar pump, and a diesel pump, ata specific location for which the basic environmental data and other conditionshave been assumed as in Table 3.7. The renewable energy pumping systems arecompared with a diesel pump because much of the current interest in renewableenergy systems stems from the high cost and logistic problems of diesel fuel. Itmust be stressed that results are greatly affected by the values assumed for thekey parameters.
41

Table 3.7: Cost comparison of wind pump, solar pump and diesel pump for a particularlocation
Location data:
Water requirementPumping headAnnual average wind speedCritical length of calm periodsMonthly average irradiation (in critical month)Critical length of cloudy periodsSmallest size of diesel engine availableCost of 3kW rated diesel pumpPrice of diesel fuelCost of wind pumpCost of solar photovoltaic pumping systemUnit cost of water storage tankDiscount rate
Cost calculation: diesel pump
Hydraulic energy output requirementSize of diesel engine
Capital cost of diesel pump(3 kW rated power)Nominal power outputEfficiency of pumpHydraulic power output of engineWater outputHours of operation required per dayEfficiency of engineFuel consumption per hour operationFuel consumption per yearCapacity of storage tankCapital cost of tankLifetime of tankLifetime of engineLifetime of pumpCapital cost on annual basis:
engine and pumptank
Annual fuel costs 895 litres at $ 0.50/litreAnnual costs of operation and maintenance:
engine and pump (5% of capital cost)tank (2% of capital cost)
Annual cost of operatorTotal annual costs
Water output per yearUnit cost per m'
27 m3/d30 m4m/s5 days14 MJ/m2/d (4 kWh/m2/d)3 days3 kW rated power$4500$ 0.50/litre$ 350/m2 of swept rotor area$ 22/Wp installed$ 30/m3
8%
2.25 kWh/d(smallest available engine)3 kW rated power$4500
2kW40%0.8 kW4.1 1/s1.83 hours15%1.34 litres of diesel/hour895 litres of diesel/year1 day's supply = 27 m3
$81020 years5 years10 years
$ 960$ 95$ 450
$ 225$ 15$ 500$2240
9850 m3
$ 0.23/m3
42
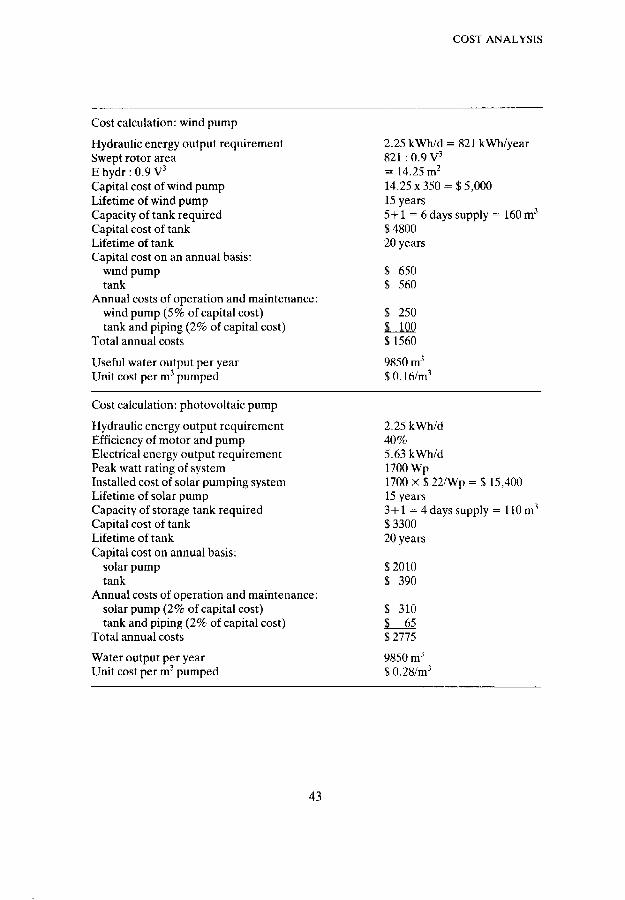
COST ANALYSIS
Cost calculation: wind pump
Hydraulic energy output requirementSwept rotor areaE hydr : 0.9 V3
Capital cost of wind pumpLifetime of wind pumpCapacity of tank requiredCapital cost of tankLifetime of tankCapital cost on an annual basis:
wind pumptank
Annual costs of operation and maintenance:wind pump (5% of capital cost)tank and piping (2% of capital cost)
Total annual costs
Useful water output per yearUnit cost per m3 pumped
Cost calculation: photovoltaic pump
Hydraulic energy output requirementEfficiency of motor and pumpElectrical energy output requirementPeak watt rating of systemInstalled cost of solar pumping systemLifetime of solar pumpCapacity of storage tank requiredCapital cost of tankLifetime of tankCapital cost on annual basis:
solar pumptank
Annual costs of operation and maintenance:solar pump (2% of capital cost)tank and piping (2% of capital cost)
Total annual costs
Water output per yearUnit cost per nv1 pumped
2.25 kWh/d = 821 kWh/year821 : 0.9 V3
= 14.25 m2
14.25x350 = $5,00015 years5+1 = 6 days supply = 160 m3
$480020 years
$ 650$ 560
$ 250$ 100$ 1560
9850 m3
$0.16/m3
2.25kWh/d40%5.63kWh/d1700 Wp1700 x$22/Wp = $ 15,40015 years3+1 = 4 days supply = 110 m3
$330020 years
$ 2010$ 390
$ 310$_ 65$ 2775
9850 m1
$ 0.28/m3
43

3.9 EFFECT OF ASSUMPTIONS MADE ON COST CALCULATIONRESULTS
When making a comparative cost analysis, the assumptions made affect theresults considerably. Examples of assumptions which need to be checked beforeuse in comparative cost analysis arc, the price of diesel fuel, the price of solarpumping equipment, the average annual wind speed, and transport costs.
If values are difficult to obtain, or a particular value is not certain, then costanalyses are often made using different values to show how sensitive thecalculated unit output costs are to changes in the assumptions. This is calledsensitivity analysis.To illustrate this, the assumptions for the cost of diesel fueland the average annual wind speed in the example presented in Table 3.7 havebeen varied. If the diesel fuel price is increased from $ 0.50/litre to $ 0.85/litrc,the unit output cost per m3 of water for a diesel pump is increased slightly from$ 0.23 to $ 0.27. A considerable change in the diesel fuel price thus has arelatively minor effect on the unit output cost in the example. However, if theannual wind speed is not 4 m/s but 3 m/s, a much larger wind rotor would berequired, and thus the capital cost of the wind pump would be increasedconsiderably. The rotor-swept area required would be about 34 m2 greater andcapital costs about $ 12 000 more.The equivalent annual costs would rise by$ 1420, and operation and maintenance costs by $ 590. The unit costs per m3 ofwater pumped would increase from $ 0.16/m3 to $ 0.27/m3.
These sensitivity analyses are complicated, in particular when many variablesare involved, and computerized data processing may be required. It isrecommended that a specialist be consulted, should a complete sensitivityanalysis be required.
44

COST ANALYSIS
BIBLIOGRAPHY
Buch-Larsen, B., and Mueller, A.M. (1982). An economic -comparison of the use ofwind pumps and kerosene pumps for irrigation in Sri Lanka. Colombo, Sri Lanka,Water Resources Board; Wind Energy Unit.
Carothers, R. (1981). An assessment of water-pumping technologies using locallyavailable energy resources: Botswana. In rural water supply in developing countries,proceedings of a training workshop held in Zomba, Malawi, 5-12 August 1980. Ottawa,Canada, International Development Research Centre, 44-52.
Fraenkel, P.L. (1980). The relative economics of wind pumps compared with engine-driven pumps. Reading, UK, Intermediate Technology Power Ltd.
French, D. (1979). The economics of renewable energy systems for developingcountries. Washington, DC, USA, US Agency for International Development.
Gingold, P.R. (1979). The cost-effectiveness of water-pumping windmills. WaterEngineering, 3 , 4, 262-331.
Lysen, E.H. (1982). Introduction to wind energy (CWD Publication 82-3).Amersfoort, The Netherlands, Consultancy Services Wind Energy DevelopingCountries.
Marchesini, L., and Postma, S.F. (1978). Cost comparison of wind pumps and enginepumps. Amersfoort, The Netherlands, Steering Committee Wind EnergyDeveloping Countries.
Mueller, A.M., and Jansen, W.A.M. (1984). Cost analysis of water-lifting windmillsand diesel-powered pumps used for small-scale irrigation (CWD Publication 84-3).Amersfoort, The Netherlands, Consultancy Services Wind Energy DevelopingCountries.
Norconsult (1985). Solar-powered water pumps in rural townships in Tanzania (finalreport). Sandrika, Norway, Norconsult Consulting Engineers.
Saif-ul-Rehman, M. (1978). Comparative costs of water-pumping with solar energy,windpower, petrol engine and electric water pump, in Sun: mankind's future sourceof energy, Vol.3. Proceedings of the International Solar Energy Society Congress,New Delhi, India.
Sir William Halcrow & Partners/Intermediate Technology Development Group(1981). Small-scale solar-powered irrigation pumping systems: technical andeconomic review (Document 232.4/81 SM). Washington, DC, USA, World Bank.
Wiseman, R. (1983). Sun pumps may soon compete with hand pumps. World Water,6,9,25-31.
45
4. Basics of water pumping andpump selection
The most commonly used pumps in rural water supply systems arc positive-displacement pumps such as plunger pumps, and rotodynamic pumps such ascentrifugal pumps.The type of pump needs to be selected carefully to match theenergy device. Therefore, selection should be based on consideration of:- pumping duty required;- characteristics of the water source;- power requirement and pumping efficiency;- maintenance and repair requirements.
4.1 SPECIFICATION OF PUMPING DUTY
The first step in selection of the type of pump is to specify the pumping dutyrequired in terms of the output capacity and pumping head.
Output capacity
In this book, pumping systems of output capacities of up to 250 m3/d areconsidered. The required output of the pump, in nrVh, is calculated on the basisof the maximum daily water requirement and the number of hours dailyoperation.
The maximum daily water requirement is not the same as the water demand ofthe community. For example, for a wind-powered pumping system at a locationwhere periods of insufficient wind for three subsequent days occur, a storagereservoir of at least three times the daily water demand is required. To refill thisreservoir after a windless period, more water than the daily water demand willhave to be pumped. This is the maximum daily requirement, and the pumpshould be of sufficient capacity to supply water at that rate.
Some types of pumping systems are designed to operate continuously, othertypes can provide the required amounts of water in a few hours daily. Factorswhich determine the number of hours of daily operation include the type ofenergy supply, the maintenance requirements, and the minimum size availablefor the selected type of pumping system. For example, the output capacity ofeven the smallest diesel pump is so great that it can supply the daily water
46
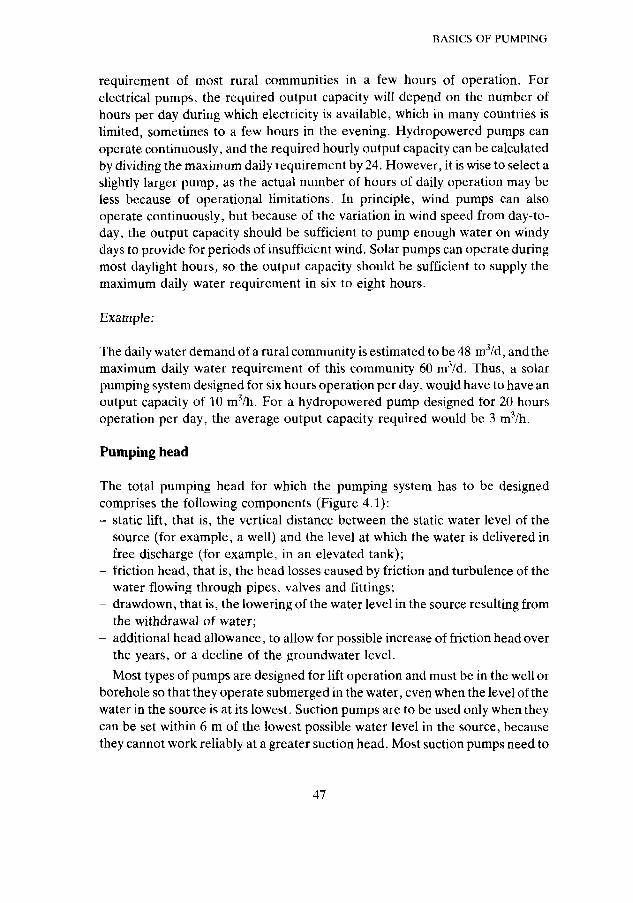
BASICS OF PUMPING
requirement of most rural communities in a few hours of operation. Forelectrical pumps, the required output capacity will depend on the number ofhours per day during which electricity is available, which in many countries islimited, sometimes to a few hours in the evening. Hydropowered pumps canoperate continuously, and the required hourly output capacity can be calculatedby dividing the maximum daily requirement by 24. However, it is wise to select aslightly larger pump, as the actual number of hours of daily operation may beless because of operational limitations. In principle, wind pumps can alsooperate continuously, but because of the variation in wind speed from day-to-day, the output capacity should be sufficient to pump enough water on windydays to provide for periods of insufficient wind. Solar pumps can operate duringmost daylight hours, so the output capacity should be sufficient to supply themaximum daily water requirement in six to eight hours.
Example:
The daily water demand of a rural community is estimated to be 48 m3/d, and themaximum daily water requirement of this community 60 m3/d. Thus, a solarpumping system designed for six hours operation per day, would have to have anoutput capacity of 10 m3/h. For a hydropowered pump designed for 20 hoursoperation per day, the average output capacity required would be 3 m3/h.
Pumping head
The total pumping head for which the pumping system has to be designedcomprises the following components (Figure 4.1):- static lift, that is, the vertical distance between the static water level of the
source (for example, a well) and the level at which the water is delivered infree discharge (for example, in an elevated tank);
- friction head, that is, the head losses caused by friction and turbulence of thewater flowing through pipes, valves and fittings;
- drawdown, that is, the lowering of the water level in the source resulting fromthe withdrawal of water;
- additional head allowance, to allow for possible increase of friction head overthe years, or a decline of the groundwater level.Most types of pumps are designed for lift operation and must be in the well or
borehole so that they operate submerged in the water, even when the level of thewater in the source is at its lowest. Suction pumps are to be used only when theycan be set within 6 m of the lowest possible water level in the source, becausethey cannot work reliably at a greater suction head. Most suction pumps need to
47

be primed, that is, the pump body has to be filled with water before the pump canbe operated.
The total pumping head under operating conditions is often called thedynamic head. When water is pumped at a very low rate, the total pumping headmay be assumed to be the same as the static lift. At higher output rates, the head
3CD
O)
"5.EQ .
COCD
JCCJ
••s
I-I
Storage tank
f$__Pumping level
rFigure 4.1: Components of total pumping head
48
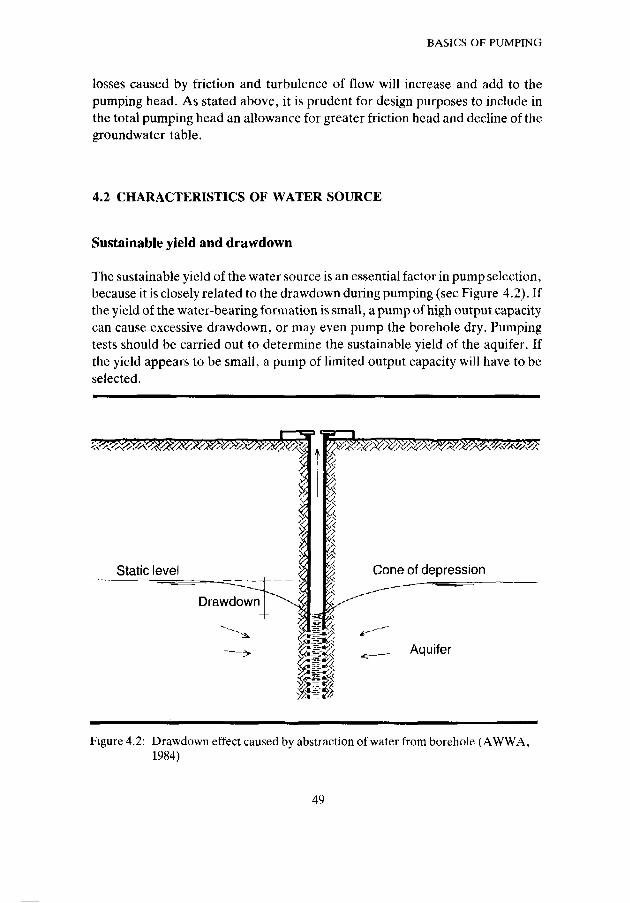
BASICS OF PUMPING
losses caused by friction and turbulence of flow will increase and add to thepumping head. As stated above, it is prudent for design purposes to include inthe total pumping head an allowance for greater friction head and decline of thegroundwater table.
4.2 CHARACTERISTICS OF WATER SOURCE
Sustainable yield and drawdown
The sustainable yield of the water source is an essential factor in pump selection,because it is closely related to the drawdown during pumping (see Figure 4.2). Ifthe yield of the water-bearing formation is small, a pump of high output capacitycan cause excessive drawdown, or may even pump the borehole dry. Pumpingtests should be carried out to determine the sustainable yield of the aquifer. Ifthe yield appears to be small, a pump of limited output capacity will have to beselected.
Aquifer
Figure 4.2: Drawdown effect caused by abstraction of water from borehole (AWWA,1984)
49

Water quality
The water quality should also be considered in pump selection. If thegroundwater is corrosive, then pumps constructed of corrosion-resistantmaterials must be selected. If the water pumped has a high content of iron andmanganese, precipitates may be deposited in the inlet openings and also on theinternal parts of the pump, and pumps that are little affected by these depositsshould be chosen. Calcium and magnesium carbonates can precipitate out of thewater, and cause clogging of the pump inlet openings and interior. Regularinspection and cleaning of a pump's internal parts, therefore, are required inconditions where these precipitates and thus clogging of the pump, are likely tooccur.
4.3 POWER REQUIREMENT AND PUMPING EFFICIENCY
The effective power output or hydraulic power output for water pumping at agiven rate (Q) and pumping head (H) equals QW • g • Q • H. The effective poweroutput of a water pumping system will be less than the power input because ofpower losses occurring in power conversion in the prime mover, in powertransmission, and in the pump itself. The ratio between power output and powerinput is called the efficiency (-n) of the pumping system. Thus, the powerrequirement (P) for water pumping can be calculated:
r QW • g • Q • H
For a specific weight of water (QW) of 1 kg/1 and a gravitational constant (g) of 9.8m/s2, this can be simplified to:
_ 9.8 • Q • H
where:P = power requirement (W)Q = output rate (1/s)H = total pumping head (m)rj = overall efficiency (%)
50

BASICS OF PUMPING
Example:
A pumping system is designed for a water output capacity of 60 nrVd at a totalpumping head of 10 m, and for six hours operation per day. The hourly outputcapacity required is 10 nvVh, or 2.78 1/s. The hydraulic power requirement forthis pumping duty is calculated to be 9.81 x 2.78 x 10 = 272 W. If the efficiency ofthe pump is 60%, then the input power requirement for the pump is272 : 0.6 = 453 W. If the pump is driven by a motor of an average efficiency of70% in the operating range, then the input power to be supplied to the motorshould be 453 : 0.7 = 647 W. The overall efficiency of this system is 272/647 =42%.
The efficiency with which a pump converts the transmitted mechanical powerinto hydraulic output depends on its design and configuration, and theconditions under which its operates. For reciprocating pumps, the efficiency ofoperation is little affected by output rate and pumping head, and is usually in therange of 60 to 75%. With centrifugal pumps, efficiency depends heavily on thecombination of output rate and pumping head under which it operates, and mayvary widely, from 25-85%. The operating efficiency of centrifugal pumps foreach combination of output and head can be measured and plotted on a pumpperformance curve. Such graphs are provided by most manufacturers, as forexample that presented in Figure 4.3.
, 5 0
_n
.£ 40CL
EZJ
30
20
10
Flow rate/head curve
80
60
40
20
10 14 18 22Discharge rate (m3/d)
Figure 4.3: Pump performance curves for centrifugal pump
51

The downward slope of the output rate/head curve from left to right, indicatesthat the output is greater for lower pumping heads. As shown, pumpingefficiency varies considerably at different water output rates. A high efficiency isachieved only in the relatively narrow range of 12 to 16 m3/h output. At outputrates of less than 12 nrVh, or higher than 16 nrVh, efficiency is considerably less.For reasonable efficiency, it is necessary to select a centrifugal pump specificallyfor the pumping head and output rate under which it will operate.
4.4 MAINTENANCE AND REPAIR REQUIREMENTS
Maintenance and repair requirements are important considerations in pumpselection. Factors to consider include the frequency of servicing, and the skills,tools and spare parts required. Experience shows that water pumping systemsoften fail because of inadequate maintenance and lack of spare parts. Often, ittakes a long time before repairs are done, and as a result, pumping systems maybe completely abandoned by the user community. Back-up service is alwaysneeded and includes spare part supply, training of pump attendants, andtechnical support.
All pumps wear with time, but if silt or sand is present in the water pumped,the durability and useful life of most pumps is shortened considerably. Excessivewear of pumps is often more an indication of inappropriate design of the well orborehole than of faulty construction of the pump.
4.5 TYPES OF PUMPS
The main types of pumps used in small-scale pumping systems fall roughly intotwo main categories: positive-displacement pumps, and rotodynamic (impeller)pumps.
Positive-displacement pumps
Reciprocating-plunger pumps. These pumps have a plunger (piston) whichmoves back and forth within a closed cylinder. When the plunger movesupwards, it lifts water, and at the same time, due to pressure reduction below theplunger, water is drawn in through the inlet valve. When the plunger movesdownwards, the inlet valve closes and water is forced out through the outletvalve (Figure 4.4).
52

BASICS OF PUMPING
Plunger pumps are self-priming when the cylinder is located near or below thewater level in the source. The same amount of water is displaced with eachstroke. Thus, the water output rate is largely governed by the running speed,that is, the number of strokes per minute at which the pump operates. Thepumping head has little effect on the output rate of these pumps. Single-actingplunger pumps produce output only during the up-stroke, and double-actingplunger pumps during both the up-stroke and the down-stroke.
Reciprocating-plunger pumps should be especially considered for pumpingwater from medium-depth and deep boreholes with the dynamic water level at adepth of 30-40 m, or if necessary, up to 60 m. They can give reliableperformance at efficiencies of 60-75 %, which is little affected by variations in thepumping head. The use of these pumps is limited to 60 m, because pump rods ofgreater length are susceptible to Hexing and breakage.
Plunger pumps require a relatively high force to start. To overcome thisproblem, a clutch mechanism may be incorporated which allows the motor togain speed and power while free-running until it has developed the requiredstarting force for the pump. This reduces the starting torque to be provided bythe prime mover, and thus has design implications. For example, equipped witha clutch, a rotor with six blades may be adequate for a wind pump, which withouta clutch would probably need a 16 or 24-bladed rotor. An alternative method to
Inlet valve Outlet valve
Pump rod
Plunger
Figure 4.4: Principle of operation of reciprocating-plunger pump
53
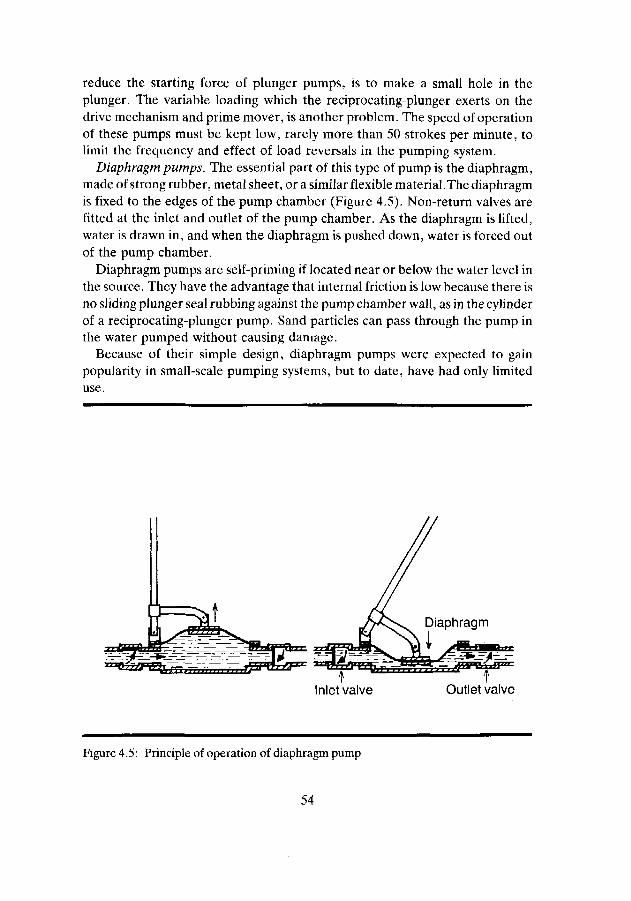
reduce the starting force of plunger pumps, is to make a small hole in theplunger. The variable loading which the reciprocating-plunger exerts on thedrive mechanism and prime mover, is another problem. The speed of operationof these pumps must be kept low, rarely more than 50 strokes per minute, tolimit the frequency and effect of load reversals in the pumping system.
Diaphragm pumps. The essential part of this type of pump is the diaphragm,made of strong rubber, metal sheet, or a similar flexible material.The diaphragmis fixed to the edges of the pump chamber (Figure 4.5). Non-return valves arefitted at the inlet and outlet of the pump chamber. As the diaphragm is lifted,water is drawn in, and when the diaphragm is pushed down, water is forced outof the pump chamber.
Diaphragm pumps are self-priming if located near or below the water level inthe source. They have the advantage that internal friction is low because there isno sliding plunger seal rubbing against the pump chamber wall, as in the cylinderof a reciprocating-plunger pump. Sand particles can pass through the pump inthe water pumped without causing damage.
Because of their simple design, diaphragm pumps were expected to gainpopularity in small-scale pumping systems, but to date, have had only limited
use.
Inlet valve Outlet valve
Figure 4.5: Principle of operation of diaphragm pump
54
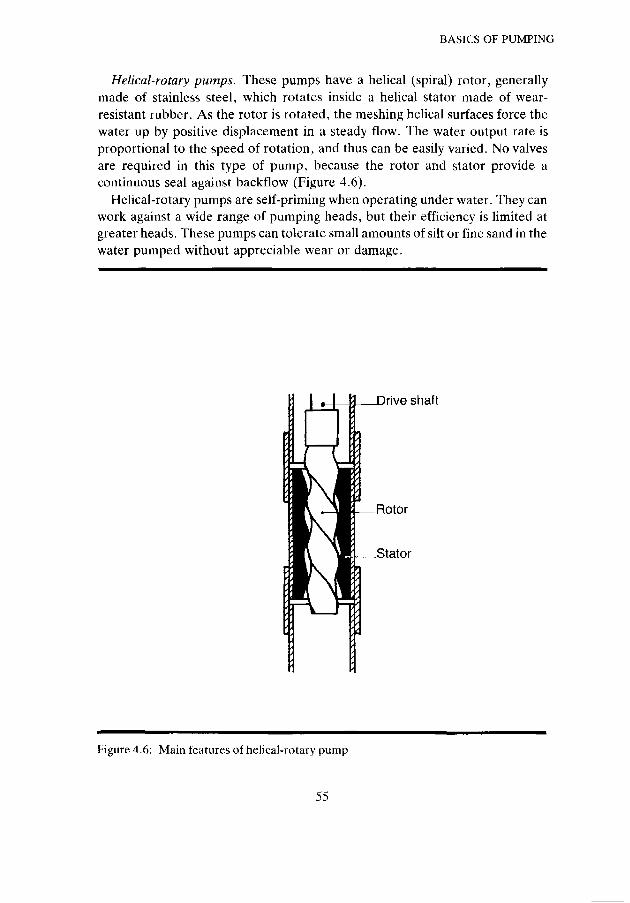
BASICS OF PUMPING
Helical-rotary pumps. These pumps have a helical (spiral) rotor, generallymade of stainless steel, which rotates inside a helical stator made of wear-resistant rubber. As the rotor is rotated, the meshing helical surfaces force thewater up by positive displacement in a steady flow. The water output rate isproportional to the speed of rotation, and thus can be easily varied. No valvesare required in this type of pump, because the rotor and stator provide acontinuous seal against backflow (Figure 4.6).
Helical-rotary pumps are self-priming when operating under water. They canwork against a wide range of pumping heads, but their efficiency is limited atgreater heads. These pumps can tolerate small amounts of silt or fine sand in thewater pumped without appreciable wear or damage.
Drive shaft
Rotor
^Stator
Figure 4.6: Main features of helical-rotary pump
55

Rotodynamic (impeller) pumps
Centrifugal pumps. These pumps operate on the principle of imparting kineticenergy to the water, and thus do not work by positive displacement of the water.They have one or more impellers, which rotate within a casing of a special shape.Each impeller and its matching casing is called a stage (Figure 4.7). The impellerhas a number of vanes radiating from the centre to the periphery, which at high-speed rotation throw the water radially out by centrifugal force, thus impartingkinetic energy to it. The casing is so shaped that most of the kinetic energy isconverted into useful pressure, which then lifts the water against head. Thepumped water is replaced by water which is drawn in at the centre (eye) of theimpeller.
If more pressure is required than a single stage can produce, additional stagescan be placed in series to form a multi-stage pump. All impellers are mounted ona common shaft and thus rotate at the same speed. As the water passes throughsuccessive stages, pressure is built up to give the required pumping head.
Submersible pumps. These pumps are multi-stage centrifugal pumps whichare built together with a close-coupled electric motor as one unit. The motor-and-pump unit is of slim construction so that it can be lowered in a borehole forsubmerged operation (Figure 4.8). These pumps are often a "tight fit" in the
Inlet _^
Casing—
Impeller
Figure 4.7: Stage of centrifugal pump
56

BASICS OF PUMPING
borehole, their diameter being only 1 -2 cm less than the internal bore of the wellcasing. Thus, considerable care is needed when installing or removing this typeof pump.
With submersible pumps, the motor receives electric power through a powercable from the power source. Because they have to be slim, these motor-pumpsets are generally less efficient than surface-mounted motors. However, theiroverall power efficiency is often higher than that of pumps driven by a surface-mounted engine because there are not the considerable power losses of the driveshaft. Maintenance and repair is costly, especially in deep boreholes, becausethe entire length of riser pipe has to be dismantled to haul the motor-and-pumpunit to the surface.
Figure 4.8: Submersible pump
57

Deep well turbine pumps. Although usually considered to be a type ofcentrifugal pump, their mode of operation is slightly different, the water beinglifted by a combination of positive displacement and centrifugal action. Thesepumps can easily be recognized by their distinctive bowl units with long taperedpassages (see Figure 4.9).
Deep well turbine pumps are self-priming, and usually driven by a surface-mounted electric motor or diesel engine using a long drive shaft. The shaft mayneed supporting by special stabilizers or spacers set at regular intervals. Correct
Gear head..
Drive shaft
Riser pipe.
Pump_
Strainer.
Figure 4,9: Deep well turbine pump

BASICS OF PUMPING
alignment of motor, shaft, and pump is essential for reliable performance andlong useful life. The water output can be varied by adjusting the rotationalspeed. Most of these pumps are designed for high output capacities andgenerally, are more suitable for pumping large quantities of water for irrigationthan the relatively small amounts required for domestic water supply.
Axial-flow (or propeller) pumps
Axial-flow pumps have a propeller with radial fins or blades which rotate insidea straight turbine casing. The propeller produces axial water flow. Fixed guideblades are mounted inside the turbine casing to prevent the water developing"whirl" flow when pumped (Figure 4.10). As these pumps are best suited tolifting water at high output rates against low pumping heads, they are mostlyused for irrigation.
Drive shaft
Guide blades
Discharge pipe
Runner (propeller)
Figure 4.10: Main features of axial-flow pump
59
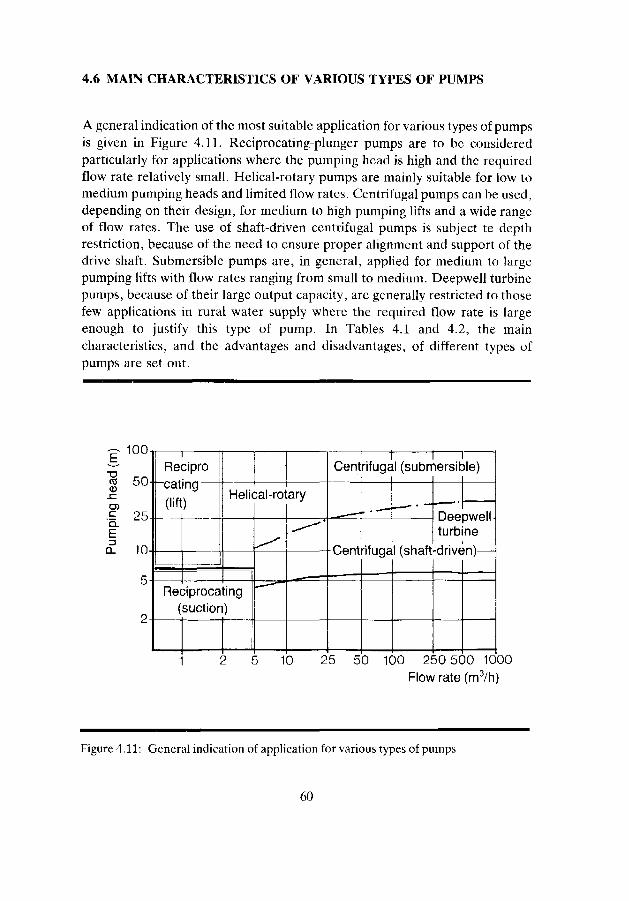
4.6 MAIN CHARACTERISTICS OF VARIOUS TYPES OF PUMPS
A general indication of the most suitable application for various types of pumpsis given in Figure 4.11. Rcciprocating-plunger pumps are to be consideredparticularly for applications where the pumping head is high and the requiredflow rate relatively small. Helical-rotary pumps are mainly suitable for low tomedium pumping heads and limited flow rates. Centrifugal pumps can be used,depending on their design, for medium to high pumping lifts and a wide rangeof flow rates. The use of shaft-driven centrifugal pumps is subject te depthrestriction, because of the need to ensure proper alignment and support of thedrive shaft. Submersible pumps are, in general, applied for medium to largepumping lifts with flow rates ranging from small to medium. Deepwell turbinepumps, because of their large output capacity, arc generally restricted to thosefew applications in rural water supply where the required flow rate is largeenough to justify this type of pump. In Tables 4.1 and 4.2, the maincharacteristics, and the advantages and disadvantages, of different types ofpumps are set out.
100
COCD 50- -eating
.E 25o_E£ 10-
Reciprocatin(lift)
Helical-rotary
Reciprocating(suction)
—r—p—Centrifugal (submersible)
Deepwellturbine
Centrifugal (shaft-driven)—-
1 2 5 10 25 50 100 250 500 1000Flow rate (m3/h)
Figure 4.11: General indication of application for various types of pumps
60

BASICS OF PUMPING
Table 4.1: Characteristics of various types of pumps
Type of pump
Reciprocating-plunger pumps
shallow well
deep well
Chain pumps
Bucket pumps
Diaphragm pumps
Practicaldepth range(m)
5- 15
15- 18
2- 12
5- 40
5- 30
Capacityrange(l/min)
30- 50
40-100
5- 30
10-100
20- 50
Powersource
humanwindhumanmotorwind
humanwind
humananimalwind
humanmotorwind
Axial-flow(propeller) pumps
Centrifugal pumps
single stage
multi-stageshaft-driven
multi-stagesubmersible
Deep well turbinepumps
5- 30
15- 50
20- 40
50-500
15- 50
large
variable
variable
variable
variable(100-20000)
motor
motorsolarmotorwind
electro-generatorsolar
motor
61

Table 4.2: Advantages and disadvantages of various types of pumps
Type of pump Advantages Disadvantages
Reciprocatingplunger pumps
Chain pumps
Bucket pumps
- Low speed of operation- Simple design and
construction- Efficiency little affected by
variation in pumping head- Suitable for relatively high
pumping heads
- Simple design andconstruction
Simple design andconstruction
Helical-rotary pumps - Speed of operation ean bevaried over wide range, andadjusted to outputrequirement
- Only one moving part inwell
- Steady discharge
Diaphragm pumps
Deep well turbinepumps
Little internal frictionFew moving partsWater containing particlessmaller than the valveopenings, may be pumpedwithout causing wear ordamage to the pump
Wide range of capacitiesand headsSteady discharge cantolerate small amounts ofsand or silt in the waterpumped
- Below-ground components(e.g. eup seals, valves)subject to sliding friction
- Regular maintenance andreplacements required
- Discharge pulsates, subjectto vibration
- Low efficiency- Suitable for low pumping
heads only
- Low efficiency- Suitable for low pumping
heads only
- Suitable for small outputcapacities only
- Gearing required- Subject to abrasion when
sand or silt present in thewater pumped
- Not satisfactory in deepwells
- Relatively low capacity- Not satisfactory in deep
wells- Diaphragm subject to wear
because of continuousflexing
Speed of operation must berelatively constant forsatisfactory efficiencyExpensive maintenance andrepair require skilledtechnicians and pump mustbe removed from the well
62
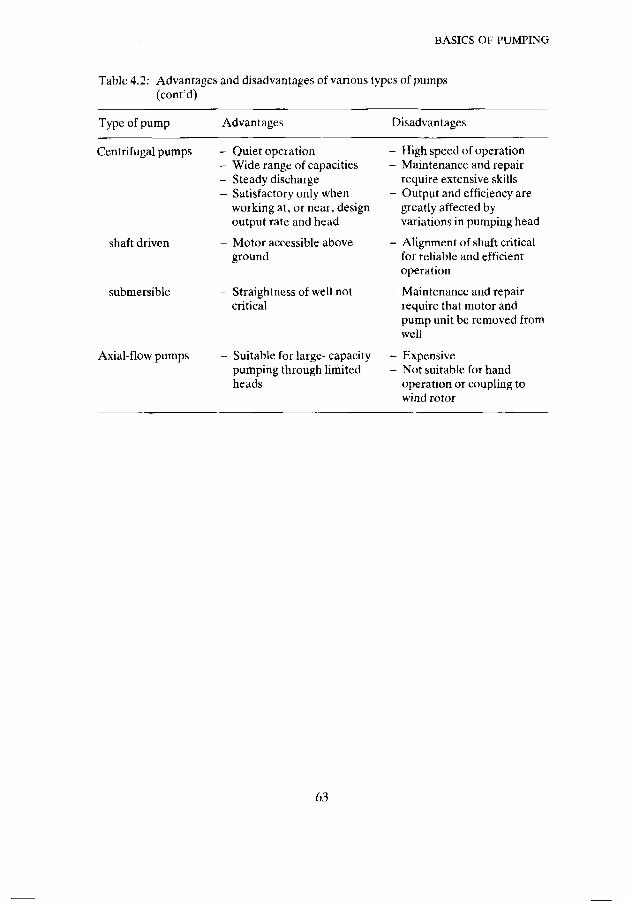
BASICS OF PUMPING
Table 4.2: Advantages and disadvantages of various types of pumps(cont'd)
Type of pump Advantages Disadvantages
Centrifugal pumps
shaft driven
submersible
Axial-flow pumps
- Quiet operation- Wide range of capacities- Steady discharge- Satisfactory only when
working at, or near, designoutput rate and head
- Motor accessible aboveground
- Straightness of well notcritical
- Suitable for large- capacitypumping through limitedheads
High speed of operationMaintenance and repairrequire extensive skillsOutput and efficiency aregreatly affected byvariations in pumping head
Alignment of shaft criticalfor reliable and efficientoperation
Maintenance and repairrequire that motor andpump unit be removed fromwell
ExpensiveNot suitable for handoperation or coupling towind rotor
63

BIBLIOGRAPHY
- Addison, II. (1958). The pump users handbook. London, UK, Pitman & Sons Ltd.
- AWWA (1984). Design and construction of small water supply systems: a guide formanagers. Denver, Colorado, USA, American Water Works Association.
- Benamour, A. (1979). Les moyens d'exhaure en milieu rural. Ouagadougou,Burkina Faso, Comite Interafricain d'Etudes Hydrauliques.
- Hofkes, E.H. (1983). Small community water supplies: technology of small watersupply systems in developing countries (Technical Paper No. 18). The Hague, TheNetherlands, International Reference Centre for Community Water Supply andSanitation, and Chichester, UK, Wiley & Sons.
- McJunkin, F.E. (1977). Hand pumps for use in drinking water supplies in developingcountries (Technical Paper No.10). The Hague, The Netherlands, InternationalReference Centre for Community Water Supply and Sanitation.
- Ross Institute (1974). Small water supplies. London, UK, London School of Hygieneand Tropical Medicine.
- Waddington, D., and Herlevich, A. (1981). Evaluation of pumps and motors forphotovoltaic water pumping (Document SERI 3.12/TR-214-1423). Las Vegas,Nevada, USA, Solar Energy Research Institute.
- Wood, A.D. (1976). Water lifters and pumps for the developing world. Tucson,Colorado, USA, Colorado State University.
64

5. Solar energy
The sun emits radiant energy at a rate of 3.8 x 10²⁰ MW, of which a very smallproportion is intercepted by the earth. Yet, a vast amount of solar radiationreaches the earth, equivalent to 1.2 x 10H MW (WMO, 1981). This is thecapacity of over one hundred million large power stations, each of 1000 MW.The amount of solar radiation at the outer limit of the earth's atmosphere isequivalent to 1353 W/mz and is known as the extraterrestrial solar constant.Some solar radiation is absorbed by the atmosphere, and some is reflected backinto space. The remainder is transmitted to the earth's surface as either direct ordiffuse radiation (see Figure 5.1).
Scattered to space
Direct radiation
Extra-terrestrialsolar radiation
Reflected to space
Absorbed byatmosphere
Diffuse radiation
/x/W>?/y?/x/X/>^
Figure 5.1: The paths of solar radiation
The total daily amount of solar irradiation, direct and diffuse, at ground levelis called the daily global irradiation (or insolation) of the location concerned,and is measured as energy (MJ/m2/d, or kWh/m2/d). The rate at which solarirradiation reaches the ground is called the global irradiance, and is measured aspower (W/m2). Global irradiance varies, depending on the hour of the day, the
65

season, location (latitude), and cloudiness. In tropical zones, it can reach amaximum of about 1000 W/m2 at noon on a clear day, but when heavily overcastmay be as low as 100 W/m2. The average daily global irradiation on a horizontalplane varies from 7 MJ/m2/d (2 kWh/m2/d) in most parts of northern Europe, to22 MJ/m2/d (6 kWh/m2/d) in some arid tropical regions (see Figure 5.2).
160 100 140 180
Figure 5.2: Average daily global irradiation (MJ/m2/d) on the horizontal plane (WMO,1981)
To assess whether a location is suitable for solar pumps, a record of dailyirradiation over at least one, and preferably two years, is required. The design ofa solar pump system cannot be based on average daily irradiation, becauseinsufficient water would then be pumped in months of below-average solarirradiation. Therefore, the month of the lowest irradiation is usually selected asthe basis for sizing solar pump installations, and allowance must be made forcloudy periods in which irradiation may be much lower than the average. Localvariations for an arid and humid tropical location are shown in Figure 5.3.
66
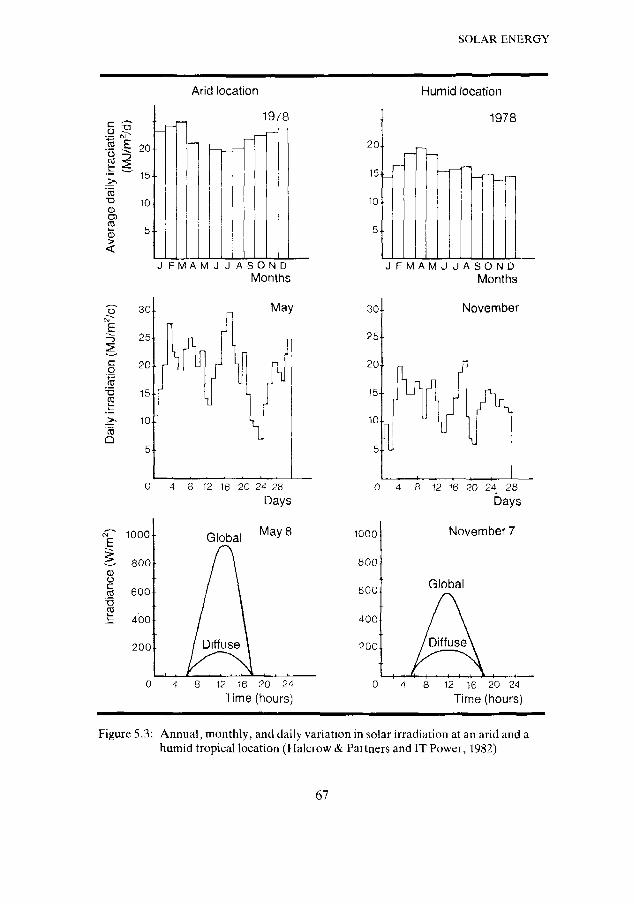
SOLAR ENERGY
Arid location
o 5
a i20
15
10
5
1978
J F M A M J J A S O N DMonths
16 20 24Time (hours)
20
15
10
5
Humid location
1978
J F M A M J J A S O N DMonths
November
0 4 8 12 16 20 24 28Days
November 7
Global
12 16 20 24Time (hours)
Figure 5.3: Annual, monthly, and daily variation in solar irradiation at an arid and ahumid tropical location (Ilalcrow & Partners and IT Power, 1982)
67

Global irradiation on a solar array or heat collector tilted towards the equatoris higher than that on the horizontal plane. It is the irradiation on a tilted surfacewhich should be the basis for the design of a solar pumping system. This can becalculated using conversion tables for irradiation data on the horizontal plane.The optimal tilt of an array or heat collector is about the degree of latitude of thelocation; for example, an angle of 25° may be used for a place at latitude 25".Theoretically, this would enable the maximum amount of global irradiation tofall on the array or collector. In practice, the selected angle is often somewhatgreater (5-15°) in order to collect as much as possible of the lower irradiation inthe cooler season.
5.1 SOLAR-POWERED WATER PUMPING SYSTEMS
In solar pumping systems, solar irradiation is converted to useful mechanicalpower for pumping water. This can be done in two ways, using fundamentallydifferent technologies:- photovoltaic cells producing electricity which is then used to produce
mechanical power;- thermodynamic conversion of solar heat into mechanical power.Photovoltaic pumping systems use photovoltaic cells which convert theirradiation directly into electricity, which in turn is used to run an electric motorto drive the pump (see Figure 5.4). Several pumping systems of this type arctechnically proven, and available from a number of manufacturers. It isestimated that, at present, about 2000 have been installed in various areasthroughout the world.
The main constraint to wider use is probably the relatively high capital cost.However, analysis of both capital and recurrent costs indicates that photovoltaicpumps are likely to be cost-effective in areas of high levels of solar irradiation,and they are likely to become more attractive as increased production ofphotovoltaic cells results in reduced costs.
In thermodynamic solar pumping systems, irradiation is used to produce heatenergy in a solar collector, and this heat is converted by a heat engine tomechanical power to drive the pump. Solar thermodynamic pumps were firstdemonstrated in the late 19th century,and since then a number of prototypepumps have been designed, built, installed and operated. However, varioustechnical problems have prevented them from working reliably and
68

SOLAR ENERGY
continuously, and further, the operating costs are high. In spite of all efforts todevelop solar thermodynamic pumps, no field-proven pumping systems of thistype are available commercially at present.
5.2 PHOTOVOLTAIC PUMPING SYSTEMS
Components, configuration and principle of operation
The main components of a photovoltaic pumping system are:- photovoltaic array to convert solar irradiation into direct-current (dc)
electricity;- motor-and-pump subsystem to convert electricity to mechanical power for
pumping water;- control equipment;- water storage and distribution system.
There are various configurations for photovoltaic pumping systems,depending on the water source and type of pump used (see Figure 5.4).
Photovoltaic arrayDischarge pipe
Figure 5.4A: Configurations for photovoltaic pumping systems: (a) floating motor/pump set; (b) surface motor with surface-mounted suction pump(Kenna, 1985)

Photovoltaic array
Electric motor
Power cable.
Submersible pump_
Riser pipe JL
Pumr.
Figure 5.4B: Configurations for photovoltaic pumping systems: (c) submersible motor/pump set; (d) submerged pump with surface motor
The water output rate and pumping head determine the load on the electricmotor, for which the array must provide the required power in the form ofelectrical voltage and current. The power conversion in a photovoltaic pumpingsystem and the concomitant power losses are shown in Figure 5.5.
70

SOLAR ENERGY
Solar radiation
Power lossesarray
Power losses Power losses\ motor/pump in pipe work
Hydraulicpower
Figure 5.5: Power conversion in a solar photovoltaic pumping system
The general relationship between the solar irradiance, the power supply fromthe array, and the hydraulic power output, is shown in Figure 5.6. The electricpower supply from the array varies with the irradiance received, and theefficiency of the motor is affected by the voltage and current produced by thearray, which in turn is reflected in the water output pattern.
A photovoltaic pumping system starts to pump water when the solarirradiance rises above the system's "cut in" threshold which may be, forexample, 300 W/m2. The water output rate then increases as the irradiancecontinues to rise. As the motor-and-pump subsystem approaches its optimaloperating point, the efficiency improves so that the water output increases morerapidly than does the irradiance.In the afternoon, when the array heats up, the
71

1000-
i% 600
200-
10 12 14 16 18
12 14 16 18
O
I
2--
1-
10 12 14 16 18Time (hours)
Figure 5.6: Relationship between irradiance, array power output, and water output, forphotovoltaic solar pump (Halcrow & Partners and IT Power, 1981)
72

SOLAR ENERGY
efficiency of the photovoltaic process reduces, and thus the electric poweroutput is also reduced. Later in the afternoon, as the array cools down,photovoltaic efficiency increases again, but then irradiance is falling off. Whensolar irradiance drops below the threshold, insufficient electric power isgenerated for the pumping system to produce water output.
5.3 PHOTOVOLTAIC CELLS, MODULES AND ARRAYS
The first photovoltaic cells were installed by Bell Laboratories in 1955 in a solar-powered rural telephone carrier system in Georgia, USA. In 1958, photovoltaiccells were used to power a communication satellite, and since then, greatadvances in the technology and production of photovoltaic cells have beenmade. The most common type of photovoltaic cell is the monocrystalline siliconcell, but polycrystalline silicon cells are becoming increasingly popular. Silicon isa highly purified form of one of the most abundant elements in common sand.To make photovoltaic cells, large silicon crystals "doped" with other additivesare grown, and this material is sliced into thin wafers. There are also severaltypes of photovoltaic cells made from various materials other than silicon, buteither these are not yet commercially available, or their performance is sounreliable that in terms of real use they are still in the development stage.
When solar radiation strikes the surface of a photovoltaic cell, an electricalpotential is generated. Metal contacts attached in a grid to the front and back ofthe cell enable electric current to run. The general configuration of a siliconphotovoltaic cell is shown in Figure 5.7.
Multiples of photovoltaic cells are connected electrically to form a "module".The more cells connected in series, the higher the voltage available; the morecells in parallel, the higher the current. The cells are usually laminated in arectangular panel between a transparent window and a rigid back. Formerly,plain tempered glass was used for the transparent surface, but field experiencehas shown glass to be too vulnerable to breakage. Polycarbonate plastics andpolymerized resins have been tested, but were found to deteriorate undermoisture, dust and ultraviolet light. Currently, multi-layer laminated glass andhigh-impact plastics are preferred for the transparent face.
The packing factor for round cells, that is the ratio of cell area to the surfacearea of the module, is about 75%. Modules composed of square cells arebecoming available, and these have a packing factor of almost 100%.
The power output capacity of a photovoltaic module is rated in peak watts(Wp). This is the value of the maximum power output from a module, when
73
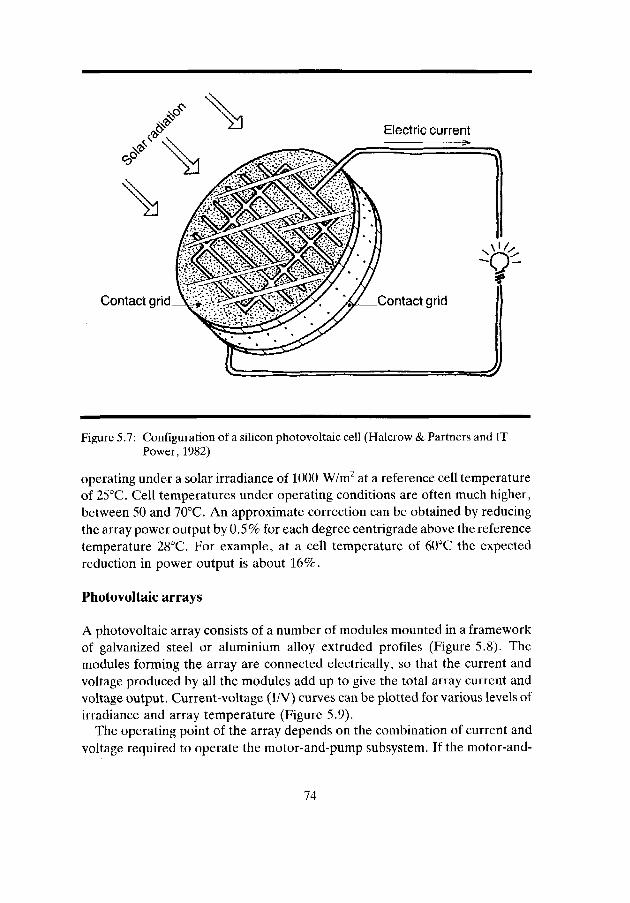
Contact
Electric current
Figure 5.7: Configuration of a silicon photovoltaic cell (Halcrow & Partners and ITPower, 1982)
operating under a solar irradiance of 1000 W/m2 at a reference cell temperatureof 25°C. Cell temperatures under operating conditions are often much higher,between 50 and 70°C. An approximate correction can be obtained by reducingthe array power output by 0.5% for each degree centrigrade above the referencetemperature 28°C. For example, at a cell temperature of 60°C the expectedreduction in power output is about 16%.
Photovoltaic arrays
A photovoltaic array consists of a number of modules mounted in a frameworkof galvanized steel or aluminium alloy extruded profiles (Figure 5.8). Themodules forming the array are connected electrically, so that the current andvoltage produced by all the modules add up to give the total array current andvoltage output. Current-voltage (I/V) curves can be plotted for various levels ofirradiance and array temperature (Figure 5.9).
The operating point of the array depends on the combination of current andvoltage required to operate the motor-and-pump subsystem. If the motor-and-
74

SOLAR ENERGY
Support framework
Power cable
Figure 5.8: Mounting framework of photovoltaic array
CD
CO
O
Operating load (W)
25 X Celltemperature
Voltage, V (volts)
Figure 5.9: Current/voltage curves for a photovoltaic array (Grundfos, 1985)
75

pump is disconnected, the array operates under open-circuit conditions andproduces only voltage, no current. Tf placed in short circuit, there is only current,no voltage. Under both conditions, the power output to the subsystem is zero.Maximum power output from the array is obtained when it operates on the kneeof the current-voltage curve, for the irradiation level and array temperature thatapply (see Figure 5.9). The maximum power output is about 0.7 of the productof short circuit current and open circuit voltage.
If the electric motor is coupled directly to the array, the system will operate atthe point where the current-voltage curve of the motor intersects with thecurrent-voltage curve of the array for the prevailing irradiance level and arraytemperature. Because this is not the maximum power operating point,electronic power conditioners can be used to control the operating conditionsand keep the power output as close as possible to the maximum value. Earlyphotovoltaic pumping systems only used very basic control equipment, butincreasing requirements for optimal efficiency have prompted the developmentof fairly sophisticated electronic equipment for conditioning.
The power output capacity of an array may be reduced by 5-10% when thearray surface becomes less transparent, as a result of ageing or dirtaccumulation.
5.4 MOTOR-AND-PUMP SUBSYSTEM
It is important to match the operating characteristics of the motor to those of thepump by selecting an appropriate coupling and power transmission. Theincorporation of a flywheel may have advantages, when a reciprocating-plungerpump is used. Currently, photovoltaic water pumping systems use the followingtypes of electric motor:- brushed permanent magnet direct-current (dc) motors;- brushless direct-current motors;- alternating-current motors.
Brushed motors require replacement of the brushes at regular intervals. Forconventional brushes, these intervals are 2000-4000 hours, which is equivalent toone to two years use in a solar pumping system. Special highly wear-resistantbrushes have been developed which may last up to 10 000 hours operation.
There are also brushless dc motors with a permanent magnet rotor andelectronically switched field windings. These brushless motors, designed for usewith solar pumps, are a relatively new development and problems with theelectronics have yet to be overcome. Nevertheless, the potential for brushless dcmotors in water pumping systems is increasing, as their reliability is improved.
76

SOLAR ENERGY
Direct-current motors are generally attractive in photovoltaic pumpingsystems because the array provides dc power supply, so that the electric motorcan be coupled directly. However, the available range of alternating-current(ac) motors is far greater because they are manufaetured standard for mainspower supply, and the prices are generally lower than those of de motors. Usinga cheaper motor in a solar pumping system may be a false economy, if a largerand thus more expensive array is required to compensate for the lower efficiencyof the motor.
Development work on electric motors by a number of manufacturers aims toreduce maintenance requirements, to increase durability of bearings, and toincrease the service life of brushes if these are used. A particularly importantdevelopment is the production of reliable brushless motors.
If an alternating-current motor is used in a solar pumping system, an inverteris required to convert the dc power output from the array into ac electricity. Thisinvolves additional expenditure and some energy losses. For this reason, acmotors have so far not been considered seriously, because this additional costwould increase the overall cost of the pumping system considerably, especiallyfor small-scale applications. Further, ac motors are less efficient and have amuch higher starting current requirement than dc motors. However, new typesof ac motors are being developed which have higher efficiency and these couldbecome attractive for solar pumping systems. The present trend is to use eitherbrushless motors or specially-designed ac motors with an efficient and reliableinverter.
Pumps
The choice of pump for a photovoltaic pumping system depends on the wateroutput capacity required, the pumping head, whether it is driven by a close-coupled submersible motor or shaft-driven by a surface-mounted motor, andmany other factors. Selection of pumps is discussed in Chapter 4.
5.5 ANCILLARY EQUIPMENT
Tracking mechanisms
Most arrays are placed in a fixed position for simplicity, and to reduce costs.However, movable arrays are sometimes used, which can be oriented to trackthe apparent movement of the sun. This adds considerably to the complexity of
77

the installation, but has the advantage of a substantial increase, about 30%, inarray power output throughout the day. Alternatively, if the array is movable,the required array area may be reduced by about 20% for a given hydraulicoutput.
Manually-operated tracking mechanisms can be cost-effective, if an operatoris available to adjust the array orientation during the day. At present, automatictracking mechanisms are expensive and complex. Generally, the costs arehigher than can be justified by the increased power output or reduced arrayarea, and the greater complexity of the array installation with trackingmechanism is a distinct disadvantage.
Solar concentrating devices
Increasing the intensity of solar radiation falling onto the cells will increase theirpower output. Therefore, the cell area could be reduced by concentrating thesolar radiation with special devices, such as focusing mirrors or Fresnel lensesmoulded in a plastic holder. The solar cells can also be surrounded by reflectingsurfaces forming a parabolic reflector.
While solar concentrating devices may reduce the cell area required for agiven power output, they have a number of drawbacks. The cells will be heatedto high temperatures, and therefore will require cooling. For low solarconcentration rates, air-cooled fins may be adequate, but for higherconcentration rates, water cooling is needed. If the cooling system fails, there islikely to be serious damage of the cells. Moreover, most types of solarconcentrators need tracking to keep them focused efficiently on the sun, and anytracking mechanism makes a solar water pumping system considerably morecomplex. The use of solar concentrating devices in a photovoltaic pumpingsystem is only advantageous if the cost reduction for the smaller cell arearequired, outweighs the costs of the solar concentrating equipment. In mostcases, it is doubtful whether concentrators are economically justifiable, and asthe cost of solar cells decreases, arrays without solar concentrating equipmentwill become increasingly attractive, particularly in small installations. However,it may be cost-effective to place small reflectors at the periphery of a flat platearray, because this would increase the power output sufficiently to justify thesmall additional cost.
Batteries
In some photovoltaic pumping systems, batteries are incorporated for energystorage. The advantage of using batteries is that a steady supply of electricity can
78
SOLAR ENERGY
be provided from the varying electricity supply of the photovoltaic array. Thebatteries can also accumulate electrical energy for use during periods whenmore energy is required than produced by the array. However, thedisadvantages of using batteries are considerable:- they are expensive;- regular topping up with distilled water is required, unless specially sealed
batteries are used, but these are extremely expensive;- the energy loss involved in the charge-discharge cycle of the batteries reduces
the overall efficiency of the pumping system;- batteries have a relatively short life, for example, conventional lead/acid
batteries may last only five years or less under field conditions.It is possible to use oversized battery storage capacity, or better quality
batteries, but this is very costly. Solar pumping systems without batteries arefavoured because of their cost advantage, simplicity, and greater reliability.
5.6 CONVERSION EFFICIENCIES
The motor-and-pump subsystem of a photovoltaic solar pump operates underdifferent conditions from the steady-voltage power supply for whichconventional electric motor pumps are designed, because the power producedfrom the available solar irradiance varies considerably. Therefore, thesubsystem of a photovoltaic pump should operate efficiently over a range ofcombinations of voltage and current. Two types of efficiency can bedistinguished:- the power conversion efficiency: that is, the ratio of hydraulic power output to
the electrical power input, which will be highest when the subsystem operatesat or near its design point;
- the daily energy conversion efficiency: that is, the ratio of the hydraulicenergy output to the electrical energy output of the array over the whole day;it is the average of the varying power efficiencies achieved during the day,under the daily variation in solar irradiance and other operating conditions.The daily energy conversion efficiency is the most important parameter,
because it determines the size of array required for a particular water output,and the array is by far the largest cost item of photovoltaic pumping systems. In awell-designed system, a daily energy conversion efficiency of 4.5% should beattainable with present technology, but in practice, 2.0-3.5% is more usual.
79
5.7 MATCHING MOTOR/PUMP AND ARRAY POWER OUTPUTCHARACTERISTICS
To start operation, the motor-and-pump subsystem requires a certain power toovercome the starting torque. The irradiance required to produce the startingtorque is the threshold level for the solar pumping system. If reciprocating-plunger pumps are used, the threshold irradiance is fairly high, because of highstarting resistance of this type of pump. Therefore, if a plunger pump is used in aphotovoltaic pumping system, then a fairly high irradiation level or batterystorage of electric energy is required to start the pump. The characteristics of dcmotor-driven centrifugal pumps are well matched to the power outputcharacteristic of a photovoltaic array. These motor/pump sets can therefore becoupled directly to the array. A centrifugal pump has a relatively low startingtorque, and will readily start to rotate slowly even if irradiance is limited, butthere is no water output until irradiance has increased to the level wheresufficient power is produced to develop the rotational speed required forpumping.
If the threshold irradiance for a photovoltaic pumping system is high,incorporation of a special power conditioning device, known as a MaximumPower Point Tracker, may be considered. This is an electronic device whichcontrols the release of power to the motor, so that the power produced at lowirradiance levels can be maximized to obtain the threshold power required tostart the pump. As a result, photovoltaic pumps equipped with this device canstart earlier and stop later, and so give a higher water output. The use of powerconditioning equipment implies additional cost and power loss, and an extrasource of potential failure. To be economical, the benefit of the water outputmust outweigh the additional power loss, costs, and failure risks.
An alternative, simpler method of matching the motor-and-pumpcharacteristic and the array power output, is to control the voltage produced bythe photovoltaic array at a fixed value. The array will then work fairly close to itsmaximum efficiency at most, but not all irradiance levels, and consequently theoperation of the pumping system will be fairly optimal.
Inverters are electronic devices that convert the direct current supplied by thearray to single or three-phase alternating current, to run motor-and-pump setsdriven by an ac motor. To maximize their benefit, electronic control can beincorporated to provide impedance matching. The inverter will thenautomatically increase the voltage and frequency of the ac current, and soenable the pumping system to deliver water under low irradiance levels. Peakefficiencies of some commercially available inverters are claimed to be as high as
80

SOLAR ENERGY
85%, but most inverters are very inefficient under part-load. Therefore, onlyspecially designed inverters should be used for solar pumping systems.
Batteries also provide impedance matching, because they allow the electricmotor to start at low irradiance levels. However, batteries also have severaldisadvantages, such as considerable power loss, lack of reliability, need forregular maintenance, and a limited life which is shorter than the rest of the solarpumping system.
5.8 WATER STORAGE REQUIREMENT
Solar pumping systems require a storage tank of sufficient capacity, usually twoto three days' supply, in order to ensure the continuous availability of water. Anelevated storage tank is required to provide sufficient head for pipeddistribution of the water.
The storage tank capacity required to guarantee the supply of water at arequired level of certainty can be calculated from data on solar irradiation at thelocation concerned. For example, storage of two days' supply may give 80%certainty of water being available, while storage of three days' supply may give acertainty of 90%.
5.9 APPROXIMATE SIZING OF PHOTOVOLTAIC PUMPING SYSTEMS
The photovoltaic array should be as small as possible for the power outputrequirement, in order to design the most cost-effective system. The cost of thearray is approximately proportional to the peak power capacity installed, andrepresents a considerable proportion of the total capital cost of the pumpingsystem.
The average daily solar irradiation available in the least sunny month of theyear, and the maximum daily water requirement determine the array sizerequired. For fully accurate sizing, all manufacturers of solar photovoltaicpumps have computer models available to determine the minimum size of array.However, a simplified procedure can be used to obtain the approximate size ofthe array:
81

(1) The hydraulic energy demand of the pumping system can be estimated as:
O • M
Ehydr = i n f ) where: Ehydr = hydraulic energy demand (MJ/d)0 = pumping rate (m3/d)H = pumping head (m)
For example, a pumping system of 10 m3/d rated capacity operating against20 m pumping head, has an estimated hydraulic energy demand of 2 MJ/d.
(2) The average daily efficiency of the pumping system is also estimated. Forpumping systems operating against low heads of 2-5 m, an efficiency of 30%may be a good approximation; for systems operating against pumping headsof 10-30 m, an efficiency of 40% may be assumed.
(3) The hydraulic energy demand is divided by the daily energy efficiency of thesubsystem, to give the daily energy output required from the array, in theexample: 2 MJ/d : 0.4 = 5 MJ/d.
(4) Reference to Figure 5.2 indicates the average daily irradiation for the areain question; for example, in the area around Dakar, Senegal, about 20 MJ/m2.
(5) To estimate the average daily irradiation available in the least sunny month,the value found in (4) is reduced by 20%, in the example:20 x 80% = 16 MJ/m2/d. If monthly average solar irradiation figures areavailable from meteorological stations, it is more accurate to use the dailyaverage irradiation in the least sunny month from these records.
(6) The daily energy output requirement as calculated in (3) is divided by theaverage daily irradiation in the design month, as found in (5), and the resultmultiplied by 1200 to obtain the approximate peak watt rating required forthe array; in the example: (5 : 16) x 1200 = 375 Wp.
(7) Solar arrays are available in modules rated at 35-45 Wp. Therefore, theresult found in (6) should be divided by the appropriate module rating, asappropriate. The result is rounded up to an integer to give the number ofmodules required, in the example: 375 : 35 = 11 or 375 : 40 = 10.
The simplified sizing procedure can also be carried out graphically, usingFigure 5.10.
82

SOLAR ENERGY
Q_
^2000
CO
2 1500
CD
DC
1000
500
T3CD
01
5• o
12
Average daily irradiationfor design month
(MJ/m2/d)
I Electrical energy requirement (MJ/d)
Subsystem averagedaily energy efficiency (%
Figure 5.10: Approximate sizing of photovoltaic pumping system (Halcrow & Partnersand IT Power, 1983)
83

5.10 THERMODYNAMIC PUMPING SYSTEMS
At present, solar thermodynamic water pumping systems have not been provenin the field, but for completeness, a brief description of these systems is given.The basic configuration and components (Figure 5.11) are:- solar collector converting solar irradiation into heat energy;- heat engine which uses a thermodynamic cycle to convert heat into
mechanical energy;- pump;- water storage and distribution system.
About 60 solar thermodynamic pumps produced in France have beeninstalled in developing countries. The energy conversion efficiency of thesepumps under field conditions was about 1%, but because of their complexity,few have operated for any length of time.
84

SOLAR ENERGY
SSolar radiation
Heat exchange pipe
Solar collector.
Power losses in collector (
Circulation pump .^
Condenser.
Power losses in engine <
Power losses in pump
Power losses in pipe work
Expanderengine
Pump
-------j\\ Hydraulic^rr^> power
output
Figure 5.11: Basic configuration of a solar thermodynamic pumping system (Halcrow& Partners and IT Power, 1981)
85

BIBLIOGRAPHY
- Bahadori, M.N. (1978). Solar water pumping. Solar Energy, 4, 21, 307-311.
- ESCAP (1980). Renewable sources of energy. Vol.1: Solar energy. Bangkok,Thailand, United Nations Economic and Social Commission for Asia and the Pacific.
- Fraenkel, P.L. (1979). The power guide: a catalogue of small-scale power equipment.London, UK, Intermediate Technology Development Group.
- Grundfos (1985). Solar pumping systems. Bjcrringbro, Denmark, Grundfos A/S.
- Halcrow & Partners and IT Power (1981). Small-scale solar-powered pumpingsystems: A, phase 1 project report: B, technical and economic review (UNDP/WorldBank project GLO/80/004). Washington, DC, USA, World Bank.
- Halcrow & Partners and IT Power (1982). Testing and demonstration of small-scalesolar powered pumping systems: state-of-art report. Washington, DC, USA, WorldBank.
- Halcrow & Partners and IT Power (1983). Small-scale solar-powered pumpingsystems: the technology, its economics and advancement. (Main report UNDP/WorldBank project GLO/80/003). Washington, DC, USA, World Bank.
- Kenna, J.P., and Gillett, W.B. (1985). Solar water pumping: a handbook. London,UK, Intermediate Technology Publications Ltd.
- Langerhorst, J. etal. (1977). Solar energy. Report of a study on the application of solarenergy in developing countries. The Hague, The Netherlands, Netherlands Ministryfor Development Cooperation.
- Takla, A. (1978). Development of solar energy utilization in developing countries.Technology for solar energy utilization (Development and Transfer of TechnologySeries No.5). New York, USA, (United Nations/Vienna), United Nations IndustrialDevelopment Organization, 7-38.
- Catalogue of manufacturers and literature on solar photovoltaic water pumpsUNTCEF (1982). New York, USA, UNICEF.
- WMO (1981). Meteorological aspects of solar radiation as an energy source (TechnicalNote No.172). Geneva, Switzerland, World Meteorological Organization.
86

6. Wind energy
The winds over the earth are a vast energy source estimated to yield an average2700 million MW (WMO, 1978). However, only a small proportion is over theland areas and close enough to the surface to be captured by wind rotors.Nevertheless, the potential production of useful power is very great, estimatedroughly to be 2-10 million MW (Park, 1981). At present, wind power provides aslittle as 0.04% of the total energy consumption, but by the year 2000 this mayhave increased to 2%, and perhaps more (UNESCO, 1981). A World Bankstudy has identified 20 developing countries with more than 40% of their landarea having average annual wind speeds greater than 3.5 m/s (Blake, 1978). At
LJ0 0 20
Figure 6.1: World wind power distribution (mean wind power flux through unit verticalarea perpendicular to wind direction, measured at JO m above groundlevel, W/m2). Estimates for large areas which are relatively free ofobstructions (WMO, 1978)
87

this level of wind speed, wind-powered water pumping systems or wind pumpsmay well be cost-effective. The world distribution of wind power at 10 m aboveground level is shown in Figure 6.1.
By the fourth century, wind pumps were widely used in the Middle East, andtheir application spread throughout central and east Asia, and into China. Fromthe sixth century, wind pumps were being used increasingly in Europe, and bythe 19th century they were used on a large scale for water pumping, particularlyin the Netherlands, Denmark and in northern Germany. Wind pumps also had amajor role in the early development of North America and Australia, and arestill used in large numbers. This is also the case in Argentina, South Africa andthe Soviet Union, where wind pumps are used primarily for watering livestock.About one million wind pumps are in regular use throughout the world today. Inrecent years, interest has been renewed in developing low-cost, reliable windpumps for developing countries, both for drinking water supply and forirrigation purposes.
6.1 WIND-POWERED WATER PUMPING SYSTEMS
A relatively large rotor is required to capture sufficient wind to produce usefulpower. In mechanically coupled wind pumps, the wind rotor is directly coupledto the pump (Figure 6.2). A crankshaft coupling is often used for areciprocating-plunger pump, while for rotary pumps, the most commoncoupling is by gears or pulley. Generally, a rotary pump will give a morefavourable operating load on the wind rotor than a plunger pump, because thepower required to operate a plunger pump changes continuously during thepumping cycle. In contrast, a rotary pump imposes a relatively constant andcontinuous operating load on the rotor.
Electrically coupled wind pumps use an electric cable for power transmissionfrom the wind-driven electro-generator to an electric motor driving the pump(Figure 6.3). This type of wind-powered pumping system is sometimes referredto as "wind-electric pumping" or "remote pumping". Power transmission bycable allows the wind rotor to be placed some distance from the well or boreholeat a favourable site, such as on a hill top, to capture more wind and produce morepower than would be possible at the site of the well or borehole,which is often ina valley or low-lying area.
A two or thrce-bladed rotor is used to drive the electro-generator through astep-up gear unit to obtain the required high rotational speed. A slip ringassembly connects the generator poles to the power cable. If the generator

WIND ENERGY
Figure 6.2: Main features of mechanically coupled wind pump
produces three-phase alternating current, this power can be supplied directly toa standard submersible motor/pump set with a three-phase induction motor.The maximum power rating of the electric motor should not be more than about40% of the generator rating.
89

Windelectro-generator
Storage tank
Electric motor pump-
Figurc 6.3: Main features of electrically coupled wind pump
6.2 WIND ROTORS
Horizontal-axis wind rotors are equipped with two or more blades. Multi-bladed rotors are designed for relatively slow rotational speeds, between 30 and80 revolutions per minute, and produce a relatively high torque, making themsuitable for driving mechanically coupled pumps. Fast-running rotors havingtwo or three blades are more suitable for driving an electro-generator at highrotational speed, for electrically powered pumps. A slow-running, multi-bladedrotor has to be of sturdy construction because of the considerable load andtorque exerted by the rotor (Figure 6.4). With a fast-running rotor, alignmentand blade profile design are critical because of the greater aerodynamic forceson the rotor blades ("blade friction"), the considerable centrifugal forces, andthe greater risk of vibrations.
90

WIND ENERGY
Multi-blade rotor High-speed rotor Darrieus-type rotor
Figure 6.4: Types of rotors used in wind pumps
There are two main types of vertical-axis wind rotors, the "lift" and "drag".Drag is the wind force on the rotor pointing downwind, parallel to the air flow.Lift is the force on the rotor pointing perpendicular to the wind. The Darrieusrotor (see Figure 6.4), consisting of a number of curved blades of aerofoil-shape, is an example of the lift type of rotor. This type of rotor can produce asmuch power as horizontal-axis rotors, but is not self-starting. An example of thedrag type rotor is the Savonius wind rotor, which has S-shaped blades. This typeof rotor has a limited power output, and is difficult to protect against strongwinds.
6.3 TOWERS
The tower should be sturdy enough to withstand the considerable forces exertedon it by the rotating rotor, especially in high winds. Being normally 6-15 m high,the tower needs to be of strong construction. Therefore, it is not recommendedthat it be constructed exclusively from local materials. Failure or misalignmentof the tower can wreck the whole wind pump. Moreover, use of a locallyconstructed tower for an imported wind rotor is likely to negate themanufacturer's warranty.
91

6.4 TRANSMISSION SYSTEMS
In a wind pump system using a plunger pump, power is often transmitted by acrankshaft which reciprocates the pump rod to drive the pump (Figure 6.5).
Tail vane
-Gears
-Connecting rod
>—Pump rod
Tower
Figure 6.5: Transmission mechanism for wind pump using plunger pump (Park, 1981)
Another type of transmission system for plunger pumps is an overhead rockerwhich reciprocates the pump rod directly. The swept arch of the rocker controlsthe stroke length of the pump.
In some commercially available transmission systems, extensive gearing witha roller-and-sleeve coupling is used to produce the reciprocating motion of thepump rod. A clutch mechanism may be incorporated to allow free rotation ofthe rotor until sufficient speed and power is attained to start the pump byengaging the clutch (Figure 6.6).
92

WIND ENERGY
If the transmission mechanism incorporates a provision to vary the strokelength, the torque required to start the pump can be adjusted for weak andstrong winds. This arrangement is similar to the transmission gears used inbicycles, by which the operating torque can be adjusted to reduce the leg powerrequired. With a variable stroke provision, the wind pump can thus start at lowerwind speeds, and a considerable increase in water output can be obtained.
A simpler way to reduce the starting torque of a wind-driven plunger pump isto make a small hole in the plunger. The starting resistance is then less, and the
Hub
Figure 6.6: Transmission mechanism equipped with a clutch (Dempster Industries)
wind pump can start to operate at lower wind speeds. In stronger winds, the holewill cause some loss of water output, but this is usually not important and readilycompensated for by the output gained in low wind speeds.
Rotary pumps can be coupled to the wind rotor by gears, a pulley or beltdrive.Wind rotors and centrifugal pumps have similar torque and speed characteristics
93

that both vary with the square power of rotational speed. The loading of thetransmission mechanism is thus favourable. With vertical-axis rotors, the rotorcan be coupled to the pump by a simple belt drive system. Pulleys of differentdiameter may be fitted to adjust the rotational speed of the pump, and thuspump operation can be matched to the wind speed regime in different seasons.
6.5 CONTROL MECHANISMS
Every wind pump should have a control mechanism to protect it from rotatingtoo fast and being damaged in high winds. Modern wind pumps are equippedwith control mechanisms of various types, all of which limit the rotational speedof the rotor, or stop it in excessive winds. In some designs, a brake mechanism isincorporated which is actuated automatically if the rotor speed exceeds the setmaximum, or if blade imbalance occurs. It is also possible to use a "pull-out"mechanism by which the rotor is automatically turned from the wind by a vane,when the wind speed becomes greater than the allowable maximum for therotor. Under normal operating conditions, the vane is perpendicular to the winddirection, but in high winds the force on it makes the rotor turn away from thewind. Another control mechanism comprises a device to disturb the air streamon the rotor, when the wind speed increases beyond the allowable maximumlevel. The aerodynamic pressure exerted by a disturbed air stream is much lessthan that of the undisturbed wind, and thus the speed of the rotor will be reducedto within safe limits.
6.6 BASIC THEORY OF WIND-POWERED PUMPING
Wind flowing at a speed (V), through an area (A), represents an air mass flow,which can be calculated (Figure 6.7):
m = oa • A • V
where:
m = air mass flow (kg/s)Qa = density of air (kg/m3)A = area swept by rotor (m2)V = wind speed (m/s)
94

WIND ENERGY
Figure 6.7: Air mass flow
The kinetic power in the wind can be calculated:
Pkin = J Qa • A • V3
where:
Pkin = kinetic power (W)Qa = density of air (kg/m3)A = area swept by rotor (m2)V = wind speed (m/s)
Two important points are reflected in this equation:
- Wind power is proportional to the third power (cube) of wind speed. It thusvaries greatly. For example, at a wind speed of 3 m/s, the power available inthe wind is 16 Watt per m2 of swept rotor area; at 6 m/s, it is about 130 W; at10 m/s, about 600 W.
95

- Wind power is proportional to the area swept by the rotor, and thus isproportional to the square of the diameter of the rotor.
For physical reasons, the power that a rotor can extract from the wind is only apart of the kinetic energy in the wind. This proportion is known as the powercoefficient, Cp. Its theoretical maximum is approximately 60%, but the practicalCp of rotors is in the range of 10 to 40%.
The hydraulic power output of a wind pump is determined by the wind speed,the area swept by the rotor, the Cp of the rotor, the efficiency of the powertransmission, and the efficiency with which the pump uses the mechanical powerinput to produce hydraulic output. This is expressed in the following equation:
P = i Qa • Cp • q • A • V3
where:
P = hydraulic power output (W)Cp = power coefficient (%)q = power conversion efficiency (%)oa = air density (kg/m3)A - area swept by rotor (m2)V = wind speed (m/s)
The Cp of the rotor depends on aerodynamic design and rotational speed, andis not constant but varies with wind speed. The rotor should be selected ordesigned so that the power coefficient is maximum for the prevailing wind speedat the particular location. This is called the design wind speed, and is not thesame as the average wind speed. A wind pump of a low design wind speed doesnot require much wind to start, and will have a relatively high power output inweak winds. However, in higher wind speeds its power conversion efficiency willbe less, and the total power output for the prevailing wind speeds will berelatively small, because the greater power in stronger winds is not usedefficiently.
Power conversion and power losses in a wind pump installation are shown inFigure 6.8. Power losses arc incurred in the rotor, the electro-generator (ifused), the transmission mechanism, and in the pump itself. Indicative values ofthese power losses are given in Table 6.1.
96

WIND ENERGY
Power conversionlosses in rotor
Power lossesin transmissionmechanism
Power lossesin pump
Hydraulic?~---^> power output
Figure 6.8: Power conversion in a wind pump installation
Table 6.1: Indication of power losses in wind pump systems
Component Range of power loss (%)
Electro-generatorPower cableElectric motorCentrifugal pumpPlunger pump
10-205-1020-3030-5040-50
97

6.7 DATA COLLECTION AND WIND REGIME
As wind regimes differ considerably from place to place, data from global orregional surveys can only be used to give an indication. Ideally, the windpotential at each location should be assessed on the basis of long-term windspeed records, but extensive records are rarely available. Usually,measurements of wind speed will need to be taken at the location where thewind pump is to be installed. Hourly records of wind speed are required for aperiod of at least one year, and preferably one-and-a-half years. Studies inNorth America have shown that the average wind speed determined on thisbasis is within 10% of the long-term average, at a confidence level of 90%.
The most widely used wind-speed measuring device is the anemometer. It isessential that each anemometer, and the method used for reading and recordingdata, is checked to ensure which unit of measurement (m/s, knots, miles/hour)has been used in the record.
From the data collected, the wind regime needs to be analysed in order toassess the suitability of a particular location for a wind pump system. This maybe done on the basis of time distribution, for example, the average wind speedfor each individual hour of the day. The frequency distribution gives thefrequency of occurrence of wind speed in each specific interval, for example, thenumber of hours during which the wind speed is 3-4 m/s.
6.8 SITE SELECTION
Site selection is not critical in flat terrain, but in hilly or mountainous areas thereare considerable variations in wind availability, and allowance for this should bemade when selecting the site for a wind pump. Belts of trees, buildings, andother obstructions greatly reduce the wind speed available on the leeside. Theeffect of various obstructions and topographical features is shown in Figure 6.9.
Near the earth's surface, the wind stream is disturbed. Wind blowing aroundbuildings or over rough surfaces is likely to have a turbulent pattern, whichconsiderably reduces the power a rotor can extract from the wind. On theleeside of tree belts or similar obstructions, turbulences occur over a distance of10-20 times the height of these obstructions (Figure 6.10).
The output capacity of the wind pump should be matched to the yield of thewater source. Basically, the capacity should be less than the safe yield of thesource from which the water is pumped. If the capacity of the wind pump isgreater, the source may be pumped dry, and the pump will wear quickly.
98
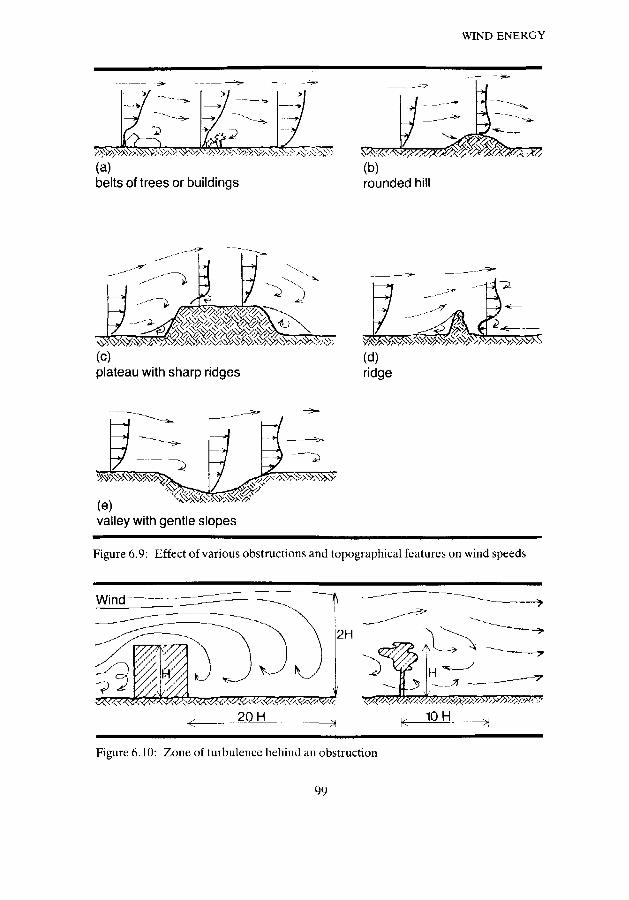
WIND ENERGY
(a)belts of trees or buildings
(b)rounded hill
plateau with sharp ridges
..-=?'
(d)ridge
valley with gentle slopes
Figure 6.9: Effect of various obstructions and topographical features on wind speeds
Wind
20 H 10 H
Figure 6.10: Zone of turbulence behind an obstruction
99

6.9 DESIGN
The power output of a wind pump is usually presented diagrammatically in apower curve, which shows the relationship between hydraulic power output andwind speed (Figure 6.11). The wind pump starts operation at the "cut-in" windspeed (Vin). At greater wind speeds, the hydraulic power output increases untilat the "rated" wind speed (Vr), the maximum power output is obtained. In mostwind-powered pumping systems, a control device will then be activated, whichlimits the rotational speed of rotor and pump. At limited rotor speed, the windpump can continue to operate until the "cut-out" wind speed (VF3-outF3,) isreached. The rotor is then stopped or turned away from the wind to preventdamage.
? p
iydr
(
a.
outp
ut,
(D
o"5 Pd£
1
Rated power
_
_
Design power /
/ \/ I
/IiI11ii
. i ,
iii
iI1IiiiIIi
Vin VoutWind speed, V (m/s)
Figure 6.11: Power curve of wind pump
To work efficiently, the wind pump should be designed for maximum poweroutput in the prevailing range of wind speeds. The power output at the designwind speed (Vd) is called design power (Pd). The design wind speed is generallyin the range of 0.8 to 1.3 times the annual average wind speed.
Values for the power curve are generally in the following ranges:
' design
"rated
= approximately 2/3 Vdl
= 3 - 5 m/s= 8 -10 m/s= 12-16 m/s
lesign
100

WIND ENERGY
For a wind pump to start operation, the wind speed has to be high enough toproduce the necessary starting ("break-away") torque. Once started, the pumpwill need less wind power to run. The starting torque is an importantconsideration in the choice of pump. For example, a plunger pump normally hasa starting torque of about three times the mean torque required when running,whereas the starting torque of a rotary pump is only about 1.5 times the meantorque. Thus, the type of pump selected has considerable influence on the "cut-in" wind speed at which the wind pump starts operation.
6.10 ESTIMATION OF HYDRAULIC OUTPUT
A rough estimate of the average hydraulic power output of a wind pump may bemade with the following "rule of thumb" equation:
P = 0.1 A • V3
where:
P = average hydraulic power output (W)A = area swept by rotor (m2)V = average wind speed (m/s)
Tn this equation, the dimensions do not tally and the equation is only valid forwind pumps of which the wind rotor and pump are well matched, and at siteswhere the average wind speed does not differ very much from the design windspeed.
Example:
A wind pump with a rotor of 5 m diameter at a site with an average wind speed of5 m/s, may be expected to produce an average hydraulic power output of about245 W. Thus, operating 24 hours per day, this wind pump could produce about6 kWh hydraulic energy output per day. This corresponds, for example, toabout 50 m3/d against a pumping head of 40 m, or 200 m3/d through 10 m head.
The diagram presented in Figure 6.12 can be used to estimate the averagehydraulic power output for wind pumps of varying rotor size and operatingunder various combinations of average wind speed and pumping head.
101

Average wind speed (m/s) Water output (m3/d)
10 8 6Rotor diameter (m)
20 40 60 80 100Total pumping head (m)
Figure 6.12: Estimation of average hydraulic power output of wind pump (Rastogi,1982a)
The following method may be used to determine accurately the hydraulicenergy output of a wind pump. A frequency distribution histogram is preparedand multiplied by the power curve for the wind pump to give the hydraulicenergy output histogram (see Figure 6.13). The total energy output over theperiod of analysis can then be determined by adding up all columns in thehistogram.
The annual hydraulic energy output of a wind pump can also be estimatedroughly using the following equation:
Ehydr = 0.9 V3 • A
where:
VA
- annual hydraulic energy output (kWh/year)= average wind speed (m/s)= rotor swept area (m2)
102

WIND ENERGY
o
8C 4 00
3 ?()0
oO
o0.
1V (m/s) V (m/s)
O 2000>•.
ena; lbooc01<_> 1000
TO 500
V (m/s)
Figure 6.13: Determination of hydraulic energy output of wind pump (Rastogi, 1982b)
6.11 MAINTENANCE
Occasionally, lubrication of the bearings, bolt tightening, minor adjustments,and repairs need to be made. A complete overhaul and service will probably berequired once every two or three years. Depending on the quality of the waterpumped, cup seals and other moving parts of the pumps are likely to need morefrequent maintenance. If the wind pump is equipped with a stuffing box, thenthis box should be inspected regularly, say every two months.
These maintenance provisions are all that well-designed wind pumps require.If there is no gearing, there will be no need to change the oil. If conventionalbearings are used on the rotor axis, regular greasing or lubrication is required,which can be organized by the user community. However, permanentlylubricated bearings do not require any maintenance; inspection and servicingonce a year should be sufficient.
103

BIBLIOGRAPHY
- Beurskcns, H.J.M. (1978). Feasibility study of windmills for water supply in MaraRegion, Tanzania (Publication SWD 78-4). Amersfoort, The Netherlands, SteeringCommittee Wind Energy Developing Countries.
- Beurskens, H.J.M. (1981). Wind energy for water pumping in Cape Verde(Publication SWD 81-1). Amersfoort, The Netherlands, Steering Committee WindEnergy Developing Countries.
- Blake, S. (1978). Wind-driven water pumps. Washington, DC, USA, World Bank.
- Blanc, M. lc (1976). Utilization of wind power for water pumping. Paris, France,Groupe de Recherche et d'Exchanges Technologiques(GRET).
- Both, D., and Stelt, L.E.R. van der (1983). Catalogue of wind machines (PublicationSWD 83-1). Amersfoort, The Netherlands, Steering Committee Wind EnergyDeveloping Countries.
- Dempster (undated). Sales literature. Nebraska, USA, Dempster Industries.
- ESCAP (1981). Renewable sources of energy, Vol. Ill: Wind energy. Bangkok,Thailand, United Nations Economic and Social Commission for Asia and the Pacific(ESCAP).
- Exell, R.H.B., Thavapalachandran, S., and Mukhia, P. (1981). The availability ofwind energy in Thailand (AIT Research Report No.134). Bangkok, Thailand,Renewable Energy Resources Information Centre.
- Gay, B., Bruyere, P., and Sarda, J. (1984). Les eoliennes de pompage (Dossier "LePoint Sur" No.l). Paris, France, Groupe de Recherche et d'ExchangesTechnologiques (GRET).
- Gouriercs, D. le (1982). Encrgie eolienne. Paris, France, Editions Eyrolles.
- Hamis, Yahia H., and Jansen, W.A.M. (1980). Wind energy in Sudan (PublicationSWD 81-2). Amersfoort, The Netherlands, Steering Committee Wind EnergyDeveloping Countries.
- Hirschberg, G. (1982). Water pumping windmill book. Hanover, Massachusetts,USA, Brick House Publishing Company.
- Jansen, W.A.M. (1980). Feasibility study of windmills for water supply in YemenArab Republic (Publication SWD 80-5). Amersfoort, The Netherlands, SteeringCommittee Wind Energy Developing Countries.
104

WIND ENERGY
- Klaver, E.G. (1977). Static and dynamic loadings on the tower of a windmill(Publication SWD 77-2). Amersfoort, The Netherlands, Steering Committee WindEnergy Developing Countries.
- Lierop, W.E. van, and Veldhuizcn, L.R. van (1982). Wind energy development inKenya (Publication SWD 82-3). Amersfoort, The Netherlands, Steering CommitteeWind Energy Developing Countries.
- Lysen, E.M., BoslI.G., andCorden, E l l . (1978). Savonius rotors for water pumping(Publication SWD 78-2). Amersfoort, The Netherlands, Steering Committee WindEnergy Developing Countries.
- Lysen, E.H. (1983). Introduction to wind energy (Publication SWD 83-1).Amersfoort, The Netherlands, Steering Committee Wind Energy DevelopingCountries.
- McGuigan, D. (1978). Small-scale wind power. Dorchester, Dorset, UK, Prism Press.
- Opondo, M.N. (1981). Water pumping by wind energy in Kenya, in: Rural watersupply in developing countries, proceedings of training workshop held in Zomba,Malawi, 5-1.2 August 1980. Ottawa, Canada, International Development ResearchCentre.
- Park, J. (1981). The wind power book. Palo Alto, California, USA, Cheshire Books.
- Rastogi, T. (1982a). Wind pump handbook. Bombay, India, Tata Energy ResearchInstitute.
- Rastogi, T. (1982b). Review of literature on promotion of wind pumps. Bombay,India, Tata Energy Research Institute.
- Sherman, M.M. (1977). Practical applications of wind-powered water pumps.Bangkok, Thailand, United Nations Economic and Social Commission for Asia andthe Pacific (ESCAP).
- UNESCO (1981). The potential use of wind energy (UNESCO Courier No.101).Paris, France, United Nations Education and Science Organization.
- Vinayagalingam, T., and Sivasegaran, S. (1979). A variable stroke wind-operatedwater pumping system. Wind Engineering, 3, 2, 127-131.
- WMO (1978). Meteorological aspects of the utilization of wind as an energy source(Technical Note No. 143). Geneva, Switzerland, World Meteorological Organization.
105

7. Hydropower
Hydropower is the energy in flowing water. The amount of hydropoweravailable depends on the fall and flow rate. The main types of hydropoweredpumping devices used in small community water supplies are: hydraulic rampumps; water turbines; and river-current pumps. These pumps can operatecontinuously without a supply of fuel but require civil works, such as dams,weirs, intake structures, and pipelines, the scale and costs of which depend onconditions at each individual location.
7.1 HYDRAULIC RAM PUMPS
Throughout the world, hydraulic ram pumps have been installed to supply waterto villages and farms and this type of pump has given long and reliable service.These pumps operate on the principle of creating a pressure surge, or waterhammer, in the drive pipe by the sudden stoppage of water flowing through it.(Figure 7.1).
Storage tank
r a m £ u m p /Deliverypipe
Figure 7.1: Hydraulic ram pump installation
106

HYDROPOWER
The supply of water from the source must be steady and continuous to operatethe hydraulic ram pump. Hilly or mountainous areas with a good supply offlowing water are suitable locations. These pumps can be operated by a flow ofas little as 4 1/min, provided there is sufficient fall. Alternatively, if the waterflow is fairly great, a fall of 0.8 m is adequate to operate a ram pump.
The inclined pipe feeding the water from the source to the ram pipe is calledthe drive pipe. The essential moving part of the pump is the impulse valve,which, when opened, allows the flow in the drive pipe to gain speed and power.Sudden closure of the valve causes the flow to stop, and thus creates the pressuresurge in the drive pipe which is converted into power for water pumping.
Foundry-made hydraulic ram pumps are strongly built of rigid materials(Figure 7.2). When correctly installed, these pumps are very reliable and can liftwater against considerable pumping heads. They can work satisfactorily formany years and need only limited maintenance.
A number of low-cost hydraulic ram pumps are made from locally availablematerials. Some of these designs use components which are obtainable "off-theshelf", as shown in Figures 7.3 and 7.4.
Delivery pipe
Air chamber / ,
Figure 7.2: Example of hydraulic ram pump (John Blake Ltd.)
107

Drive pipe
Spring tension bolt
Stroke adjustment boltSpring
Impulse valve assembly
Figure 7.3: Example of low-cost hydraulic ram pump (Watt, 1975)
Weights..
n IImpulse valve__| I
alve
I 1 ^
-Cap
Air chamber
Lr.-,,,
ii iiiiMm uinmiiinii
JA/ash-out plug
Figure 7.4: Example of hydraulic ram pump made from off-the-shelf components(Watt, 1975)
108

HYDROPOWER
Locally manufactured hydraulic ram pumps are generally much cheaper thanimported, foundry-made ram pumps. However, the cost saving with thesepumps is not very great, because the cost of the ram pump is only a smallproportion of the total cost of the total installation.
Operation
At the start of the pumping cycle, water from the source runs down the drivepipe, gaining speed and power, and then through the pump body, finallyescaping through the impulse valve (Figure 7.5A). As the flow through theimpulse valve speeds up, the hydraulic pressure on the valve increases until itexceeds the weight of the valve, or the spring load at which the valve is set, andthe valve is then forced to close suddenly. The moving column of water is haltedinstantly, and a pressure surge is created in the drive pipe. The delivery valve isforced to open and water flows through the opened valve into the air chamber(Figure 7.5B). This will continue until the energy of the pressure surge isexhausted. The impulse valve then opens by its own weight, or by its springload,and water from the source starts running again through the drive pipe and a newpumping cycle begins (Figure 7.5A). Most hydraulic ram pumps operate at30-100 pumping cycles per minute, depending on the weight or spring tensionsetting of its impulse valve.
The air chamber cushions the pressure pulses of the water surges entering it,and so ensures that there is a fairly continuous flow through the delivery pipe(Figure 7.5C). A small air valve is fitted to the pump chamber. During eachpumping cycle, a small amount of air is drawn in. This is essential because someair dissolves in the water and leaves the air chamber with the pumped water. Ifthe lost air is not replaced, the air chamber will become full of water and thehydraulic ram will cease to operate.
Hydraulic ram pumps are not self-starting. Usually, the impulse valve isoperated by hand until the pump begins to operate by the impulse action.
The requirements for operation and maintenance of hydraulic ram pumps arelimited to:- occasional adjustment of the impulse valve;- regular check on functioning of delivery valve;- occasional replacement of the valve rubbers;- occasional tightening of bolts.
Occasionally, a ram pump may have to be dismantled for cleaning because ofsand and silt deposited in the pump chambers and in the impulse and deliveryvalves. To prevent debris from entering the drive pipe, a grate or strainer isusually fitted at the intake.
109

Air chamber
:: W Delivery pipe
Drive pipe B
Impulse valve
"•-Delivery valve
Figure 7.5: Operation of hydraulic ram pump
110
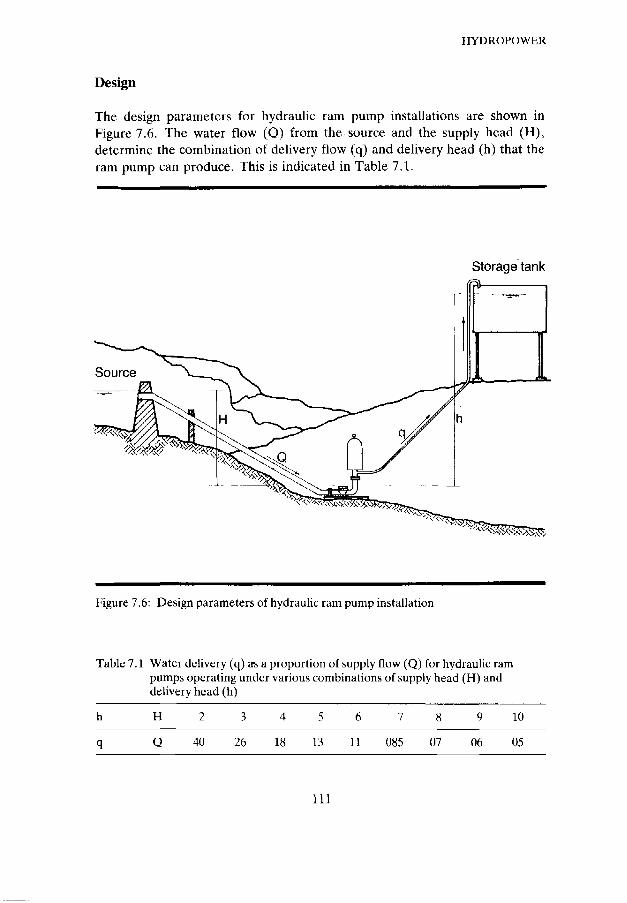
IIYDROPOWER
Design
The design parameters for hydraulie ram pump installations are shown inFigure 7.6. The water flow (Q) from the source and the supply head (H),determine the combination of delivery flow (q) and delivery head (h) that theram pump can produce. This is indicated in Table 7.1.
Storage tank
Figure 7.6: Design parameters of hydraulic ram pump installation
Table 7.1 Water delivery (q) as a proportion of supply flow (Q) for hydraulic rampumps operating under various combinations of supply head (H) anddelivery head (h)
h
q
H
Q
2
40
3
26
4
18
5
13
6
11
7
085
8
07
9
06
10
05
111
Example:
Supply head H = 5 mDelivery head h = 45 mSupply flow rate Q = 100 1/min
The ratio of delivery head to supply head (h/H) is 9. From Table 7.1, theoutput flow rate will be about 0.06 x 100 1/min, or 6 1/min, which is 8.6 m3/day incontinuous operation.
The hydropower available in the supply flow of water can be calculated withthe equation:
Pinput = 0w • g • Q • H
The hydraulic power output produced by the hydraulic ram pump is calculated
as:
Poutpn = ew • g • q • (h-H)
Therefore, the operating efficiency (Rankine efficiency) of a hydraulic rampump is:
where:
TI = operating efficiency (%)h = delivery head (m)H = supply head (m)q = delivery flow rate (1/min)O = supply flow rate (1/min)
Example:
Supply head H = 5 mDelivery head h = 45 mSupply flow rate Q - 100 1/minOutput flow rate q = 6 1/min
112

HYDROPOWER
The operating (Rankine) efficiency of this ram pump is:
Frequently, manufacturers calculate the efficiency with the equation:
e = Q - H
This gives a slightly higher efficiency value than the Rankine efficiency; in theexample it would be 54%.
If the required delivery flow rate is greater than one hydraulic ram pump cansupply under the given conditions, a number of pumps may be installed inparallel, provided the supply flow from the source is sufficient to drive all thepumps. Each pump unit must have its own drive pipe, but the water can bedelivered through a common delivery pipe (Figure 7.7).
Storage tank
Figure 7.7: Hydraulic ram pumps operating in parallel
113
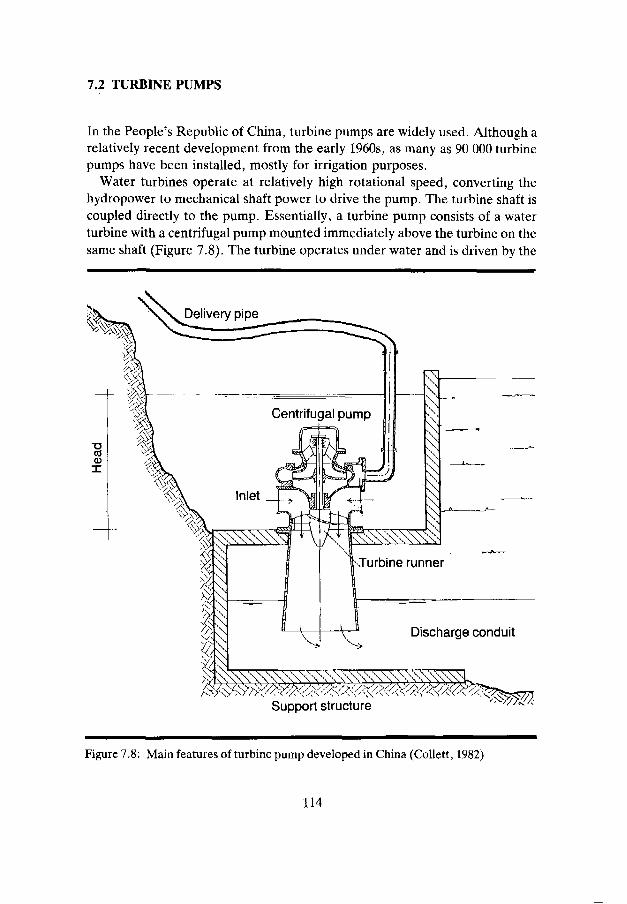
7.2 TURBINE PUMPS
In the People's Republic of China, turbine pumps are widely used. Although arelatively recent development from the early 1960s, as many as 90 000 turbinepumps have been installed, mostly for irrigation purposes.
Water turbines operate at relatively high rotational speed, converting thehydropower to mechanical shaft power to drive the pump. The turbine shaft iscoupled directly to the pump. Essentially, a turbine pump consists of a waterturbine with a centrifugal pump mounted immediately above the turbine on thesame shaft (Figure 7.8). The turbine operates under water and is driven by the
Support structure
Figure 7.8: Main features of turbine pump developed in China (Collett, 1982)
114

HYDROPOWER
water running through it. Usually, it has an axial-flow propeller with fixedblades rotating in a casing with fixed or adjustable guide vanes. The supportstructure on which it is installed is usually in a separate channel, with a sluicegate used to control the water flow. A wide range of turbine pumps is availablefor varying conditions and requirements. Rivers, streams or channels with waterflows of 15 1/s minimum, and where a head of at least 0.5 m can be obtained,provide suitable conditions for turbine pumps.
Cost analyses based on the limited data available from China, show thatturbine pumps are significantly cheaper per kWh of hydraulic energy outputthan electric motor pumps or diesel pumps. Turbine pumps, therefore, may beexpected to be economically attractive in most situations where conditions aresuitable for their use.
Turbines with fixed blades are only efficient for a narrow range of flow rates.In locations where the supply flow varies considerably, it is advantageous toinstall several small turbine pumps rather than a single large unit, because eachindividual unit can then be operated at the flow rate for which it has beendesigned. It is good practice to provide at least two units, one of twice the designflow rating of the other. In this arrangement, the larger unit can be operated inflows about two-thirds of the maximum flow, and the smaller unit when the flowis one-third of the maximum. Efficient operation will then be possible at one-third of the maximum flow with the smallest unit, at two-thirds of maximum flowwith the larger unit, and at maximum flow with the two units operating together.
7.3 RIVER-CURRENT PUMPS
There are a number of river-current or in-stream pump models that use thekinetic energy of river current, without the need for civil works, such as dams orpenstocks, to drive the pump. They extract energy from the current in a largeriver, instead of using the head of a stream.
The ITDG pump has a vertical shaft rotor which is suspended in the riverwater from a floating pontoon (Figure 7.9). The power from the rotor istransmitted by a belt to a small centrifugal pump which delivers water through afloating pipeline to a tank on the river bank. Tests conducted on the River Jubain southern Sudan have shown that a prototype pump with a rotor of about 3 mdiameter operating in a river current of 1.0 m/s, could deliver about 100 1/minagainst a head of 5 m. Design calculations indicate that the water output wouldbe about 300 1/min in a river current of 1.5 m/s. Cost analyses indicate that thedevice is generally competitive in cost with diesel pumps, especially where fuel isscarce and expensive.
115

Centrifugal pump
U Rotor withhydrofoil blades
Figure 7.9: ITDG river-current pump (Collett, 1981)
A similar pump, known as the Rio-Bomba, has been developed in Colombiato supply water to riverside communities. A water output of 50 1/min has beenobtained in river currents of 1.0 m/s and against a head of 8 m.
The Plata pump has been designed to pump water from streams or rivers usingthe energy available from a small fall. A working flow of 30 1/s with a fall of0.4 m is sufficient to operate the pump. The available flow at potential sites hasto be measured to establish whether stream flow is sufficient, taking into accountseasonal variations. The maximum head for the Plata pump is about 0.9 m.According to test results, at a flow of 85 1/s and 0.6 m fall, sufficient power isproduced to deliver 45 1/min against a head of 3 m, or 10 1/min to a height of40 m. The drive unit is a special low-head water turbine, in which propellerrunners are mounted in tandem. The turbine generates maximum power whenhalf full, and will cease to operate when water fills it completely. The shaft isconnected by a reciprocating crank to two small single-acting plunger pumps.There are a number of settings available on the crank disc to adjust pumpoperation to the available head and the discharge capacity required at a givensite. A small dam of planks, sand bags, or similar materials may need to beconstructed to create the required head. To avoid damage from floating debris,the turbine intake is fitted with a delta-shaped grid which may have to be cleareddaily.
1.16
IIYDROPOWER
IHHUOGRAPHY
- A vertical-axis river turbine pump (1977). Appropriate Technology, 4, 2.
- Collett, J. (1981). llydropowered water-lifting devices for irrigation, in: Proceedingsof FAO/DANIDA workshop on water-lifting devices in Asia and the Near East,Bangkok, 4-14 December 1979. Rome, Italy, Food and Agriculture Organization ofthe United Nations.
- Collett, J. (1982). Chinese water-lifting devices, inappropriate Technology, 9 , 2. 26-28.
- ESCAP (1982). Small hydropower development. Bangkok, Thailand, United NationsEconomic and Social Commission for Asia and the Pacific (ESCAP).
- Fritz, J. (1980). Mini-hydropower. Washington, DC, USA, National Academy ofSciences.
- Inversin, A.R. (1978). A hydraulic ram for tropical climates. Arlington, Virginia,USA, Volunteers in Technical Assistance (VITA).
- Inversin, A.R. (1978). The construction of a hydraulic ram pump. Boroko, PapuaNew Guinea, South Pacific Appropriate Technology Foundation.
- John Blake Ltd. (undated). Blake hydraulic ram pump (sales literature). UK, lohneBlake Ltd.
- Kindel, E.W. (1979). A hydraulic ram for village use (VITA Technical BulletinNo.56). Arlington, Virginia, USA, Volunteers in Technical Assistance.
- Marshall, K. (1982). Evaluation of water-current turbines in southern Sudan. Rugby,UK, Intermediate Technology Industrial Services.
- Pompa air: Automatic Hydraulic Ram (1977). Bandung, Indonesia, DevelopmentTechnology Centre, Institute of Technology.
- Silver, M. (1978). The use of hydraulic rams in Nepal: a guide to manufacturing andinstallation. Katmandu, Nepal, UNICEF.
- Tiemersma, J.J., and Heeren, N.A. (1984). Small-scale hydropower technologies.Amsterdam/Delft, The Netherlands, TOOL Foundation and Centre for AppropriateTechnology.
- Watt, S.B. (1975). A manual on the hydraulic ram for pumping water. London, UK,Intermediate Technology Publications Ltd.
117

8. Biomass energy
Combustible gases or fluids can be produced from biomass, such as human andanimal waste, crop residues, sugar-cane, cassava, eucalyptus, palm-oil, andaquatic weeds and plants. These gases or fluids can be used as fuel for enginesdriving a water pump. The two main groups of biomass conversion technologiesto produce combustible gases or fluids are biochemical conversion andthermochemical conversion. Biochemical conversion, or digestion, of organicbiomass is a natural process involving several concurrent bacterial andenzymatic processes. When occurring in an oxygen-free environment, thedigestion is anaerobic and a combustible gas known as biogas is produced.Energy-rich fluids, such as alcohol, ethanol and methanol, are produced byanother biochemical conversion process of biomass, namely, fermentation.Thermochemical conversion of biomass occurs when it is heated under partial orcomplete exclusion of air. The main processes taking place are pyrolysis, inwhich biomass material is transformed by heating, and gasification, in which gasis produced by incomplete combustion of heated biomass. The combustible gasproduced, which consists of a mixture of carbon monoxide, hydrogen andmethane, is known as producer gas.
8.1 BIOGAS PRODUCTION PROCESS
The most common method of biogas production is anaerobic digestion in aclosed tank, called a "digester". The biomass is mixed in the digester with waterto form a slurry, in which anaerobic digestion takes place in two steps, in the firststep, called liquefaction,organic matter is broken down by enzymatic hydrolysisand fermented to form mainly acids and alcohols. Subsequently, in thegasification phase, methane bacteria break the acids and alcohols down tomethane and carbon dioxide, and small amounts of other gases, such as carbonmonoxide, nitrogen and hydrogen sulphide. Biogas contains about 60%methane and 40% carbon dioxide; the small amount of hydrogen sulphide givesthe gas a slight odour of rotting eggs. The calorific value of biogas is 23-26 MJ ofheat energy per m3 gas.
The bacterial and enzymatic processes of anaerobic digestion are sensitive tovariations in temperature, water content, and general composition of the slurryin the digester. Biogas is only produced if air is completely excluded from thedigester so that an anaerobic condition can develop. Therefore, the digestertank must be airtight.
118

BIOMASS ENERGY
Water content of slurry
If the water content of the slurry is too low, the bacteria and other micro-organisms cannot function effectively and the quantity of biogas produced willbe small. If the slurry is too dilute, relatively little organic material can bedigested and biogas production is limited.
If human excreta and urine, manure, and wastes from poultry are mainly usedas digester feed, then the biomass water ratio should be between 1:1 and1:2. Thus, for every 100 kg of faeces and urine, 100-200 litres of water isrequired. If the raw material is mainly crop stalk, more water is needed in a ratioof 1:3 or 1:4. Good mixing of the liquid in the digester tank is essential topromote effective digestion, especially if raw, stalky biomass is used.
Temperature and retention period
The temperature of the slurry in the digester is a very important factor for theefficiency of the digestion process. Most anaerobic bacteria function best in thetemperature range of 30 to 35°C, and this is the optimal temperature for biogasproduction. The temperature in the digester tank should always be above 20°C,because at a lower temperature, little biogas is produced and below 10°C,digestion stops completely.
Retention periods of 40-60 days for the slurry in the digester tank are usual inmost tropical countries. If ambient temperatures arc high, for example, onaverage between 30 and 35°C, a shorter retention period of 30-40 days may besufficient. In cooler climates, longer retention periods of 80-90 days are common(Figure 8.1).
Acidity/alkalinity of mixture
Methane bacteria are very sensitive to variations in the acidity/alkalinity (pH) ofthe slurry in the digester. For optimal functioning, the pH value of the slurryshould be kept within the range of 6.8 to 7.5, that is, neutral to slightly alkaline.The pH value can be determined reasonably accurately from a litmus-paper testin a water sample. During the digestion process, organic acids are produced, andif not controlled, the mixture in the tank may gradually become acid, thusseriously disturbing the bacterial and enzymatic processes. Alkaline material,such as lime or ashes, should be added regularly to the mixture to keep the pHvalue within the desired range.
119

20 60 80 100Detention time (days)
Figure 8.1: Biogas production as a function of retention period and temperature(BORDA, 1982)
Nutrients
Nitrogen is essential for bacterial growth and activity. Raw materials having alow carbon/nitrogen ratio are readily digested, but crop stalks, such as wheat orrice straw (see Table 8.1), require an additional supply of nitrogen for efficientdigestion. The high cellulose content of grass and crop stalks makes themdifficult to digest. Human faeces and urine, and also animal wastes, are rich innitrogen and nutrients suitable for growth and multiplication of anaerobicbacteria. For optimal biogas production, the various types of biomass materialmust be fed in carefully balanced and mixed proportions. It is recommendedthat the carbon/nitrogen ratio of the combined input materials is kept below30:1. A summary of the optimal ranges for biogas production parameters isgiven in Table 8.2.
120

BIOMASS ENERGY
Table 8.1: Carbon/nitrogen ratios of various biomass materials (Gary, 1979)
Raw materials Carbon/nitrogen ratio
Wheat straw 87 : 1Rice straw 67 ; 1Fresh cattle dung 25 : 1Fresh human faeces 3 : I
Table 8.2: Parameters of biogas production and general range of optimal values
Parameter Optimal range
Temperature (°C) 30 - 35pH 6.8-7.5Carbon/nitrogen ratio 20 - 30Retention time (days) 40 - 60Water/solids ratio 6-10
8.2 BIOGAS PRODUCTION PLANT
A very simple biogas production plant, comprising one or more digesters and agas holder, can be made from oil drums (Figure 8.2). The biomass is fed inbatches into the digester drums, filling one after the other.
Several types of small-size biogas production plants are used in China, andsince the early 1970s, several millions have been built, mostly in SzechuanProvince. The majority are family units of 6-10 m3 volume, producing 1-2 m3
biogas daily from human and animal waste, with some vegetable material asadditional feed. There are also tens of thousands of medium-size (about 50 m3
volume) and large (more than 100 m3 volume) plants, with gas production ratesof 10-20% of digester volume per day.
A circular digester of brick or cemented masonry with a fixed dome iscommon in China (Figure 8.3). There are no metal parts except for a smalllength of steel pipe to deliver the gas. This design requires a relatively high levelof technical skill to construct. In practice, many digesters of this type appear tobe not completely airtight and gas leakage is a common problem.
In India, about 80 000 small biogas plants of 8-10 m3 volume have beeninstalled, most producing biogas from cow dung. The plant has been named theKVIC digester, after the Khadi and Village Industries Commission promotingit. The digester tank is a concrete, cylindrical pit sunk partly into the ground, and
121
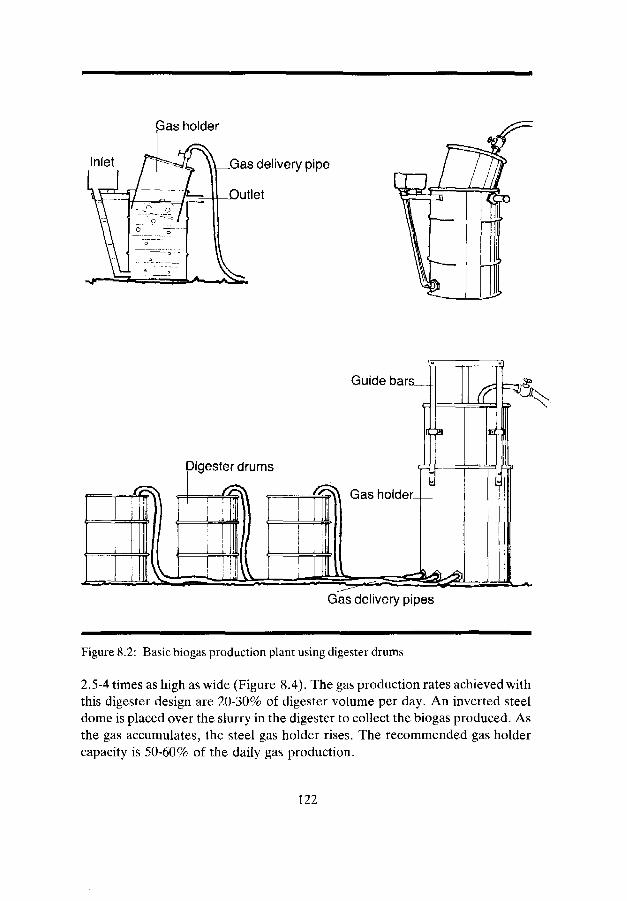
Gas delivery pipe
utlet
Guide bars
Gas delivery pipes
Figure 8.2: Basic biogas production plant using digester drums
2.5-4 times as high as wide (Figure 8.4). The gas production rates achieved withthis digester design are 20-30% of digester volume per day. An inverted steeldome is placed over the slurry in the digester to collect the biogas produced. Asthe gas accumulates, the steel gas holder rises. The recommended gas holdercapacity is 50-60% of the daily gas production.
122

BIOMASS ENERGY
Inlet
Gas delivery pipe
Removable cover Outlet pit
Figure 8.3: Circular fixed-dome digester used in China (McGarry, 1978)
A similar type of digester has been developed in India, and is known as theJanata digester. A fixed, dome-shaped cover built over the digester serves as thegas holder (Figure 8.5). The simple design, which can be constructed from localmaterials without the need for a steel dome, makes this an attractive alternative.
In Pakistan, a biogas production plant has been developed which has anexternal water seal around the gas holder wall to eliminate foul odours, and toreduce the corrosive action of the hydrogen sulphide in the biogas (Figure 8.6).This design reduces gas leakage and maintenance costs, but is relativelyexpensive to construct.
A simple biogas production plant, using a flexible bag for both the digestertank and gas holder, has been developed in Botswana (Figure 8.7). These units,which vary in size from 10-400 m3 volume, are easy to transport, simple to install,and inexpensive to construct. In the Philippines, a biogas production plant isconstructed with a digester tank comprising two compartments (Figure 8.8).Most of the sludge settles in the first compartment, thus preventing blockage ofthe pipe connection to the second compartment. A floating gas holder is used.
123

Mixing pit Gas holder Gas delivery pipe
Figure 8.4: KVIC digester with floating gas holder (Tarn, 1983)
Gas delivery pipe
Mixing pit Slurry removal pit
W&-
X%
%Figure 8.5: Janata digester with fixed dome (Barnett, 1978)
124
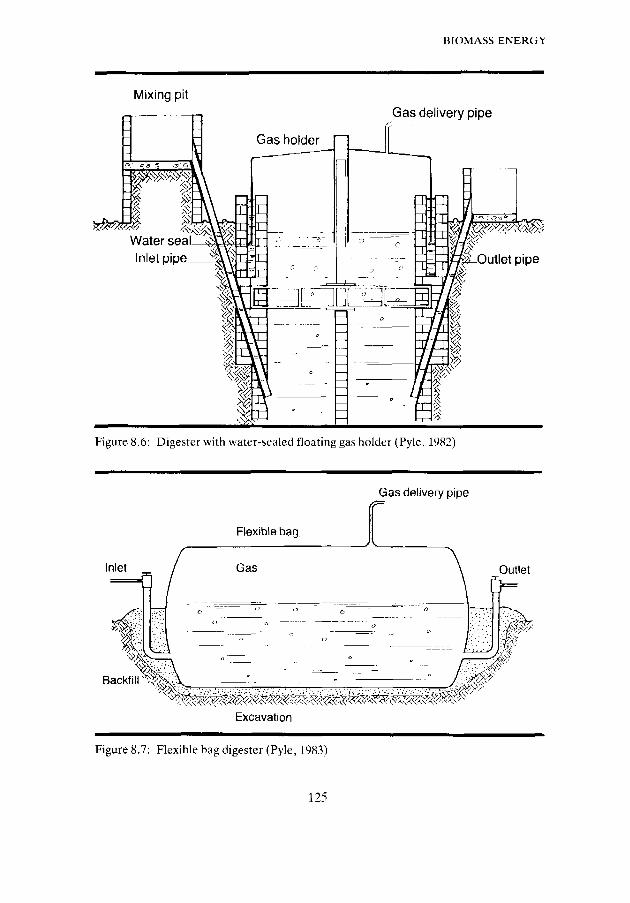
13IOMASS ENERGY
Mixing pitGas delivery pipe
Figure 8.6: Digester with water-sealed floating gas holder (Pyle, 1982)
Inlet
Gas delivery pipe
Backfill m
Excavation
Outlet
Figure 8.7: Flexible bag digester (Pyle, 1983)
125

Handle Gas delivery pipe
Figure 8.8: Two-compartment digester with floating gas holder, the Philippines(Arceo, 1983)
Biogas production rates
The rate of biogas production depends on the biomass material and type of plantused. A rough indication of production rates for various types of animal waste isgiven in Table 8.3. Generally, the gas production rate may be roughlyestimated to be 10-30% of digester volume per day, depending on feed material,type of digester plant, ambient temperature, and other operating conditions.
Production of sufficient biogas to supply fuel for water pumping may bedifficult in the cooler season. If the biogas digester were designed to producesufficient gas to replace the entire diesel fuel requirement even in the coolseason, the digester would have to be very large and thus construction costswould be extremely high. It will be more economical to design the biogas
Table 8.3: Biogas production rates for various types of feed materials (Mazumdar,1982)
Animal waste Amount available Gas production rate (kg/d) (m'/d)
1 buffalo1 zebu cow1 calf'pig10 chickens1 sheep/goat1 latrine user
108
150.50-0.75100.25-0.40
0.15-0.25250.05-0.10
0.02-0.040.02-0.04
10.02-0.03
126

BIOMASS ENERGY
production plant to provide most of the fuel requirement, say 80%, in thewarmer months of the year, but less, say 40%, in the cooler months. Althoughmore diesel fuel will be required, the saving on the construction cost of the gasproduction plant will result in lower overall costs.
8.3 ENGINES USING BIOGAS AS FUEL
Spark-ignited engines can run on biogas alone. Diesel engines require somemodifications to enable them to run mainly on biogas supplemented by dieselfuel. This is "dual-fuel" operation, with up to 60% of the diesel requirementreplaced by biogas. Experience shows that it is not practical to replace more ofthe diesel requirement, because of operating constraints with diesel engines.The temperature in the engine's combustion chamber is highest (about 700° C)at the end of the compression stroke, but this is lower than the temperature atwhich a biogas/air mixture ignites spontaneously. Thus, injection of a smallsupplement of diesel fuel is always required to ensure ready ignition of thebiogas/air mixture.
Most diesel engines can be modified for dual-fuel operation. In many cases,the simplest arrangement is to connect the biogas supply pipe directly to the airintake pipe of the engine, behind the filter (Figure 8.9). To ensure satisfactory
Butterfly valveair feed control Spring Wire netting
Fitted to engine
Gas feed
Figure 8.9: Diesel engine modification for dual-fuel operation (Kasturirangan, 1976)
127

dual-fuel operation, the hydrogen sulphide component of the biogas must beremoved by purification. The peak power output of a modified diesel enginerunning on biogas is 25-35% less than if diesel fuel is used exclusively.
In principle, petrol engines can also run on biogas with a little petrol forstarting up. A standard carburettor may be used for feeding the biogas in, butspecially designed gas carburettors will generally give better results(Figure 8.10).
Gas feed.Combustion chamber
.Piston
Crankshaft
Figure 8.10: Carburettor designed for petrol engine running on biogas (Kasturirangan,1976)
8.4 GASIFICATION
In the gasification process, dry biomass is heated and gasified to producecombustible gas known as producer gas. Suitable biomass materials forgasification are wood, charcoal, coal, and a variety of other dry organicmaterials, such as woodchips, sawdust, coconut shells, maize cobs, palmnutkernels, and fruit pits. Gasification is quite different from biogas production,because the process takes place in a dry environment.
128
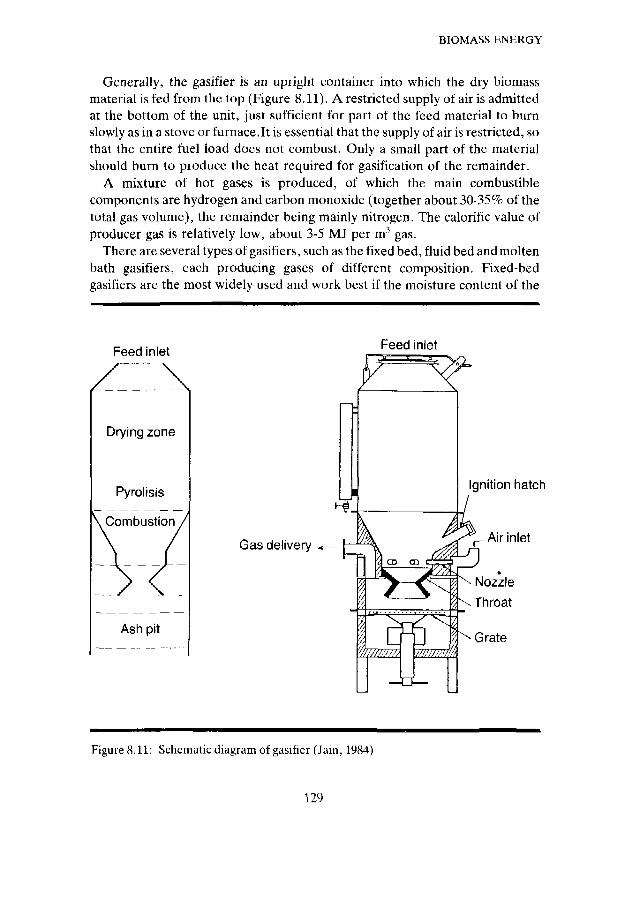
BIOMASS ENERGY
Generally, the gasifier is an upright container into which the dry biomassmaterial is fed from the top (Figure 8.11). A restricted supply of air is admittedat the bottom of the unit, just sufficient for part of the feed material to burnslowly as in a stove or furnace.lt is essential that the supply of air is restricted, sothat the entire fuel load does not combust. Only a small part of the materialshould burn to produce the heat required for gasification of the remainder.
A mixture of hot gases is produced, of which the main combustiblecomponents are hydrogen and carbon monoxide (together about 30-35% of thetotal gas volume), the remainder being mainly nitrogen. The calorific value ofproducer gas is relatively low, about 3-5 MJ per m3 gas.
There are several types of gasifiers, such as the fixed bed, fluid bed and moltenbath gasifiers, each producing gases of different composition. Fixed-bedgasifiers are the most widely used and work best if the moisture content of the
Feed inlet Feed inlet
Drying zone
Pyrolisis
, Combustion
Ash pit
Gas delivery
Ignition hatch
Air inlet
Nozzle
^.Throat
Grate
Figure 8.11: Schematic diagram of gasifier (Jain, 1984)
129

feed material is less than 25%. However, counter-current gasifiers mayeffectively use biomass feed with a moisture content of up to 40-50%.
Depending on the gasifier design, type of feed material, and operatingconditions, the gas produced may contain substantial quantities of tar and sootand may be toxic because of the high carbon monoxide content. Therefore, thegas may need to be purified before use.
Feed material for gasifiers should not be too large in size because theefficiency of the gasification process depends on the contact surface between airand feed material. The best results are obtained with feed materials which arehighly porous, reasonably moist, and of low ash content. Because of the manyvariables involved, operation of gasifiers is not easy to control and requiresconsiderable skill. The efficiency of gasification is generally higher for largeplants than for small plants.
8.5 ENGINES USING PRODUCER GAS AS FUEL
The power output of a gasifier is usually given as the peak shaft power of theengine using the producer gas. Gasifiers are available with peak shaft powerratings of 7.5 kW and more. Spark-ignited engines can run on producer gasalone, whereas for diesel engines, the gas needs to be mixed with a supplementof diesel fuel to ensure ready ignition and combustion. Most petrol engines canrun on producer gas, but efficiency is low. Modern high speed petrol engines arcnot particularly suited to operation on producer gas, because they have smallinlet valves which are easily blocked by the impurities in the gas. The mixture ofproducer gas and air also has a much lower combustion rate than has petrol/airvapour, and the power output of a petrol engine running on producer gas is only50-60% of the petrol rated output.
8.6 ETHANOL PRODUCTION
Ethanol is produced by anaerobic conversion of sugars by micro-organisms,such as yeasts, bacteria or fungi. Sugars are present in biomass in the form ofcarbohydrates, starch, and also in cellulose material. Sugar crop residues, suchas sugar-cane, cassava, sugar beet and sweet sorghum, are more suitable forethanol production than are grain wastes. An indication of the ethanolproduction from various types of carbohydrate sources is given in Table 8.4.
130

B1OMASS ENERGY
Table 8.4: Ethanoi production from various types of carbohydrate sources (Alam,1982)
Carbohydrate source Ethanoi production (litre/tonne)
Sugar-cane 67Cassava 180Sweet sorghum 85
Data represent averages obtained in Brazil with conventional production processes.
8.7 ENGINES USING ETHANOL AS FUEL
Ethanoi can be blended with petrol and used in spark-ignited engines whichneed no modifications, provided the ethanoi content is less than 20%. If fuel of ahigher ethanoi content is to be used, then modifications must be made to thecarburettor, ignition system or cylinder head. Special engines have beendeveloped which can run on ethanoi exclusively.
131

BIBLIOGRAPHY
- Alain, W., and Amos, J.M. (1982). The economies of scale of fuel-grade ethanolplants. Energy, 7 , 6 , 479-481.
- Arceo, T.L. (1983). Biogas digesters in the Philippines. NSTA Technology Journal, 84, 26-32.
- Barnett, A., Pyle, L., and Subramanian, S.K. (1978). Biogas technology of the thirdworld (IDRC Document 352.1/78 Bl). Ottawa, Canada, International DevelopmentResearch Centre.
- BORDA (1982), Biogas: manual for the research of biogas programmes. Bremen,Federal Republic of Germany, Bremen Overseas Research and DevelopmentAssociation.
- Datta, R., and Dutt, G.S. (1981). Producer gas engines in villages of developingcountries. Science, 213 , 731-736.
- ESCAP (1981). Renewable sources of energy, Vol. II: Biogas. Bangkok, Thailand,United Nations Economic and Social Commission for Asia and the Pacific.
- Foley, G., and Bernard, G.W. (1983). Biomass gasification in developing countries(Technical Report No.l). London, UK, Earthscan.
- Gary, H.P.,Pande, P. C , and Thanui,K. P. (1979). Designing a suitable biogas plant inIndia. Appropriate Technology, 7 , 1 , 29-31.
- Hall, D.O., Bernard, G.W., and Moss, P.A. (1982). Biomass energy for developingcountries. Oxford, UK, Pergamon Press.
- Jain, B.C. (1984). Gasifier systems for energy production from biomass and theireconomies. Bio-energy News, 2 , 5/6, 33-41.
- Kasturirangan, K. et al. (1976). Use of biogas in diesel engines, in: Proceedings of3rd national conference on internal combustion engines, University of Roorkee, India,177-178.
- Love, P. (1981). Economics of alcohol fuel production and use. in: Proceedings of2nd Canadian national alcohol for power conference. Winnipeg, Manitoba, Canada.Biomass Energy Institute.
- Mathur, V.K. et al. (1983). Coal gasification using solar energy. Solar Energy, 30 , 5,433.
- Mazumdar, A. (1982). Biogas handbook. Bombay, India, Tata Energy ResearchInstitute.
132

BIOMASS ENERGY
McGarry, M.G., and Stainforth, J. (eds.) (1978). Compost, fertilizer and biogasproduction from human and farm wastes in the People's Republic of China(Publication TS 8e). Ottawa, Canada, International Development Research Centre.
Parker, H.W. (1981). Engine fuels from biomass. Journal of Energy ResourcesTechnology, 193, 4 , 344-351.
Pyle, D.L. (1982). Anaerobic digester designs in the third world, in: Proceedings ofthe international symposium on anaerobic digestion, held at Cardiff, Wales, UK,April 1981. London, UK, Applied Science Publishers.
Pyle, D.L. (1983). Anaerobic digester principles and design alternatives, in: Reportof training workshop on monitoring and evaluation of biogas systems, held at Lusaka,Zambia, September 1982 (Document CSC (83) AEP-14). London, UK,Commonwealth Science Council.
Rolz, C. (1981). Ethanol from sugar crops. Journal of Enzyme and MicrobialTechnology, 3,1,19-23.
Tarn, D.M., and Thanh, N.C. (1983). Biogas technology in Asia:the perspectives.Renewable Energy Review Journal, 5 , 1 , 1-29.
UNESCO (1982). Review of literature on promotion of biogas systems. Paris,France, United Nations Educational and Science Organization (UNESCO).
United Nations (1980). Guidebook on biogas development (Energy ResourcesDevelopment Scries No.21). New York, USA, United Nations.
133

134

APPENDIX A
GLOSSARY OF TERMS
Alternating current
Anemometer
Aquifer
Electrical current of which the direction is reversed atfrequent intervals, 120 times per second (60 cyclesper second), as used in electric grid power supply.
A device for measuring wind speed.
Water-bearing geological formation.
Basement (geological) Subsurface interface beneath which only dense rockis found.
Calorie
Capital recovery factor
Capital costs
Centrifugal pump
Communityinvolvement
Unit of measurement of heat energy; quantity of heatenergy required to raise the temperature of one gramof water by one degree Celcius.
The proportion of a capital investment to berecovered each year to amortize fully the originalamount in the specified number of years at theselected discount rate.
All costs associated with the construction orinstallation of a system.
A pump using the principle of centrifugal force to liftwater; the centrifugal force is imparted on the waterby an impeller rotating within a casing; an impellerand its casing are called a "stage"; centrifugal pumpshaving more than one impeller arc called multi-stagecentrifugal pumps.
The active involvement of the community in theplanning, operation and control of amenities andfacilities.
135

Cut-in wind speed
Cut-off wind speed
Deep-well pump
Design month
Diffuse radiation
Direct current
Direct radiation
Discount rate
Distribution system
Drinking water
The wind speed at which a windmill starts producinguseful output; not identical to the start-up wind speedwhich is required for a wind pump to start operation.
The wind speed at which a wind pump is designed tostop operation, to prevent it from being damaged bystrong winds.
Pump capable of lifting water from a deep well orborehole; the term applies to both powered pumpsand hand pumps.
For the purposes of sizing a solar pump, wind pump,hydro-powered pump, it is convenient to choose a"critical month" (least solar irradiation, least wind,least water flow rate) for which the pump mustprovide the water requirement; this month is termedthe design month.
Solar radiation scattered by the atmosphere.
Electric current of which the direction is constantlythe same.
Solar radiation transmitted directly through theatmosphere.
The rate at which the value of future money isdiscounted to calculate present value; usuallyexpressed in an annual percentage.
The pipes, valves, pumps, and other (for water)equipment used to bring water from the source,treatment plant, or bulk supply, to the users.
Potable water; water safe for human consumption.
136

Draw down
Efficiency
Equivalent annualcosts
Excreta
Extra terrestrial
Ferrocement
Flow rate
Global irradiance
Groundwater
Groundwater level
The distance the water level in a well drops duringpumping.
- The daily energy efficiency (of the subsystem) isthe ratio of hydraulic energy output to electricenergy output of the energy supply system, over aday.
- The power efficiency (of the subsystem) is the ratioof hydraulic power output to electric power inputat any time.
The costs of a pumping system expressed as theequivalent annual payment to be made over itslifetime.
Solid and liquid waste products, human and animal(faeces and urine).
The solar radiation received at the periphery of theearth's atmosphere.
Sand/cement mixture reinforced by thin wire mesh orsimilar reinforcement; used as building material forwater storage tanks, housing, boats, etc.
The volume of liquid pumped per unit of time;usually expressed in cubic metres per second.
The sum of diffuse and direct solar irradianceincident on a horizontal surface at ground level.
Without further specification: water occupying allvoids within a geological formation. In practice:water which infiltrates into, travels through and isstored in sub-surface formations, in appreciablequantities.
The level below which all voids of the rock or soil arefull of water; same as groundwater table.
137
Hydraulic energy
Hydrogeology
Impedance matching
Inverter
Joule
Kinetic energy
Kilowatt hour
Level of service
Maintenance
Manpowerdevelopment
Maximum power
The energy effectively used to lift water.
The branch of science which deals with theoccurrence, distribution and movement of waterbelow the surface of the earth.
The process of matching the output of the powersupply source to the power requirement of the motor-and-pump sub-system so that there is an optimaltransfer of power between the two.
An electronic device for converting direct electriccurrent to alternative current.
Measure of work; one Joule is approximately theamount of work done when 0.1 kilogram mass islifted vertically over one metre against gravity (at sealevel) (abbreviation, J).
The energy which a moving mass possesses by virtueof its motion.
Amount of energy; one kilowatt-hour is consumedwhen a power source of one kilowatt capacity is usedfor a period of one hour (abbreviation, kWh).
Degree of accessibility and convenience of the watersupply, or of the waste and waste water disposalservices.
Activities related to the running and upkeep ofequipment, necessary for efficient functioning.
Systematically planned action towards attainment ofa balance between available manpower andmanpower requirements, both present and future,and in quantity and also as quality.
Electronic impedance matching device to pointtrackcrhold the output of a photovoltaic array at itsmaximum value.
138

Open circuit voltage
Opportunity cost
Packing factor
Peak watt
pH
Photovoltaic array
Positive-displacement
Power
Power coefficient
Present value
Prime mover
The voltage of a photovoltaic cell, module or array,measured at the terminals when there is no electricalload.
The best alternative use of a cost; the true value ofmoney paid for a good or service.
The ratio of cell area to gross area for a photovoltaicarray.
Unit of measurement for power output of aphotovoltaic module or array under referenceconditions (abbreviation, Wp).
The parameter denoting acidity or alkalinity ofwater; pH values range from 0 to 14; a pH of 7indicates neutrality, pH values below 7 indicatesincreasing acidity, and pH values above 7 indicateincreasing alkalinity.
An assembly of photovoltaic modules set in aframework together with the necessary wiring,capable of producing electric power output.
Type of pump in which a certain quantity ofpumpwater is entrapped at the beginning of eachpumping cycle; capable of delivering this quantity ofwater at a higher elevation or against pressure; forexample, a reciprocating plunger pump.
Capacity of supplying energy; measured in watt.
Ratio representing that proportion of the total poweravailable in the wind which is extracted from it by awind rotor; the theoretical maximum value is 16/27(abbreviation, Cp).
The value of a future cost or benefit expressed inpresent day money.
Power source (for a pumping system).
139

Pumping head
Pump stroke
Recurrent costs
Revolving fund
Rotor (of a windpump)
Solar cell
Solar irradiance
Solar irradiation
Standard design
The total difference in head between the pumpinglevel of the water source and the level at which thewater is delivered in free discharge; also called totalhead.
The distance the plunger in the cylinder of a pumptravels between its highest and lowest point.
All costs associated with operating and maintaining a(water supply or pumping) system.
Fund established by the initial deposit of a fixedamount, and receiving periodic returns on thisinvestment; loans made from this fund areearmarked for a specified purpose (such as watersupply improvements); repayments on loans to thefund are used again for the specified purpose.
The main component of a wind pump whichintercepts the wind and converts the kinetic energypresent in the wind, into mechanical energy as shaftpower.
Photovoltaic device (semi-conductor) which canconvert solar radiation directly into electricity.
The radiant power received per unit area from thesun.
The energy received per unit area from the sun in aspecified time period, generally taken to be a daywith the solar irradiation expressed in kWh or MJ perm2 per day.
Set of technical drawings, specifications, bills ofquantities, and description of construction method,which can be applied on a large scale and under awide range of conditions.
140

Static head
Submersible pump
Sub-system
Swept rotor area
Torque
Turbine pump
Watt
Yield
The vertical height through which water is lifted by apumping system.
A pump/motor set consisting of a centrifugal pumpand a directly coupled electric motor; suitable forsubmerged operation under water.
The motor-and pump component of a solar pumpingsystem; converts the electric output of the powersupply system into useful hydraulic output.
The area swept by the blades of a wind rotor.
The force that acts to produce rotation.
Type of pump which lifts water by mechanical action,similar to an aircraft propellor.
Unit of measurement of rate of work generally, andelectric power specifically. 1 kilowatt = 1,000 watt1 megawatt = 1 million watt
Flow rate of water from a well or borehole.
141

APPENDIX B
CALCULATION OF UNIT COSTS
The procedure for the calculation of unit cost for each type of pumping system is asfollows:
1. Calculate the hydraulic energy output (kWh/d) on the basis of delivery head (m)and water output (nrVd). (Section 4.3)
2. Calculate the required size of pumping system and its capital cost ($). (Sections 3.5and 3.6)
3. Select the adequate size of storage tank (m3), and calculate the capital cost ($).(Section 3.7)
4. Estimate lifetime of pumping system (years). (Sections 3.5 and 3.6)
5. Calculate the annual equivalent capital cost ($/year) for pumping system andstorage tank, using appropriate discount rate.
6. Estimate annual recurrent costs ($/year). (Section 3.4)
7. Add the amounts in steps 5 and 6 to determine the total annual costs ($/year).
8. Divide by 365 to find total costs per day ($/day).
9. Divide by daily water output (m'/d) to find cost per m3 of water pumped ($/m3).
10. Divide by daily hydraulic energy output (kWh/d) to find cost per kWh hydraulicenergy output ($/kWh).
142

Hydraulic Ram Pump
Drive head and supply flow
Delivery head (m)
Water output (mVd)
Hydraulic energyoutput (kWh/d)
Capital cost of pumpingsystem (x$ 1,000)
Lifetime of pumpingsystem (years)
O
5
20
15
10
0.42
P
7.5
15
O
15
30
15 50
50 10
2.08 1.39
P O P
37.5 10 30
20 30 20
O
50
30
50
50
6.94
P
150
20
Cost of storage tank(x$ 1,000) (2 day's supply) 0.1 0.5 0.5 2.5 0.1 0.5 0.5 2.5
Annual equivalent capitalcosts (x$ 1,000)- ram pump 0.53 0.98 1.39 4.31 1.06 3.93 5.30 19.65- storage tank 0.02 0.05 0.08 0.27 0.02 0.05 0.08 0.27
Annual recurrent costs(x$ 1,000)- ram pump- storage tank
Total annual costs(x$ 1,000)
Total costs per day($/day)
Cost per m3 pumped(S/m3)
Cost per kWhhydr($/kWh)
0.050.01
0.61
1.67
0.17
4.08
0.130.01
1.17
3.20
0.32
7.80
0.150.03
1.65
4.52
0.09
2.20
0.750.03
5.36
14.68
0.29
7.16
0.100.01
1.19
3.26
0.33
2.40
0.600.01
4.59
12.57
1.26
9.24
0.500.03
5.91
16.19
0.32
2.38
3.000.03
22.95
62.88
1.26
9.23
O = optimistic assumptionsP = pessimistic assumptions
143
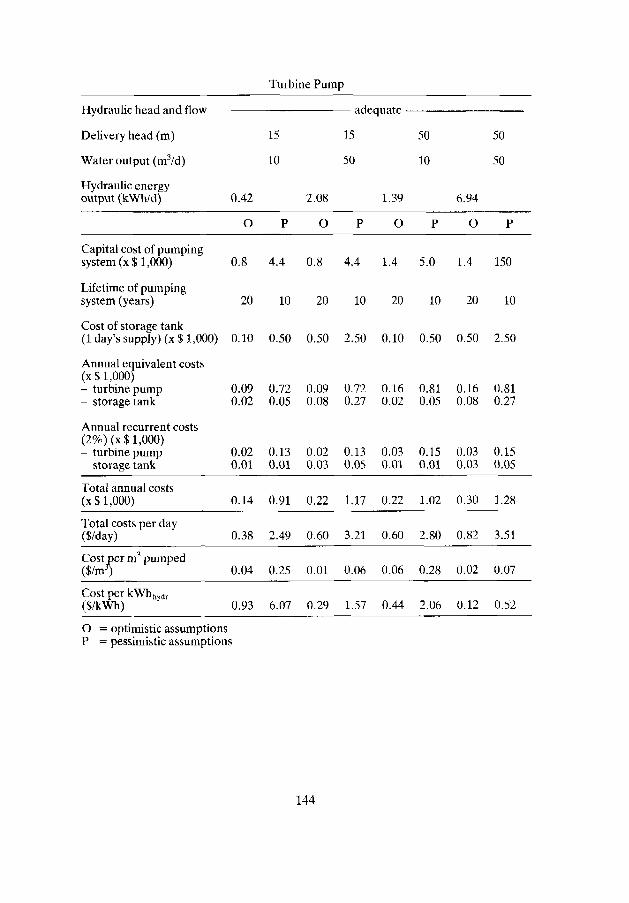
Turbine Pump
Hydraulic head and flow
Delivery head (m)
Water output (m3/d)
Hydraulic energyoutput (kWh/d) 0.42
O
15
10
P
2.08
O
15
50
1.39
P O
50
10
P
6.94
O
50
50
P
Capital cost of pumpingsystem (x$ 1,000) 0.8 4.4 0.8 4.4 1.4 5.0 1.4 150
Lifetime of pumpingsystem (years) 20 10 20 10 20 10 20 10
Cost of storage tank(1 day's supply) (x $ 1,000) 0.10 0.50 0.50 2.50 0.10 0.50 0.50 2.50
Annual equivalent costs(x$ 1,000)- turbine pump 0.09 0.72 0.09 0.72 0.16 0.81 0.16 0.81- storage tank 0.02 0.05 0.08 0.27 0.02 0.05 0.08 0.27
Annual recurrent costs(2%) (x$ 1,000)-turbine pump 0.02 0.13 0.02 0.13 0.03 0.15 0.03 0.15-storage tank 0.01 0.01 0.03 0.05 0.01 0.01 0.03 0.05
Total annual costs(x$ 1,000)
Total costs per day($/day)
Cost per m3 pumped(S/m3)
Cost per kWhhy(,r($/kWh)
0.14
0.38
0.04
0.93
0.
2.
0.
6.
91
49
25
07
0.22
0.60
0.01
0.29
1.17
3.21
0.06
1.57
0.22
0.60
0.06
0.44
1.02
2.80
0.28
2.06
0.
0.
0.
0.
30
82
02
12
1.28
3.51
0.07
0.52
O = optimistic assumptionsP = pessimistic assumptions
144

Wind Pump
Average wind speed indesign month (m/s)
Pumping head (m)
Water output (m3/d)
Hydraulic energyoutput (kWh/d)
15
10
0.42
O P
15
50
2.08
O P
A
50
10
1.39
O P
50
50
6.94
O P
Area of rotor (m2)
(A = P/0.1V3) 2.66 13.3 8.83 44.3
Wind pump cost ($/m2) 150 350 150 300 150 300 150 250
Capital cost of wind pump(x $1,000) 0.40 0.95 2.0 4.0 1.3 2.6 6.6 11.1Storage tank size(day's supply) 4 7 4 7 4 7 4 7(n/volume) 40 70 200 350 40 70 200 350
Storage tank cost (S/m1) 10 50 10 50 10 50 10 50
Capital cost of storagetank (x $ 1,000) 0.40 3.50 2.0 17.5 0.4 3.5 2.0 17.5
Lifetime (years)- wind pump 20 10 20 10 20 10 20 10-s torage tank 30 10 30 10 30 10 30 10
Annual equivalent capitalcosts (x$ 1,000)- wind pump 0.06 0.14 0.31 0.62 0.20 0.42 1.02 1.72-s torage tank 0.06 0.16 0.31 2.63 0.06 0.52 0.33 2.63
Annual recurrent costs($ 1,000)- w i n d pump 0.02 0.05 0.09 0.20 0.07 0.14 0.31 0.61- storage tank 0.02 0.05 0.11 0.88 0.02 0.16 0.10 0.92
Total annual costs (x $ 1,000)0.16
Useful water outputper year (nvVy)
Cost per m3 pumped ($/m3)
Cost per kWhhylk ($/kWh)
3650
0.04
1.04
0.40
3650
0.11
2.61
0.82
18250
0.04
1.05
4.33
18250
0.24
5.66
0.35
3650
0.10
0.69
1.24
3650
3.28
2.37
1.76
18250
0.09
0.67
5.88
18250
3.18
2.29
O = optimistic assumptionsP = pessimistic assumptions
145

Solar pump
Solar irradiation incritical month (kWh/d)
Pumping head (m)
Water output (mVd)
Hydraulic energyoutput (kWh/d)
Sub-system efficiency (%)
Electric energy requirement(kWh/d)
Peak watt rating (kWp)
Unit installation cost ($/Wp)
Capital cost ofpumping system ($ 1,000)
Storage tank size(day's supply)(m volume)
Capital cost of storage tank($/m3)
Capital cost of storage tank($1,000)
Lifetime (years)- solar pump system- storage tank
Annual equivalent capitalcosts ($ 1,000)- solar pump system- storage tank
Annual recurrent costs($1,000)- solar pump system- storage tank
Total annual costs ($ 1,000)
Cost per m3 pumped ($/m3)
Cost per kWhhyllr ($/kWh)
O
40
1.05
0.22
15
3.30
330
10
0.3
2030
0.390.05
0.200.03
0.67
0.18
4.49
15
10
0.41
P
35
1.20
0.35
25
8.75
550
50
2.5
1010
1.430.27
0.500.03
2.23
0.61
14.90
O
45
4.62
1.00
14
14.00
3150
10
1.5
2030
1.630.24
0.350.15
2.37
0.13
3.20
15
50
2.05
P
40
5.20
1.54
22
33.90
5250
50
12.5
1010
5.511.33
0.850.13
7.82
0.43
10.44
A
1
o40
3.48
0.74
15
11.10
330
10
0.3
2030
1.300.05
0.250.03
1.63
0.45
3.28
50
10
L.36
P
35
3.97
1.17
25
29.30
550
50
2.5
1010
4.760.27
0.700.03
5.76
1.58
11.60
6
O
45
15.42
3.29
13
42.80
3150
10
1.5
2030
5.000.24
0.400.15
5.79
0.32
2.33
50
50
.81
P
40
17.35
5.10
20
102
5250
50
12.50
1010
16.621.33
1.000.13
19.08
1.05
7.68
O = optimistic assumptionsP = pessimistic assumptions
146

Diesel pump
Pumping head (m)
Water output (W/d)
Hydraulic energy output(kWh/d)
15
10
0.42
15
50
2.08
50
10
1.39
50
50
6.94
O P O P o oDiesel fuel price ($/htre)Efficiency of- pump unit (%)- engine (%)Overall efficiency of dieselpump (%)Lifetime (years)- engine and pump- tankSize of engine (kW)- rated power- nominal powerHydraulic power ofengine (kW)Water output rate (l/s)Hours operation perday (h/d)Fuel consumption (1/yr)Capital cost of engine &pump ($ 1,000)Capital cost of tank ($)Fuel costs (x$ 1,000)Annual equivalent capitalcosts ($1,000)- engine/pump- tank
Annual recurrent costs($1,000)Operator's salary ($ 1,000)
Total annual costs ($ 1,000)
0.40
6015
9
1030
32
1.2
8
0.34169
4.5
50
0.08
1.19
0.270.25
1.79
0.80
4015
6
510
32
0.8
5.3
0.52253
7.5
500
0.20
1.980.08
0.750.50
3.51
0.40
6015
9
1030
32
1.2
8
1.74847
4.5
250
0.34
1.190.04
0.270.50
2.34
0.80
4015
6
510
32
0.8
5.3
2.621270
7.5
25001.02
1.980.27
0.750.75
4.79
0.40
6015
9
1030
32
1.2
2.4
1.15563
4.5
50
0.23
1.19
0.270.75
2.44
0.80
4015
6
510
32
0.8
1.6
1.74844
7.5
500
0.68
1.980.08
0.751.50
4.99
0.40
6015
9
1030
32
1-2
2.4
5.782823
4.5
250
1.13
1.190.04
0.270.75
3.38
0.80
4015
6
510
32
0.8
1.6
8.684234
7.5
25003.39
1.980.27
0.751.50
7.89
Volume of water pumpedper year (1000 m3/yr) 3.65 3.65 18.25 18.25 3.65 3.65 18.25 18.25
Hydraulic energy output(1000 kWh/yr) 0.15 0.15 0.75 0.75 0.50 0.50 2.49 2.49
Unit costs$/nv' pumped$/kWh/hydr
0.49 0.96 0.13 0.26 0.67 1.37 0.19 0.4311.93 23.4 3.12 6.39 4.88 9.98 1.36 3.17
O = optimistic assumptionsP — pessimistic assumptions 147
APPENDIX C
MANUFACTURERS AND SUPPLIERS
C.I MANUFACTURERS AND SUPPLIERS OF SOLAR WATER PUMPINGSYSTEMS
This list does not imply recommendation or endorsement of the products of any of thesuppliers. It is not intended to be a complete list of solar pump suppliers.
Manufacturer/Supplier
AEG/Telefunken
Alsette SpA
Ansaldo SpA
Arco Solar Inc.
BP Solar Systems Ltd.
Central Electronics Ltd.
Chronar Trisolar
Dinh Company
Address
Industriestrasse 29D-2008 Wedel (Holstein)Federal Republic of Germany
Cadriano de Granarolo E.40057 BolognaItaly
Via Nicola Lorenzi 816152 GenovaCorninglianoItaly
P.O. Box 4400Woodland Hils, California 91365USA
Aylesbury Vale Industrial ParkFarmborough CloseStocklakeAylesbury, Bucks. HP20 IDQUK
4 Industrial AreaSahibadad, U.P.India 201 010
10 De Angelo DriveBedford, Massachusetts 01730USA
Box 999Alachua, Florida 32615USA
148

Duba S/A
Ebara Corporation
GPL Industries
Grundfos
lleliodinamica
IDE Industries
Komatsu Electronic
KSB A/GP.O.
Kyoccra Corporation
Wm, Lamb Company Inc.
Lowara SpA
Nicuwstraat 31B-9200 WetterenBelgium
Asahi Building6-7 Ginza, 6-ChomeChuo-Ku, Tokyo 104Japan
Box 306(Grundfos) La Canada,California 91011USA
Poul Jensens VejBjcrringbro8850 Denmark
Caixa Postal 808501051 Sao Paulo, S.P.Brazil
Zone IndustrielleB-5430 RochefortBelgium
2612 ShinomiyaMetals Company HiratsukaKanagawa 254Japan
Box 3606650 HomburgFederal Republic of Germany
5-22 Kitainoue-ChoHigashino Yamashina-KuKyoto 605Japan
P.O. Box 4185North Holywood,California 91607USA
36075, Montecchio MaggioreVicenzaItaly
149

A.Y. McDonald Mfg.Co.
Mono Pumps (UK) Ltd.
Mono Pumps (Australia) Ltd.
Photowatt International
Pragma SpA
RJM Solar Technology
R & S Renewable
Sharp Corporation
Solapak Ltd.
Solar Electric
Solar Electric Specialties
P.O. Box 508Dubuquc, Iowa 52001USA
Cromwell Trading EstateCromwell RoadBredburryStockport SK6 2RFUK
338 Lower Dandenong RoadMordialloc, Victoria 3195Australia
131, route de l'Empereur92500 Rueil MalmaisonFrance
Via Po 25/400198 RomaItaly
Case Postale 101294 GenthodSwitzerland
P.O. Box 45Energy Systems BV5600 AA EindhovenThe Netherlands
22 NagailkeAbenu-KuOsaka 545Japan
Factory 3, CocklaneHigh WycombeBucks. IIP13 7DHUK
77, Industrial EstateInternational Inc.LugaMalta
P.O. Box 537Company Willits,California 95490USA
150

Solar Energie-Teehnik
Solarex Ltd.
Solarcx (Australia) Ltd.
Solar Voltaics
Southern Cross International
Sun Amp System Inc.
Sunpump Company
TPK Solar Systems
1, IndustriestrasseD-4503 AltlussheidFederal Republic of Germany
1335 Piccard DriveRockville, Maryland 20850USA
Box 204Chester HillNew South Wales 2162Australia
Hunoldstrasse 3A-6020 InnsbruckAustria
Box 754ToowoombaQueensland 4350Australia
7702, East Gray RoadScottsdaleArizona 85260USA
P.O. Box 3336South El Monte,California 91733USA
149 Bentley Ave.B-4A Nepean, OntarioCanada
151
C.2 MANUFACTURERS AND SUPPLIERS OF WIND PUMPS
An extensive list of manufacturers/suppliers of wind pumps and wind-electro-generators,with details of the equipment offered, is available in the "Catalogue of Wind Machines",prepared by Consultancy Services Wind Energy Developing Countries (CWD) and theTwente Working Group on Development Techniques (WOT). CWD Publication CWD83-1, March 1983. Copies of the "Catalogue of Wind Machines" are obtainable from:
Consultancy Services Wind EnergyDeveloping CountriesP.O Box 853800 AB AmersfoortThe Netherlands
Another useful list of manufacturers/suppliers of wind pumps, with details of theequipment offered, is included in the publication "Le Point sur Les Eoliennes dePompage", prepared by the Groupe de R6cherche et d'Echanges Technologiques(GRET). GRET Dossier "Le Point Sur", No.l, January 1984. Copies of the publication"Le Point Sur Les Eoliennes de Pompage" are obtainable from:
Group de Rdcherche et d'EchangesTechnologiques30, rue de Charonne75011 ParisFrance
C.3 MANUFACTURERS AND SUPPLIERS OF HYDRO-POWERED PUMPS
A. Hydraulic ram pumps
Manufacturer Name of hydraulic ram
Ab Bruzaholms Bruk BZH Hydrauliska570 34 BruzaholmSweden
Berry Hill Ltd. Davey Hydram75, Burwell RoadSt. Thomas, Ontario N5P 3R5Canada
Briau S.A. Briau HydramB.P. 43370009 ToursFrance
152

CeCoCo
Centro Las Gaviotas
C.W. Pipe Inc.
Godbole & Sons
Green & Carter Ltd.
Industrias Mecanicas Rochfer Ltda.
Jandu Plumbers Ltd.
John Blake Ltd.
John Danks & Son. Pty Ltd.
CeCoCoHydro-Lift PumpP.O. Box 8Ibaraka City, Osaka 567Japan
Alta Cabeza "Gaviotas"Paseo Bolivar no. 20-90BogotaColombia
Fleming PumpP.O. Box 678Amherst, Virginia 24521USA
Auto-lift PumpNew RamdaspethKachipuraNagpur-1India
Vulcan HydramGrange Farm, NorthingtonAiresford, Hants. SO 24 9 TGUK
Bomba Hydraulicas RochferAvenida Jose de Silva 3765Jardin Moria RosaCaixa Postal 194Sao Paulo, CEP 14400Brazil
Jandu's HydramP.O. Box 409Uhuru RoadArushaTanzania
Blake HydramP.O. Box 43Accrington, Lancashire BBS 5LPUK
BillabongDoody Street, AlexandriaSydney, New South WalesAustralia
153

Pfister & Langhanns
Pilter
Premier Irrigation Equipment Ltd.
Rife Hydraulic Engine Manufacturing Co.
Schlumpf AG
Singh Metal Casting Works
WAMA Machinenbau
SANO Ram PumpSandstrasse 2-8Postfach 35558500 Niirnberg 1Federal Republic of Germany
Pompe Pilter22, Rue FlorianPompe Alto75020 ParisFrance
Premier Hydram17/1C Alipore RoadCalcutta 700.027India
Rife Ram Pump316 W. Poplar StreetP.O. Box 790Norristown, PA 19401USA
Schlumpf PumpCH-6312 SteinhausenKanton ZugSwitzerland
Chandra Hydram110-D NiralaNagarLucknowIndia
Wama PumpBergstrassc 88018 Grating bei MiinchenFederal Republic of Germany
B. Turbine pumps
There are a considerable number of manufacturers of turbine pumps in the People'sRepublic of China. Some are prepared to provide quotations for export:
Fujian Provincial Agricultural MachineryImport & Export Corporation24 Dongda RoadFuzhou, Fujian ProvincePeople's Republic of China
154

C. River-current pumps
Ndume AgriculturalTurbo pumpMachinery Manufacturers Ltd.P.O. Box 62GilgilKenya
155

APPENDIX D
SOURCES OF INFORMATION ON RENEWABLE ENERGYSOURCES AND THE APPLICATION FOR SMALL-SCALE WATERSUPPLY SYSTEMS
D.I National Organizations
Algeria
Argentina
Australia
Belgium
Organisme National de la Recherche ScientifiqucStation de l'Energie SolaireRoute de l'ObservatoireBouzareahAlger
Centro de Estudios Fotointeticos y BioquimicosFundacion Miquel LilloUniversidad Nacional de RosarioSuipacha 5312000 Rosario
Groupo de Energie SolarUniversidad Nacional4400 Salta,Buenos Aires
Appropriate Technology Development Group20 Holdsworth StreetWoolahara, NSW 2025
Australian Wind Energy AssociationP.O. Box 1965Canberra City, ACT 2601
Commonwealth Scientific and Industrial ResearchOrganizationP.O. Box 225Dickenson, ACT 2602
Appropriate Technology for Developing CountriesBlyde Inkomststraat 9B-3000 Leuven
CoUectif d'Echanges pour la Technologie Appropriee18 rue dc la SablonnicreB-1000 Brussels
156

Bolivia
Botswana
Brazil
Burkina Faso
Burundi
Cameroon
Canada
Instituto de EnergiaAcademy of SciencesCasilla 5279La Paz
Botswana Technology CentrePrivate Bag 0092Gabarone
Rural Industries Innovation CentreP.O. Box 138Kanye
Laboratory of Solar EnergyUniversity CampusParaiba Federal UniversityJoao Pessoa58000 Paraiba
Technology Center of Minas GeraisAvenida Jose Candido da Silveira 2000P.O. Box 2306Belo Horizonte, Manas Gerais
Centre Interafricain d'Etudes HydrauliquesB.P. 369Ouagadougou
Groupe de Recherches d'Utilisation desEnergies AlternativesUniversite de BurundiFacult6 des SciencesB.P. 2700Bujombara
Unite de Recherches Energetique de l'OnarestB.P. 4110Yaounde
Brace Research InstituteMcDonalds College of McGill UniversityP.O. Box 900Ste. Anna de Bellevue, Quebec H9X ICO
International Development Research CentreP.O. Box 8500Ottawa KIG 3H9
157

Chile
China
Colombia
Costa Rica
Ecuador
Egypt
Solar Energy ProgramInstitute of Technological ResearchP.O. Box 667Santiago
Beying Institute of New Technology Applications(People's Republic)Shi Zhi MenBeying
Guangzhou Institute of EnergyConversion TechnologyChinese Academy of Science81 Martyrs' RoadC.P.O. Box 1254Guangzhou
Zhejiang Research Institute for Biogas and Solar EnergyIlangchow, Zhejiang
Institute for the Development of Renewable NaturalResourcesCarresa 14, No. 25 A-66Bogota, D.E.
Las Gaviotas CentreApartado Aereo 18261Bogota, D.E.
Renewable Energy Resources ProgrammeCentro Agronomico Tropical dc lnvestigacionApartado 74Turrialba
Institute Technologico de Costa RicaCentro de Informacion TechnologicaApartado 159Cartago
Instituto Nacional de EnergiaStam Prisca 233Quito
Solar Energy LaboratoryNational Research CentreEl Tahrir St.Dokki, Cairo
158

Ethiopia
Fiji Islands
France
Gabon
Germany
University of AlexandriaFaculty of EngineeringSolar Application LaboratoryEl-Hadara, Alexandria
Ethiopian National Energy CommissionP.O. Box 486Addis Ababa
National Water Resources CommissionP.O. Box 1008Addis Ababa
Institute of Natural ResourcesUniversity of the South PacificP.O. Box 1168Suva
Agence Franchise pour la Maitrise de l'EnergieImmeuble "Le Beam"27 rue Louis Vicat75015 Paris
Groupement pour l'ExploitationRationelle de l'Energie SolaireUniversite de ProvenceCentre de Saint Jer6me13397 Marseille
Croupe de Recherches et d'EchangesTechnologiques30, rue de Charonne75011 Paris
Institut Technologique DelloLe Moulin Rouge60410 Verberie
Ministere de l'Energie et des ResourcesHydrauliquesB.P. 874Libreville
German Solar Energy Industrial Association(Federal Republic)Kruppstrasse 5D-4300 Essen
159

Ghana
Greece
Guatemala
Honduras
India
Bremen Overseas Research and Development AssociationBahnhofplatz 132800 Bremen
German Appropriate Technology ExchangePostfach 5180D-6236 Eschborn
Council for Scientific and Industrial ResearchP.O. Box 74Kade
Technology Consultancy CentreUniversity of Science and TechnologyKumasi
National Council for Energy ResearchP.O. Box 5568Athens
Central American Research Institute forIndustryP.O. Box 1552Guatemala City
Rural Technology ProgrammeApartado Postal 703Tegucigalpa, D.C.
Birla Institute of Technology and SciencePilami, Gobar Research StationAjitmal, Etawah, U.P.
Central Power Research InstituteP.O. Box 1242Bangalore, Karnataka 560012
Centre for Rural Development and Appropriate TechnologyHaus KhnasNew Delhi 110016
Khadi and Village Industries CommissionGobar Research and Development CentreKora Gramadyog, KendraBombay 400 092
Indian Institute of TechnologyPowai, Bombay 400 076
160

Indonesia
Israel
Italy
Japan
National Aeronautical LaboratoryWind Power DivisionP.O. Box 1779Bangalore 560 017
Tata Energy Research InstituteBombay House24 Homi Mody StreetBombay 400 023
Dian DesaJl. Kali Urang Km 7P.O. Box 19Bulaksumur
Institute of Technology BandungDevelopment Technology CentreJl. Ganesha No. 10P.O. Box 276Bandung
Solar Energy Research CentreGajah Mada UniversitySekip Unit IIIYogjakarta
Applied Research InstituteBen Gurion UniversityP.O. Box 11025Beershcva 814120
Scientific Research FoundationP.O. Box 8745Jerusalem 991036
Fiat-Energy SectorRenewable Energy SystemsVia Cuneo 2010152 Turino
International School on Solar Energy and other RenewableEnergy ResourcesP.O. Box 6561029 Urbino
Government Industrial Research InstituteSolar Research Laboratory1, Hirate-Machi, Kita-KuNagoya .1.462
161

Jordan
Korea
Kuwait
Libya
Madagascar
Mali
Mexico
Nepal
New Zealand
Niger
Royal Scientific SocietyP.O. Box 4014Amman
Appropriate Technology Centre(Republic of)Umwol-ri, Hongdong-myumHongseong-gunChungnam 350-11
Rural Energy Resources DivisionOffice of Rural DevelopmentInstitute of Agricultural SciencesSuweon
Kuwait Institute for Scientific ResearchP.O. Box 24885Safat, Kuwait City
Centre for Solar Energy StudiesP.O. Box 8004Tripoli
Polytechnic InstituteUniversity of MadagaskarB.P. 1500Antananarivo
Centre de Recherches SolairesB.P. 134Bamako
Mexican Institute of Renewable ResourcesAvenida Dr. Vertiz 724Mexico City
Research Centre for Applied Science andTechnologyTribhuvan UniversityKirtipur, Katmandu
Centre for Scientific and Industrial ResearchCharles Ferguson BuildingBowen StreetWellington
ONERSOLl'Office de l'Energie SolaireB.P. 621Niamey
162

Pakistan
Papua New Guinea
Philippines
Rwanda
Senegal
Dakar
Sierra Leone
Appropriate Technology Development Organization1-B Street 47th, F-7/1Islamabad
Pakistan Council for Scientific and Industrial ResearchPress Centre, 2nd FloorShahra-e-Kamal AtaturkP.O. Box 672Karachi 0109
Papua New Guinea University of TechnologyP.O. Box 793Lae
South Pacific Appropriate Technology FoundationP.O. Box 6937Boroko
Centre for Non-Conventional Energy DevelopmentPNPC ComplexMerritt Road, Fort BonifacioMetro Manila
National Institute of Science and Technology625, Pedro Gill Street, HrmitaMetro Manila
Universite Nationale de RwandaCentre d'Etudes et d'Applications de l'EnergieB.P. 117Butare
Centre d'Etudes et de Realisation pour lesEnergies RenouvablesB.P. 476
Societe Industrielle des Applications del'Energie SolaireB.P. 1277Dakar
Advisory Unit for Technology Research andDevelopmentFaculty of EngineeringUniversity of Sierra LeoneMount Aureol, Freetown
163

Sri Lanka Water Resources BoardWind Energy Unit2A Gregory's AvenueColombo 7
Sudan
Suriname
National Council for ResearchInstitute of Energy ResearchP.O. Box 2404Khartoum
University of SurinameDepartment of EngineeringUniversity Complex, Building IILeywegParamaribo
Sweden
Switzerland
Swedish National Board for Energy SourceDevelopmentP.O. Box 1103S-16312 Spanga
Swedish Agency for Research Cooperation withDeveloping Countries (SAREC)Birger Jarlsgatan 61S-10525 Stockholm
SKATSwiss Centre for Appropriate TechnologyVarnbuelstrasse 14CH-9000 St Gallen
Tanzania
Thailand
Arusha Appropriate Technology CentreP.O. Box 764Arusha
Asian Institute of TechnologyRenewable Energy Resources Information Centre P.O. Box2754Bangkok
Khon Kaen UniversityFaculty of EngineeringSolar Energy GroupKhon Kaen
King Mongkut's Institute of TechnologyThonburi CampusBangkok 14
164

The Netherlands
Togo
Tunisia
Turkey
United Kingdom
National Energy AdministrationEnergy Research SectionWind Energy UnitPibultham VillaKasatsuk BridgeBangkok 5
Centre for International Cooperation andAppropriate TechnologyDelft University of TechnologyP.O. Box 2350Delft
Consulting Services Wind Energy DevelopingCountriesP.O. Box 853800 AB Amersfoort
TOOL FoundationMauritskade 611092 AD Amsterdam
Solar Energy DepartmentSchool of SciencesUniversity of BeninB.P. 1515Lome
Association pour lc Developpement et('Animation Rurale10 rue Eve NohelleTunis
Turkish Solar Energy InstituteP.O. Box 37Bakanliklar, Ankara
Power Machinery DepartmentFaculty of AgricultureUniversity of AnakaraCengiz Sotah No. 119/3Yeninahalle, Ankara
Intermediate Technology Development GroupMyson HouseRailway TerraceRugby CV21 3HT
165

IT Power Ltd.Mortimer HillMortimer, Reading, Berks. RG7 3PG
National Centre for Appropriate TechnologyLlyngwern QuarryMachynllethPowys, Wales
University of ReadingEnergy GroupWhiteknightsReading, Berks. RG6 1A7
United States of Wind Energy AssociationAmerica Americal609 Connecticut Avenue
Mount Rainier, Maryland 20822
IT Power Inc.1015, 18th Street, N.W.Suite 801Washington, D.C. 20036
National Academy of SciencesBoard on Science and Technology forInternational Development2101 Constitution AvenueWashington D.C. 20418
National Center for Appropriate TechnologyP.O. Box 3838Butte, Montana 59702
New Alchemy Institute237 Hatchville RoadEast Falmouth, Massachusetts 02536
Peace Corps906 Connecticut Avenue, N.W.Washington D.C. 20525
Sandia National LaboratoriesDivision 621P.O. Box 5800Albuquerque, New Mexico 87185
Volunteers in Technical AssistanceP.O. Box 12438Arlington, Virginia 22209
166

Zambia Technology Development and Advisory UnitUniversity of ZambiaP.O. Box 32379LusakaZambia
D.2 INTERNATIONAL ORGANIZATIONS
FAO
IRC
UNESCO
UNICEF
UNIDO
UNCNRET
Food and Agricultural Organization of theUnited NationsVia delle Terme di Caracalla00100 RomeItaly
International Reference Centre forCommunity Water Supply and SanitationP.O. Box 931902509 AD The HagueThe Netherlands
United Nations Education and Science OrganizationUNESCO Network on Renewable Energy Sources7 Place de Fontenoy75007 ParisFrance
United Nations Children's FundWater and Environmental SanitationAdvisory Team866 U.N. PlazaNew York, N.Y. 10017USA
United Nations Industrial Development OrganizationP.O. Box 2300A-1180 ViennaAustria
United Nations Centre for NaturalResources, Energy and Transport1 U.N. PlazaNew York, N.Y. 10017USA
167

UN/ESCAP United Nations Economic and SocialCommission for Asia and the PacificSala SantithamRajdammern AvenueBangkok 2Thailand
UN/ECAF United Nations Economic and SocialCommission for AfricaAfrica HallP.O. Box 3005Ethiopia
UN/ECLAC United Nations Economic and SocialCommission for Latin America and theCaribbeanEdificio Naciones UnidasAvenida Dag HammerskjoldCasilla 179SantiagoChile
168

IRC Publications
The Technical Paper Series published by IRC provides expertise on selected topics oncommunity water supply and sanitation in developing countries. Wherever possible in thesepublications, an integrated approach incorporating technical, economic, social and organizati-onal aspects is developed to address pressing problems in this area.
These publications are produced jointly by consultant specialists and IRC staff. They arewidely used in many countries by staff at all levels, from engineers and decision-malCers at thenational level to public health officials and technicians at the community level.
IRC also publishes the Bulletin Series comprising reports of international meetings .organizedby the Centre and also jointly with participating institutions in developing countries TheOccasional Paper Series, which is in photocopy format, presents ongoing work at IRC andrelated organizations. Many of these publications are available in French and can be obtainedfrom IRC. Several of these are now available in Spanish and can be obtained from: CEP1S,Casilla 4337, Lima 100, Peru.
IRC titles of related interest:
SMALL COMMUNITY WATER SUPPLIES IN DEVELOPING COUNTRIESCompiled by E.H. Hofkes(TP18E) 442 pages enlarged edition 1983
HANDPUMPS FOR USE IN DRINKING WATER SUPPLIES IN DEVELOPINGCOUNTRIES(TP 10 E) : ••?•
266pages 1st edition 1077