(2-01) p.1 of 2 united states department of energy (doe .../67531/metadc783147/m2/1/high_res...doe f...
TRANSCRIPT
DOE F 241.3
(2-01) p.1 of 2 UNITED STATES DEPARTMENT OF ENERGY (DOE) OMB CONTROL NO.
Announcement of Scientific and Technical Information (STI) 1910-1400 (For Use By Financial Assistance Recipients and Non-M&O/M&I Contractors)
PART I: STI PRODUCT DESCRIPTION (To be completed by Recipient/Contractor)
A. STI Product Identifiers 1. REPORT/PRODUCT NUMBER(s) None 2. DOE AWARD/CONTRACT NUMBER(s) DE-FC36-97ID13554 3. OTHER IDENTIFYING NUMBER(s) None B. Recipient/Contractor Technologies Research Corporation (an NCMS subsidiary), 3025 Boardwalk Drive, Ann Arbor, MI 48108
C. STI Product Title Development of a Standard Methodology for the Quantitative Measurement of Steel Phase Transformation Kinetics and Dilation Strains Using Dilatometric Methods (QMST)
D. Author(s) Dr. Manish Metha Dr. Tom Oakwood E-mail Address(es): [email protected] E. STI Product Issue Date/Date of Publication
F. STI Product Type (Select only one) X 1. TECHNICAL REPORT X Final Other (specify)
2. CONFERENCE PAPER/PROCEEDINGS Conference Information (title, location, dates)
3. JOURNAL ARTICLE
a. TYPE: Announcement Citation Only Preprint Postprint b. JOURNAL NAME c. VOLUME d. ISSUE e. SERIAL IDENTIFIER (e.g. ISSN or CODEN)
4. OTHER, SPECIFY
G. STI Product Reporting Period Thru
H. Sponsoring DOE Program Office Office of Industrial Technologies (OIT)(EE20) I. Subject Categories (list primary one first) 32 Energy Conservation, Consumption and Utilization Keywords: Steel
J. Description/Abstract The purpose of this collaborative project was to develop a standard practice for obtaining and archiving quantitative steel transformation kinetic data and thermal strain data. Standard measurement, data interpretation and data reporting methods were developed and defined by a cross-industry QMST Consortium consisting of steel manufacturers, forgers, heat treaters, modelers, automotive and heavy equipment OEMs along with expert technologists from the National Laboratories and academia. ASTM Standard, A1033-04, resulted from the work.
K. Intellectual Property/Distribution Limitations (must select at least one; if uncertain contact your Contracting Officer (CO)) X 1. UNLIMITED ANNOUNCEMENT (available to U.S. and non-U.S. public; the Government assumes no liability for disclosure of such data)
2. COPYRIGHTED MATERIAL: Are there any restrictions based on copyright? Yes No. If yes, list the restrictions as contained in your award document
3. PATENTABLE MATERIAL: THERE IS PATENTABLE
MATERIAL IN THE DOCUMENT. INENTION DISCLOSURE SUBMITTED TO DOE: DOE Docket Number: S- (Sections are marked as restricted distribution pursuant to 35 USC 205)
4. PROTECTED DATA: CRADA Other, specify Release date (required) no more than 5 years from date listed in Part I.E. above
5. SMALL BUSINESS INNOVATION RESEARCH (SBIR) DATA Release date (required) no more than 4 years from date listed in Part I.E. above
6. SMALL BUSINESS TECHNOLOGY TRANSFER RESEARCH (STTR) DATA Release date (required) no more than 4 years from date listed in Part I.E. above
7. OFFICE OF NUCLEAR ENERGY APPLICED TECHNOLOGY L. Recipient/Contract Point of Contact Contact for additional information (contact or organization name To be included in published citations and who would Receive any external questions about the content of the STI Product or the research contained herein) Dr. Manish Metha Name and/or Position [email protected] (734)995-4938 E-mail Phone Technologies Research Corporation, Ann Arbor, MI
M M D D Y Y Y Y
M M D D Y Y Y Y
M M D D Y Y Y Y
04 28 2004 M M D D Y Y Y Y
01 11 2001 M M D D Y Y Y Y
04 28 2004 M M D D Y Y Y Y
DOE F 241.3
(2-01) p.2 of 2 UNITED STATES DEPARTMENT OF ENERGY (DOE) OMB CONTROL NO.
Announcement of Scientific and Technical Information (STI) 1910-1400 (For Use By Financial Assistance Recipients and Non-M&O/M&I Contractors)
PART II: STI PRODUCT MEDIA/FORMAT and LOCATION/TRANSMISSION
(To be completed by Recipient/Contractor)
A. Media/Format Information: 1. MEDIUM OF STI PRODUCT IS: X Electronic Document Computer Medium Audiovisual Material Paper
No Full-text 2. SIZE OF STI PRODUCT 77 Pages 3. SPECIFY FILE FORMAT OF ELECTRONIC DOCUMENT BEING TRANSMITTED, INDICATE: SGML HTML XML X PDF Normal PDF Image TIFFG4 WP-indicate Version (5.0 or greater) Platform/operation system MS-indicate Version (5.0 or greater) Platform/operation system Postscript 4. IF COMPUTER MEDIUM OR AUDIOVISUAL MATERIAL: a. Quantity/type (specify) b. Machine compatibility (specify) c. Other information about product format a user needs to know: B. Transmission Information: 1. STI PRODUCT IS BEING TRANSMITTED: X a. Electronically via E-Link b. Via mail or shipment to address indicated in award document (Paper product, CD-ROM, diskettes, video cassettes, etc.) 2. INFORMATION PRODUCT FILE NAME X (of transmitted electronic format) DOENonProp0015FinalReport.
PART III: STI PRODUCT REVIEW/RELEASE INFORMATION
(To be completed by DOE)
A. STI Product Reporting Requirements Review. 1. THIS DELIVERABLE COMPLETES ALL REQUIRED DELIVERABLES FOR THIS AWARD 2. THIS DELIVERABLE FULFILLS A TECHNICAL INFORMATION REPORTING REQUIREMENT, BUT SHOULD NOT BE DISSEMINATED BEYOND DOE. B. Award Office Is the Source of STI Product Availability THE STI PRODUCT IS NOT AVAILABLE IN AN ELECTRONIC MEDIUM. THE AWARDING OFFICE WILL SERVE AS THE INTERIM SOURCE OF AVAILABILITY. C. DOE Releasing Official 1. I VERIFY THAT ALL NECESSARY REVIEWS HAVE BEEN COMPLETED AS DESCRIBED IN DOE G 241.1-1A, PART II, SECTION 3.0 AND THAT THE STI PRODUCT SHOULD BE RELEASED IN ACCORDANCE WITH THE INTELLECTUAL PROPERTY/DISTRIBUTION LIMITATION ABOVE. Release by (name) Date E-Mail Phone
M M D D Y Y Y Y

AISI/DOE Technology Roadmap Program
FINAL REPORT
“Development of a Standard Methodology for the Quantitative Measurement of Steel Phase
Transformation Kinetics and Dilation Strains using Dilatometric Methods”
(QMST)
Prepared for U.S. Department of Energy by
Manish Mehta and Tom Oakwood Technologies Research Corporation (subsidiary of NCMS), Ann Arbor, MI
April 28, 2004
Work Performed under Cooperative Agreement No. DE-FC36-97ID13554
Prepared by American Iron and Steel Institute
Technology Roadmap Program Office Pittsburgh, PA 15222

2
Report Documentation Page Information Title and Subtitle: AISI/DOE Manufacturing Technology Program Authors: Manish Mehta, Ph.D. and Tom Oakwood, Ph.D. Technologies Research Corporation (TRC) Subsidiary of NCMS 3025 Boardwalk Drive Ann Arbor, MI 48108 (734) 995-4938 (phone) (734) 995-1150 (fax) [email protected] Collaborative QMST Consortium Members:
• American Axle & Manufacturing, Inc. • American Iron and Steel Institute • Caterpillar, Inc. • Colorado School of Mines • Deformation Control Technology, Inc. • DaimlerChrysler Corporation • Deere & Company • Dynamic Systems, Inc. • Ford Motor Company • GKN Automotive, Incorporated • Ispat Inland, Inc.
• MacSteel • Metaldyne • NIST • North Star Steel Company • Oak Ridge National Laboratory • Sandia National Laboratories • Technologies Research Corporation • The Timken Company • The Torrington Company • Thyssen Krupp Stahl
Abstract: The purpose of this collaborative project was to develop a standard practice for obtaining and archiving quantitative steel transformation kinetic data and thermal strain data. Two families of dilatometric equipment were employed to develop this standard practice for testing bar product steels. These include high-speed quenching and deformation dilatometers and Gleeble® thermo-mechanical simulation instruments. Standard measurement, data interpretation and data reporting methods were developed and defined by the cross- industry QMST Consortium members consisting of steel-manufacturers, forgers, heat-treaters, modelers, automotive and heavy vehicle OEMs along with team expert technologists from the National Labs and academia. The team designed phase transformation experiments on two selected steel grades to validate the standard practices—a medium carbon grade SAE 1050 and an alloy steel SAE 8620. A final standard practice document was developed based on the two dilatometry methods, and was submitted to and approved by ASTM (available as A1033-04). The standard practice specifies a method for measuring austenite transformation under no elastic stress or plastic deformation. These methods will be an enabler for the development and electronic archiving of a quantitative database for process modeling using computer simulation software, and will greatly assist end-users in developing accurate process and product simulations during the thermo-mechanical processing of bar and rod product steels.

3
DISCLAIMER “This report was prepared as an account of work sponsored by an agency of the United States Government. Neither the United States Government nor any agency thereof, nor any of their employees, makes any warranty, express or implied, or assumes any legal liability or responsibility for the accuracy, completeness, or usefulness of any infor-mation, apparatus, product, or process disclosed, or represents that its use would not infringe privately owned rights. Reference herein to any specific commercial product, process, or service by trade name, trademark, manufacturer, or otherwise, does not necessarily constitute or imply endorsement, recommendation, or favoring by the United States Government or any agency thereof. The views and opinions of authors expressed herein do not necessarily state or reflect those of the United States Government or any agency thereof.” “This report has been reproduced from the best available copy. Available in paper copy and microfiche. Number of pages in this report: 22 pages, excluding Appendices DOE and DOE subcontractors can obtain copies of this report FROM: Office of Scientific and Technical Information, P.O. Box 62, Oak Ridge, TN 37831. Tel: (865) 576-8401 This report is publicly available from the Department of Commerce, National Technical Information Service, 5285 Port Royal Road, Springfield, VA 22161. Tel: (703) 487-4650.

4
TABLE OF CONTENTS
Page
Report Documentation Page Information................................................................................. 2
EXECUTIVE SUMMARY .................................................................................................... 5
1. INTRODUCTION............................................................................................................. 6 1.1 Background ................................................................................................................ 6 1.2 Project Objectives ...................................................................................................... 7
2. TECHNICAL APPROACH............................................................................................. 7 2.1 Methodology .............................................................................................................. 7 2.2 Program Management and Administration................................................................ 8 2.3 Project Website .......................................................................................................... 9 2.4 Material Supply.......................................................................................................... 9
3. SUMMARY RESULTS AND DELIVERABLES .......................................................... 9 3.1 Task 1 – Definition of Standard Terms and Parameters ............................................ 9 3.2 Task 2 – Development of a Procedure for Determination of Transformation
Data (without Austenite Deformation) ...................................................................... 10 3.2.1 Sourcing of Test Samples .............................................................................. 11 3.2.2 Round-Robin Experiments............................................................................. 11 3.2.3 QMST Test Data Collection Procedures (without Elastic Stress) ................. 11 3.2.4 Replication of QMST Experiments at Commercial Laboratories.................. 12 3.2.5 QMST Test Data Collection Procedures (with Elastic Stress) ...................... 13 3.3 Task 3 – Development of a Procedure for Determination of Transformation
Data (with Austenite Deformation) ............................................................................ 13 3.4 Task 4 – Development of a Standard Method for Data Analysis and Reporting ...... 14 3.4.1 Standard Reporting and Archival Practices ................................................... 14 3.4.2 Process Modeling of Phase Transformation Data.......................................... 14 3.4.3 Draft QMST Recommended Practice Document .......................................... 15 3.4.4 QMST Standard Instructional Video ............................................................. 15 3.4.5 Approval Process for the QMST Practice with Standards Writing
Organizations ................................................................................................. 16
4. VALUE CHAIN BENEFITS FROM QMST PROJECT .............................................. 17 4.1 Benefits to Bar Steel Producers and Processors ........................................................ 17 4.2 Benefits to Forging Industry...................................................................................... 18 4.3 Benefits to Flat Steel Producers ................................................................................. 18 4.4 Benefits to Powder Metal Industry ............................................................................ 18 4.5 Benefits to Steel Casting Industry.............................................................................. 19 4.6 Benefits to Heat-Treating and Finish Fabrication Industry ....................................... 19 4.7 Dissemination of Project Findings ............................................................................. 19
5. CONCLUSIONS ............................................................................................................... 20
Appendix A – Literature Search Results Appendix B – Draft ASTM Standard Practice

5
EXECUTIVE SUMMARY The development of predictive tools for the steel making, forging, heat-treating and steel com-ponent user industries is significantly lagging, compared to many other areas (such as casting and sheet forming). This results from the complexity of the steel manufacturing and fabrication processes, a lack of accurate data for the models, and the daunting and expensive task of acquiring these data — issues that justify a common approach by the steel industry, fabricators and component end-users. Critical to the success of these process models is the ability to predict microstructural evolution in material processing. These predictions require both, accurate steel transformation kinetic and thermal strain data for use with computer models capable of predicting steel microstructure and properties after processing. Much of the current data is qualitative, has been determined under a variety of experimental conditions, and not acquired with the intent of being used in quantitative computational models but rather, for qualitative guides for the metallurgical community. Cur-rently, there are no reliable public-domain reference resources that provide in electronic format both the kinetic and thermal strain components associated with steel phase transformations. These data are considered crucial for process simulation models to accurately predict residual stress, distortion, and microstructure for various steel product forms used in manufacturing. Dilatometry is a common method of measurement, yet many key steps in data acquisition and reduction used in constructing phase transformation diagrams remain non-standardized, and hence, subject to high variability in practice. The purpose of this three-year, $1.5 million QMST Technology Roadmap Project of the AISI was to collaboratively develop standard procedures for obtaining quantitative steel transforma-tion kinetic and thermal strain data using two dilatometric methods. The initial focus has been on bar and rod product forms, using two steel grades, SAE 1050 and SAE 8620, as the basis for developing the standard practice methods and analyzing/correlating the data. Standard measure-ment, data interpretation, and data reporting methods have been developed and defined, upon which a quantitative database for process modeling can be developed and electronically archived. Standard practice methodologies have been developed and ASTM approval obtained (method A1033-04) for the transformation of the austenite under no applied elastic stress or plastic deformation Future collaborative work will pursue development of a standard method for (a) transformation while a static elastic stress is applied to the austenite, and (b) transformation of the austenite while it is undergoing plastic deformation. A key goal in establishing these standard, internationally-accepted practices was to provide end-users the steel phase transformation data in an appropriate format so as to maximize and accelerate their utility in state-of-the-art material and process modeling computer simulation software. In fact, the practice is considered as an enabler to the achievement of significant energy savings through economy of process steps and improved efficiency and utilization of process heating equipment in production lines across the entire steel value chain.

6
1. INTRODUCTION 1.1 Background
An analysis of 2002 shipments of wrought steel, steel castings and steel powder metals, indicated that of the 100 million tons of steel shipped from domestic steel mills, nearly 20 million tons of steel were thermally processed during the manufacturing chain. 1
Significant interest has developed in using computer-modeling and virtual development techniques to predict steel behavior during processing and the microstructures and mechanical properties that result from various processing paths. The current state-of-the-art of these models is often limited by the inability to predict microstructural evolution in processing, particularly by a paucity of quantitative transformation data. In the steel-making industry, transformation data would be used to develop the appropriate hot rolling and cooling practices for achieving desired mechanical properties for various steel grades. Hot strip mills, plate mills, and bar mills take advantage of both controlled austenite deformation temperatures and controlled cooling con-ditions in order to obtain specified mechanical properties. Accurate transformation data would enable the establishment of standard practices for both hot rolling and subsequent cooling. In the forging industry, finite element simulation has become standard practice to predict material flow and die filling. However, these simulations do not predict microstructural evolution or the resulting final microstructure after forging and cooling. This is because of the absence of transformation models in the software tools and the required transformation data. Process modeling in the heat-treat industry is still in its infancy. Although there are several predictive models for furnace heat-treatment and induction hardening that have recently become commer-cially available (i.e., DEFORM-HT, SYSWELD, HEARTS or Calcom) or are under develop-ment (NCMS’ project on Predictive Modeling of Distortion in Heat-Treatment resulting in commercialization of DANTE™ , or Sandia’s intelligent induction hardening program), they all rely on the user to provide transformation data, thus greatly inhibiting their use. The end-users would like the manufacturing simulation capability to evolve for predicting component strength, residual stresses and dimensions. Such advanced capabilities enable virtual product and process development and provide input to durability analysis for product design. This greatly helps integrate design and manufacturing process development and reduce new product development time for steel products. The use of models to predict distortion, residual stresses, microstructure and properties has been constrained due to the lack of standard transformation data. The ability to accurately predict transformations is fundamental to accurate prediction of residual stresses and distortion. Along with the transformation from soft austenite to ferrite and carbide structures or martensite is a substantial volume increase. The volume change along with the presence of weaker phases causes plastic deformation, which results in the formation of residual stresses and distortion. Accurate transformation prediction is the basis upon which distortion and residual stress predictions are made. Dilatometry is believed to be the best current method for development of 1 Annual Statistics Report, American Iron and Steel Institute, 2002.
7
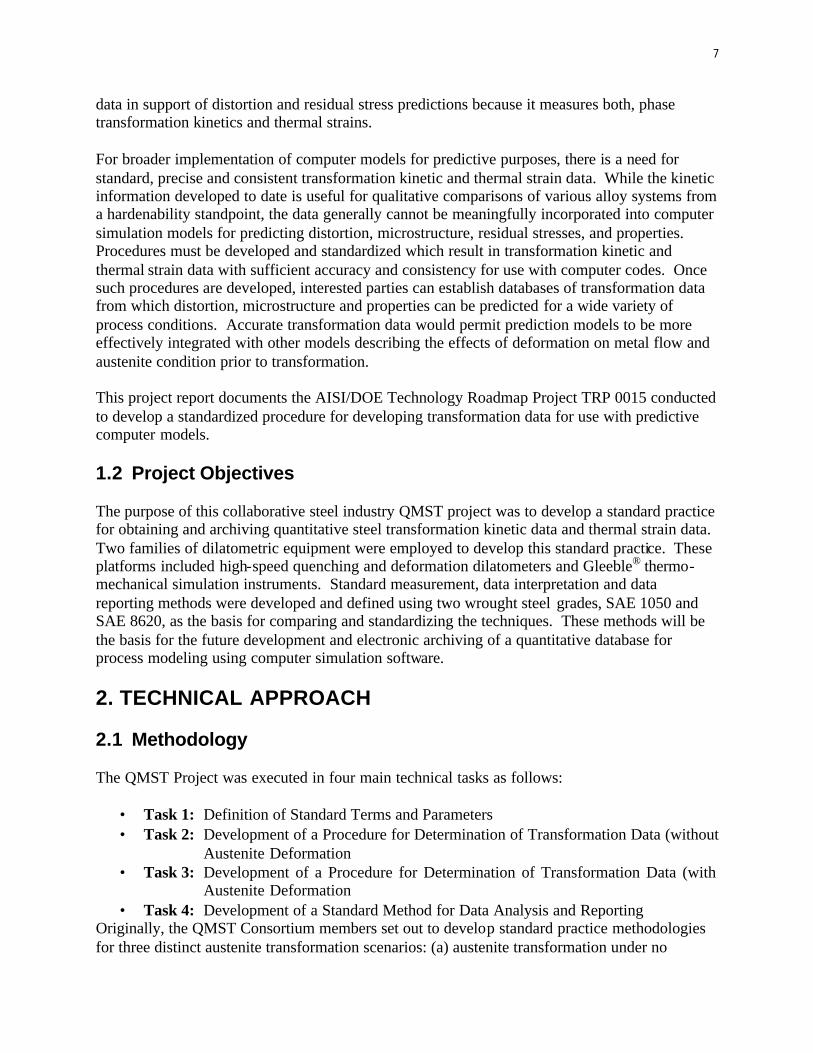
data in support of distortion and residual stress predictions because it measures both, phase transformation kinetics and thermal strains. For broader implementation of computer models for predictive purposes, there is a need for standard, precise and consistent transformation kinetic and thermal strain data. While the kinetic information developed to date is useful for qualitative comparisons of various alloy systems from a hardenability standpoint, the data generally cannot be meaningfully incorporated into computer simulation models for predicting distortion, microstructure, residual stresses, and properties. Procedures must be developed and standardized which result in transformation kinetic and thermal strain data with sufficient accuracy and consistency for use with computer codes. Once such procedures are developed, interested parties can establish databases of transformation data from which distortion, microstructure and properties can be predicted for a wide variety of process conditions. Accurate transformation data would permit prediction models to be more effectively integrated with other models describing the effects of deformation on metal flow and austenite condition prior to transformation. This project report documents the AISI/DOE Technology Roadmap Project TRP 0015 conducted to develop a standardized procedure for developing transformation data for use with predictive computer models. 1.2 Project Objectives The purpose of this collaborative steel industry QMST project was to develop a standard practice for obtaining and archiving quantitative steel transformation kinetic data and thermal strain data. Two families of dilatometric equipment were employed to develop this standard practice. These platforms included high-speed quenching and deformation dilatometers and Gleeble® thermo-mechanical simulation instruments. Standard measurement, data interpretation and data reporting methods were developed and defined using two wrought steel grades, SAE 1050 and SAE 8620, as the basis for comparing and standardizing the techniques. These methods will be the basis for the future development and electronic archiving of a quantitative database for process modeling using computer simulation software. 2. TECHNICAL APPROACH 2.1 Methodology The QMST Project was executed in four main technical tasks as follows:
• Task 1: Definition of Standard Terms and Parameters • Task 2: Development of a Procedure for Determination of Transformation Data (without
Austenite Deformation • Task 3: Development of a Procedure for Determination of Transformation Data (with
Austenite Deformation • Task 4: Development of a Standard Method for Data Analysis and Reporting
Originally, the QMST Consortium members set out to develop standard practice methodologies for three distinct austenite transformation scenarios: (a) austenite transformation under no
8
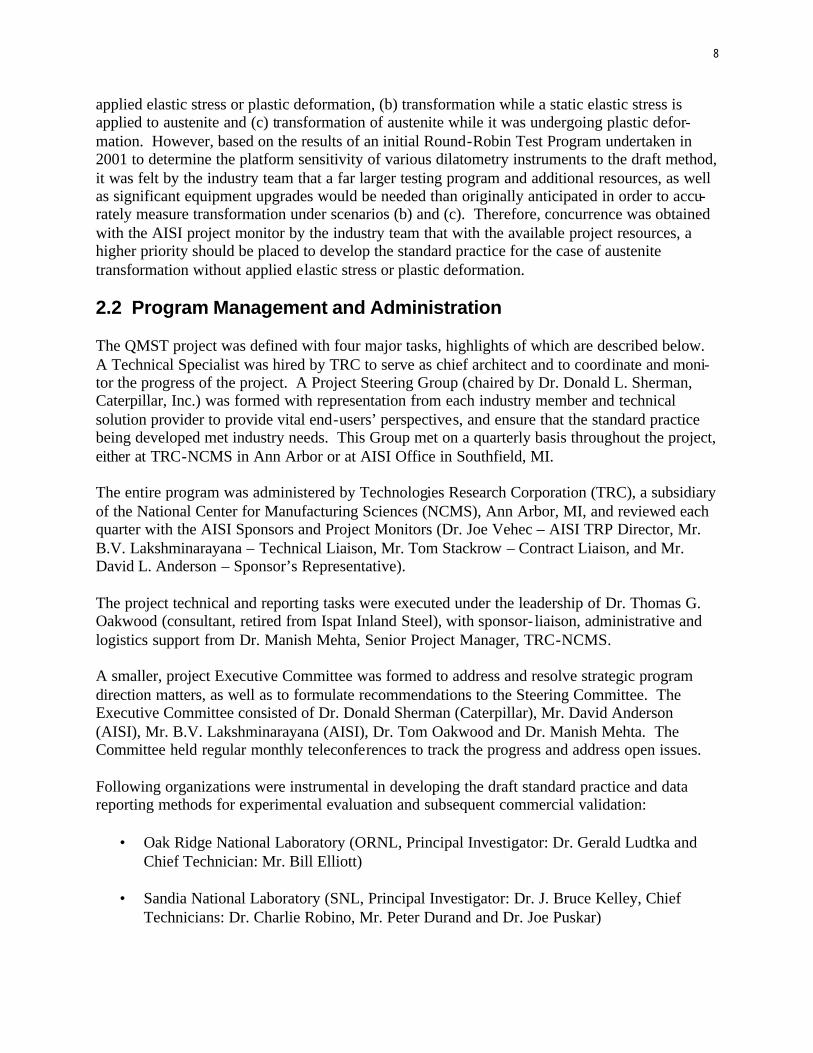
applied elastic stress or plastic deformation, (b) transformation while a static elastic stress is applied to austenite and (c) transformation of austenite while it was undergoing plastic defor-mation. However, based on the results of an initial Round-Robin Test Program undertaken in 2001 to determine the platform sensitivity of various dilatometry instruments to the draft method, it was felt by the industry team that a far larger testing program and additional resources, as well as significant equipment upgrades would be needed than originally anticipated in order to accu-rately measure transformation under scenarios (b) and (c). Therefore, concurrence was obtained with the AISI project monitor by the industry team that with the available project resources, a higher priority should be placed to develop the standard practice for the case of austenite transformation without applied elastic stress or plastic deformation. 2.2 Program Management and Administration The QMST project was defined with four major tasks, highlights of which are described below. A Technical Specialist was hired by TRC to serve as chief architect and to coordinate and moni-tor the progress of the project. A Project Steering Group (chaired by Dr. Donald L. Sherman, Caterpillar, Inc.) was formed with representation from each industry member and technical solution provider to provide vital end-users’ perspectives, and ensure that the standard practice being developed met industry needs. This Group met on a quarterly basis throughout the project, either at TRC-NCMS in Ann Arbor or at AISI Office in Southfield, MI. The entire program was administered by Technologies Research Corporation (TRC), a subsidiary of the National Center for Manufacturing Sciences (NCMS), Ann Arbor, MI, and reviewed each quarter with the AISI Sponsors and Project Monitors (Dr. Joe Vehec – AISI TRP Director, Mr. B.V. Lakshminarayana – Technical Liaison, Mr. Tom Stackrow – Contract Liaison, and Mr. David L. Anderson – Sponsor’s Representative). The project technical and reporting tasks were executed under the leadership of Dr. Thomas G. Oakwood (consultant, retired from Ispat Inland Steel), with sponsor- liaison, administrative and logistics support from Dr. Manish Mehta, Senior Project Manager, TRC-NCMS. A smaller, project Executive Committee was formed to address and resolve strategic program direction matters, as well as to formulate recommendations to the Steering Committee. The Executive Committee consisted of Dr. Donald Sherman (Caterpillar), Mr. David Anderson (AISI), Mr. B.V. Lakshminarayana (AISI), Dr. Tom Oakwood and Dr. Manish Mehta. The Committee held regular monthly teleconferences to track the progress and address open issues. Following organizations were instrumental in developing the draft standard practice and data reporting methods for experimental evaluation and subsequent commercial validation:
• Oak Ridge National Laboratory (ORNL, Principal Investigator: Dr. Gerald Ludtka and Chief Technician: Mr. Bill Elliott)
• Sandia National Laboratory (SNL, Principal Investigator: Dr. J. Bruce Kelley, Chief
Technicians: Dr. Charlie Robino, Mr. Peter Durand and Dr. Joe Puskar)

9
• Colorado School of Mines (CSM, Principal Investigator: Prof. Mark Lusk and Graduate Student, R.A. Jaramillo)
• Three commercial test laboratories with dilatometer facilities (selected by competitive bid
during the project) that carried out the experimental work required in the program as sub-contractors to TRC-NCMS:
- Dynamic Systems, Inc. (DSI, Principal Investigator: Mr. David Ferguson) - A consortium consisting of Professional Metallurgical Services (Principal
Investigator, Mr. George Goodrich) and Queens University, Kingston, Ont., (Principal Investigator: Prof. Douglas Boyd, Chief Technician: Dr. Pingshun Zhao)
- Thyssen Krupp Stahl, Germany (Principal Investigator: Dr. Hans-Peter Schmitz, Chief Technician: Mr. Tesch).
• Dr. Carelyn Campbell of NIST Metallurgy Division provided significant material
characterization and microscopy support. 2.3 Project Website A password-protected, member-only project website was set up by TRC-NCMS (http://steel.ncms.org) to serve as the repository for all proprietary documents, including meeting minutes, reports, experimental data generated and metallographic information shared on the project, as well as a link established with the AISI’s website to provide team members the conduit for efficiently capturing their in-kind cost share. 2.4 Material Supply All wrought bar and rod samples of SAE 1050 and SAE 8620 steel were provided as in-kind by team member, MacSteel, as hot-rolled, normalized steel stock, along with certification of chemical composition. Long-term storage and supply of sectioned stock for machining of test samples was provided as in-kind by American Axle and Manufacturing. Standard Reference Material (SRM) selected by the team was nickel for ease and affordability in sourcing, although other materials were also considered, including tungsten and platinum SRMs. 3. SUMMARY RESULTS AND DELIVERABLES The project results are presented and discussed under each task heading. 3.1 Task 1 - Definition of Standard Terms and Parameters This task resulted in two principal deliverables. The first was a report with a recommendation for common and consistent nomenclature and definitions for describing steel transformation behavior. The Technical Specialist conducted an extensive literature search with support from

10
NCMS to establish existing nomenclature and definitions. The findings were reviewed with the Project Steering Group, ORNL, SNL, and CSM to develop agreement on standardized nomenclature and definitions for planning future experimental work. A report was prepared by the Technical Specialist to summarize the results of this study and the recommendations developed from it (see Appendix A – Literature Search Results). The results of this task were also provided to NIST (Dr. Carelyn Campbell of NIST Metallurgy Division participating in a consulting capacity) for comment. The second task deliverable was a test matrix to be followed in the experimental work for Tasks 2 and 3. The Technical Specialist coordinated the design of the test matrix through collaborative discussions with ORNL, SNL, CSM, and the Project Steering Group. ORNL took the lead in developing and submitting a draft dilatometry test procedure, while SNL took the lead in deve-loping a draft sample preparation procedure. The test matrix included the bar steel grades to be evaluated (SAE 1050 and SAE 8620), and the isothermal and continuous cooling cycles to be employed for both Tasks 2 and 3. In addition, the applied elastic stress levels were defined for Task 2, and the austenite deformation conditions (temperature, strain, strain rate, and number of deformation steps) for investigation in Task 3. Requirements for sample preparation, develop-ment of starting microstructure, and equipment calibration and stabilization were defined. NIST was consulted regarding the need for Standard Reference Materials (SRM) – eventually, a nickel SRM was agreed upon as the consensus, and provided by The Timken Company as an in-kind contribution to the project. The data to be recorded, fo rmatted and electronically archived were defined in this task, along with metallographic requirements. A methodology for validating the data and certifying its accuracy was also included. The format for the test matrix was designed in cooperation with project team member, Deformation Control Technology (DCT) in order to provide a preliminary format acceptable for data input into simulation process modeling. Based on the individual sub-task outputs, the Project Steering Group reached consensus regarding the specific test conditions, variables, operating ranges and data acquisition and reporting formats. Each representative of the steel-making, forging, heat-treat, process modeling, and OEMs was given the opportunity to contribute to the test and reporting requirements. A report was prepared and disseminated to the team, detailing the test matrix, data format and metallography recommendations and experimental requirements, which served as the basis for laboratory experimentation and commercial verification in Tasks 2 and 3. 3.2 Task 2 – Development a Procedure for Determination of
Transformation Data (without Austenite Deformation) This task resulted in several key outcomes for realizing the envisioned standard practice in steel phase transformation measurement. The first was a definitive summary of the specific proce-dures to be used by ORNL and SNL to meet the experimental requirements defined in Task 1. The Technical Specialist worked with both ORNL and SNL to define starting material require-ments (including steel composition and source), specimen geometries and preparation, and the test procedures to be followed to obtain the thermal cycles defined in Task 1. Methods for applying elastic stress were also defined. Methods were then established with both ORNL and

11
SNL for defining the beginning and end of transformation, and for determining the progress of transformation and transformation strains as functions of time and temperature. This work was reviewed regularly with CSM to assure that the data to be collected would be applicable to computer simulation modeling. The Technical Specialist prepared a preliminary report summarizing these findings and reviewed them with the Project Steering Committee to establish that the requirements of Task 1 were being met. 3.2.1 Sourcing of Test Samples TRC-NCMS contracted with Shular Machining, Inc., Oak Ridge, TN for supply of the majority of the machined dilatometry test samples. Sample geometries and machining tolerances were provided by DSI, ORNL and SNL. 3.2.2 Round-Robin Experiments Prior to undertaking the complete set of tests in the test matrix, CSM recommended evaluating the platform sensitivity of phase transformation measurements performed by the two selected dilatometer instruments – i.e., Gleeble® thermo-mechanical simulation instrument (manufactured by DSI) and the MMC high-speed quench dilatometer (manufactured by Avanel, Inc.). A series of preliminary round-robin tests were conducted at laboratories of members of the Project Steering Group (ORNL, Ispat Inland, DSI, Thyssen Krupp and Timken) on selected isothermal and continuous cooling cycles. The tests were carried out on one of the steel grades selected for the matrix: SAE 1050. The purpose of these tests was to perform a preliminary comparison of data obtained with high-speed quenching dilatometers and Gleeble® thermo-mechanical instruments. In addition, preliminary comparisons of data obtained from different specimen designs and orientation were obtained. CSM conducted the data analyses and resolved discrepancies. 3.2.3 QMST Test Data Collection Procedures (without Elastic Stress) ORNL and SNL began the first set of experiments defined in the test matrix developed in Task 1. These experiments were subsequently reproduced at two selected commercial laboratories. The procedures are summarized below. Continuous cooling and isothermal transformation data were obtained for the two commercially produced steel grades: SAE 1050 and SAE 8620. Transformation kinetics were determined first for unstressed austenite. Companion measurements were made on resistance-heated specimens with a reduced center section (Gleeble® instrument), and on induction-heated solid cylindrical specimens (quenching and deformation dilatometer). Transformation measurements on unstressed austenite were determined by heating the specimens to a temperature of Ac3 + 50°C at a rate of 10°C/sec and holding for five minutes. This was followed by either cooling to room temperature at rates of 0.1-250°C/sec (CCT measurements), or quenching to temperatures between Ms and Ac1 and holding until transformation was complete (IT measurements). Isothermal temperatures ranged from 250 to 750°C for SAE 1050, and from 400 to 800°C for SAE 8620.

12
Metallography and phase transformation verification support for the samples tested at ORNL and SNL was provided under contract by Professional Metallurgical Services, Buchanan, MI. Selected samples with ambiguous material composition after transformation were sent to NIST for Scanning Electron Microscopy (SEM) characterization by Dr. Carelyn Campbell. Photo-micrographs were provided to TRC, who then scanned and uploaded them to the project website for team review and access. The stress-free Task 2 samples were sectioned (longitudinal and transverse) with regard to the sample geometry (both MMC and Gleeble®). It should be noted that “longitudinal, L” and “transverse, T” on the photomicrographs do not indicate rolling or transverse direction. 3.2.4 Replication of QMST Experiments at Commercia l Laboratories The key goal of this project task (from a standardization and end-user standpoint) was to obtain the results of companion experimentation performed at commercial test laboratories. The main question being addressed was, “Are the test data and results obtained using the sophisticated apparatus and techniques formulated at ORNL and SNL reproducible in a more commercial, third party laboratory setting?” From analyses of the results of ORNL and SNL experiments, specifications for testing were prepared for quote by commercial test houses, and Requests for Quotation issued by TRC-NCMS. The test specifications were developed by the Technical Specialist in cooperation with CSM, ORNL and SNL, and reviewed with the Project Steering Committee, before being sent out to the following reputable laboratories known to possess dilatometry equipment (as referred by team members):
• Naval Research Laboratory, Silver Springs, MD • CANMET, Ottawa - Division of National Research Council, Canada • Dynamic Systems, Inc. (DSI), Troy, NY • Thyssen Krupp Stahl, Germany • Queen’s University, Kingston, Ont., Canada • Professional Metallurgical Services, Buchanan, MI
Based on cost, capability and timing criteria, two commercial test houses were selected for performing the experiments without austenite deformation, namely, DSI. (Gleeble® testing), and a consortium of Professional Metallurgical Services and Queen’s University (deformation and quenching dilatometer testing). The results and all tested samples were submitted to the Technical Specialist, who then prepared an executive summary of the findings for review by the Project Steering Committee. Significant emphasis was placed on evaluating the robustness of the procedures to assure applicability to a variety of experimental situations. Metallographic support to verify transformation and phase compositions was provided by the following QMST Project Organizations as in-kind contribution:
• American Axle and Manufacturing (Ms. Jennifer Brown) • DaimlerChrysler (Mr. Peter Bauerle) • GKN (Ms. Suranjeeta Dhar and Mr. David Humphreys) • Metaldyne (Dr. Michael Crews and Mr. Michael Shaw)
13
3.2.5 QMST Test Data Collection Procedures (with Elastic Stress) Transformation measurements on elastically stressed austenite were carried out in the same fashion (as above) at both ORNL and SNL, with the exception that a low level elastic stress was applied to the specimens at the end of the five minute austenite holding time and maintained for the balance of the thermal cycle. Stress levels were estimated by extrapolation of high-temperature flow stress data (provided by DCT). These transformation measurements were developed to simulate heat-treatment fixturing conditions. CSM performed the data analyses and reported on the key differences and issues observed in this case. TRC-NCMS subsequently contracted with Thyssen Krupp Stahl, Germany to conduct com-mercial laboratory verification tests using their Bahr dilatometer. Results were analyzed and compared with SNL and ORNL results. It was concluded by CSM that for isothermal tests, it is not possible to convert Gleeble® data to Bahr, but for CCT, it is possible to obtain good com-parisons between Gleeble ® and the axial equivalents (e.g., Bahr). However, there exist some elastic stress control issues (which may not be surmountable without instrument re-design) on the high-speed quench-type (MMC) dilatometer under continuous cooling conditions. These issues merit further study in a future program. 3.3 Task 3 – Development of a Procedure for Determination of
Transformation Data (with Austenite Deformation) It was originally anticipated that this task would be carried out in the same manner as Task 2, with the exception that austenite deformation would be employed, and no elastic stresses would be applied. However, industry team priorities, funding limitations, and the high experimental risk associated with the development of transformation data with austenite deformation necessitated that this task be carried out at a reduced level of experimentation, mainly as an exploratory activity. Nevertheless, several deliverables were developed from this sub-task. The first was a definitive summary of the specific procedures to be used by ORNL and SNL to meet the experimental requirements defined in Task 1. Preliminary procedures for deformation of austenite were defined, and included temperature, percent strain, strain rate, and number of deformation steps. Methods were collaboratively established with both ORNL and SNL for defining the beginning and end of transformation, and for determining the progress of transformation and transformation strains as functions of time and temperature. This procedure was reviewed with CSM to assure that the data to be collected would be applicable to computer simulation modeling. Transformation measurements on deformed austenite were determined under continuous cooling conditions only. Test data collected was at three cooling rates, two austenitizing deformation temperatures and two strain rates. Gleeble® and MMC specimens were heated to one of two austenitizing temperatures, Ac3 + 50°C or 1200°C, at 10°C/sec held for five minutes and then deformed 35%. After deformation the specimens were cooled to room temperature at rates of 5-70°C/sec. The induction-heated specimens were deformed at a strain rate of 1/sec. Two strain rates, 1/sec and 8/sec, were employed for the resistance-heated specimens. ORNL and SNL
14
completed this first set of experiments on the test matrix developed in Task 1. However, due to the lower industry prioritization, no companion experiments were conducted at commercial test laboratories. This is an area for future pursuit in standardization. Key task findings based on austenite deformation tests include:
• Strain rate has a small effect on the martensite reaction. • No high strain rate data are available for the MMC. • At the high temperature, slower strain rate, the Gleeble® vs. MMC results in CCT for
8620 are only marginally comparable at the slower cooling rates of 5, 10, 70°C/sec. The differences in plots of curves are very large.
• At the lower temperature, slow strain rate for 8620 in CCT, the MMC vs. Gleeble® instruments compare quite well.
• For 1050, it is the low temperature austenite comparisons which are not good, but for the 8620 alloy, it is the opposite.
• Thyssen Krupp recommended narrowing down the cooling rate and simplifying the sample geometry (trying cylindrical samples) in order to avoid the observed anomalies in deformation testing. However, due to the limited resources available, this option was not pursued further.
3.4 Task 4 – Development of a Standard Method for Data Analysis
and Reporting This task produced four main deliverables as described below. 3.4.1 Standard Reporting and Archival Practices The first was the development of standard reporting practices for all data, and established stan-dard procedures for the construction of transformation diagrams. This work was coordinated among the participants by the Technical Specialist who prepared a preliminary report summa-rizing this work for review by the Project Steering Committee. Significant input was provided by the ORNL (Dr. Gerry Ludtka) and CSM (Prof. Mark Lusk) for long-term electronic archiving and retrieval of the transformation data—amongst the options considered was use of Extensive Markup Language (XML), based on a pilot project led by Dr. Ed Bagley at NIST during 2001-2002. However, in the end, the industry team and modelers expressed a preference for a neutral data format (without XML use), and archival on CDs. 3.4.2 Process Modeling of Phase Transformation Data This sub-task defined and applied the critical variables needed for computer modeling, and integration of the measured and modeled phase transformation data into computer codes. This deliverable will also inc lude the validation of the data obtained through representative computer simulation problems. This work was carried out by CSM and DCT, and findings reported to the Technical Specialist for inclusion in the draft recommended practice for review by the Project Steering Committee.

15
Process modeling and sensitivity analysis of the measured phase transformation data was performed by DCT (Dr. Lynn Ferguson, Andrew Freborg and Dr. Charlie Li) as their in-kind contribution to the project. Highlights included the FEM Modeling of the MMC and Gleeble® test samples in dilatometry and heat-treat process simulations. DCT simulated the Gleeble® test set-up using DANTE™ code on ABAQUS® Finite Element Modeling (FEM) software. Boundary conditions simulated included a film coefficient due to water cooling, and air on the outside. DCT showed animations of the austenite transformation zone build-up from heat-up to quench position. DCT also reviewed the MMC quench data for martensite formation in a 1053 CCT plot of quench processes, showing comparisons of experimental 1053 MMC vs. DANTE™/ABAQUS® code predictions, illustrating the “bowing” effect in the experimental curve. They then compared the SNL and ORNL austenite decomposition curves (cooling) at 450°C for SAE 8620. Some differences were found, which may be due to use of different strain rates, PID controllers, geometry and heat-up. Such simulation information may apply to press-quenching (e.g., Torrington/Timken and Ford are doing this), shape changes, and distortion modeling. More recently, DCT reviewed the 1050 ferrite TTT diagram generated from curvefit data collected by dilatometer experiments, as well as the 1050 pearlite TTT diagram showing 1-100% transformation, and finally the pearlite and bainite TTT in 8620 steel. DCT also developed and showed modeling results from use of DANTE™ code for a 10” 1045 steel keyway shaft pro-cessed with oil quenching, with comparisons made on 1050 Gleeble® and 1050 MMC test data. The QMST project is regarded as an important enabler for the measurement of both, linear strain and phase transformation in a real-time, simultaneous fashion, which would significantly help in achieving improved data regression and robustness of predictive commercial software and models, e.g., by use of x-ray and neutron scatter and crystallography. ORNL, Argonne and NIST may have facilities for access to such specialized capabilities in the future. 3.4.3 Draft QMST Recommended Practice Document The third deliverable was the draft “RECOMMENDED PRACTICE” for the development, archiving, and use of transformation data. This was prepared in draft form by the Technical Specialist, with editorial inputs provided by ORNL, SNL, CSM and DCT. Final approval came from the cross-industry Project Steering Committee after two iterations. Recommendations were solicited from members regarding incorporating the recommended practice with one or more recognized standards writing organizations. Four additional major revisions were made after ASTM was selected as the organization to work with. The final, ASTM-approved, draft standard practice document is provided as Appendix B – Draft ASTM Standard Practice. 3.4.4 QMST Standard Instructional Video The DVD was produced by TRC-NCMS at the direction of the Project Steering Group to disseminate the project achievements to a broader audience in the steel process chains. The QMST team felt it would be best to develop the video to address the following industry concerns in two segments (or sections) regarding the use and applicability of the new Recommended Standard:

16
Section 1 (roughly 70% of content):
• Motivations of QMST project e.g., data on total tonnage of steel processed in the U.S. • Main deliverables and “jewels” of the collaborative project. • What were the resources used (e.g., DOE/AISI/companies/universities)? • How testing was planned and conducted by team. • How analysis was carried out and data/results are archived. • What are the benefits of using the QMST test methods (e.g., energy, cost savings, lean
manufacturing, etc.)? Section 2 (approximately 30% of content):
• What is the proposed ASTM Standard? • How will it be used by the industry (e.g., in computer modeling of steel processes)? • What is the future collaborative work involved (e.g., effects of applied stress)?
Copies of the DVD were produced during the Fall of 2003, and provided in early 2004 to both, the AISI sponsor, and the participating organizations and contractors in the QMST project. 3.4.5 Approval Process for the QMST Practice with Standards Writing
Organizations Technical leaders from the appropriate sub-committees at both, SAE and ASTM, were invited by the Project Steering Group to speak at Quarterly Review meetings during 2002 to present their respective organizations’ requirements for documentation, verification and approval of stan-dards. The representatives consulted were: (1) Dr. Mel Head, Stelco Corp. (SAE), and Mr. Phil Speer (ASTM A01). Input on ISO requirements was provided by Dr. Hans-Peter Schmitz of Thyssen Krupp Stahl, Germany. Due to the broader scope and interest of the ASTM and the variety of specialized sub-committees (within both, A01 Main Committee on Steel, as well as Committee E on Test Methods), a decision was made by the Project Steering Committee to present the draft Recommended Practice document for review and approval by the ASTM A01.13 sub-Committee on Mechanical and Chemical Testing and Processing Methods of Steel Products and Processes (chaired by Mr. James L. Klich, administered by Mr George Luciw). Approval of the Recommended Practice by ASTM was accomplished in a record seven-month period, the highlights of which are described below: 1. Project Steering Group member, Mr. Paul Dimitry (MacSteel) consulted with the ASTM A01
Main Committee Chair and Committee Administrator to identify the appropriate sub-Committee at ASTM, i.e., A01.13. A brief follow-up correspondence was conducted with the A01.13 sub-Committee Chair to confirm the scope and interest within the sub-Committee, since the approval process requires 100% consensus of its membership. This resulted in the scheduling of an introductory presentation on the QMST project.

17
2. A presentation was made by Mr. Paul Dimitry and Dr. Manish Mehta (TRC-NCMS) to the A01.13 membership at the ASTM’s semi-annual meeting on May 7, 2003 in Kansas City, KS.
3. The Recommended Practice was assigned an ASTM Work Number WK-1368, and placed on a A01.13 sub-Committee ballot for member approval dur ing July-August 2003. Three negative ballots resulted from the membership vote.
4. During the summer and Fall of 2003, TRC-NCMS worked with the Technical Specialist and A01.13 ASTM members and leadership to address the negative ballots, and this resulted in a revised Recommended Practice document. Two of the three negative voters withdrew their negative ballots, however, one did not.
5. A second presentation was made by Dr. Manish Mehta at the ASTM A01.13 sub-Committee meeting held November 19, 2003 in Tampa, FL. At this meeting, the Project DVD was shown, and a motion was passed for ASTM to conduct a second concurrent ballot of both, the A01 Main Committee and A01.13 sub-Committee.
6. The concurrent ASTM A01 and A01.13 ballot was conducted in January-February 2004. The Recommended Practice passed without any negative ballots.
7. ASTM informed TRC-NCMS of the results of the ballot, designated it as ASTM Standard A1033-04.
8. An editorially revised version of the Standard was submitted by TRC-NCMS to ASTM in early March 2004, which ASTM used for formatting per the ASTM Blue Book guidelines.
9. The new QMST Standard Practice ASTM A1033-04 was officially published by ASTM on March 27, 2004.
4. VALUE CHAIN BENEFITS FROM QMST PROJECT To predict microstructure and properties as a function of steel processing parameters using commercial computer modeling software, it is essential that the unique parameters associated with the various models be established with a high degree of certainty. Most of these parameters are steel grade dependent, and it is therefore necessary to establish a database of numerical transformation data for common steel grades currently being used in a variety of manufacturing processes, for new grades that are being considered as replacements for existing grades, and for alternative processing methods. 4.1 Benefits to Bar Steel Producers and Processors The QMST project was established with the aim of developing a recommended practice for determining quantitative steel transformation data for use with carbon and low alloy steels produced in bar form. Demonstration data on only two bar product steel grades, SAE 1050 and SAE 8620, were obtained as part of the project. There is a definite need to develop a complete collection of quantitative transformation data for the broad spectrum of standard carbon and alloy bar steels currently used in forged, cold-formed, machined and heat-treated components. It must also be recognized that many components are fabricated from non-standard bar steel grades. While current production statistics are not available, it is estimated that, for the category of low alloy steels, more tonnage is produced to non-standard chemical compositions than to standard SAE compositions. In some cases these grades are modifications in composition to

18
standard grades, which have been developed cooperatively between the steel industry and individual steel users to meet the needs of specific applications. More recent sophisticated approaches to addressing specialized needs involve engineering a specific steel composition to a given application. In other cases, new steel grades have been developed through research and development within the steel manufacturing community, and are finding broad based application in spite of the fact that these grades have not been assigned SAE standard grade designations. The PS category of low alloy steels and bainitic steels are examples. Quantitative transformation data is often not available for this broad category of bar steels. The use of computer modeling to predict their microstructures and properties, and to estimate distortion during heat-treatment, requires that this data be obtained. Of significant interest to bar processing supply chains are the steels used for case carburizing. In these cases, a carbon concentration gradient exists near the surface, which results in a transfor-mation gradient from the surface to the center of a component. The development of transforma-tion data on carburizing steels as a function of carbon concentration would be valuable in terms of predicting the microstructures and properties of these steels for various carburizing cycles. 4.2 Benefits to Forging Industry As in the case of bar steel producers, the forging industry has a definite need for transformation data for a broad spectrum of steel grades. The development of this data would be extremely beneficial in developing required properties in the as- forged condition. As an example, medium-carbon microalloyed steels are a fast growing category of forging steels, which take advantage of both deformation and controlled-cooling after deformation to develop their final properties. Accurate quantitative transformation data, which reflects the effects of deformation, is essential for prediction of their microstructures and properties, and for optimizing their application to forged components. 4.3 Benefits to Flat Steel Producers There is also a definite need for quantitative transformation data for steel grades used in plate and sheet steels. A number of standard SAE and non-standard carbon and low alloy steels are used for plate applications. In addition, low carbon microalloyed (HSLA) steels are produced in plate form, which develop as-hot rolled properties through the use of controlled rolling and controlled cooling practices. Hot rolled HSLA strip steels in coil form also take advantage of controlled rolling and cooling practices. For the HSLA steels, the effects of deformation would again need to be incorporated into the data. In recent years, there has been an increase in the utilization of continuously annealed cold rolled high-strength sheet steels. The use of controlled cooling after austenitizing is instrumental in developing the final properties of these grades, and accurate transformation data is necessary for optimizing the specialized processing involved in their production. 4.4 Benefits to Powder Metal Industry Transformation data is required for specialty steel grades used in powder metallurgy (P/M) applications. These grades have compositions that differ from conventional wrought steel grades

19
in that they take advantage of higher levels of traditional alloying elements such as nickel and molybdenum, and also utilize unusual alloying elements such as copper. It would therefore be expected that steels for P/M applications would exhibit unique transformation characteristics, based on process variables such as cooling rate and quench dynamics, degree of sinter and densification. Availability of transformation data on P/M alloys would significantly improve the industry’s ability to model processes and more efficiently manage energy consumption for realizing savings in plant and machining infrastructure. 4.5 Benefits to Steel Casting Industry Finally, accurate and consistent transformation data would be extremely beneficial to the steel foundry industry. Steel grades used in castings, while similar in many respects to wrought steel grades, take advantage of slightly different chemical compositions. In addition, nearly 100% of all steel castings are heat-treated to develop the properties required for individual applications. Appropriate transformation data would thus be useful to predict microstructure and properties after heat-treatment. In addition, quantitative transformation data could prove useful in predicting as-cast microstructure and properties when incorporated as an adjunct to casting simulation models. This offers the long-term possibility of developing needed properties in the as-cast condition. 4.6 Benefits to Heat-Treating and Finish Fabrication Industry It is evident from the foregoing discussion that a wide variety of steel products require accurate quantitative transformation data to optimize fabrication into final components. Where heat-treatment is required, it is usually one of the last steps employed in developing the required properties for a fabricated component. Defining the proper heat-treating cycle is essential in avoiding costly scrap and rework. The development of a transformation database for a broad spectrum of steels would offer two advantages. First, it would provide the information needed to optimize computer modeling of more efficient steel processing facilities. Just as important, the development of such a database would be of immediate assistance in improving the efficiency of existing heat-treating and fabrication facilities. 4.7 Dissemination of Project Findings Project findings were presented to the AISI and DOE sponsors at the 2002 and 2003 Annual AISI/DOE Technology Roadmap Project Reviews held in Pittsburgh, PA. Non-proprietary information on the QMST project was disseminated as presentations or publications to the public as follows:
1. AISI’s “Great Designs in Steel” Seminar on February 18, 2004 – QMST Project DVD shown to a broad industry audience.
2. R.A. Jaramillo et al., “Dimensional Anisotropy During Phase Transformations in a Chemically Banded 5140 Steel; Part I: Experimental Investigation,” Acta Materialia, 52/4, 851-858, 2004.

20
3. R.A. Jaramillo and M.T. Lusk, “Dimensional Anisotropy During Phase Transformations in a Chemically Banded 5140 Steel; Part II: Modeling,” Acta Materialia, 52/4, 859-867, 2004.
4. Forging Industry Association Technology Roadmap Review, October 10, 2003, held at NCMS, sponsored by FIA/FIERF.
5. Z. Li et al., “Distortion of a Marine Crankshaft During Quenching,” ASMI-HTS Conference, Indianapolis, IN, September 2003.
6. B.L. Ferguson et al., “The Kinetics of Austenite Formation,” ASMI-HTS Conference, Indianapolis, IN, September 2003.
7. A.M. Freborg et al., “Characterizing the Quenching Behavior of 1050 Steel and Application in Computer Simulation,” ASMI-HTS Conference, Indianapolis, IN, September 2003.
8. M.T. Lusk et al., “On the Role of Kinematics in Constructing Predictive Models of Austenite Decomposition,” Austenite Formation and Decomposition (eds. E.B. Damm and M.J. Merwin), 311-332, Minerals, Metals and Materials Society, Warrendale, PA, 2003.
9. R. Jaramillo and M.T. Lusk, “Anisotropic, Plastic Deformation During Martensitic Transformation in Chemically Banded Medium Carbon Steels,” 13th International Federation for Heat Treatment and Surface Engineering Congress (IFHTSE) and the International Surface Engineering Congress (ISEC), Columbus, OH, October 2002.
10. B.L. Ferguson, “Simulation of Heat-Treat Processes for Steel Parts Using DANTE™ ,” Joint ASM Detroit – SAE Detroit Technical Symposium, Troy, MI, October 3, 2002.
11. Steel Joint Industry Alliance (JIA) Workshop on “Improved Steel Processing Economy Through Application of Transformation Kinetic Data,” August 28, 2002, held at NCMS, sponsored by Michigan IOF and Thomas Borton and Associates Inc.
12. B.L. Ferguson, “Simulation of Heat-Treating Processes to Harden Steel Gears Using a PC,” SME Seminar Heat-Treating and Hardening of Gears,” January 29, 2002.
5. CONCLUSIONS A standardized method and recommended best practices for phase transformation (without austenite deformation) resulted from this unique steel value chain collaboration. The method was approved and published by the ASTM as A1033-04, and included standardized nomen-clature for the sample preparation, pre-treatment, data collection, analysis, and reporting of steel transformation data. From these procedures, databases (including electronic format) of trans-formation data can be developed which allow the prediction of microstructure and properties as a function of process variables. Analysis of the transformation information obtained under stress- free conditions indicated that the procedures established will result in good correlation between the two types of measurement systems tested. Transformation data obtained under conditions of applied low-level elastic stress were found to be system sensitive. Limited data was obtained under conditions of austenite deformation, and this remains an area which merits more detailed study. A complete data set for two grades of steel (including the raw test data, the calculated transfor-mation kinetic and thermal strain data, and transformation diagrams) were produced and supplied

21
to the QMST Consortium members in an electronic format for archival purposes. These data will be kept proprietary to the industry team contributing resources for a period of five years (beginning March 31, 2004). Only the QMST standard/recommended practice is available for publication. A Project DVD/video was prepared with multi-media content to disseminate the benefits of the standardized dilatometry practice. The QMST project is a cornerstone for undertaking a larger program to develop energy efficient steel processing across the entire steel processing value chain, with the potential for delivering real benefits and economy for the manufacture of a broad variety of vehicle powertrain, body and chassis components.

Page 1 of 26
QMST Proprietary
Nomenclature, Definitions and Terms For Use in
Reporting Steel Transformation Data
A Literature Review and Recommendations
A Report Submitted To
The Project Steering Committee
DEVELOPMENT OF A STANDARD METHODOLOGY FOR THE QUANTITATIVE MEASUREMENT OF STEEL PHASE TRANSFORMATION KINETICS AND DILATION
STRAINS USING DILATOMETRIC METHODS (QMST)
By Thomas G. Oakwood, Technical Manager
July 15, 2001 Final Edited Version December 31, 2001

Page 2 of 26
QMST Proprietary
Introduction The purpose of the collaborative project on Quantitative Measurement of Steel Transformations (QMST) is to develop a standard practice for obtaining and archiving quantitative steel transformation kinetic data and thermal strain data. The first deliverable in Phase I of the project is a recommendation for common and consistent nomenclature and definitions for describing steel transformation behavior. This would have two benefits. First, a common nomenclature would be used in conjunction with numerical strain-temperature-time data that would be developed and archived as part of a standard practice for transformation measurements. Second, a common and consistent nomenclature would provide for the construction of standardized isothermal transformation (IT or TTT) and continuous cooling transformation (CCT) diagrams. To accomplish this objective, a literature search was conducted to identify the nomenclature and definitions, which have been used to describe phase transformations in steel. The purpose of this report is to describe the results of the literature review, and to present recommendations for standardized definitions and nomenclature to be used as part of a standardized practice for obtaining, archiving and presenting steel transformation data. Literature Sources The author arranged for NCMS/TRC to conduct a review of a number of computerized databases to obtain a list of titles related to steel transformation behavior. These were reviewed, and abstracts were obtained for further review. From the abstracts, references were obtained for complete review. Additional titles were contributed by the Colorado School of Mines and by individual representatives of the project consortia. A list of references used to develop the final recommendations in this report is included in an Appendix I. Specific Information Reviewed The purpose of this report is to provide recommendations related to nomenclature and definitions describing steel transformation behavior. Thus the references were reviewed to determine how the following items were addressed:
1. Description of steel phases present during the transformation of austenite, and the final products of transformation.
2. Description of critical temperatures 3. Units for transformation temperatures. 4. Description of transformation times. 5. Description of thermal profiles. 6. Presentation of property data, specifically hardness. 7. Availability of metallographic information.
Page 3 of 26
QMST Proprietary
Both metallographic and property data are designed to augment basic transformation measurements. The use of this type of data was reviewed in this literature search to evaluate the frequency of use and the method of presentation. While the review included an examination of the techniques used to measure transformation behavior, this report will be restricted to the issue of how the data were presented. Dilatometric techniques to be used to measure transformation behavior in this collaborative project have already been established as a result of discussions among the participants. It should be emphasized that the purpose of this review is to describe the nomenclature and definitions used to describe the formation of the principal products of austenite decomposition, i.e., ferrite, pearlite, bainite and martensite. In many cases solid-state reactions take place between steel alloying elements and the interstitial elements carbon and nitrogen. This results in the formation of compounds, which are unique to a given steel composition. This is often the case in highly alloyed steels. Description of these compounds was considered beyond the scope of this review, since special nomenclature, rather than standardized nomenclature, is required. Categories of References The references reviewed fell into one of four categories. The first included research papers, which were aimed at studying the effects of steel composition or processing on transformation behavior. This category also included experimental studies that described techniques for measuring transformation behavior. The second category consisted of papers aimed at developing methods for predicting transformation behavior. These papers either took the form of predicting transformation behavior from first principles, or of predicting transformation behavior for a particular thermal profile from a different profile. Examples inc luded predicting continuous cooling transformation behavior from isothermal transformation data (or the inverse), and predicting hardenability, e.g. Jominy response, from isothermal transformation data. A third category of references included papers that were of an instructive nature, and were written to acquaint a reader with the use of transformation data. An example would be a paper describing the use of continuous cooling transformation diagrams to estimate microstructures obtained during welding. The final category of references included compilations and atlas volumes of transformation data. Some of these were the results of many years of study by a single source, e.g. United States Steel, or were compilations of data obtained from many reference sources. Also included in this category were references presenting results from a single steel grade where the information was presented as a “data sheet”.

Page 4 of 26
QMST Proprietary
Results It should be noted that all of the terms and definitions, which were located in this literature search, were obtained from graphical presentations of transformation data. This is to be expected, since very early transformation data were obtained by evaluating steel microstructures as functions of thermal profiles. From this information transformation diagrams were constructed depicting the beginning, progress and end of austenite decomposition. In later studies strain-temperature-time data were developed using various dilatometric techniques, and supplemented with metallographic data. The numerical dilatometer data, however, were not reported in the literature, and the transformation diagrams constructed from various studies were again the primary source of terms and definitions. In some cases strain-temperature plots, obtained from dilatometer traces were reported and annotated. The nomenclature used in these cases was included in this literature review. Description of Steel Phases and Constituents Present During Transformation of Austenite and Final Products of Transformation As was noted above, the principal phases and constituents resulting from austenite decomposition are ferrite, pearlite, martensite and bainite. The descriptions of these transformation products varied widely among the various references reviewed. Data presentation generally took the form of transformation diagrams, developed either from isothermal or continuous cooling transformation conditions. Occasionaly tabular data was employed to simply describe the beginning and end of transformation (31). In some cases, transformation diagrams were published with no labeling whatsoever of the phases and constituents being formed. (2,6,38,44). The determination of which products of decomposition were present at any point during the transformation process was thus left to the reader’s interpretation. In other cases the phase and constituent fields were extensively labeled. These descriptions took one of two forms. A single word or letter designation would be used to identify the phase or constituent being formed in a given time-temperature regime (5,9,13,14,15,24,25,27,30,55). For example, the term “ferrite”, or the letter “F”, would be used to delineate a region were austenite present was transforming to ferrite. The term “pearlite”, or the letter “P” would be used to describe where any austenite present (or remaining) was transforming to pearlite. The other form would be to describe all phases or constituents present in a given time-temperature regime (17,18,19,22,29). The terms “austenite + ferrite” (A+F) or “austenite + ferrite + pearlite” (A+F+P) would be used to describe all phases and constituents present in a given regime. There was a general preference toward the use of single letters (9,13,14,15,18,19,22,24,27,29,30,55). Fully spelled words were used less frequently (5,9,25). The descriptors most commonly used to identify the various phases and constituents present and products of transformation were used the Arabic

Page 5 of 26
QMST Proprietary
alphabet. The use of the Greek characters, γ for austenite and α for ferrite was only used in a few instances (17). In some references the products of transformation were characterized in detail based upon morphology observed metallographically (1,7,8,16,41). In a few cases the classification system developed by Bramfitt and Speer was employed (7,8). This system describes in detail the various morphologies of bainite and ferrite that can be observed (56). In specialized cases related to welding, designations of various morphologies of transformation products typical of welding processes were used (16). This included the use the microstructure nomenclature standardized by the Japanese Welding Society and the International Institute of Welding. The progress of transformation was noted in many cases, but was not employed universally. In addition to the boundaries of the phase and constituent fields, which define the beginning and end of austenite transformation, further notation was sometimes used. Terms such as Fs and Ff, and Ps and Pf were used to denote “ferrite start” and “ferrite finish”, and “pearlite start” and “pearlite finish”, etc (3,4). The percent transformed was also annotated in some references. In some cases a series of time-temperature points were graphically connected to define a given percentage of austenite transformed, e.g. 50% (18,19,20,21,22). For continuous cooling studies, numbers, designating the amount of a phase or constituent formed during cooling, would be used at the intersection of cooling curves and the lower boundary of a transformation region (9,24,30). It should be noted that detection of the start of transformation requires the presence of a finite amount of the phase or constituent being formed. Thus the “start” boundaries really represent points at which a small amount of the phase or constituent is present, e.g. 1%. Similarly, detection limits can result in an “end” boundary that really represents the transformation of, say 99%, of the phase or constituent being formed. The special case of retained austenite at room temperature was not addressed routinely in the transformation literature. This constituent is meta-stable, and is usually present along with martensite. If the transformation of austenite to martensite is completed above room temperature, no retained austenite is observed. However, if the transformation to martensite is not completed during cooling to room temperature, meta-stable austenite can be present in the microstructure. In some cases the start and finish of the transformation to martensite were reported, but these involved situations where the finish of the martensite transformation occurred above room temperature (1,25). Also, the start of the martensite transformation was occasionally reported along with annotation of the presence of both martensite and austenite at temperatures below the start of the martensite transformation (22). In one special case, retained austenite was noted as part of a so-called martensite/austenite (M/A) constituent in the room temperature microstructure (10). Presumably due to the meta-stable nature of retained austenite, no nomenclature specific to this constituent was routinely reported.

Page 6 of 26
QMST Proprietary
Description of Critical Temperatures Critical temperatures are theoretically defined on the iron-carbon equilibrium phase diagram. The upper critical temperature is the temperature is the maximum temperature at which ferrite is present, and the lower critical temperature is the lowest temperature at which austenite is present. A number of designations have been used to depict these temperatures. Equilibrium designations are Ae1 for the lower critical temperature and Ae3 for the upper critical temperature. These designations have also been abbreviated as A1 and A3. If critical temperatures are determined experimentally by “near equilibrium” heating, the terms Ac1 and Ac3 are used. These have sometimes been designated as As and Af for “austenite start” and “austenite finish”. If determined by “near equilibrium cooling”, the terms Ar1 and Ar3 are used. There are usually small differences in the actual values reported for critical temperatures depending on the technique used to determine them. Typically Ar values are lower than Ac values. The most common representation of critical temperatures was use of the term Ac1 for the lower critical temperature, and Ac3 for the upper critical temperature. In a few references only the Ac3 was reported (29). It was more common to report both the Ac1 and Ac3 temperatures (7,8,20,21,22,25,26,39,55). Ac3 is considered an important temperature since it represents the upper limit of transformation from austenite during cooling in spite of the fact that it is determined by “near equilibrium” heating experiments (19). The Ac1 temperature is of significance in that it represents the maximum tempering temperature that can be employed during heat treatment (19). The alternate designations As and Af, A1 and A3, and equilibrium designations, Ae1 and Ae3 were also used to depict critical temperatures (3,4,19,23,30,38). The use of the designations Ar1 and Ar3 to depict these temperatures measured by “near equilibrium” cooling was not found. It should be noted that often times critical temperatures were not reported at all (1,5,9,13,14,15,32,41). It should be noted that the foregoing discussion relates to so-called “hypoeutectoid steels”, i.e. steels with chemical compositions such that ferrite is the first phase which forms during near equilibrium cooling from austenite. In the case of “hypereutectoid steels”, chemical compositions are such that cementite (Fe3C) is the first constituent formed during near equilibrium cooling from austenite. In these steels the upper critical temperature is the highest temperature at which cementite is present, and is annotated differently. The equilibrium term is Aecm, the term for near equilibrium heating conditions is Accm, and for near equilibrium cooling conditions is Arc m
(57). Units for Transformation Temperatures As might be expected, the traditional measurement of transformation temperatures was reported in either degrees Celsius or degrees Fahrenheit. The

Page 7 of 26
QMST Proprietary
Celsius scale is by far the most common today, with the Fahrenheit scale being used primarily in older studies (13,14,15). Dual units were also employed in older references (18,19). A notable exception to this, which is worthy of special discussion, was the use of a temperature interval system developed by British Steel Corporation for carbon and low alloy bar steels (25,55). In this system, temperature intervals are defined in terms of fractions of various austenitizing temperatures. In Table 1, the top row shows temperatures from 1050 °C to 770 °C, which represent initial temperatures from which a bar is cooled to 20 °C. Each column is divided into 20 equal intervals, which correspond to fractional temperatures indicated in the left hand column. Thus a bar cooled from 930 °C to 566 °C has reached a fractional temperature of 0.6. Also a fractional temperature of 0.75 corresponds to an actual temperature of 687.5 °C for cooling from 910 °C and to 680 °C for cooling from 900 °C, etc. This system was developed to determine equivalent bar diameters which achieve the same microstructure when cooled by various methods from various temperatures. In Table 2, the cooling rates between the fractional temperatures shown in the top row, for oil quenched specimens of various diameters given in the left hand column, is identical to that for the diameters shown for three cooling conditions under each fractional temperature range. As an example, an oil-quenched specimen, 18 mm in diameter, will cool through the fractional temperature range of 0.80-0.75 at the same rate as an air-cooled bar of 1.05mm or a water- quenched bar of 26 mm in diameter. Description of Transformation Times Several different approaches to describing transformation time were found. The most typical was to simply use time in seconds for both isothermal and continuous cooling measurements. Older literature often used additional annotation for long isothermal transformation times to describe time periods of an hour, a day, or a week (18,19). For continuous cooling transformation studies additional descriptions of time were identified. A few references employed a system developed by Climax Molybdenum, which involved a so-called half-cooling time (11,20,21). This was defined as the time required to cool from Ac3 (hypoeutectoid steels), or the austenitizing temperature (hypereutectoid steels), to a temperature halfway between the Ac3, or the austenitizing temperature, and 25 °C. In all of the above approaches, the time scale on transformation diagrams was logarithmic. An approach that has been employed more recently is to denote transformation time as the time between 800 °C and 500 °C (32,39). This method permits differentiation between various cooling profiles, e.g. Newtonian versus linear, without superimposing the profiles on the CCT diagram (39). Furthermore, this temperature range has been considered important since it influences microstructure and precipitation kinetics (32). Finally the fractional temperature system described above, which was developed by British Steel Corporation,
Page 8 of 26
QMST Proprietary
resulted in replacing units of time with equivalent bar diameters for various cooling conditions (25,55). An issue of importance in describing transformation behavior on continuous cooling is the temperature at which time measurement is initiated, so-called “time-zero”. This generally was reported in one of two ways. In one method, time-zero was the point at which cooling commenced from the austenitizing temperature. This was concept was often used where the condition of the austenite was of special significance in determining transformation behavior. Simulation of welding cycles involving high austenitizing temperatures is one example (1,16,30). Other examples include some studies involving thermo-mechanical processing simulations, where time-zero was at the end of austenite deformation, and transformation studies on micro-alloyed steels, which take into consideration dissolution and re-precipitation of niobium, vanadium, and titanium carbonitrides (7,8). For most studies involving carbon and low alloy steels, time-zero was defined as the point at which Ac3 was reached during cooling (11,13,14,15,20,21,24,29,38,39). The rationale for this convention has been based on the fact that no transformation can occur above Ac3. Description of Thermal Profiles It was found that the description of thermal profiles consisted principally of reporting cooling curves during the development of continuous cooling transformation data. The thermal profiles used in reporting isothermal transformation data often would be described in the texts of various references, but would not be included in the construction of transformation diagrams (17,18,19,22). In the case of continuous cooling transformation data, the cooling curves, if reported, would be superimposed over the CCT diagram (1,5,7,8,9,13,14,15,20,21,24,26). Individual cooling curves would represent linear, Newtonian, or any other profile, or combination of profiles used to determine the transformation data. Where thermal arrests were observed experimentally, these were generally included. Cooling curves were not always included with CCT diagrams. As noted above, the use of cooling time between 800C and 500C obviated the need for them (39). As a final note, a chart of cooling rates was included with each CCT diagram developed in the British Steel compilation of data for bar steels (55). As was noted above, equivalent bar diameter was used on one axis of each diagram rather than units of time. The cooling rate chart permitted establishing cooling rates for various bar diameters cooled in various media. Heating rates and austenitizing temperatures and times, if reported, were usually included as text additions to diagrams. Presentation of Hardness Data Hardness data was oftentimes, but not always, included with the presentation of transformation data. Usually, the hardness values were obtained from micro-hardness measurements obtained at loads consistent with specimen size.

Page 9 of 26
QMST Proprietary
Occasionally, Rockwell values were reported (14). The data would be added to the cooling curves on continuous cooling diagrams, and occasionally to the isothermal hold temperatures for isothermal transformation diagrams (5,7-9,13-
15,17,20,21,24.26,30). In the latter measurements, the hardness values were those obtained after 100% transformation at the isothermal hold temperature. Occasionally, a separate hardness versus time plot would be included with the transformation diagram (1,16). The use of supplemental Jominy end quench data was also employed (19,20,22). Presentation of Metallographic Information The use of metallographic data to augment the quantitative transformation data varied widely from reference to reference. In some instances no metallographic information was provided, and the reader could only determine microstructure as a function of thermal profile from the labeling of transformation diagrams or verbal descriptions (8-11,13-16,18,19,26,30). In older literature ferrite grain sizes were annotated on cooling curves of CCT diagrams to aid in microstructure interpretation (13-15). Where metallographic data was reported, its use varied from a few representative photomicrographs (1,5,7,22,29,34) to more complete characterizations describing the microstructures obtained for most of an entire transformation diagram (20,21,22,23). The majority of metallographic data was presented as optical micrographs, however both scanning electron microscopy and transmission electron microscopy were used in some cases to provide more microstructure detail (5,29,34). One quantitative metallographic feature reported in a number of cases was prior austenite grain size 13,14,15,22,25,26). It is generally accepted that prior austenite grain size influences transformation behavior, i.e., coarse prior austenite grain sizes increase hardenability. Discussion As was noted above, the purpose of this literature search was to identify nomenclature and definitions used in transformation measurements, and to provide recommendations for common nomenclature to be used as part of a standard practice for the measurement, archiving, and presentation of transformation data. This infers that the nomenclature recommended could be used with both the numerical time-temperature-strain data, and for the transformation diagrams used to present the data graphically. It is assumed that the numerical data would be archived using a row/column database format. Therefore it is appropriate that the nomenclature and definitions adopted as part of a standard practice for obtaining and archiving transformation data be simple, concise, and easily interpreted.
Page 10 of 26
QMST Proprietary
Phase and constituent identification during austenite transformation is the first issue that needs to be addressed. As was noted above, the descriptors used in describing the products of austenite transformation were found to vary from simple terms incorporating all morphologies of a given phase to complex descriptors, which differentiate among various phase morphologies. It can be anticipated that the transformation data developed from a standard practice will be interpreted and reviewed by engineers with varied backgrounds and varied levels of metallurgical experience. It would thus seem prudent to avoid the use of complex terminology that could only be interpreted and understood by a limited number of individuals. Furthermore, database formats for archiving time-temperature-strain data may have limits at to the number of characters that can be used to describe the products of austenite transformation. Thus the use of single letter designations for each product of transformation would be most appropriate. Terms such as “A” for austenite, “F” for ferrite, etc. should be used to annotate both numerical time-temperature-strain data, and transformation diagrams. While martensite would be labeled as “M”, the subscripted term Ms should be employed to designate the martensite start temperature, since this temperature is a unique point on a transformation diagram. Transformation diagrams should be labeled such that only the phase or constituent which is being formed at a given time and temperature is identified. This appears easier to interpret than attempting to identify all the phases being present. Special consideration should be given to labeling pearlite as “P” and bainite as “B” rather than using the generalized nomenclature of “ferrite (F) plus carbide (C)”. The latter descriptors were used in early isothermal transformation diagrams, and probably should be discarded in this program in favor of descriptors that reflect the fact that the morphology of pearlite and bainite is unique (57). Annotation of retained austenite should be included if its presence can be determined conclusively, e.g. through metallographic measurement. The term “RA” could be used to designate this constituent. The progress of austenite transformation should be annotated, however the method will differ for numerical time-temperature-strain data compared to transformation diagrams. For transformation diagrams, the beginning and end of a given transformation are obviously defined by the phase boundaries, and further annotation appears unnecessary. For isothermal transformation diagrams, the progress of transformation is probably best described through the use of lines connecting points of equivalent percent transformed. The number of lines used could vary, e.g. 25, 50, 75%, depending on the diagram. The principal constraint would be to avoid confusion in interpreting the diagram. In the case of continuous cooling diagrams, an appropriate technique would be to label the intersection of a cooling curve with the lower boundary of a phase field with the percentage of the total microstructure that consists of the phase formed. Thus, for example, if the intersection of a cooling curve with the lower boundary for ferrite formation results in a structure consisting of ten percent ferrite, the intersection would be annotated with the number 10.

Page 11 of 26
QMST Proprietary
For the archiving of numerical time-temperature-strain data, the progress of austenite transformation can be reported in significantly more detail than is possible with transformation diagrams. Assuming a row/column data format, where each row contains the variables of time, temperature and strain in individual columns, additiona l columns could be added to provide data on the percentage of each phase present for any combination of time, temperature, and strain. The only constraint would be the ability to interpolate the dilation curves. It should be noted that strain is a dimensionless quantity determined as ∆l/lo where ∆l is a change in length of an initial length lo. Two critical temperatures need to be annotated in conjunction with both isothermal and continuous cooling transformation data. First of all, based upon the information established in the literature, Ac3 should be identified (For hypereutectoid steels the Accm temperature should be identified.). There are two reasons for this. First of all, Ac3 can be determined with minimal ambiguity. Secondly, this temperature marks a maximum above which no austenite decomposition can occur. This latter point is particularly critical for isothermal transformation studies in that it defines the upper limit for isothermal hold temperatures. It is also important for both isothermal and continuous cooling studies, since it defines an absolute minimum austenitizing temperature. Ac1 should also be identified, since this is of significance as a guideline for tempering during heat treatment. Ac1 represents the maximum tempering temperature that can be employed for a given steel grade without transformation to austenite. Critical temperatures should be annotated directly on transformation diagrams, and noted in the pedigree for each steel grade in archiving numerical time-temperature-strain data. Since Ac1 and Ac3 temperatures are sensitive to heating rate, the heating rate employed should be noted on transformation diagrams and recorded in the pedigree with numerical time-temperature-strain data. The use of the Celsius scale for defining transformation temperatures is the accepted method internationally. The use of the Fahrenheit scale has primarily been used in early literature in the United States. Thus the use of the Celsius temperature scale should be employed. The use of any temperature interval system such as that described above for British steel work would not be appropriate. This is largely due to the constraint that transformation temperatures need to be identified as discrete variable when archiving numerical time-temperature-strain data. The development of a standard practice for transformation measurement, which includes both isothermal and continuous cooling conditions, dictates that a single time unit of seconds be employed. Some of the other methods of describing transformation time are only applicable to continuous cooling measurements. Furthermore, the constraints of a numerical time-temperature-strain database, described above for units of temperature, also apply to units of time. For the

Page 12 of 26
QMST Proprietary
construction of transformation diagrams, the time scale should be logarithmic. For the purpose of continuous cooling transformation diagrams, time-zero is best designated as the time from reaching Ac3 during cooling. This eliminates artificial shifts in transformation diagrams as a result of changing cooling times when cooling at identical rates from different austenitizing temperatures. Description of thermal profile data is more of an issue for transformation diagrams than for the archiving of numerical time-temperature-strain data. First of all, the heating rates used for austenitization, and austenitizing temperatures and times need to be noted for both. This information was often missing from some of the diagrams found in the literature. This information could be included in the pedigree for temperature-time-strain data, and as a text note on transformation diagrams. As was noted above for isothermal transformation studies, the cooling profiles were not generally recorded on transformation diagrams. These profiles consist of rapid quenching from the austenitizing temperature to a predetermined temperature at which the sample is held while transformation progress is monitored until completion. The transformation diagram varies only with steel composition, and perhaps austenitizing conditions. Therefore the cooling profiles and subsequent isothermal holds probably do not need to be included on an isothermal diagram. However, a text note on the transformation diagram indicating the quench rate used to achieve isothermal hold temperatures would be worthwhile. The thermal profiles employed in continuous cooling transformation studies, however, need to be plotted on the transformation diagram. These profiles must duplicate those actually achieved during testing, e.g., linear vs. Newtonian, etc. This is particularly important since different profiles are often used on the same diagram. If cooling rates are reported, the temperature at which they were measured, or the range over which they were measured, must be reported. For numerical temperature-time-strain data, the quench and hold profiles for isothermal transformation or the cooling profiles for continuous cooling transformation are an integral part of the row/column data format. Each entry includes an element of strain and associated temperature and time. Thus no further annotation appears necessary. Hardness data would be most useful with continuous cooling transformation measurements. Hardness values obtained from isothermal transformation measurements are of more limited value. The principal interest in hardness data from isothermal measurements would be for use with specialized heat treatments such as austempering and martempering. It would be appropriate therefore to include a hardness value as an annotation on each cooling curve for continuous cooling transformation diagrams, and as an additional note with each set of time-temperature-strain representing a given cooling curve, and reported in a database format. A similar approach could be used with isothermal

Page 13 of 26
QMST Proprietary
measurements on an as-needed basis. The hardness measurements should be reported in the units in which they were measured, usually micro-hardness values. ASTM procedures for determining micro-hardness as described in ASTM E-384 should be followed. Any conversion to other values, e.g. Rockwell hardness values, should follow accepted conversion procedures described in ASTM E-140 and be noted as such. As was noted earlier, metallographic data have been included with transformation data on an as-required basis. The principal objective of the use of metallography was to verify and expand on the results of dilatometric measurements. It is appropriate to incorporate a requirement for metallographic information to augment the data reported from a standardized transformation measurement. Metallographic results would serve a very useful function by exhibiting the different morphologies of various phases shown on transformation diagrams described with the same nomenclature. As examples, both ferrite and bainite have a variety of morphologies, but would only be labeled by the letters “F” or “B”. Metallographic results could serve to distinguish the various morphologies. Metallography should be used to document the microstructure obtained after 100% transformation for every thermal profile used either for isothermal transformation or continuous cooling. Microstructures obtained from interrupted quenching experiments designed to verify progress of transformation could be included on an optional basis where needed. The nomenclature used to describe the morphology of a given phase depicted in a particular photomicrograph would be left to the discretion of an individual investigator. Since metallography would be used to augment dilatometer data, flexibility in description of the microstructures should be permitted. While most microstructures would be determined using optical techniques, the use of transmission or scanning electron microscopy should be used to provide important microstructure details that cannot be shown using optical methods. Since prior austenite grain size influences transformation behavior, its value should be determined wherever possible. Concluding Comments From the results of this study, it is apparent that a database format for the presentation of standardized transformation data for a given steel grade can be developed which consists of three parts. First the numerical time-temperature-strain data, along with data on the progress of transformation and resulting hardness values, can be formatted in a row/column type of structure as part of the database. Second, the database would include the appropriate standardized transformation diagram along with pertinent information regarding experimental details. While discussion of the chemical composition of each steel is beyond the scope of this study, the chemical composition of each steel grade studied would

Page 14 of 26
QMST Proprietary
be expected to be included in such a database. Third, a collection of photomicrographs would be included which would augment the other data with additional information regarding the characteristics of austenite transformation. Figures 1 and 2 give examples of the format recommended for both isothermal and continuous cooling transformation diagrams. These were excerpted from specific references in this literature search and then modified (22, 39). These examples do not include all of the items recommended above such as heating rate and austenitizing temperature. It is evident however, that simple text notes could incorporate these parameters. Table 3 gives a simplified example of a time-temperature-strain format, which includes entries for the progress of transformation. Again, experimental details would need to be included in the pedigree for each steel grade. All of these elements, when combined, could provide an excellent format for the archiving of transformation data obtained from standardized measurement techniques. Finally, it should be reiterated that the purpose of this collaborative project is to develop a standard practice for obtaining and archiving quantitative steel transformation kinetic data and thermal strain data. This practice will be the basis for the development and electronic archiving of a quantitative time-temperature-strain database for process modeling using computer simulation software. The nomenclature adopted should applicable to both the archived numerical data from transformation measurements, and to graphical outputs developed from the data. Recommendations The use of a single letter to designate each product of transformation would be most appropriate. Terms would include “A” for austenite, “F” for ferrite, “P” for pearlite, “B” for bainite, and “M” for martensite. These terms should be used to annotate both numerical time-temperature-strain data, and transformation diagrams. Transformation diagrams should be labeled such that only the phase that is being formed at a given time and temperature is identified. Retained austenite is a special case that should be designated only if its presence is conclusive. For transformation diagrams, the beginning and end of a given transformation is defined by the phase boundaries, and further annotation is unnecessary. For isothermal transformation diagrams, the progress of transformation is best described through the use of lines connecting points of equivalent percent transformed. The number of lines used can vary, e.g. 25, 50, 75%, depending on the diagram. The principal constraint would be to avoid confusion in interpreting the diagram. In the case of continuous cooling diagrams, the recommended technique is to label the intersection of a cooling curve with the lower boundary of a phase field with the percentage of the total microstructure that consists of the phase formed. For numerical time-temperature-strain archiving, assuming a

Page 15 of 26
QMST Proprietary
row/column data format where each row contains the variables of time, temperature and strain in individual columns, additional columns should be added to provide data on the percentage of each phase present for any combination of time, temperature, and strain. This last point is predicated on development of an acceptable method of interpolating dilation curves. The critical temperatures Ac1 and Ac3 (or Accm) should be included with the transformation data for each steel grade evaluated. Critical temperatures should be annotated directly on transformation diagrams, and noted in the pedigree for each steel grade in archiving numerical time-temperature-strain data. The use of the Celsius scale for defining transformation temperatures is the accepted method internationally. Thus the use of the Celsius temperature scale should be employed. A single time unit of seconds should be employed for both numerical time-temperature-strain data and for the construction of transformation diagrams. The time scale on transformation diagrams should be logarithmic. For the purpose of continuous cooling transformation diagrams, time-zero should be designated as the time from reaching Ac3 during cooling. The thermal profiles employed in continuous cooling transformation studies should be plotted on continuous cooling transformation diagrams. These profiles must duplicate those actually achieved during testing. If cooling rates are reported, the temperature at which they were measured, or the range over which they were measured, must be reported. For isothermal studies the cooling profiles and subsequent isothermal holds do not need to be included on isothermal diagrams. For numerical temperature-time-strain data, the quench and hold profiles for isothermal transformation or the cooling profiles for continuous cooling transformation are an integral part of the row/column data format. Heating rates and austenitizing temperatures and times should be noted on diagrams and included in the pedigree for the archiving of numerical data. A hardness values should be included as an annotation on each cooling curve for continuous cooling transformation diagrams, and as an additional note with each set of time-temperature-strain data representing a given cooling curve and reported in a database format. This approach could be used optionally for isothermal measurements where appropriate. The hardness measurements should be reported in the units in which they were measured, usually micro-hardness values, and should be carried out as per ASTM E-384. Any conversion to other values, e.g. Rockwell hardness values, should follow accepted ASTM conversion procedures described in ASTM E-140and be noted as such. Metallography should be used to document the microstructure obtained after 100% transformation for every thermal profile used either for isothermal transformation or continuous cooling. Microstructures obtained from interrupted

Page 16 of 26
QMST Proprietary
quenching experiments designed to verify progress of transformation could be included on an optional basis where needed. While most microstructures would be determined using optical techniques, the use of transmission or scanning electron microscopy should be used to provide important microstructure details that cannot be shown using optical methods. Prior austenite grain size should be determined wherever possible and reported. References 1. Harrison, P L, Watson, M N and Farrar, R A, How Niobium Influences SA Mild Steel Weld Metals -- Continuous Cooling Transformation (CCT) Diagrams, Welding and Metal Fabrication, vol 49, no. 3, Apr 1981, p 161-169. 2. Pan, Y –T, Lee, J –L, and Hsieh, K –C, Assessment of Ideal TTT Diagram in Alloyed Steels , China Steel Technical Report 12, Dec. 1998, p 10-19. 3. Lee, J -L and Bhadeshia, H K D H Assessment of TTT Diagrams: a New Methodology, China Steel Tech. Rep. 7, 30 Dec. 1993, p 16-25 4. Lee, J -L and Bhadeshia, H K D H, Assessment of TTT Diagrams: Examination of Existing Models, China Steel Technical Report (6), 30 Dec. 1992, p 19-29. 5. Cota, A B, Modenesi, P J, Barbosa, R and Santos, D B Determination of CCT Diagrams by Thermal Analysis of an HSLA Bainitic Steel Submitted to Thermomechanical Treatment, Scripta Materialia 40, (2), 18 Dec., 1998, p165-169. 6. Lee, J L, Pan, Y T, and Hsieh, K C, Assessment of Ideal TTT Diagram in C-Mn Steels, Materials Transactions, JIM 39, (1), Jan. 1998, p 196-202. 7. Manohar, PA and Chandra, T, Continuous Cooling Transformation Behaviour of High Strength Microalloyed Steels for Linepipe Applications, ISIJ INTERNATIONAL, 1998, V38, N7, P766-774. 8. MANOHAR, PA, CHANDRA, T and KILLMORE, CR, Continuous Cooling Transformation Behavior OF Microalloy Steels Containing Ti, Nb, Mn and Mo, ISIJ INTERNATIONAL, 1996, V36, N12, P1486-1493. 9. Thelning, Karl Erik, CCT Diagrams With Natural Cooling, Scandinavian Journal of Metallurgy, v 7, n 6, 1978, p 252-263. 10. Straatmann, J A, Doane, D V and Park, Y J, Using CCT Diagrams in the Development of Low-Carbon High Strength Steels, Processing, Microstructure and Properties of HSLA Steels, TMS/AIME, Pittsburgh, Pennsylvania, USA, 3 -5 Nov. 1987, p 287-303.

Page 17 of 26
QMST Proprietary
11. Eldis, GT, A Critical Review of Data Sources for Isothermal Transformation and Continuous Cooling Transformation Diagrams, Hardenability Concepts With Applications to Steel, Metallurgical Society AIME, Chicago, Ill., 24-26 Oct. 1977, p 126-157. 12. Shukla, K P and Chandra, S, The Myth of CCT Diagrams, Tata Search 3, 1996, P 82-86. 13. Zurlippe, Clements F AND Grozier, JOHN D, Continuous Cooling Transformation Diagrams For AISI 1038, METAL PROGR DEC. 1967, 92, 6, p 86-87. 14. Pope, Lawrence S and Grozier, John D, Continuous Cooling Transformation Diagram for a High-Strength Steel, Met. Prog , Nov. 1971, 100, 5, p 75. 15. Zur Lippe, Clements F, Grozier, John D, Continuous Cooling Transformation Diagrams For AISI 1010, 1010 Mo, and 1010 Mo-B, Metal Prog., FEB. 1969, 95, 2, p 88-89. 16. Zhang, Z and Farrar, R A, An Atlas of Continuous Cooling Transformation (CCT) Diagrams Applicable to Low Carbon Low Alloy Weld Metals, Institute of Materials, 1 Carlton House Terrace, London, SW1Y 5DB, UK, 1995. 17. Atlas of Isothermal Transformation Diagrams, A. Gray, Ed., American Society for Metals, 1977. 18. Supplement to the Atlas of Isothermal Transformation Diagrams, United States Steel Company, Pittsburgh, Pennsylvania, 1953. 19. Isothermal Transformation Diagrams, United States Steel Corp., 1963. 20. W. Cias, Phase Transformation Kinetics and Hardenability of Medium-Carbon Alloy Steels , Climax Molybdenum Company. 21. W. Cias, Austenite Transformation Kinetics of Ferrous Alloys Climax Molybdenum Company. 22. Delbart, C., Constant, A., and Clerc, A., Courbes de Transformation des Aciers de Fabrication Francaise, L’Institut de Recherches de la Siderurgie, Saint Germain-en-Laye, 1956.

Page 18 of 26
QMST Proprietary
23. Continuous Cooling Transformation Diagram from Modified End Quench Method, Donald Evans Angerson, MS Thesis, Oregon State University, 1949. 24. Wever, F., Rose, A. Peter, W., Strassburg, W., and Rademacher, L, Atlas zur Warmebehandlung der Stahle, Verlag Stahleisen mb.H., Dusseldorf, 1961. 25. M. Atkins and K.W. Andrews, Continuous Cooling Transformation Diagrams I- cooling Curve Analysis for Transformation Diagrams and Heat Treatment, British Steel Corporation Report, 1971. 26. Cavanagh, A K and Borland, D W, Continuous Cooling Transformation Diagrams and Their Use in Metallurgy, Metals and Technology Conference A, Australian Institute of Metals, Melbourne, 1976, p 5. 27. Penalba, F, Garcia de Andres, C, Carsi, M and Zapirain, F, Austenitic Grain Size Evolution and Continuous Cooling Transformation Diagrams in Vanadium and Titanium Microalloyed Steels, Journal of Materials Science, 31, (14), 15 July, 1996, p 3847-3852. 28. Maynier, P, Dollet, J and Bastien, P, Prediction of Microstructure Via Empirical Formulas Based on CCT Diagrams, Hardenability Concepts With Applications to Steel, Metallurgical Society AIME, Chicago, Ill., 24-26 Oct. 1977, p 163-178. 29. Cheng, Y –W, Continuous-Cooling-Transformation Diagrams of a Niobium-Treated SAE 1141 Steel, International Conference on Processing, Microstructure and Properties of Microalloyed and Other Modern High Strength Low Alloy Steels, Iron and Steel Society, Pittsburgh, Pennsylvania, USA, 3-6 June 1991, p 223-234. 30. Harrison, PL and Ferrar, RA, Application of Continuous Cooling Transformation Diagrams for Welding of Steels, Int. Mater. Rev. 34, (1), 1989, p 35-51. 31. Colijn, J, Hoogendoorn, T. M, and Onink, M, Influence of Deformation on the Austenite-Ferrite Transformation Temperature, Modeling of Steel Microstructural Evolution During Thermomechanical Treatment-Workshop, p 45-58. 32. Bhole, S D and Adil, G K, HAZ Hardness and Microstructure Predictions of Arc Welded Steels II- CCT Diagram Method, Canadian Metallurgical Quarterly 31, (2), Apr.-June, 1992, p 159-165.

Page 19 of 26
QMST Proprietary
33. Umemoto, M, Nishioka, N and Tamura, I, Prediction of Hardenability From Isothermal Transformation Diagrams, Trans. Iron Steel Inst. Jpn. 22, (8), Aug. 1982, p 629-636. 34. Bai, D Q, Yue, S, Jonas, J J and Maccagno, T M, Continuous Cooling Transformation Temperatures Determined by Compression Tests in Low Carbon Bainitic Grades, Metallurgical and Materials Transactions A 29A, (3A), Mar., 1998, p 989-1001. 35. Vermeulen, Willem, van der Zwaag, Sybrand, Morris, Peter and de Weijer, Ton, Prediction of the Continuous Cooling Transformation Diagram of Some Selected Steels Using Artificial Neural Networks, Steel Research, v 68, n 2, Feb 1997, p 72-79. 36. Okada, Akira, Kasugai, Takayoshi, Ei, Kazuo, Muramatsu, Yoshiki, Hiraoka, Kazuo, and Inagaki, Michio, CCT Diagram Data Base System by Interactive Personal Computer, Transactions of National Research Institute for Metals (Tokyo), v 29, n 1, Mar 1987, p 15-20. 37 Hogardy, HP, Calculation of the Isothermal Transformation Diagram from Dilatometric Measurements with Continuous Cooling, Metalurgia I Odlewnictwo, Tom 13, Zeszyt 4, 1987. 38. Kaspar, R, Kapellner, W and Pawelski, O, Determination of CCT Diagrams by Thermal Analysis After Simulated Hot Deformation Processes, Steel Res. 57, (11), 1986, p 557-562. 39. Schmitz, H-P, ThyssenKrupp Stahl, Standarization Efforts in Europe, Private Communication, 2001. 40. Guidelines for Preparation, Execution, and Evaluation of Dilatometric Transformation Tests on Iron Alloys, STAHL-EISEN-Prufblatter (SEP) des Verein Deutscher Eisenhuttenleute, SEP 1681, June 1998. 41. Prior, GK, The Role of Dilatometry in the Characterization of Steels, Materials Forum, vol.18, 1994, p 265-76. 42. Reed, RC, Akbay, T, Shen, Z, Robinson, JM and Root, JH, Determination of Reaustenitisation Kinetics in a Fe-0.4C Steel Using Dilatometry and Neutron Diffraction, Materials Science & Engineering A (Structural Materials: Properties, Microstructure and Processing), vol A256, no.1-2, p152-165.

Page 20 of 26
QMST Proprietary
43. Fonda, RW, and Spanos, G, Microstructural Evolution in Ultra-Low-Carbon Steel Weldments - Part I: Controlled Thermal Cycling and Continuous Cooling Transformation Diagram of the Weld Metal, Metallurgical and Materials Transactions A: Physical Metallurgy and Materials Science, v 31, n 9, Sep 2000, p 2145-2153. 44. Prado, JM, Catalan, JJ and Marsal, M, Dilatometric Study of Isothermal Phase Transformation in a C-Mn Steel, Journal of Materials Science, vol 25, no 4, 1990, p 1939-46. 45. Yang, JR and Bhadeshia, HKDH, Reaustenitization Experiments on Some High-Strength Steel Weld Deposits, Materials Science and Engineering, A: Structural Materials: Properties, Microstructure and Processing (Switzerland) v 118:1/2. 46. Takahashi, M and Bhadeshia, HKDH, The Interpretation of Dilatometric Data for Transformations in Steels , Journal of Materials Science Letters, vol 8, no4, 1988, p477-478. 47. Bhadeshia, HKDH, The Bainite Transformation: Unresolved Issues, Materials Science & Engineering A (Structural Materials: Properties, Microstructure and Processing), vol.A273-275, p 58-66. 48. Kop, TA, vanLeeuwen Y, Sietsma J and vanderZwaag, S, Modeling the Austenite to Ferrite Phase Transformation in Low Carbon Steels in Terms of the Interface Mobility, ISIJ International, V40, N7, 2000, p 713-718. 49. McCulloch, C, Kumar, A, Hawbolt, EB, and Samarasekera, IV, Development of a Model to Describe the Cooling and Transformation Behaviour of a Medium Carbon Steel on a Run-Out Table of a Hot Strip Mill, Steel Product--Process Integration, Canadian Institute of Mining and Metallurgy, Halifax, Nova Scotia, Canada, 20-24 Aug., 1989. 50. Gabor Buza, Hans Paul Hougardy, and Marton Gergely, Calculation of the Isothermal Transformation Diagram from measurements with Continuous Cooling, Steel Research 57, No. 12, 1986, p. 650. 51. Bhadeshia, H K D H, David, SA, Vitek, JM and Reed, RW, Stress Induced Transformation to Bainite in Fe-Cr-Mo-C Pressure Vessel Steel, Materials Science and Technology, v 7, n 8, Aug 1991, p 686-698. 52. Crafts Walter and Lamont, John L., Hardenability and Steel Selection, Pitman Publishing, New York, 1949. 53. Siebert, CA, Doane, DV and Breen, DH, The Hardenability of Steels, American Society for Metals, 1977.

Page 21 of 26
QMST Proprietary
54. Bain, EC and Paxton, HW, Alloying Elements in Steel, American Society for Metals, 1966. 55. Atkins, M, Atlas of Continuous Cooling Transformation Diagrams for Engineering Steels, British Steel Corporation, 1977, American Society for Metals (Revised U.S. Edition), 1980. 56. Bramfitt, BL, and Speer, JG, Metall. Trans. ASM, 21A, (1990), p 817. 57. Bardes, BP (ed.), Definitions of Metallurgical Terms, American Society for Metals, 1977.

Page 22 of 26
QMST Proprietary
TABLE 1

Page 23 of 26
QMST Proprietary
TABLE 2

Page 24 of 26
QMST Proprietary
Table 3 Row/Column Format for Transformation Data
Time Temp Strain Stress %A %F %P %B %M 1 800 20 200 100 0 0 0 0 2 700 30 300 95 5 0 0 0 3 600 40 400 90 10 0 0 0 4 500 50 500 70 10 20 0 0 5 400 60 600 30 10 50 10 0 6 300 70 700 0 10 50 40 0
QMST Proprietary

Page 25 of 26
QMST Proprietary
FIGURE 1
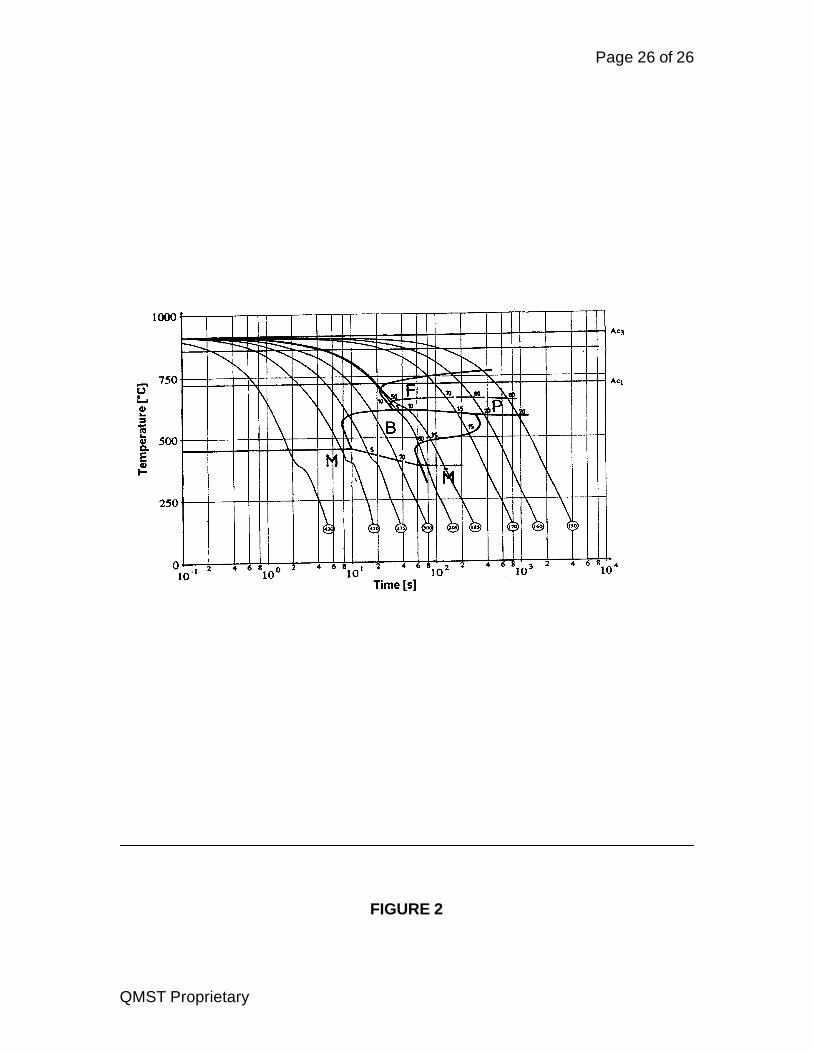
Page 26 of 26
QMST Proprietary
FIGURE 2

ASTM Specification A 1033-04 [Draft 3/17/2004] Page 1 of 30
MEMO Date: March 17, 2004 To: Ms. Erin McElrone, Editor, ASTM International Cc: Members of QMST Consortium James Klich, Chair, ASTM A01.13 Subcommittee
George Luciw, ASTM A01 Staff Administrator From: Manish Mehta, Ph.D., Technical Contact Subject: Editorially Revised Recommended Practice A 1033-04
We thank you for your recent notification dated 3/4/2004 upon the completion and approval by the ASTM Committee A01 of Standard A 1033-04, "Recommended Practice for the Quantitative Measurement and Reporting of Hypoeutectoid Carbon and Low-Alloy Steel Phase Transformations" (Item 86 - Ballot A010104). Please note that the correct term (highlighted above) to use in the title is “Recommended”, NOT “Standard”. This issue was addressed in the A01.13 sub-Committee. We have also addressed your query on Referenced Documents. We have made these and a few other editorial changes as indicated by comments received, and feel confident that this Editorially Revised Document is ready for publication by ASTM. Should any other questions arise, please feel free to contact me at (734) 995-4938 or [email protected].

ASTM Specification A 1033-04 [Draft 3/17/2004] Page 2 of 30
Recommended Practice for the Quantitative Measurement and Reporting of Hypoeutectoid Carbon and Low-Alloy Steel Phase
Transformations
Designation and Year of Issue: A 1033-04 1. Scope 1.1 This recommended practice covers the determination of hypoeutectoid steel phase transformation behavior by using high-speed dilatometry techniques for measuring linear dimensional change as a function of time and temperature, and reporting the results as linear strain in either a numerical or graphical format. 1.2 The recommended practice is applicable to high-speed dilatometry equipment capable of programmable thermal profiles and with digital data storage and output capability. 1.3 This recommended practice is applicable to the determination of steel phase transformation behavior under both isothermal and continuous cooling conditions. 1.4 This recommended practice includes requirements for obtaining metallographic information to be used as a supplement to the dilatometry measurements. 1.5 This recommended practice does not purport to address all of the safety concerns, if any, associated with its use. It is the responsibility of the user of this standard to establish appropriate safety and health practices and determine the applicability of regulatory limitations prior to its use. 2. Referenced Documents 2.1 ASTM Standards: ASTM E 3 Practice for Preparation of Metallographic Specimens ASTM E 407 Practice for Microetching Metals and Alloys ASTM E 112 Test Methods for Determining Average Grain Size 3. Ordering Information 3.1 When this recommended practice is to be applied to an inquiry, contract, or order, the purchaser shall so state and should furnish the following information: 3.1.1 The steel grades to be evaluated 3.1.2 The test apparatus to be used 3.1.3 The specimen configuration and dimensions to be used
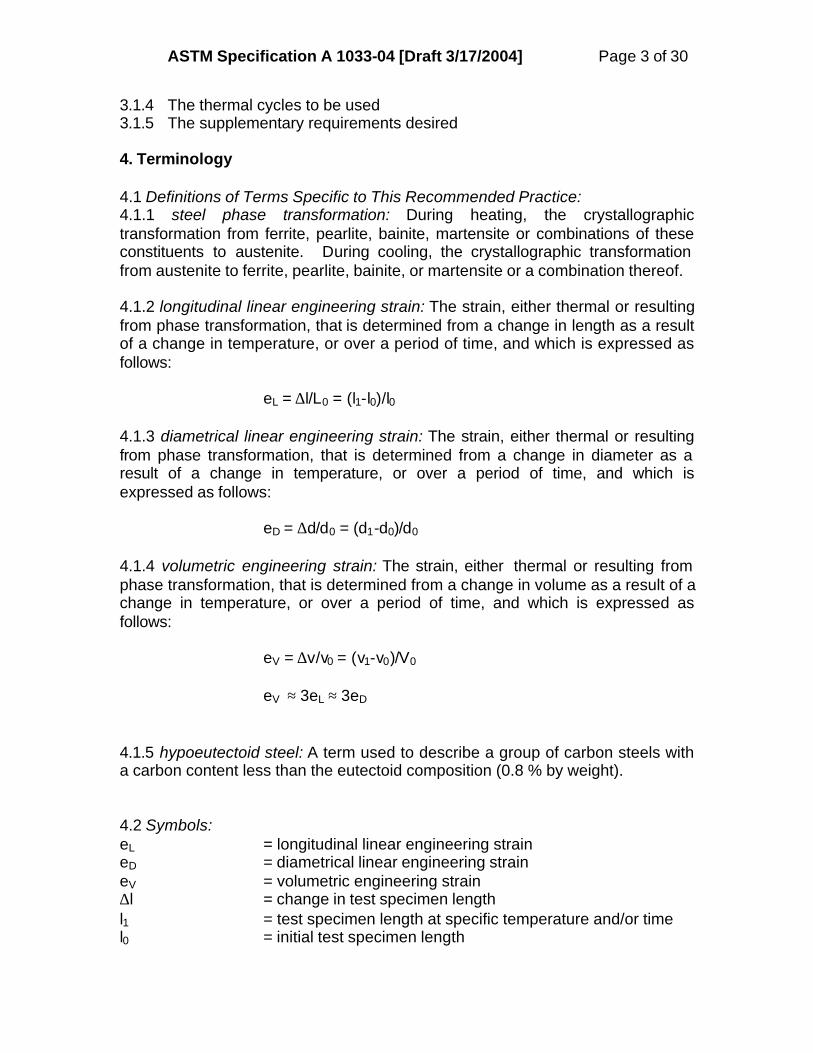
ASTM Specification A 1033-04 [Draft 3/17/2004] Page 3 of 30
3.1.4 The thermal cycles to be used 3.1.5 The supplementary requirements desired 4. Terminology 4.1 Definitions of Terms Specific to This Recommended Practice: 4.1.1 steel phase transformation: During heating, the crystallographic transformation from ferrite, pearlite, bainite, martensite or combinations of these constituents to austenite. During cooling, the crystallographic transformation from austenite to ferrite, pearlite, bainite, or martensite or a combination thereof. 4.1.2 longitudinal linear engineering strain: The strain, either thermal or resulting from phase transformation, that is determined from a change in length as a result of a change in temperature, or over a period of time, and which is expressed as follows: eL = ∆l/L0 = (l1-l0)/l0 4.1.3 diametrical linear engineering strain: The strain, either thermal or resulting from phase transformation, that is determined from a change in diameter as a result of a change in temperature, or over a period of time, and which is expressed as follows: eD = ∆d/d0 = (d1-d0)/d0 4.1.4 volumetric engineering strain: The strain, either thermal or resulting from phase transformation, that is determined from a change in volume as a result of a change in temperature, or over a period of time, and which is expressed as follows: eV = ∆v/v0 = (v1-v0)/V0 eV ≈ 3eL ≈ 3eD 4.1.5 hypoeutectoid steel: A term used to describe a group of carbon steels with a carbon content less than the eutectoid composition (0.8 % by weight). 4.2 Symbols: eL = longitudinal linear engineering strain eD = diametrical linear engineering strain eV = volumetric engineering strain ∆l = change in test specimen length l1 = test specimen length at specific temperature and/or time l0 = initial test specimen length
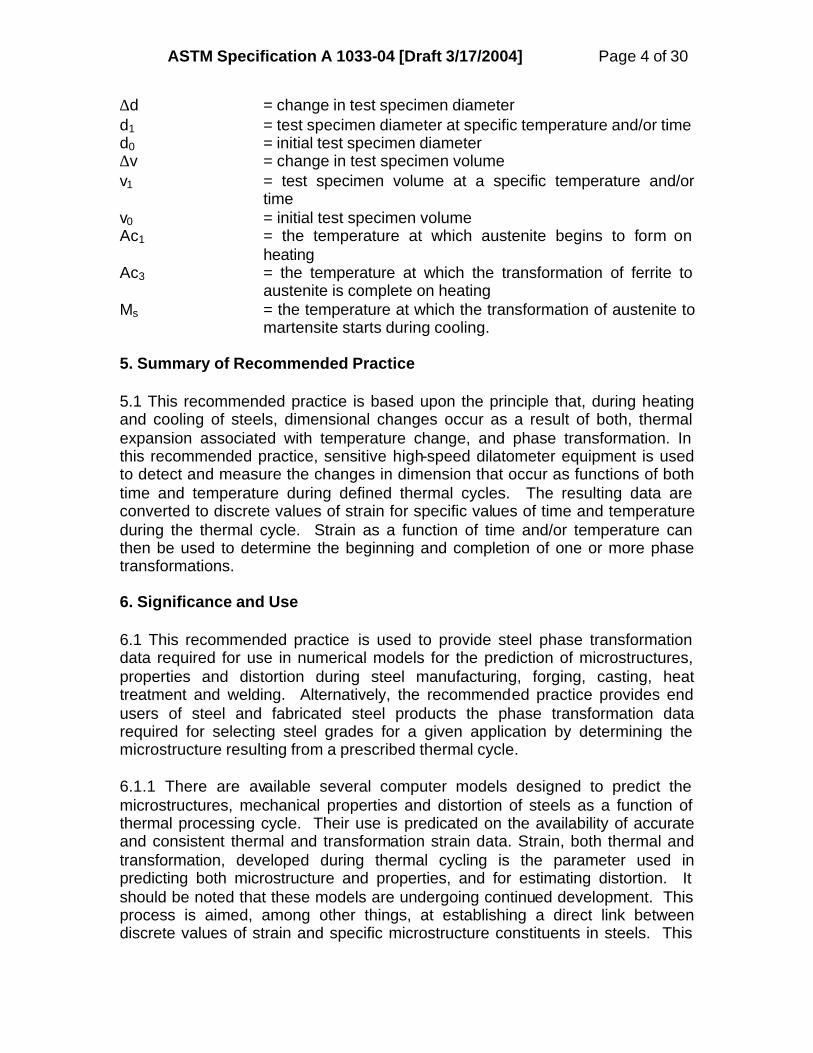
ASTM Specification A 1033-04 [Draft 3/17/2004] Page 4 of 30
∆d = change in test specimen diameter d1 = test specimen diameter at specific temperature and/or time d0 = initial test specimen diameter ∆v = change in test specimen volume v1 = test specimen volume at a specific temperature and/or
time v0 = initial test specimen volume Ac1 = the temperature at which austenite begins to form on
heating Ac3 = the temperature at which the transformation of ferrite to
austenite is complete on heating Ms = the temperature at which the transformation of austenite to
martensite starts during cooling. 5. Summary of Recommended Practice 5.1 This recommended practice is based upon the principle that, during heating and cooling of steels, dimensional changes occur as a result of both, thermal expansion associated with temperature change, and phase transformation. In this recommended practice, sensitive high-speed dilatometer equipment is used to detect and measure the changes in dimension that occur as functions of both time and temperature during defined thermal cycles. The resulting data are converted to discrete values of strain for specific values of time and temperature during the thermal cycle. Strain as a function of time and/or temperature can then be used to determine the beginning and completion of one or more phase transformations. 6. Significance and Use 6.1 This recommended practice is used to provide steel phase transformation data required for use in numerical models for the prediction of microstructures, properties and distortion during steel manufacturing, forging, casting, heat treatment and welding. Alternatively, the recommended practice provides end users of steel and fabricated steel products the phase transformation data required for selecting steel grades for a given application by determining the microstructure resulting from a prescribed thermal cycle. 6.1.1 There are available several computer models designed to predict the microstructures, mechanical properties and distortion of steels as a function of thermal processing cycle. Their use is predicated on the availability of accurate and consistent thermal and transformation strain data. Strain, both thermal and transformation, developed during thermal cycling is the parameter used in predicting both microstructure and properties, and for estimating distortion. It should be noted that these models are undergoing continued development. This process is aimed, among other things, at establishing a direct link between discrete values of strain and specific microstructure constituents in steels. This
ASTM Specification A 1033-04 [Draft 3/17/2004] Page 5 of 30
recommended practice describes a standardized method for measuring strain during a defined thermal cycle.
6.1.2 This recommended practice is suitable for providing data for computer models used in the control of steel manufacturing, forging, casting, heat-treating and welding processes. It is also useful in providing data for the prediction of microstructures and properties to assist in steel alloy selection for end-use applications. 6.1.3 This recommended practice is suitable for providing the data needed for the construction of transformation diagrams that depict the microstructures developed during the thermal processing of steels as functions of time and temperature. Such diagrams provide a qualitative assessment of the effects of changes in thermal cycle on steel microstructure. Appendix X2 describes construction of these diagrams. 6.2 It should be recognized that thermal and transformation strains, which develop in steels during thermal cycling, are sensitive to chemical composition. Thus, anisotropy in chemical composition can result in variability in strain, and can affect the results of strain determinations, especially determination of volumetric strain. Strains determined during cooling are sensitive to the grain size of austenite, which is determined by the heating cycle. The most consistent results are obtained when austenite grain size is maintained between ASTM grain sizes of 5-8. Finally, the eutectoid carbon content is defined as 0.8 % for carbon steels. Additions of alloying elements can change this value, along with Ac1 and Ac3 temperatures. Heating cycles need to be employed, as described below, to ensure complete formation of austenite preceding strain measurements during cooling. 7. Apparatus 7.1 This recommended practice is applicable to several types of commercially available high-speed dilatometer apparatus, which have certain common features. These include the capabilities for: heating and cooling a steel specimen in vacuum or other controlled atmosphere, programmable thermal cycles, inert gas or liquid injection for rapid cooling, continuous measurement of specimen dimension and temperature, and digital data storage and output. The apparatus differ in terms of method of specimen heating and test specimen design. 7.1.1 Dilatometer Apparatus Using Induction Heating- The test specimen is heated by suspending it inside an induction-heating coil between two platens as shown schematically in Figure 1. Cooling is accomplished by a combination of controlled reduction in heating current along with injection of inert gas onto the test specimen. Dimensional change is measured by a mechanical apparatus along the longitudinal axis of the test specimen, and temperature is measured by

ASTM Specification A 1033-04 [Draft 3/17/2004] Page 6 of 30
a thermocouple welded to the surface of the specimen at the center of the specimen length. For this apparatus, only Type R or S thermocouples should be used. 7.1.2 Dilatometer Apparatus Using Resistance Heating-1 The test specimen is supported between two grips as shown schematically in Figure 2, and heated by direct resistance heating. Cooling is accomplished by a combination of controlled reduction in heating current along with injection of inert gas onto the test specimen or internal liquid quenching. Dimensional change is measured along a diameter at the center of the test specimen length, and temperature is measured by a thermocouple welded to the surface of the specimen at the center of the specimen length. Dimensional change can be measured by either mechanical or non-contact (laser) dimension measuring apparatus. Temperature measurement can be made using Type K, Type R, or Type S thermocouples. 8. Test Specimens and Sampling of Test Specimens 8.1 Test Specimens- The test specimens to be used with each type of test equipment shall be selected from those shown in Figures 3 and 4. 8.1.1 Dilatometers Apparatus Using Induction Heating- The specimens to be used with this type of apparatus are shown in Figure 3. The solid specimens may be used for all thermal cycling conditions. The hollow specimens may also be used for all thermal cycling conditions. The hollow specimens will achieve the highest cooling rates when gas quenching is employed.
8.1.2 Dilatometer Apparatus Using Resistance Heating1- The specimens for use with this type of apparatus are shown in Figure 4. The specimen with the reduced center section (Figure 4a) allows for internal cooling of the specimen ends by either liquid or gas. The solid specimen shown in Figure 4b may be used for all thermal cycling conditions. The hollow specimen shown in Figure 4b may also be used for all thermal cycling conditions. The hollow specimens will achieve the highest cooling rates when quenching is employed. 8.2 Sampling- Test specimens may be obtained from any steel product form, including steel bar, plate and sheet and strip products. Care should be exercised to avoid the effects of metallurgical variables, such as chemical segregation, in determining where test specimens are obtained from a product form. Procedures have been designed that offer the advantage of equivalency of strain determination using specimens from both types of apparatus described in 7.1.1 and 7.1.2. For equivalency of strain, the orientation of the longitudinal axis of test
1 The sole source of supply of this apparatus known to the committee at this time is Dynamic Systems Incorporated, Postenkill, NY. If you are aware of alternative suppliers, please provide this information to ASTM International Headquarters. Your comments will receive careful consideration at a meeting of the responsible technical committee, which you may attend.
ASTM Specification A 1033-04 [Draft 3/17/2004] Page 7 of 30
specimens for induction heating apparatus should be at 90 degrees to the longitudinal axis of specimens for resistance heating. 8.2.1 Example Sampling for Steel Bar Product Forms- Where material thickness permits, a selected test specimen should be machined from the mid-radius position. Where material thickness is insufficient to permit machining a selected test specimen from the mid-radius position, but sufficient to permit machining the test specimen from the mid-diameter position, the test specimen may be obtained from the mid-diameter position. In all cases, material thickness must be sufficient to permit machining a fully dimensioned test specimen. 8.2.1.1 Dilatometer Apparatus Using Induction Heating- The test specimens are to be machined with the longitudinal axis of the test specimen perpendicular to the rolling direction of the bar. Figure 5 shows example orientations. 8.2.1.2 Dilatometer Apparatus Using Resistance Heating- The test specimens are to be machined with the longitudinal axis of the test specimen parallel to the rolling direction of the bar. Figure 5 shows example orientations. 9. Calibration 9.1 Apparatus and Components- Individually calibrate the temperature, time (sampling rate) and length change signals according to appropriate manufacturer’s recommendations. 9.2 Use of Standard Reference Material- To ensure accurate test results, a calibration procedure must be followed which involves using the apparatus to measure strain as a function of temperature for a standard reference material. A test specimen should be prepared from a standard reference material for which thermal expansion data has been documented. The test specimen should be heated to 1000°C, +/-5°C, at a nominal rate of 1°C/s, held at temperature for 60 seconds and then cooled at a nominal rate of 1°C/s to room temperature. This is to be followed by a second thermal cycle whereby the test specimen is heated to 1000°C, +/-5°C, at a nominal rate of 10°C/s and then cooled at a nominal rate of 10°C/s to room temperature. The appropriate specimen dimension is to be continuously measured during each thermal cycle. 9.3 Standard Reference Material- The standard reference material recommended for calibration is high purity nickel (99.995 %). 9.4 Calibration Curves- Curves of strain versus temperature are to be prepared from the dimension measurements for both thermal cycles. Such curves must compare favorably with an accepted strain-temperature curve for the selected reference material. A recommended strain-temperature curve for high purity nickel is shown in Figure 6. The band describes an error band of +/- 3 % strain

ASTM Specification A 1033-04 [Draft 3/17/2004] Page 8 of 30
calculated at 800°C. The curves determined by the user of this recommended practice must fall within this band. 10. Procedure 10.1 Test Environment- All thermal cycles employed shall be carried out under a vacuum of 1 X 10⁻⁵ torr maximum. 10.2 Test Specimen Preparation- Test specimens are to be machined from steel product stock to the dimensions and tolerances shown in Figures 3 and 4. Test specimens must be properly prepared and thermocouples must be properly attached to the specimens to ensure reliable and repeatable results. Care must also be taken to properly install specimens in the dilatometer apparatus. Procedures for specimen preparation and installation are described below. 10.2.1 Dilatometer Apparatus Using Induction Heating- The test specimen must be degreased using a solvent such as acetone or methyl alcohol. To achieve a proper connection of the thermocouple to the test specimen, the surface of the test specimen, at the point of thermocouple attachment, must be lightly sanded using a 600 grit paper to remove any surface oxide. Significant removal of metal must be avoided. The length and diameter of the test specimen must then be measured with a micrometer. The diameter must be measured at a point away from the sanded region to avoid any error in measuring actual diameter. These measurements will aid in verifying dimensional changes that occur during thermal cycling. The thermocouple must then be welded to the surface of the test specimen. Sheathed thermocouple wires with a nominal diameter of 0.13 mm must be used. The thermocouple wires must be individually welded to the specimen surface at the point of attachment, and separated from each other by two wire diameters. The welding procedure must result in a secure attachment of each wire, but must avoid excessive melting of either wire. This will weaken the interface between un-welded and welded sections of each wire, and could also cause metal flow between the wires, which will result in an erroneous voltage output from the thermocouple. The specimen must be then placed between the holding platens in the dilatometer apparatus giving attention to achieving the best possible alignment. For maximum accuracy, the length change measuring device, e.g. the linear variable differential transformer (LVDT), must be adjusted so that it will not pass through its natural zero point during thermal cycling. Once the specimen is in place, the insulating sheaths on the thermocouple wires must be moved along the thermocouple wires until they contact the specimen surface. This will prevent undesirable heat loss, and will avoid contact between the two thermocouple wires. Once the specimen has been subjected to thermal cycling as described below, and has been removed from the apparatus, the thermocouple sheaths may be moved away from the test specimen surface, and the thermocouple leads cut away. The specimen diameter and length must then be re-measured as described above.

ASTM Specification A 1033-04 [Draft 3/17/2004] Page 9 of 30
10.2.2 Dilatometer Apparatus Using Resistance Heating- The test specimen must be degreased using a solvent such as acetone or methyl alcohol. To achieve a proper connection of the thermocouple to the test specimen, the surface of the test specimen, at the point of thermocouple attachment, must be lightly sanded using a 600 grit paper to remove any surface oxide. Significant removal of metal is to be avoided. The diameter of the test specimen must then be measured with a micrometer. The diameter must be measured at a point away from the sanded region to avoid any error in measuring actual diameter. These measurements will aid in verifying dimensional changes that occur during thermal cycling. The thermocouple must then be welded to the surface of the test specimen. Thermocouple wires with a nominal diameter of 0.2 mm must be used. The thermocouple wires must be individually welded to the specimen surface at the mid-span of the specimen and perpendicular to the longitudinal axis of the specimen. The wires must be separated from each other by five wire diameters. A ceramic tube is used to cover each wire at the junction to minimize heat loss to the environment. The welding procedure must result in a secure attachment of each wire, but must avoid excessive melting of either wire. This will weaken the interface between un-welded and welded sections of each wire, and could also cause metal flow between the wires, which will result in an erroneous voltage output from the thermocouple. The specimen must then be inserted into the jaws or grips of the apparatus, with the thermocouple located at the mid-span, and aligned such that the thermocouple will not interfere with the dimension measuring apparatus. The specimen must then be tightened in the jaws or grips while maintaining alignment of the thermocouple and positioning of the specimen. The jaws or grips must be tightened evenly to avoid mechanical stresses on the test specimen. The jaws or grips must allow for free expansion and contraction of the test specimen during heating and cooling. Once the specimen has been subjected to thermal cycling as described below, and has been removed from the apparatus, the thermocouple leads may be cut away. The specimen diameter must then be re-measured as described above. 10.3 Test Specimen Stabilization- Remove residual stresses and stabilize the position of the test specimen within the apparatus. Carry out a preliminary thermal treatment of each test specimen prior to measuring dimensional change during thermal cycling. This treatment consists of heating the test specimen to 650°C, +/- 5°C, at a nominal rate of 10°C/s, holding the test specimen at 650°C for 10 minutes and then cooling to room temperature at a cooling rate not exceeding 20°C/s. The test specimen must not be removed from the apparatus prior to conducting dimensional measurements. 10.4 Determination of Critical Temperatures- The critical temperatures, Ac1 and Ac3, shall be determined from a test specimen separate from those used for other transformation measurements. The thermal cycle to be used is to heat the test specimen to 700°C, +/- 5°C, at a nominal rate of 10°C/s. Heating must then be continued at a nominal rate of 28° Celsius per hour while strain is continuously measured until the Ac1 and Ac3 temperatures are identified. Strain increases

ASTM Specification A 1033-04 [Draft 3/17/2004] Page 10 of 30
with temperature until Ac1 is reached. Ac1 is the temperature at which austenite begins to form on heating, and strain will begin to decrease with increasing temperature. Ac3 is the temperature at which the transformation from ferrite to austenite is completed and strain will again begin to increase with increasing temperature. Both critical temperatures can be determined from changes in the slope of a strain versus temperature plot as shown in Figure 7. 10.5 Continuous Cooling Transformation Data Sets- Each continuous cooling transformation thermal cycle shall consist of heating a test specimen to an austenitizing temperature of Ac3 + 50°C, +/- 5°C at a nominal rate of 10°C/s. The test specimen shall be held at the austenitizing temperature for 5 minutes and then cooled to room temperature at nominal rates of 0.05 to 250°C/s. Data must be sampled and recorded at the rate of one dimension measurement per degree Celsius. Linear cooling rates are to be utilized to the maximum cooling rate possible. At cooling rates where linear control is not possible, the rate at 700°C is to be reported along with the cooling time between 800°C and 500°C. A separate test specimen shall be used for each thermal cycle. At least 12 specimens must be evaluated to completely characterize each steel composition over the range of cooling rates cited above. The specific cooling rates used may be selected at the discretion of the user of this recommended practice. Replicate tests may be desirable if uncertainty in one or more test results is encountered. 10.6 Isothermal Transformation Data Sets- Each isothermal transformation thermal cycle shall consist of heating a test specimen to an austenitizing temperature of Ac3 + 50°C, +/- 5°C, at a nominal rate of 10°C/s. The test specimen shall be held at the austenitizing temperature for 5 minutes and then quenched to the isothermal hold temperature. A cooling rate of at least 175°C/s shall be employed. During the quench, the temperature of the test specimen must not undershoot the isothermal hold temperature by more than 20°C, and must be stabilized at the isothermal hold temperature within 2 seconds. The temperature of the specimen must be maintained within +/- 5°C of the isothermal hold temperature during dimension measurement. The test specimen is to be held at the isothermal hold temperature, and dimension continuously measured until transformation is 100 % complete. The specimen must then be quenched to room temperature. Data must be sampled and recorded at a rate of at least 5 dimension measurements per second. Complete transformation is defined as the time at which maximum dimensional change has occurred. A separate test specimen shall be employed for each thermal cycle. At least 12 specimens must be evaluated over a temperature range between Ac1 and room temperature to completely characterize each steel composition. Specific isothermal hold temperatures may be selected at the discretion of the user of this recommended practice. Replicate tests may be desirable if uncertainty in one or more test results is encountered. The purpose of quenching from the austenitizing temperature is to avoid transformation of austenite prior to the isothermal hold temperature, and to permit measurement of the start, progress and finish of transformation at constant temperature. It should be recognized that some steel

ASTM Specification A 1033-04 [Draft 3/17/2004] Page 11 of 30
grades might exhibit very rapid transformation kinetics at certain temperatures, and partial transformation of austenite may occur during the quench. Under these circumstances uncertainty in determining the start of transformation may be encountered. 11. Calculation 11.1 The dimensional changes measured for each value of time and temperature recorded during thermal cycling are to be converted to values of average engineering strain as described below. 11.2 Dilatometer Apparatus Using Induction Heating- Linear longitudinal engineering strain is calculated by the following equation: eL = ∆l/l0 = (l1-l0)/l0 where l0 = Initial test specimen length
l1 = Length of the test specimen at corresponding values of time and temperature
11.3 Dilatometer Apparatus Using Resistance Heating- Linear diametrical engineering strain is calculated by the following equation: eD = ∆d/d0 = (d1-d0)/d0 where d0 = Initial test specimen diameter d1 = Final diameter of the test specimen at corresponding values of time and temperature 11.4 Determination of Thermal versus Transformation Strain- Thermal strain is the strain developed only as a result of temperature change. Transformation strain results from crystallographic phase changes. Each type of strain can be established as follows: 11.4.1 Isothermal Transformation Measurements- Thermal strain occurs during the quench from the austenitizing temperature to the isothermal hold temperature. Thermal strain is determined from the change in test specimen length or diameter, that occurs between the austenitizing temperature and the isothermal hold temperature. At the isothermal hold temperature, the transformation strain is determined from the change in test specimen length or diameter between the time at which transformation begins and the time at which transformation ends. 11.4.2 Continuous Cooling Transformation Measurements- Thermal strain occurs during the cooling from the austenitizing temperature to room temperature. The thermal strain between any two temperatures is determined from the change in

ASTM Specification A 1033-04 [Draft 3/17/2004] Page 12 of 30
test specimen length or diameter between the two temperatures. The transformation strain occurs over the temperature range during which transformation takes place. The transformation strain is determined from the change in test specimen length or diameter between the temperature at which transformation begins and the temperature at which transformation ends. 11.5 Volumetric Strain- Under certain circumstances it may be desirable to estimate volumetric strain from linear strain. Volumetric strain may be estimated as follows:
eV = ∆v/v0 = (v1-v0)/v0 eV ≈ 3eL ≈ 3eD 12. Report 12.1 The report for each thermal cycle shall include the following information (An appendix is attached to this practice which provides a suggested format for reporting the information): 12.1.1 Identification of the steel grade. 12.1.2 The chemical composition of the steel. 12.1.3 Additional information regarding the condition of the steel at the time of testing if applicable. Such information should include prior austenite grain size, initial microstructure, and processing information. 12.1.4 Type of thermal cycle used in measuring transformations – e.g., continuous cooling or isothermal. 12.1.5 Brief description of the apparatus used in the test. 12.1.6 Description of the test specimen used in the test and orientation relative to the steel product form. 12.1.7 Numerical time-temperature-strain data. A row and column format is suggested to permit ease of entry into predictive computer models and to permit construction of transformation diagrams. An example format is included with this specification as an appendix. The format used however may be left to agreement between the person or organization conducting the test and the person or organization which contracts for the test. 12.1.8 Photomicrographs obtained from metallographic examination. 13. Reproducibility of Results

ASTM Specification A 1033-04 [Draft 3/17/2004] Page 13 of 30
13.1 Reproducibility of results obtained from the use of this recommended practice will depend upon both, test material variations and variations in equipment capability. This recommended practice relates to the measurement of phase transformations in steel, which is not an isotropic material. It is subject to variations in chemical composition within a given section of a product form, and these variations will affect measured results. The types of high-speed dilatometer apparatus used in the testing described in this recommended practice have evolved over several years. As a result, reproducibility of results will depend upon the response of temperature, time (sampling rate) and length change signals of given apparatus to changes in specimen test temperature and dimension during thermal cycling. 14. Keywords 14.1 steel, phase transformations, dilatometry, strain
SUPPLEMENTARY REQUIREMENTS
S1 Metallography S1.1 This requirement only applies when specified by the person or organization contracting for this recommended practice. S1.2 Test specimens- The microstructure of test specimens shall be documented. Practices E 3 and E 407 shall be followed. The details of the metallographic examination, including the number, type (longitudinal, transverse, etc.) and locations (mid-thickness, quarter-thickness, etc.) of the specimens shall be as agreed between the purchaser and the testing organization. Note: In addition to documenting all of the products of transformation of austenite and the amount of retained austenite in the microstructure, it may be desirable to determine the prior austenite grain size of one or more specimens. Procedures for this determination are described in E 112 which is listed in Section 2.1 as well as in other documents referenced at the end of this recommended practice. It may also be desirable to check the specimens for decarburization. If decarburization is detected in a specimen, a new specimen should be tested. It may be desirable to document the initial microstructure prior to performing transformation measurement procedures using a separate specimen that has not been subjected to transformation measurement procedures.
APPENDIX (Non-mandatory Information)
X1. Suggested Format for Reporting Data
ASTM Specification A 1033-04 [Draft 3/17/2004] Page 14 of 30
X1.1 The following is a suggested format for reporting transformation strain data as a function of time and temperature. It may be used as a guide or a template. 1] FILE NAMING. Tab delimited text with file names having the following structure: <steel grade>_< prior austenite grain size>_<LABORATORY NAME>_<cooling rate in °Celsius/sec or isothermal hold temperature in °Celsius>_<completion date in MMDDYY>_<run number>.DAT An example file name is as follows:
1050_9_ABC_600_091102_3.DAT In this example, Laboratory ABC performed an isothermal test on September 11, 2002, and the file is for the third 600°C run performed on that day. The material has a prior austenite grain size of ASTM 9. Caps are used for the laboratory name and the file extension, DAT. 2] PEDIGREE. The pedigree must be in a fixed format with the same number of lines in each file. The format below is to have two entries on every line. The first entry is the data specific to the test, while the second entry explains what the first entry is. The second entry should be typed in exactly the same way in the data files. There should be no blanks. Put NA for “Not Applicable” if there is no information to provide. Rows 1 - 2: File Name And Material Provider
row 1: repeat of file name FILE NAME row 2: material supplier SOURCE
Rows 3 - 18: Material Chemical Composition In Weight Percent. Each line should have two entries separated by a space. The first entry should be the number value of the weight percent of the element. The second entry should be the letter designation (e.g. C, Mn) for the element. If a given element is not present, type in a “0.0” for this element. There should be no blanks.
row 3: number C row 4: number Mn row 5: number Si row 6: number Ni row 7: number Cr row 8: number Mo row 9: number S row 10: number Co row 11: number Cu row 12: number P

ASTM Specification A 1033-04 [Draft 3/17/2004] Page 15 of 30
row 13: number V row 14: number Ti row 15: number Nb row 16: number B row 17: number N row 18: number Al row 19: number O
Rows 20 - 21: Additional Material Information.
row 20: number STEEL HEAT IDENTIFICATION NUMBER row 21: number ASTM PRIOR AUSTENITE GRAIN SIZE NUMBER
Use “NA” for “Not Applicable” if there is no entry.
Rows 22 - 26: Specimen Preparation Information. row 22: remarks on material PREPARATION REMARKS row 23: transverse or longitudinal specimen geometry TRANS or LONG row 24: machining location QUARTER/MID THICKNESS/ RADIUS row 25: machining source MACHINING SOURCE row 26: specimen type SOLID/HOLLOW
Use “NA” for “Not Applicable” if there is no entry.
Rows 27 - 29: Apparatus Information. row 27: apparatus used for test INDUCTION/RESISTANCE row 28: test laboratory LABORATORY NAME row 29: remarks on platform REMARKS
Use “NA” for “Not Applicable” if there is no entry.
Rows 30 - 33: Post-Test and Author Information. row 30: metallography YES/NO row 31: metallography archive identification IDENTIFICATION row 32: remarks on test performed TEST REMARKS row 33: author of this file AUTHOR
Use “NA” for “Not Applicable” if there is no entry. 3] DATA STRUCTURE. First line after the pedigree should be a single header that describes each of the columns. The labels of each column, in order, should read exactly as follows (do not use quotation marks or commas): TIME (SEC) TEMPERATURE (°Celsius) LINEAR STRAIN STRESS (MPA) There should be 4 columns in total. Data should be entered in each column. Dimension measurements should be converted to linear engineering strain. To do this, simply divide the dilatometer measurement by the original room temperature specimen length or diameter as required.
ASTM Specification A 1033-04 [Draft 3/17/2004] Page 16 of 30
X2. Graphical Estimates of Transformation Progress and Construction of Transformation Diagrams X2.1 Estimates of the progress of transformation of austenite can be made through the use of strain-temperature plots for continuous cooling transformation conditions, and through the use of strain-time plots for isothermal transformation conditions. It should be emphasized that graphical estimates of transformation progress are of a qualitative nature only. The discrete temperature-time-strain data are needed for computer modeling. These estimates can be used however to construct transformation diagrams that exhibit the microstructures that can be expected from various thermal cycling conditions. X2.2 Progress of Transformation Under Continuous Cooling Conditions- The progress of austenite transformation under continuous cooling conditions can be estimated from plots of strain versus temperature. Each continuous cooling test carried out as described in Section 10.5 results in discrete corresponding values of time, temperature and strain. Strain is plotted versus temperature for each continuous cooling cycle using the strain and temperature data as described in Section 12.1.7. An example of the resulting graph is shown in Figure 8. As can be seen in Figure 8 strain increases with temperature during heating until the Ac1 temperature is reached. Strain then decreases during austenite formation until the Ac3 temperature is reached, whereupon strain then increases with temperature. During cooling of the austenite, strain decreases approximately linearly until transformation starts. Once begun, the start and finish of the formation of various microstructure constituents can be estimated from inflections in the slope of the cooling portion of the strain-temperature plot. These are shown as points A, B, and C in Figure 8. In this example, the continuous transformation of austenite to several different constituents is shown, and the constituents are annotated along the top of the figure. The progress of austenite transformation may be estimated in each strain-temperature plot using a method involving the construction of constant percent transformation lines such as the 10 %, 50 % and 75 % transformation lines shown in Figure 8. The method makes the assumption that the progress of transformation is linearly dependent on strain. The austenite cooling curve is first extrapolated to low temperatures, as shown by the dashed line extending from Point A in Figure 8. At each of several temperatures, the difference in strain between the heating curve and the extrapolated austenite cooling curve is calculated. This difference is multiplied by a selected percentage and added to the value of strain shown by the extrapolated austenite cooling curve. This gives a value of strain at each temperature representing the selected percent of austenite transformed. This results in a locus of points representing a constant percent of austenite transformed. This series of calculations can be repeated for any desired percentage of transformation. The progress of transformation can be estimated by tracing the cooling curve across the constant transformation lines. It should be noted that the lines are an estimate of the percent austenite transformed, and do not necessarily indicate the final volume fractions of microstructure

ASTM Specification A 1033-04 [Draft 3/17/2004] Page 17 of 30
constituents. Metallographic analysis is recommended to determine the relative amounts of various microstructure constituents once transformation is complete. This entire process is repeated for each continuous cooling cycle used to characterize a given steel grade in order to evaluate transformation behavior as a function of cooling rate. It should be emphasized that the microstructure constituents formed will vary with cooling rate as well as with steel composition. In some cases only ferrite plus pearlite may form, and in other cases only martensite may form, etc. Also, for some steel grades, transformation may not be continuous, but may halt for a temperature interval. Thus the position and magnitude of the inflection points on the cooling portion of the strain-temperature curve will vary. X2.3 Construction of Continuous Cooling Transformation Diagrams- Continuous cooling transformation diagrams may be constructed from strain-temperature plots, and the associated temperature-time cooling curves. All of the cooling rates used to characterize a given steel grade are plotted as temperature versus time curves on a semi-logarithmic graph as shown in Figure 9. The cooling curves should commence at the vertical axis from the Ac3 temperature to eliminate any variability in cooling time due to differences in austenitizing temperature. From the strain-temperature curve for each cooling rate (see Section X2.1), the start and finish temperatures for the formation of each microstructure constituent are marked on the corresponding temperature-time curve. The locus of points representing the start and finish of the formation of the same microstructure constituent are joined together by a single line. The resulting diagram, shown in Figure 9 describes the range of cooling rates over which a given microstructure constituent is formed. X2.4 Progress of Transformation Under Isothermal Conditions- The progress of austenite transformation under isothermal conditions can be estimated from plots of strain versus time and temperature versus time. Each isothermal test carried out as described in Section 10.6 results in discrete corresponding values of time, temperature, and strain. Both strain and temperature are plotted versus time for each isothermal cycle using the strain, temperature, and time data as described in Section 12.1.7. An example of such a graph is shown in Figure 10. A stable value of strain and temperature is exhibited during austenitizing. Both temperature and strain rapidly decrease during the quench to the isothermal hold temperature. Both temperature and strain are stabilized at the isothermal hold temperature, and strain then increases while temperature remains constant as transformation proceeds. The start and finish of transformation can be estimated by drawing horizontal lines tangent to the point of minimum and maximum strain respectively. The example shown is for the formation of a two microstructure constituents as indicated by an initial increase in strain, a short period of stable strain and a second increase in strain. If multiple constituents are formed, additional inflections in the strain time plot will be observed between the start and finish of transformation. The progress of austenite transformation can be estimated by taking the difference between the strain at the end of transformation

ASTM Specification A 1033-04 [Draft 3/17/2004] Page 18 of 30
and the strain at the beginning of transformation, and multiplying this difference by a selected percentage. The resulting value is then added to the strain at the start of transformation. The strain value obtained represents the percent austenite transformed. Figure 10 shows the 50 % transformation of austenite as a horizontal line between the start and finish of transformation. The progress of transformation can be estimated by tracing the strain-time curve across the constant transformation lines. It should be noted that the lines are an estimate of the percent austenite transformed, and do not necessarily indicate the final volume fractions of microstructure constituents. Metallographic analysis is recommended to determine the relative amounts of various microstructure constituents once transformation is complete. This entire process is repeated for each isothermal cycle used to characterize a given steel grade in order to evaluate transformation behavior as a function of transformation temperature and time. It should be emphasized that the microstructure constituents formed will vary with steel composition. Thus the position and magnitude of the inflection points on the strain-time curve will vary. X2.5 Construction of Isothermal Transformation Diagrams-Isothermal transformation diagrams can be constructed from plots of strain versus time and temperature versus time taken from all of the isothermal cycles used to characterize a given steel grade. The start and finish times for each microstructure constituent at each isothermal temperature are plotted as points on a semi-logarithmic temperature versus time graph as shown in Figure 11. The locus of points representing the start and finish of the formation of the same microstructure constituent are joined together by a single line. The resulting diagram, shown in Figure 11 describes the range of transformation times over which a given microstructure constituent is formed at various temperatures.
REFERENCES 1. ASM Handbook, Eighth Edition, Volume 1, American Society for Metals, 1961. 2. Determination of the Ferritic or Austenitic Grain Size of Steel and Ferrous Materials, DIN Specification 50801. 3. M. Atkins, Atlas of Continuous Cooling Transformation Diagrams for Engineering Steels, American Society for Metals, 1980. 4. Delbart, C., Constant, A., and Clerc, A., Courbes de Transformation des Aciers de Fabrication Francaise, L’Institut de Recherches de la Siderurgie, Saint Germain-en-Laye, 1956. 5. Schmitz, H-P, ThyssenKrupp Stahl, Standarization Efforts in Europe, Private Communication, 2001.

ASTM Specification A 1033-04 [Draft 3/17/2004] Page 19 of 30
Figure 1. Schematic of Transformation Testing Using Induction Heating
Induction Heating Coils
Platen
Thermocouple
Test Specimen

ASTM Specification A 1033-04 [Draft 3/17/2004] Page 20 of 30
Figure 2. Schematic of Transformation Testing Using Resistance Heating
Jaw
Test Specimen
Thermocouple

ASTM Specification A 1033-04 [Draft 3/17/2004] Page 21 of 30
All machining surface finishes being 0.8 µm RMS
Figure 3. Test Specimens for Induction Heating Apparatus
D
L = 8 mm, 9 mm, or 10 mmTolerance = +/- 0.13 mm
D = 3 mm, 4 mm, or 5 mmTolerance = +/- 0.025 mm
D1 D2
D1 = 4 mm, D2 = 3 mmorD1 = 5 mm, D2 = 4 mmorD1 = 6 mm, D2 = 5 mmTolerance = +/- 0.025 mm
Solid Test Specimens
Hollow Test Specimens
L = 8 mm, 9 mm, or 10 mmTolerance = +/- 0.13 mm

ASTM Specification A 1033-04 [Draft 3/17/2004] Page 22 of 30
All machining surface finishes being 0.8 µm RMS
Test Specimen Dimension Guide Table
Specimen Length, L1 +/-0.10 (mm)
Specimen Half Length, L2 +/-0.05 (mm)
Reduced Section Length, L3 +/-0.025 (mm)
Reduced Section Diameter, D3 +/-0.025 (mm)
OD at Grip End, D1 +/-0.025 (mm)
ID at Grip End, D2 +/-0.025 (mm)
Grip End Drill Depth, L4 +/-0.05 (mm)
90 45 6 6 10 6.3 40 84 42 6 6 10 6.3 37 84 42 5 5 10 6.3 37
Figure 4a. Test Specimens with Reduced Center Section for Resistance Heating Apparatus

ASTM Specification A 1033-04 [Draft 3/17/2004] Page 23 of 30
All machining surface finishes being 0.8 µm RMS. Figure 4b. Test Specimens for Resistance Heating Apparatus
D
L = 71 or 86mmTolerance = +/- 0.8 mm
D = 6 mm or 10 mmTolerance = +/- 0.025 mm
D1 D2
D1 = 6 mm, D2 = 4 mmorD1 = 10 mm, D2 = 8 mmTolerance = +/- 0.025 mm
Solid Test Specimens
Hollow Test Specimens
L = 71 or 86 mmTolerance = +/- 0.8 mm

ASTM Specification A 1033-04 [Draft 3/17/2004] Page 24 of 30
Figure 5. Machining Orientations for Bar Steel Product Forms
Rolling Direction
Orientation ofSpecimens forInduction Heating
Orientation ofSpecimens forResistanceHeating
Mid-Radius

ASTM Specification A 1033-04 [Draft 3/17/2004] Page 25 of 30
Figure 6. Strain Versus Temperature for High Purity Nickel
Strain = (-2 x 10-13 )T3 + 4x 10⁻⁹ )T2 + (1 x 10⁻⁵ )T - 0.0003
0
0.002
0.004
0.006
0.008
0.01
0.012
0.014
0.016
0 100 200 300 400 500 600 700 800 900 1000
Temperature, °C
Lin
ear
Str
ain

ASTM Specification A 1033-04 [Draft 3/17/2004] Page 26 of 30
Figure 7. Strain Versus Temperature Showing Determination of Ac1 and Ac3 Temperatures
0.006
0.007
0.008
0.009
0.01
0.011
0.012
710 730 750 770 790 810 830 850 870 890
Temperature, °C
Lin
ear
Str
ain
Ac3Ac1

ASTM Specification A 1033-04 [Draft 3/17/2004] Page 27 of 30
Figure 8. Strain Versus Temperature for Continuous Cooling
-0.002
0
0.002
0.004
0.006
0.008
0.01
0.012
0 100 200 300 400 500 600 700 800 900
Temperature, °C
Lin
ear
Str
ain
Ferrite+Pearlite Forms on Cooling
Austenite PresentDuringCooling
BainiteForms onCooling
MartensiteForms onCooling
A
B
C
Ac1
Ac3
Heating
Cooling
10%50%
75%

ASTM Specification A 1033-04 [Draft 3/17/2004] Page 28 of 30
Figure 9. Example Continuous Cooling Transformation Diagram

ASTM Specification A 1033-04 [Draft 3/17/2004] Page 29 of 30
Figure 10. Strain and Temperature Versus Time for Isothermal Transformation
0
100
200
300
400
500
600
700
800
900
350 370 390 410 430 450 470
Time, s
Tem
per
atu
re, °
C
-0.002
0
0.002
0.004
0.006
0.008
0.01
0.012
Lin
ear
Str
ain
Temperature
Strain
Start of Transformation
End of Transformation
50% Transformation

ASTM Specification A 1033-04 [Draft 3/17/2004] Page 30 of 30
Figure 11. Example Isothermal Transformation Diagram.