1st quarter 2018 outlook january march · score mean mid-atlantic south atlantic east north central...
TRANSCRIPT

1st Quarter 2018 Outlook January–March
Prepared For: AHRA imagePRO™ Member Panel January 2018
1
Why was MICI created? The MarkeTech Group and AHRA collaborated on the
creation of MICI based on the belief that measuring the confidence of US medical imaging administrators on a regular basis would provide a valuable index for those having an interest in this industry. The MICI panel consists of a select group of imagePRO™ panel members from around the U.S. representing different hospital sizes and geographic locations to capture a true “industry outlook”: how imaging administrators see the future of medical imaging in regard to revenues, costs, purchasing, and growth. This exciting initiative captures the “mood” of imaging administrators on a quarterly basis regarding the state of medical imaging in the U.S. It also provides a unique statistical index that is likely to attract a lot of attention from those following this industry.
2
MICI Overview
What is imagePRO™ and why is it important?
imagePRO™ was created by The MarkeTech Group to provide a professional community for imaging administrators to participate in studies aimed at advancing the development of medical imaging technology.
The imagePRO™ panel is a true community of industry professionals and is the leading opt-in panel of this industry. Members are subjected to strict enrollment requirements to represent the voice of their peers and to be part of a group of professionals whose knowledge and input is important.

3
Index Methodology
175 imaging directors/managers
of hospitals completed the 3-minute Web survey regarding their perception of medical imaging trends for the first quarter of 2018.
Scores measure the level of confidence, and range between 0 to 200. The score interpretation follows:
o Below 50 is extremely low confidence o 50 to 69 is very low confidence o 70 to 89 is low confidence o 90 to 110 reflect an ambivalent score (Neutral) o 111 to 130 is high confidence o 131 to 150 is very high confidence o Anything above 150 is extremely high confidence
Hospital bed size:
44% Under 100
37% 100-299
19% 300 or more

4
Index Methodology
Recruitment accounts for about 90% of correct hospitals and regions to reflect the U.S. hospital market.
o While relatively minor in magnitude, the weighting accounts for the final 10% to refine the estimates and ensure they represent the U.S. hospital market.
o This refinement is necessary to create an index that truly represents how radiology departments view the economic outlook for the current quarter and will ensure that subsequent MICI results are valid.
Results are reflective of national trends because of the manner in which participants were invited to participate.
o Participants were recruited by region and number of beds to reflect known AHA incidence.
o Once the final counts were confirmed there were some
statistical adjustment—weighting—to ensure the index reflects the U.S. hospital imaging market. This type of adjustment is common when estimating overall market share, trends, and attitudes.
[
]
5
Index Methodology
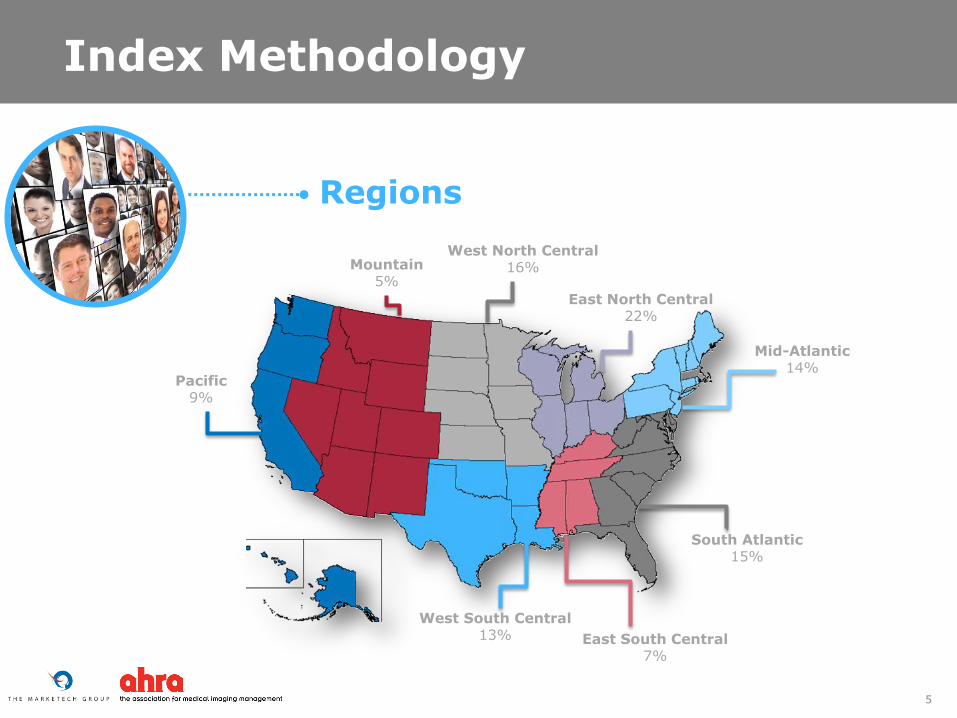
Regions
Pacific 9%
Mountain 5%
West South Central 13%
Mid-Atlantic 14%
South Atlantic 15%
West North Central 16%
East North Central 22%
East South Central 7%

6
Staff costs to remain constant, growth in volume and profit
Topic Score Mean
Interpretation
Will grow monthly in diagnostic and interventional radiology
120 High confidence
Receive adequate reimbursement from Medicare for diagnostic and interventional imaging
83 Low confidence
Internal operating and staff costs will remain constant
134 Very high
confidence
Will have access to capital for imaging equipment and IT needs
102 Neutral
Will maintain/grow as a profit center 130 High confidence
Composite score across all areas 113 Neutral
There is concern about receiving adequate reimbursement from Medicare.
$

7
Hospital bed size differences
Hospitals with 100 or more beds are more confident that growth in diagnostic / interventional radiology will occur.
Topic
Score Mean
Under 100 beds
100 to 299 beds
300 or more beds
Will grow monthly in diagnostic and interventional radiology
108 129 127
Receive adequate reimbursement from Medicare for diagnostic and interventional imaging
78 87 86
Internal operating and staff costs will remain constant 139 132 124
Will have access to capital for imaging equipment and IT needs
94 101 119
Will maintain/grow as a profit center 123 134 141
Composite score across all areas 107 115 120

8
Regional differences: While none of the differences are statistically significant…
North Central and South Central regions have very high confidence that internal operating and staff costs will remain constant.
South Atlantic region has very high confidence in growth in diagnostic / interventional radiology. Mid-Atlantic, South Atlantic, and Mountain regions have very high confidence in growing as a profit center.
Topic
Score Mean
Mid-Atlantic
South Atlantic
East North
Central
West North
Central
East South
Central
West South
Central Mountain Pacific
Will grow monthly in diagnostic and interventional radiology
116 143 114 114 112 116 115 122
Receive adequate reimbursement from Medicare for diagnostic and interventional imaging
76 90 97 92 77 62 81 68
Internal operating and staff costs will remain constant
121 119 153 145 143 132 129 113
Will have access to capital for imaging equipment and IT needs
99 103 113 93 112 91 121 89
Will maintain/grow as a profit center
134 143 130 124 124 122 154 119
Composite score across all areas 108 118 121 112 113 103 120 101
West South Central and Pacific regions have very low confidence about receiving adequate reimbursement from Medicare, while the Mid-Atlantic, East South Central, and Mountain regions also have low confidence.
Pacific region has low confidence in access to capital for equipment.

West South Central and Pacific regions have very low confidence; while the Mid-Atlantic, East South Central, and Mountain regions have low confidence about receiving adequate reimbursement from Medicare. The Pacific region has low confidence in access to capital for equipment.
North Central, and South Central regions have very high confidence that internal operating and staff costs will remain constant. South Atlantic region has very high confidence in growing as a profit center. Mid-Atlantic, South Atlantic, and Mountain regions have very high confidence in growth in diagnostic / interventional radiology.
Hospitals with 100 or more beds are more confident in growth of diagnostic / interventional radiology.
There is concern about receiving adequate reimbursement from Medicare.
There is high confidence in the growing of diagnostic and interventional radiology, staff costs will remaining constant, and growing as a profit center.
9
Summary
1
2
3
4
5

Q1-2018 Member comments about their optimistic outlook
10
Optimistic Outlook:
o We have focused on our interventional lab in 2017 and look to see the benefits in 2018. Our focus this year will be breast care so we look to capitalize with increased MRI procedure counts.
o It seems as though the patients entering the hospitals are with a higher acuity than in the past. This is why I feel we will continue to see our procedural volume increase.
o As a strategic initiative and to improve resource allocation, integration plans are being developed to make Cardiac Cath and Interventional Radiology one service line, thereby reducing operational costs and increasing efficiency.
o I do have money for capital for a need of our department to purchase DR plates and also an upgrade to our PACS system that we will be planning to go live in 4-6 months.
o Funding approved for new RIS. Interventional Radiology is merging with Interventional Cardiology to form a new service line with capital investments being made.
Uncertainty / complaints about healthcare policy and reimbursement:
o Some of the IR and NM procedures are reimbursed by Medicare at a rate less then the cost of expenses related to the procedure.
o Economy seems to be getting better, although insurance preauthorization continues to be a nightmare. Insurance is still in the drivers seat for denials on needed patient procedures, which hurt volume and patient care. Suppliers continue to charge what they want even though reimbursement for their products doesn't meet cost, and hospitals have to figure out how to pay the difference and manage a profit.
o Continued financial constraints, including reduced reimbursement, procedure bundling, and now further pre-authorization constraints from carriers - makes it hard to finance equipment replacement or invest in new technologies or expansion.
o I feel this year with some changes in Medicare / Medicaid we will have some difficult times.
o Medicaid and Medicare are always cutting reimbursements. Doctors are allowed to siphon commercial insurance to their imaging centers leaving hospitals to live on crumbs.
o 2018 reimbursement changes expected to have a negative effect on all hospital performed imaging including outpatient.
o Future depends on direction the Federal Government takes towards health care.
o The current ACA political conflict and its lack of stability has driven healthcare consumers to delay their imaging studies or cancel them for fear of future cost liabilities.

Q1-2018 Member general comments
11
Other general comments:
o First few months are traditionally a little slow and capital monies normally aren't released until 2nd quarter
o Because of the new year, people have not meet their deductibles as yet-so they tend to shy away from spending $ on healthcare right off the bat, unless its absolutely required.
o Volumes usually drop throughout the first few months of the year to do insurance plans that do not cover many items like it did in the past (before Obamacare). All previous plans that were rich have been moved to having higher deductible and co-pays that eliminate electable procedures until the have met their deductibles/copays.
o Over the next quarter our capital funding will be tied up in expansion of other areas outside of imaging.
o Qualified staff are difficult to recruit, thus the wages will have to increase. The company that owns / manages hospital is facing financial challenges and only replacing equipment as it is at end of working life.
o I disagreed with money available for capital equipment, IT and expansion because 2017 was a big year for purchasing and expansion facility wide, but particularly in imaging. Capital dollars will be allocated to other departments in this upcoming year.
o Age of equipment vs. capital available is a poor situation, largely driven by the hospital’s allotment for capital which is based on previous year’s revenue accomplishment. The ageing equipment happens regardless of profit margins and revenue growth year over year, and the formula hardly works as an answer for appropriate replacement needs.
o We’re opening a new imaging center so my outpatient volume will decrease here at the hospital.
o Investments in DR will be made to avoid penalties.
o A lot of education to referring MDs will need to happen regarding medical necessity. Fortunately, we have a strong IN and INR clinic that provides excellent documentation to allow reimbursements for interventional procedures.
o I will be purchasing some capital equipment, it will not be IT or PACS related. I do not expect volume or revenue to grow, mainly stay at current levels.

12
Quarter-to-Quarter analysis
Results are now shown for Q2 2016 through
Q1 2018.
o Comparisons are presented to show any trending of the data over a one year period.
Analyses are based on between
group analysis of variance (ANOVA) where participant’s scores are compared over time to determine if changes occur.

13
Quarter-to-Quarter analysis Q4-2017 through Q1-2018
Topic
Score Mean
Q4 2017 Q1 2018
Will grow monthly in diagnostic and interventional radiology
116 120
Receive adequate reimbursement from Medicare for diagnostic and interventional imaging
81 83
Internal operating and staff costs will remain constant 131 134
Will have access to capital for imaging equipment and IT needs
100 102
Will maintain/grow as a profit center 124 130
Composite score across all areas 110 113
No statistically significant differences in confidence for any of the MICI scores between Q4 2017 and Q1 2018.

14
Quarter-to-Quarter analysis Q2-2016 through Q1-2018
50
75
100
125
150
2nd quarter 3rd quarter 4th quarter 1st quarter 2nd quarter 3rd quarter 4th quarter 1st quarter
2016 2017 2018
Ave
rag
e M
ICI
Sco
res
Quarter
Will grow monthly in diagnostic and interventional radiology
Receive adequate reimbursement from Medicare for diagnostic and interventional imaging
Internal operating and staff costs will remain constant
Will have access to capital for imaging equipment and IT needs
Will maintain/grow as a profit center
Composite score across all areas
TRENDING: Growth as a profit center has higher confidence in Q1 2018 compared to Q3 2016. No significant differences in all areas from Q4 2017 to Q1 2018.
Margin of error: ±8 percentage points

50
75
100
125
150
1752nd Q
2017
3rd
Q 2
017
4th
Q 2
017
1st
Q 2
018
2nd Q
2017
3rd
Q 2
017
4th
Q 2
017
1st
Q 2
018
2nd Q
2017
3rd
Q 2
017
4th
Q 2
017
1st
Q 2
018
2nd Q
2017
3rd
Q 2
017
4th
Q 2
017
1st
Q 2
018
2nd Q
2017
3rd
Q 2
017
4th
Q 2
017
1st
Q 2
018
Grow monthly Receive adequate
reimbursement
Costs remain constant Access to capital Maintain/grow as a
profit center
Ave
rag
e M
ICI
Sco
res
15
Quarter-to-Quarter analysis Q2-2017 through Q1-2018
Click here to see more information
Under 100 beds
100 to 299 beds
300 or more beds
Margin of error: ±8 percentage points
For details on MICI scores by bed size – please click on underlined links, or go to Appendix B.
Click here to see more information
Click here to see more information
Click here to see more information
Click here to see more information

16
Quarter-to-Quarter analysis
Trend Summary
In aggregate, higher confidence in Q1 2018 compared to Q3 2016.
Higher confidence in Q1 2018 compared to Q3 2016.
Higher confidence in Q1 2018 compared to Q4 2016.
No changes in MICI between Q1 2018 and Q2 2016.
Overall:
Higher confidence in growth as a profit center
Under 100 beds:
Higher confidence in growth as a profit center
100 to 299 beds:
Higher confidence in receiving adequate
reimbursement
300 or more beds: No change in
confidence

17
Study & report have been conducted & brought to you courtesy of:

18
Appendix: January to March 2018 results
Grow monthly in diagnostic and interventional imaging Over the next three months, I am very optimistic that our department:
S1Q1. will grow monthly study volumes in Diagnostic imaging modalities (X-ray, Ultrasound, MRI, CT and NM).
S1Q2. will grow monthly study volumes in Interventional imaging modalities (biopsy, angio cath lab, etc.).
APPENDIX A - Questionnaire
Receive adequate reimbursement from Medicare for diagnostic and interventional imaging Over the next three months, I am very optimistic that our department:
S1Q3. will receive adequate reimbursement from Medicare for Diagnostic imaging studies.
S1Q4. will receive adequate reimbursement from Medicare for Interventional imaging procedures.
Internal operating and staff costs will remain constant Over the next three months, I am very optimistic that the imaging department:
S2Q1. internal operating expenses (not including staff costs) will remain constant.
S2Q2. internal staff costs will remain constant.

19
Appendix: January to March 2018 results
Will have access to capital for imaging equipment and IT needs Over the next three months, I am very optimistic that our department:
S3Q1. will have access to capital/credit to fund investments in new imaging equipment and the costs associated with Imaging capital projects (e.g. siting & construction costs).
S3Q2. will have access to capital/credit to fund investments in areas outside of imaging equipment, such as PACS, RIS, or other imaging-related IT needs.
S3Q3. will have access to capital/credit to fund investment in imaging facility expansion, if desired.
APPENDIX A - Questionnaire
Will grow as a profit center Over the next three months, I am very optimistic that our department:
S4Q1. will continue to maintain/grow Diagnostic imaging services as a profit center.
S4Q2. will continue to maintain/grow Interventional imaging services as a profit center.

20
Appendix: Q2-2016 through Q1-2018 results
Graphs are presented by number of beds to show MICI for all quarters.
APPENDIX B
Interpretation is by number of beds—any changes across quarters are identified as being significant.
If no changes are identified then differences that might appear are due to random fluctuation in responses over time and should not be considered real.

50
75
100
125
150
175
2nd quarter 3rd quarter 4th quarter 1st quarter 2nd quarter 3rd quarter 4th quarter 1st quarter
2016 2017 2018
Ave
rag
e M
ICI
Sco
res
Quarter
Hospital bed size: Under 100 beds
Will grow monthly in diagnostic and interventional radiology
Receive adequate reimbursement from Medicare for diagnostic and interventional imaging
Internal operating and staff costs will remain constant
Will have access to capital for imaging equipment and IT needs
Will maintain/grow as a profit center
Composite score across all areas
21
Appendix: Q2-2016 through Q1-2018 results
Under 100 beds: Growth as a profit center has higher confidence in Q1 2018 compared to Q3 2016. No significant differences in all areas from Q4 2017 to Q1 2018.
Back to Hospital bed size summary

50
75
100
125
150
175
2nd quarter 3rd quarter 4th quarter 1st quarter 2nd quarter 3rd quarter 4th quarter 1st quarter
2016 2017 2018
Ave
rag
e M
ICI
Sco
res
Quarter
Hospital bed size: 100 to 299 beds
Will grow monthly in diagnostic and interventional radiology
Receive adequate reimbursement from Medicare for diagnostic and interventional imaging
Internal operating and staff costs will remain constant
Will have access to capital for imaging equipment and IT needs
Will maintain/grow as a profit center
Composite score across all areas
22
Appendix: Q2-2016 through Q1-2018 results
100 to 299 beds: Receiving adequate reimbursement from Medicare has higher confidence in Q1 2018 compared to Q4 2016. No changes in MICI between MICI Q1 2018 and Q4 2017.
Back to Hospital bed size summary

50
75
100
125
150
175
2nd quarter 3rd quarter 4th quarter 1st quarter 2nd quarter 3rd quarter 4th quarter 1st quarter
2016 2017 2018
Ave
rag
e M
ICI
Sco
res
Quarter
Hospital bed size: 300 or more beds
Will grow monthly in diagnostic and interventional radiology
Receive adequate reimbursement from Medicare for diagnostic and interventional imaging
Internal operating and staff costs will remain constant
Will have access to capital for imaging equipment and IT needs
Will maintain/grow as a profit center
Composite score across all areas
23
Appendix: Q2-2016 through Q1-2018 results
300 or more beds: No changes in MICI between MICI Q1 2018 and Q2 2016. No changes between Q1 2018 and Q4 2017.
Back to Hospital bed size summary

50
75
100
125
150
175
2nd quarter 3rd quarter 4th quarter 1st quarter 2nd quarter 3rd quarter 4th quarter 1st quarter
2016 2017 2018
Ave
rag
e M
ICI
Sco
res
Will grow monthly in diagnostic and interventional radiology: Hospital bed size
Quarter
Under 100 beds 100 to 299 beds 300 or more beds
Appendix: Q2-2016 through Q1-2018 results
Back to Hospital bed size summary
24

Appendix: Q2-2016 through Q1-2018 results
Back to Hospital bed size summary
25
50
75
100
125
150
175
2nd quarter 3rd quarter 4th quarter 1st quarter 2nd quarter 3rd quarter 4th quarter 1st quarter
2016 2017 2018
Ave
rag
e M
ICI
Sco
res
Receive adequate reimbursement from Medicare for diagnostic and interventional imaging: Hospital bed size
Quarter
Under 100 beds 100 to 299 beds 300 or more beds

50
75
100
125
150
175
2nd quarter 3rd quarter 4th quarter 1st quarter 2nd quarter 3rd quarter 4th quarter 1st quarter
2016 2017 2018
Ave
rag
e M
ICI
Sco
res
Internal operating and staff costs will remain constant: Hospital bed size
Quarter
Under 100 beds 100 to 299 beds 300 or more beds
Appendix: Q2-2016 through Q1-2018 results
Back to Hospital bed size summary
26

50
75
100
125
150
175
2nd quarter 3rd quarter 4th quarter 1st quarter 2nd quarter 3rd quarter 4th quarter 1st quarter
2016 2017 2018
Ave
rag
e M
ICI
Sco
res
Will have access to capital for imaging equipment and IT needs: Hospital bed size
Quarter
Under 100 beds 100 to 299 beds 300 or more beds
Appendix: Q2-2016 through Q1-2018 results
Back to Hospital bed size summary
27

50
75
100
125
150
175
2nd quarter 3rd quarter 4th quarter 1st quarter 2nd quarter 3rd quarter 4th quarter 1st quarter
2016 2017 2018
Ave
rag
e M
ICI
Sco
res
Will maintain/grow as a profit center: Hospital bed size
Quarter
Under 100 beds 100 to 299 beds 300 or more beds
Appendix: Q2-2016 through Q1-2018 results
Back to Hospital bed size summary
28