1st asian workshop on molecular...
TRANSCRIPT

1st Asian Workshop on Molecular Spectroscopy
Program and Abstracts
May 20−21, 2017
Kyoto University, Japan

1
1st Asian Workshop on Molecular Spectroscopy
20 May (Saturday)
8 : 45 — 9 : 00 Opening Remarks Jon T. Hougen (NIST, USA)
9 : 00 — 9 : 15 A01 Shoko Okuda and Hiroyuki Sasada (Keio University, Japan)
"Relative Intensity of a Cross-over Resonance to Lamb Dips in the ν3 Band of
Methane"
9 : 15 — 9 : 30 A02 Christian Schröter, Jong Chan Lee, and Thomas Schultz (UNIST, Ulsan, Korea)
"Rotational Raman Spectroscopy with 5 THz Bandwidth, 3 MHz resolution, and
sub-kHz accuracy"
9 : 30 — 9 : 45 A03 Kensuke Harada and Keiichi Tanaka (Kyushu University, Japan)
"Millimeter-wave spectroscopy of He-HCN and He-DCN:
Energy levels near the dissociation limit"
9 : 45 — 10 : 00 A04 Yu Zhai and Hui Li (Jilin University, China)
"Intermolecular Potential Energy Surfaces for HCN-H2 van der Waals Complex and
their applications in the research of HCN-(pH2)N clusters"
--------------------- Coffee break ----------------------
10 : 15 — 10 : 30 A05 Yasuki Endo, Carlos Cabezas, and Jean-Claude Guillemin
(National Chiao Tung University, Taiwan)
"FTMW spectroscopy of substituted Criegee intermediates"
10 : 30 — 10 : 45 A06 Jou-Wei Su, Chen-An Chung, and Yuan-Pern Lee
(National Chiao Tung University, Taiwan)
"Infrared Absorption Spectrum of Hydroperoxymethyl Formate [HC(O)OCH2OOH]
Produced in the Reaction of the Criegee Intermediate CH2OO with HCOOH
10 : 45 — 11 : 00 A07 Yoshiyuki Kawashima, Ken Ajiki, and Eizi Hirota
(Kanagawa Institute of Technology, The Graduate University for Advanced Studies, Japan)
"Fourier Transform Microwave spectroscopy of CF3SF5"
11 : 00 — 11 : 15 A08 Takayoshi Amano
(Jet Propulsion Laboratory, California Institute of Technology, USA)
"Some theoretical considerations on the microwave three-wave mixing experiments"
-------------------- Coffee break --------------------
2
11 : 30 — 11 : 45 A09 Yu-Jong Wu (National Synchrotron Radiation Research Center, Taiwan)
"Infrared Spectrum of Hydrogen Fluoride Anion Isolated in Solid Argon"
11 : 45 — 12 : 00 A10 Rafael Escribano, Pedro C. Gomez, Victor J. Herrero, and Naoki Watanabe
(Universidad Complutense de Madrid, Madrid, Spain, and Hokkaido University, Japan)
"Variation of H-bond properties with density in astrophysical ice structures"
12 : 00 — 12 : 15 A11 Yu-Hsuan Chen, Masashi Tsuge, and Yuan-Pern Lee
(National Chiao Tung University, Taiwan)
"Infrared spectra of protonated aniline in solid para-hydrogen"
12 : 15 — 12 : 30 A12 Koichiro Yamakawa, S. Azami, and Ichiro Arakawa
(Gakushuin University, Japan)
"Phonon-mediated nuclar spin relaxation of H2O trapped in Ar matrix"
12 : 30 — 12 : 45 A13 Nobukimi Ohashi and Jon T. Hougen
(Kanazawa University, Japan, and NIST, Gaithersburg, USA)
"Cross-contamination of the fitting parameters in multidimensional tunneling treatments"
---------------------- Lunch ---------------------
14 : 00 — 14 : 15 A14 Yeon Guk Seong, Cheol Joo Moon, Ahreum Min, Ahreum Ahn, and Myong Yong Choi
(Gyeongsang National University, Chungbuk National University, Korea)
"Conformational Structures of Indole-3-acetic Acid by
UV-UV hole-burning and IR-dip spectroscopy"
14 : 15 — 14 : 30 A15 Cheol Joo Moon, Yeon Guk Seong, Ahreum Min, Ahreum Ahn, and Myong Yong Choi
(Gyeongsang National University, Chungbuk National University, Korea)
"Rapid Non-radiative Decay of Jet-cooled 2-hydroxyformanilide:
IR-dip Spectroscopy and Computational Studies"
14 : 30 — 14 : 45 A16 Yoshihiro Nakashima, Kensuke Harada, Keiichi Tanaka, and Takehiko Tanaka
(Kyushu University, Japan)
"High-resolution Fourier transform emission spectroscopy of the A 2Π−X 2Π band of
the OCS+ ion"
14 : 45 — 15 : 00 A17 Zhen-Dong Sun (Shandong University, China)
"Quantum Zeno effect in field-free methanol gas"
-------------------- Coffee Break --------------------

3
15 : 15 — 15 : 30 A18 Li-Hong Xu, E. M. Reid, B. Guislain, J. T. Hougen, E. A. Alekseev, and I. Krapivin
(University of New Brunswick, Canada, NIST, USA, Institute of Radioastronomy of
National Academy of Sciences of Ukraine, Ukraine, and V.N. Karazin Kharkiv
National University, Ukraine )
"Ab Initio Calculations of Torsionally Mediated Hyperfine Splittings in E States of
Acetaldehyde"
15 : 30 — 15 : 45 A19 Chen-Wen Wang, Chaoyuan Zhu, and Sheng-Hsien Lin
(National Chiao Tung University, Taiwan)
"Molecular Vibronic Spectra in Solution Simulated by Damped Franck-Condon Factors"
15 : 45 — 16 : 00 A20 Dongho Kim (Yonsei University, Korea)
"Unravelling of Baird’s Rule via Spectroscopic Analysis: Reversal of
Hückel Aromaticity in the Excited Singlet and Triplet States of Hexaphyrins"
16 : 00 — 16 : 15 A21 Takayoshi Ishimoto, Masaaki Baba, Naofumi Nakayama, and Umpei Nagashima
(Hiroshima University, Kyoto University, Conflex Corporation, FOCUS, Japan)
"Theoretical Study on Geometrical Isotope Effect and Rotational Constants of
Polyatomic Molecules"
-------------------- Coffee Break --------------------
16 : 30 — 16 : 45 A22 Ahreum Min, Ahreum Ahn, Cheol Joo Moon, Yeon Guk Seong, and Myong Yong Choi
(Chungbuk National University, Gyeongsang National University, Korea)
"Conformational structures of jet-cooled acetaminophen-water clusters:
a gas phase spectroscopic and computational study"
16 : 45 — 17 : 00 A23 Yi-Jen Wang and Yen-Chu Hsu
(Institute of Atomic and Molecular Sciences, Academia Sinica, Taiwan)
"Vibrational Predissociation of the à state of the C3Ar complex
in the excitation energy region of 25410 − 25535 cm-1"
17 : 00 — 17 : 15 A24 Kaito Takahashi
(Institute of Atomic and Molecular Sciences, Academia Sinica, Taiwan)
"Variations in the electron detachment spectra of F...H2O Anion
induced by proton motion"
17 : 15 — 17 : 30 A25 Taewan Kim, Wonwoo Park, and Oh-Hoon Kwon (UNIST, Ulsan, Korea)
"Photoinduced Proton Transfer of N-methyl-Hydroxyquinolinium to Small Water Clusters"
18 : 00 — 20 : 00 Picnic
4
21 May (Sunday)
9 : 00 — 9 : 15 B01 Sachi Kunishige, Takaya Yamanaka, Masaaki Baba, Masakazu Nakajima,
Yasuki Endo, and Yasuhiro Ohshima
(Kyoto University, Institute for Molecular Science, University of Tokyo,
Tokyo Institute of Technology, Japan)
"High-resolution Spectroscopy of Deuterated Benzenes"
9 : 15 — 9 : 30 B02 Yu-Chan Guan, Yung-Hsiang Chang, Yi-Chieh Liao, and Jow-Tsong Shy
(National Tsing Hua University, Taiwan)
"Precision Saturated Absorption Spectrsocopy of H3+ "
9 : 30 — 9 : 45 B03 Akiko Nishiyama, Kazuki Nakashima, Masatoshi Misono, and Masaaki Baba
(Fukuoka University, University of Electro-Communications, Kyoto University, Japan)
"Doppler-free two-photon absorption spectroscopy of vibronic excited states of
naphthalene with reference to an optical frequency comb"
9 : 45 — 10 : 00 B04 Akiko Nishiyama, Satoru Yoshida, Takuya Hariki, Yoshiaki Nakajima, and
Kaoru Minoshima
(University of Electro-Communications, JST, ERATO MINOSHIMA,
Intelligent Optical Synthesizer (IOS) Project, Japan)
"High-sensitive and precise measurement of Doppler-free two-photon absorption spectra
of Rb using dual-comb spectroscopy"
-------------------- Coffee break -------------------
10 : 15 — 10 : 30 B05 Yao-Chin Huang, Yu-Chan Guan, Jow-Tsong Shy, and Li-Bang Wang
(National Tsing Hua University, Taiwan)
"Absolute frequency measurement of the molecular iodine hyperfine transition at 647 nm"
10 : 30 — 10 : 45 B06 Peng Kang, Jin Wang, Lei-gang Tao, Yu Robert Sun, An-wen Liu, Tian-peng Hua, and
Shui-ming Hu
(Univesity of Science and Technology of China, China)
"Precise line parameters from laser-locked cavity ring-down spectroscopy"
10 : 45 — 11 : 00 B07 D.N. Patel, Tzu-Han Su, Hsiang-Chen Chui, and Jow-Tsong Shy
(National Tsing Hua University, National Cheng Kung University, Taiwan)
"Mid-infrared saturated absorption spectroscopy inside the hollow fiber
using difference frequency generation source"
11 : 00 — 11 : 15 B08 L. F. Tsang, Man-Chor Chan, Wenli Zou, and Allan S-C. Cheung
(University of Hong Kong, China)
"Electronic transitions of tungsten monosulfide"
5
-------------------- Coffee break -------------------
11 : 30 — 11 : 45 B09 Chiao-Wei Chen, Anthony J. Merer , and Yen-Chu Hsu
(Institute of Atomic and Molecular Sciences, Academia Sinica, Taiwan)
"The low-lying electronic states of scandium monocarbide, ScC"
11 : 45 — 12 : 00 B10 Kyohei Watanabe, Kaori Kobayashi, Fusakazu Matsushima, Yoshiki Moriwaki, and
Stephen C. Ross
(University of Toyama, Japan, and University of New Brunswick, Canada)
"Laser spectroscopic study of the B/B' 2Σ+ v = 9, 10, 11 and 18 levels of CaH"
12 : 00 — 12 : 15 B11 Sang Kuk Lee
(Pusan National University, Korea)
"Vibronic Emission Spectroscopy of Jet-cooled Benzyl-type Radicals
Generatedfrom Corona Discharge of Chloro-Substituted o-Xylenes"
12 : 15 — 12 : 30 B12 Kohei Tada, Michihiro Hirata, Shunji Kasahara, Takashi Ishiwata, and Eizi Hirota
(Kyoto University, Kobe University, Hiroshima City University, and
The Graduate University for Advanced Studies, Japan)
"High-resolution laser spectroscopy and Zeeman effect of nitrate radical"
12 : 30 — 12 : 45 B13 Masaru Fukushima and Takashi Ishiwata
(Hiroshima City University, Japan)
"Vibronic coupling in the X 2A2' state of NO3"
12 : 45 — 13 : 00 B14 Kaori Kobayashi, Wataru Nakamura, Tatsuro Matsushima, Shozo Tsunekawa, and
Nobukimi Ohashi (University of Toyama, Kanazawa University, Japan)
"The Microwave Spectroscopy of Ground State CD3SH"
-------------------- Lunch -------------------
14 : 00 — 14 : 15 B15 Sheng-Yuan Tzeng and Wen-Bih Tzeng
(Institute of Atomic and Molecular Sciences, Academia Sinica, Taiwan)
"Mass-Analyzed Threshold Ionization Spectroscopy of Some Sandwich Molecules"
14 : 15 — 14 : 30 B16 Yu-Che Sun and Wen-Bih Tzeng
(Institute of Atomic and Molecular Sciences, Academia Sinica, Taiwan)
"Study of 2-Chloro-4-fluoroanisole by Two-Color Resonant Two-Photon Mass-Analyzed
Threshold Ionization Spectroscopy"
14 : 30 — 14 : 45 B17 Yu Ran Lee, Hong Lae Kim, and Chan Ho Kwon
(Kangwon National University, Korea)
"One-photon mass-analyzed threshold ionization (MATI) spectroscopy of
thietane cation"

6
14 : 45 — 15 : 00 B18 Sung Man Park, Hong Lae Kim, Chan Ho Kwon
(Kangwon National University, Korea)
"One-photon vacuum ultraviolet mass-analyzed threshold ionization (VUV-MATI)
spectroscopy of crotonaldehyde"
-------------------- Coffee break -------------------
15 : 15 — 15 : 30 B19 Yu Ran Lee, Hong Lae Kim, and Chan Ho Kwon
(Kangwon National University, Korea)
"Conformer-specific ion spectroscopy of isobutanal"
15 : 30 — 15 : 45 B20 Do Won Kang, Hong Lae Kim, Chan Ho Kwon
(Kangwon National University, Korea)
"Vacuum ultraviolet mass-analyzed threshold ionization spectroscopy of hydrazoic acid"
15 : 45 — 16 : 00 B21 Sung Man Park, Chan Ho Kwon, and Hong Lae Kim
(Kangwon National University, Korea)
"VUV-MATI spectroscopy of tetrahydrofuran"
16 : 00 — 16 : 15 B22 Itaru Kurusu, Reona Yagi, Ryota Kato, Yasutoshi Kasahara, and Haruki Ishikawa
(Kitasato University)
"Temperature effect on the microscopic hydration structures of phenol cation"
-------------------- Coffee break -------------------
16 : 30 — 16 : 45 B23 Ye-Jin Kim and Oh-Hoon Kwon
(Ulsan National Institute of Science and Technology, Korea)
"Proton diffusion dynamics along a diol as a proton-conducting wire
in a photo-amphiprotic model system"
16 : 45 — 17 : 00 B24 So Young Eom, Hong Lae Kim, and Chan Ho Kwon
(Kangwon National University, Korea)
"Orientation change and structure according to the various pH conditions of
4-amino-4'-cyanobiphenyl on silver surfaces: SERS and DFT study"
17 : 00 — 17 : 15 B25 Young Jae Kim, Byeong Sung Lee, Tae Hyeon Yoo, and Oh-Hoon Kwon
(Ulsan National Institute of Science and Technology, Korea)
"Hydrogen-bonding energetics and dynamics of biological water
using ultrafast electronic spectroscopy"

7
17 : 15 — 17 : 30 B26 Sung-Sik Lee, Soojin Park, Xianglei Kong, Sungyul Lee, and Han Bin Oh
(Kyung Hee University, Korea)
"Chiral Differentiation of Protonated L- and D-Amino Acids by
Permethylated β-cyclodextrin: Experiments and Theory"
-------------------- Coffee break -------------------
17 : 45 — 18 : 00 B27 Seongchul Park, Joohyang Shin, Changwon Yang, Youngshang Pak, and Manho Lim
(Pusan National University, Korea)
"Photodissociation of CF2ICF2I and CF2I2 in solution probed by
femtosecond infrared spectroscopy"
18 : 00 — 18 : 15 B28 Jaeheon Park, Hak-Won Nho, and Oh-Hoon Kwon
(Ulsan National Institute of Science and Technology, Korea)
"Hydration characteristics of a water pool in a nano-confined system
probed by a superphotoacid"
18 : 15 — 18 : 30 B29 Yang Cong and Hui Li
(Jilin University, China)
"Local Mode-Based Infrared Probe Spectra: a Case Study of Formic Acid-Water
Clusters and Solutions"
18 : 30 — 18 : 45 Closing Remarks Masaaki Baba (Kyoto University, Japan)

Relative Intensity of a Cross-Over Resonance to Lamb Dips in the ν3 Band of Methane
(Keio Univ., JST, ERATO MINOSHIMA IOS) Shoko Okuda and Hiroyuki Sasada
We have extensively observed sub-Doppler resolution Stark-modulation spectra
in the ν3 band of methane (CH4) from 87.7 to 92.8 THz (2925 to 3096 cm−1) using a
comb-referenced difference-frequency-generation spectrometer. In the analysis, the
vibration- and rotation-induced permanent electric dipole moments have been precisely
determined for the vibrational excited and ground states [1]. In the course of the study,
we have found that the relative intensity of a cross-over resonance to Lamb dips depends
on the transition branch.
Figure 1 depicts three saturated absorption spectra under the Stark field
perpendicular to the optical electric field. The dispersion-type line profiles are
caused by the Stark-modulation detection. Figure 1 (a), (b) and (c) correspond to the
P-, Q- and R-branch transitions between the |v = 0, J” = 4, E, |M’’|=0 or 2 > and |v3 = 1, J’,
E, |M’|=1 > levels, respectively, where vs are the vibrational quantum numbers, Js are
the total angular momentum quantum numbers, Ms are the projection of J along the applied
electric field, and E is the doubly degenerate irreducible representation of the Td
point group. The double and single primes present the vibrational ground and exited
states. The horizontal axis indicates the frequency deviation from each zero-field
transition frequency, ν0, reported in Refs. [2,3]. Each triplet contains a cross-over
resonance at the center and two Lamb dips. Figure 2 illustrates the energy level diagram
of Fig. 1 (a) with zero (a)and nonzero external fields (b). The relative intensity of
the Lamb dips agrees with the prediction from the corresponding Clebsch-Gordan
coefficients. However, the relative intensity of a cross-over resonance to the larger
Lamb dip depends on the transition branches. In particular, the cross-over resonance
is the strongest among the components of the triplet for the Q- and R-branch transitions.
This characteristic behavior has also been seen for most of the observed transitions,
P(4) E, …, P(7) E, P(8) E(2) and P(9) E, Q(2) E, Q(4) E, …,Q(7) E and Q(8) E(2), and R(2) E and R(4)
Figure 1. Observed Stark modulation spectra in the ν3 band of methane. (a) shows the
P(4) E transition with the external field of 22.5 kV/cm, (b) and (c) are Q(4) E with
25.0 kV/cm and R(4) E with 30.0 kV/cm, respectively. In each figure, the center spectral
component is a cross-over resonance and the others are the associated Lamb dips.
A01
8

E, …, R(7) E. This is often observed in
atomic spectra but never in molecular
spectra, as far as we know.
We have analyzed the intensity of
the cross-over resonance and the Lamb dips
using the rate equation, which was
developed for saturated absorption
spectroscopy of atoms [4], where the
spontaneous emission is the dominant
relaxation process. It is revealed that the
intensity of the triplet agrees with the
atomic theory for the Q-branch transitions,
whereas that for the P- and R-branch
transitions is apart from it. We attribute
this to the difference in the transition
dipole moments of the branches and the
collisional relaxation rates.
[1] S. Okuda and H. Sasada, 71st International Symposium on Molecular Spectroscopy,
The University of Illinois at Urbana-Champaign, TJ09 (2016).
[2] S. Okubo, H. Nakayama, K. Iwakuni, H. Inaba, and H. Sasada, Opt. Express 19,
23878 (2011).
[3] M. Abe, K. Iwakuni, S. Okubo, and H. Sasada, J. Opt. Soc. Am. B 30, 1027 (2013).
[4] S. Nakayama, Jpn. J. Appl. Phys. 23, 879 (1984).
Figure 2. Energy level diagram of the P(4) E
transition in Fig. 1 (a) in the absence of
the external electric field (a) and in the
presence of it (b).
A01
9

Rotational Raman Spectroscopy with 5 THz Bandwidth, 3 MHz resolution, and sub-kHz accuracy.
(UNIST, 50 UNIST-gil, Eonyang-eup, Ulju-gun, Ulsan, 44919, REP. OF KOREA)
Christian Schröter, Jong Chan Lee, Thomas Schultz ([email protected])
Scientific progress is always based on the observation of the natural world. In
the field of spectroscopy, we construct ever more powerful spectroscopic tools
to increase the fidelity and accuracy of our observations. Modern spectroscopy
often operates at the physical limits of observation, e.g., the quantum limit of
observing single particles or the precision limit of the Heisenberg uncertainty
principle. Further progress requires ingenious measurement concepts, such as
the correlation of observables in multidimensional NMR,1 or the direct coupling
of optical frequencies to high-precision clocks in extreme-resolution frequency-
comb atomic spectroscopy. 2
We correlated high-resolution rotational spectra with observables from ultra-
fast laser spectroscopy in the technique of correlated rotational alignment
spectroscopy (CRASY).3 As in multidimensional NMR, we coherently excite and
probe angular momentum wave packets in the time domain. Instead of
nuclear spins, our experiment excites and probes molecular rotations using
short optical laser pulses. As in frequency-comb measurements, we couple our
experiment to a high-precision clock to obtain absolute frequency results
without systematic errors.
Figure 1: Rotational coherence trace for the 32S12C34S isotope (m/z 78). Signal
modulations are due to a rotationally coherent wave-packet excited at time
delay 0. Extending range of observed time delays increases the spectroscopic
resolution of the Fourier-domain spectrum (cf. Figure 2).
Figure 1 shows the measured rotational coherence signal for a mass-selected
isotope of carbon disulfide. An 800 nm picosecond laser pulse excited a
rotationally coherent wave packet in a beam of neutral, cold molecules. The
temporal evolution of the wave packet was probed by 200 nm photoexcitation
and photoionization. The formed ions were detected in a mass spectrometer.
The spectroscopic resolution of rotational spectra measured by CRASY, or by
A02
10
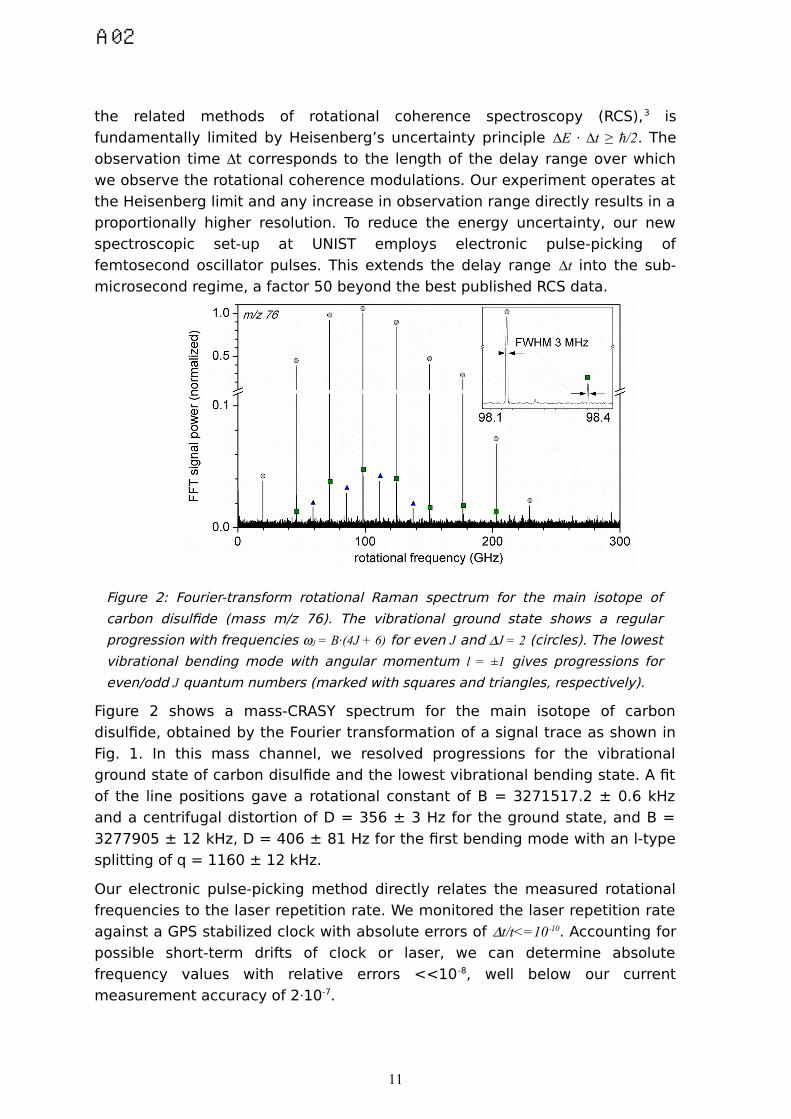
the related methods of rotational coherence spectroscopy (RCS),3 is
fundamentally limited by Heisenberg’s uncertainty principle ∆E · ∆t ≥ ħ/2. The
observation time t corresponds to the length of the delay range over which
we observe the rotational coherence modulations. Our experiment operates at
the Heisenberg limit and any increase in observation range directly results in a
proportionally higher resolution. To reduce the energy uncertainty, our new
spectroscopic set-up at UNIST employs electronic pulse-picking of
femtosecond oscillator pulses. This extends the delay range ∆t into the sub-
microsecond regime, a factor 50 beyond the best published RCS data.
Figure 2: Fourier-transform rotational Raman spectrum for the main isotope of
carbon disulfide (mass m/z 76). The vibrational ground state shows a regular
progression with frequencies J = B·(4J + 6) for even J and J = 2 (circles). The lowest
vibrational bending mode with angular momentum l = ±1 gives progressions for
even/odd J quantum numbers (marked with squares and triangles, respectively).
Figure 2 shows a mass-CRASY spectrum for the main isotope of carbon
disulfide, obtained by the Fourier transformation of a signal trace as shown in
Fig. 1. In this mass channel, we resolved progressions for the vibrational
ground state of carbon disulfide and the lowest vibrational bending state. A fit
of the line positions gave a rotational constant of B = 3271517.2 ± 0.6 kHz
and a centrifugal distortion of D = 356 ± 3 Hz for the ground state, and B =
3277905 ± 12 kHz, D = 406 ± 81 Hz for the first bending mode with an l-type
splitting of q = 1160 ± 12 kHz.
Our electronic pulse-picking method directly relates the measured rotational
frequencies to the laser repetition rate. We monitored the laser repetition rate
against a GPS stabilized clock with absolute errors of t/t<=10-10. Accounting for
possible short-term drifts of clock or laser, we can determine absolute
frequency values with relative errors <<10-8, well below our current
measurement accuracy of 2·10-7.
A02
11
Millimeter-wave spectroscopy of He-HCN and He-DCN:
Energy levels near the dissociation limit.
(Kyushu Univ.) Kensuke Harada and Keiichi Tanaka
The He-HCN complex is a weakly bound complex. We have observed the the j=1-0 and 2-1 internal
rotation and intermolecular stretching bands of He-HCN and He-DCN by millimeter-wave absorption
spectroscopy. The upper state of several observed transitions were found to be located above the
"dissociation limit" (D0). These levels are bound due to the parity conservation. The potential energy
surface (PES) fitted to the observed transitions has a global minimum in the linear He--HCN configuration
with a depth of 29.9 cm-1 and has a saddle point at the anti-linear He--NCH configuration. Life times of
several quasi-bound levels are predicted for both isotopic species.
The He-HCN complex is a weakly
bound complex with binding energy of
about 9 cm− 1. We have observed the
internal rotation band ( j = 1←0) of the
He-HCN complex by millimeter-wave
absorption spectroscopy combined with a
pulsed-jet expansion technique and
reported the potential energy surface
(PES) to reproduce the observed
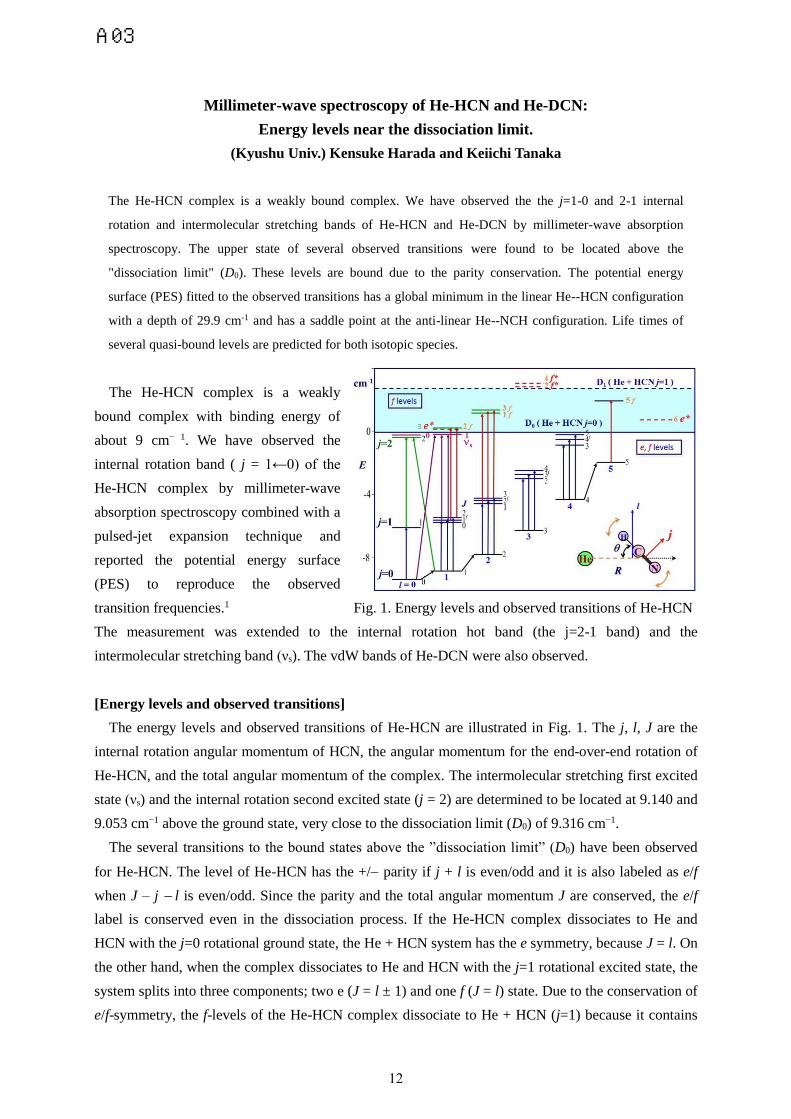
transition frequencies.1 Fig. 1. Energy levels and observed transitions of He-HCN
The measurement was extended to the internal rotation hot band (the j=2-1 band) and the
intermolecular stretching band (νs). The vdW bands of He-DCN were also observed.
[Energy levels and observed transitions]
The energy levels and observed transitions of He-HCN are illustrated in Fig. 1. The j, l, J are the
internal rotation angular momentum of HCN, the angular momentum for the end-over-end rotation of
He-HCN, and the total angular momentum of the complex. The intermolecular stretching first excited
state (νs) and the internal rotation second excited state (j = 2) are determined to be located at 9.140 and
9.053 cm−1 above the ground state, very close to the dissociation limit (D0) of 9.316 cm−1.
The several transitions to the bound states above the ”dissociation limit” (D0) have been observed
for He-HCN. The level of He-HCN has the +/ parity if j + l is even/odd and it is also labeled as e/f
when J – j l is even/odd. Since the parity and the total angular momentum J are conserved, the e/f
label is conserved even in the dissociation process. If the He-HCN complex dissociates to He and
HCN with the j=0 rotational ground state, the He + HCN system has the e symmetry, because J = l. On
the other hand, when the complex dissociates to He and HCN with the j=1 rotational excited state, the
system splits into three components; two e (J = l ± 1) and one f (J = l) state. Due to the conservation of
e/f-symmetry, the f-levels of the He-HCN complex dissociate to He + HCN (j=1) because it contains
A03
12

the lowest f-level. The f-levels have the other dissociation limit of D1, located by 2.96 cm-1 higher than
the dissociation limit D0 for the e levels. The present analysis indicates that four and three f levels are
bound for He-HCN and He-DCN above the ”dissociation limit” (D0).
In the analysis, we also predicted the quasi-bound energy
levels by the method of Hazi and Tayler.2) The four and
three levels (both of e and f labels) are predicted to be
quasi-bound for He-HCN and He-DCN. These levels have
finite life times as listed in Table 1 since the centrifugal
barriers Vmax are higher than the energies of these levels.
[Potential energy surface]
The PES fitted to reproduce the observed transition frequencies of He-HCN has a global minimum
in the linear He—HCN configuration with a depth of
29.812 cm−1 and has a saddle point at the anti-linear
He--NCH configuration with a depth of 20.812 cm−1. The
potential height on the minimum energy path (MEP) of
the PES have been illustrated in Fig. 2. The PES of
He-HCN obtained in the analysis is similar to the
theoretical PES,3) although the present PES has by 1 cm-1
smaller potential anisotropy (VMEP(θ=π)VMEP(θ=0))
than the theoretical one.
Fig. 2. Potential height on MEP
[Long range potential parameters]
In the present analysis, we have used a coupled potential of a exponential (e-βR) repulsive potential
and a asymptotic long range attractive potential. In total, 8 short range and 8 long range potential
parameters have been determined. The long range potential parameters obtained are compared in Table
2. The Cnl is the coefficient of the
Pl(cosθ)・R-n dependence term. The PES
reported by CCSD(T)/cc-pVTZ abinitio
calculation3) was also fitted by the same
potential function and parameters obtained
are also compared in Table 2. The long
range potential parameters obtained for the
normal and deuterated species are similar
and also consistent to the parameters fitted
to the theoretical PES.
1J. Chem. Phys. 117, 7041(2002). 2Phys. Rev. A1, 1109 (1970). 3J. Chem. Phys. 114, 851 (2001).
A03
13

Intermolecular Potential Energy Surfaces for HCN-H2 van der Waals Complex and Their Applications in the Research of HCN-(pH2)N Clusters
(Jilin Univ.a) Yu Zhaia, Hui Lia
Email:[email protected]
Morse/Long-Range potential energy model is a spectroscopically accurate model which has been
expended to Multi-Dimension Morse/Long-Range (MD-MLR) model to describe the intermolecular
interaction. In this work, we adopt the MD-MLR model to fit ab initio pointwise energies got from
vibrationally averaging over the intramolecular vibrational coordinate, which corresponding to the
ground-state HCN-H2 and excited-state HCN-H2 interactions, respectively. Furthermore,
reduce-dimension PESs, which describe the effective interaction between HCN at different state and
para-hydrogen (pH2), are got from adiabatic ‘hindered-rotor’ average. The obtained 2D PESs are
used in Path Integral Monte Carlo (PIMC) quantum simulation of HCN-(pH2)N. The band origin
shifts of HCN in the quantum clusters are calculated based on these PESs. The predicted Infrared
spectra of HCN-H2 and the simulation results for HCN-(pH2)N agree well with the experiments.
A04
14
FTMW spectroscopy of substituted Criegee intermediates
(National Chiao Tung Univ.a, Institut des Science Chimiques de Rennesb) Yasuki Endoa, Carlos Cabezas, and Jean-Claude Guilleminb
Substituted Criegee intermediates (CI’s) were investigated by FTMW spectroscopy. In the present study, we were able to identify more than three species through their pure rotational spectra. Among the species observed, the dimethyl CI was found to show internal rotations of two methyl tops. On the other hand, the ethyl and methyl-ethyl CI’s are expected to have four conformers. For the ethyl CI, three conformers were identified among the four, while all the four conformers were identified for the methyl-ethyl CI. Both of the species show internal rotation splittings for the methyl part.
IntroductionThe Criegee intermediates, R1R2COO, are known to be produced by the ozonolysis
reaction, the reactions of unsaturated hydrocarbons with ozone, and they are considered to be importance source of the OH radical. Studies of the Criegee intermediates are thus performed very extensively in recent years. So far, we have reported detections of the simplest Criegee intermediate, CH2OO and its mehyl-substituted species, CH3CHOO for the syn and anti forms. In the present study, we were able to detect larger Criegee intermediates, dimethyl-substituted, (CH3)2COO, ethyl-substituted, and CH3CH2CHOO, methyl-ethyl- substituted, CH3CH2C(CH3)OO, by FTMW spectroscopy.
Experiments Pure rotational transitions of all the species were observed by an FTMW
spectrometer situated at National Chiao Tung University, Taiwan, which was moved from the University of Tokyo. The three species were produced by discharging a mixture of CH3CI2CH3, CH3CH2CHI2, and CH3CH2CI2CH3, respecrtively, with O2 diluted in Ar. The mixture gases were expanded through a pulsed valve with electrodes attached in front of the valve into a vacuum chamber as a supersonic jet. High level ab initio calculations at CCSD(T)/aug-cc-pVTZ were performed to predict their structures and rotational constants. Barriers for the methyl internal rotations and relative energies of probable conformers were also calculated.
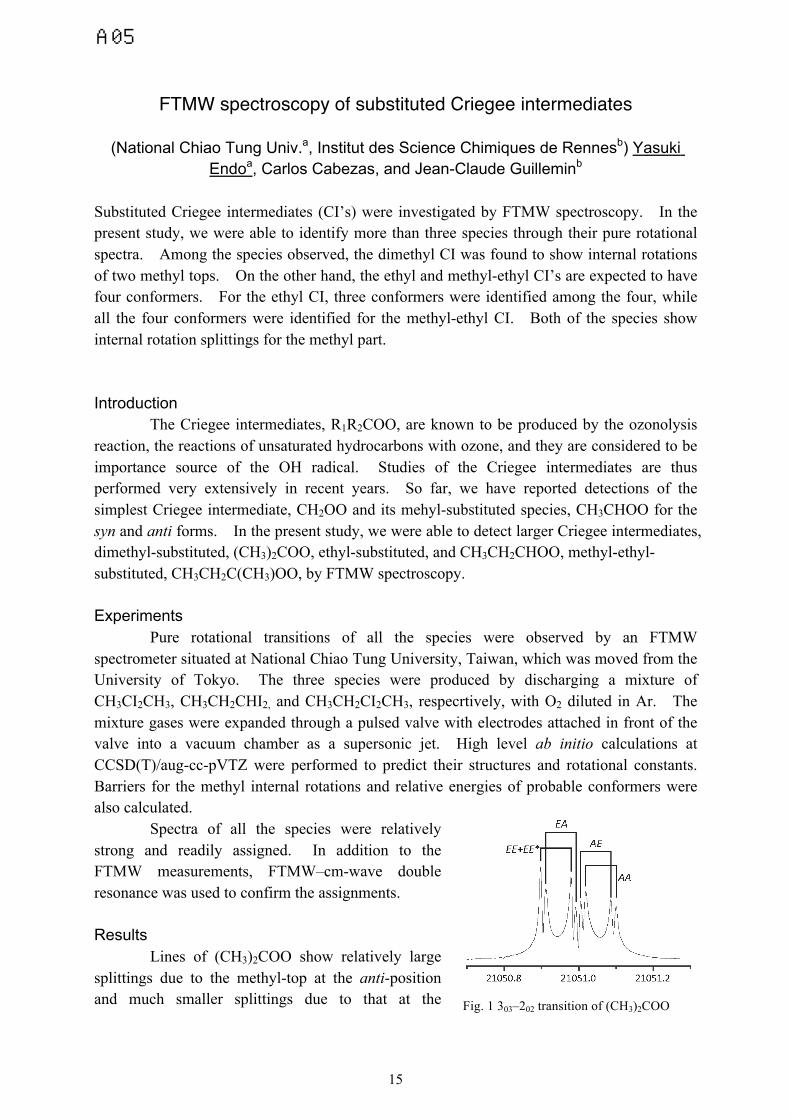
Spectra of all the species were relatively strong and readily assigned. In addition to the FTMW measurements, FTMW–cm-wave double resonance was used to confirm the assignments. Results Lines of (CH3)2COO show relatively large splittings due to the methyl-top at the anti-position and much smaller splittings due to that at the Fig. 1 303–202 transition of (CH3)2COO
A05
15

syn-position as shown in Fig. 1 (1). Barriers of the internal rotations of methyl-tops were determined for both of the tops, which were compared with those of syn- and anti-CH3CHOO. There are four conformers for the CH3CH2CHOO with ethyl part bonded to syn- and anti-positions with respect to bent COO. Each conformer has two conformers with Cs symmetry and without symmetry. The potential curves with respect to the ethyl tortional angle are shown in Fig. 2 (2). Among the four possible conformers, only three of them were assigned in our system, where the anti2 conformer escaped from the detection. The relative populations for the observed conformers suggest that they are produced at a relatively high temperature, about 1100 K, with a possible relaxation from anti2 to anti2 and syn2 to syn1, where the former is fast enough that there is no population for anti2, while that of the latter is much slower so that both of them were observed in the present experiment. Internal rotations of the methyl-top were observed only for the two syn conformers. The largest molecules observed in the present study is CH3CH2C(CH3)OO, the methyl-ethyl substituted CI. There are three species for the C4-Criegee intermediates, species containing four carbon atoms; methyl-ethyl, iso-propyl, and n-propyl substituted CI’s. Among the three possible species, pure rotational spectra of methyl-ethyl CI and iso-propyl CI, (CH3)2CHCHOO, have been observed so far, where analysis of the latter species is still under way. Similar to the case of the ethyl-CI, there are four conformers for the methyl-ethyl CI. All the four conformers were detected for this species, where the methyl internal rotation of the methyl part were more or less resolved for the four species as shown in Fig. 3 (3). Local perturbations were observed for the syn2 conformer.
References
(1) M. Nakajima and Y. Endo, J. Chem. Phys. 145, 244307 (2016). (2) C. Cabezas, J. -C. Guillemin, and Y. Endo, J. Chem. Phys. 145, 224314 (2016). (3) C. Cabezas, J. -C. Guillemin, and Y. Endo, J. Chem. Phys., accepted.
Fig. 2 Potntial energy curves for ethyl-CI
Fig. 3 Observed spectra of methy-ethyl CI for the syn1, anti1, and anti2 conformers
A05
16

Infrared Absorption Spectrum of Hydroperoxymethyl Formate [HC(O)OCH2OOH]
Produced in the Reaction of the Criegee Intermediate CH2OO with HCOOH
(Department of Applied Chemistry and Institute of Molecular Science, National Chiao
Tung University,1001, Ta-Hsueh Road, Hsinchu 30010, Taiwan a
Institute of Atomic and Molecular Sciences, Academia Sinica, Taipei 10617, Taiwan b)
Jou-Wei Sua, Chen-An Chunga, and Yuan-Pern Leea,b
The Criegee intermediates, which are carbonyl oxides produced in ozonolysis of
unsaturated hydrocarbons,1 play important roles in the production of OH, aerosols and
organic acids in the atmosphere. Criegee intermediates react readily with other
atmospheric species such as NO2, SO2, (H2O)2 and HCOOH. The reaction of CH2OO with HCOOH
was reported to be extremely rapid, with a rate coefficient of 1.1×10⁻¹⁰ cm3 molecule−1
s−1.2 Quantum-chemical calculations indicate that the reaction of CH2OO + HCOOH proceeds
through a barrierless association path to form hydroperoxymethyl formate (HPMF,
HC(O)OCH2OOH),3 in agreement with experimental results by Neeb et al, who observed HPMF
and formic acid anhydride (FAN, (CHO)2O) in ozonolysis experiments; FAN and water was
proposed to be produced from dissociation of HPMF.4
In this work, a step-scan Fourier-transform spectrometer coupled with a multipass
absorption cell was employed to record temporally resolved infrared (IR) absorption
spectra of the reactants and products during the reaction of CH2OO with HCOOH in a flow
system. CH2OO were produced from the reaction of CH2I with O2, CH2I was produced from
photolysis of CH2I2.5 Observed bands with origins at 887, 925, 1052, 1115, 1169.5, 1341.5,
1391 and 1760 cm-1 can be assigned to ν16, ν15, ν13, ν12, ν11, ν9, ν7, and ν5 modes
of HPMF, respectively. The observed wavenumbers and relative intensities agree with
the anharmonic vibrational wavenumbers and IR intensities predicted with the
B3LYP/aug-cc-pVTZ method. Our results also show that the rate coefficient of the
reaction CH2OO + HCOOH is (7 0.3)×10−11 cm3 molecule−1 s−1, smaller than the previously
reported value.2
1. R. Criegee and G. Wenner, J. Liebigs Ann. Chem. 564, 9 (1949).
2. O. Welz et al, Angew. Chem., Int. Ed. 53,4547 (2014).
3. Long et al., Journal of Molecular Structure: THEOCHEM 916, 159 (2009).
4. Neeb et al., Chemical Physics Letters 246,150-156 (1995).
5. O. Welz et al., Science 335, 204 (2012).
A06
17

Fourier Transform Microwave Spectroscopy of CF3SF5 (Kanagawa Inst. Tech.a, Grad. Univ. Ad. Studiesb)
Yoshiyuki Kawashimaa, Ken Ajikia , Eizi Hirotab We have investigated trifluoromethylsulfur pentafluoride CF3SF5 by Fourier transform microwave spectroscopy in order to determine the twelve-fold potential barrier to internal rotation in this molecule and have found the V12 value to be close to zero. Relaxation among internal-rotation and overall-rotation levels was found inhomogeneous, resulting in distributions quite different from thermal in low-temperature molecular beam, much affecting thermodynamic properties of the molecule. Spectra of the 13C and 34S species were also observed in natural abundance, leading to the rs C-S bond length of 1.8808 (7) Å. 1. Introduction CF3SF5 has been attracting much attention because of its unusually large global warming potential. It was subjected by Kisliuk and Silvey to a microwave spectroscopic study to confirm that the molecule was really a symmetric top with the rotational constant B = 1097.6 (4) MHz.1) Infrared and Raman spectroscopic investigations and electron diffraction experiments all indicated that the internal rotation was of low barrier, as presumed by the potential function being of as high symmetry as 12-fold. The present study primarily aims at detailed clarification of the internal rotation in CF3SF5. 2. Experimental A sample of CF3SF5 was purchased from SynQuest Labs. Inc. and was used without any further purification. CF3SF5 was diluted with either Ar or Ne to 0.5% and was introduced in the chamber of a FTMW spectrometer through a pulsed nozzle at the backing pressure of approximately 100 kPa. The relative intensities of the rotational transitions of CF3SF5 diluted by Ar were not much different from those recorded using Ne in place of Ar. 3. Observed spectra, assignment, and analysis We have scanned the frequency regions where we expected to observe J + 1 ← J rotational transitions of J = 1 to 9, based upon the B rotational constant reported by Kisliuk and Silvey, and have observed a large number of lines centered at multiples of 2B. Most of them form series, as shown in Fig.1 by the observed frequencies divided by 2(J +1) and plotted against J. We have noticed that there are three pairs of prominent lines, two component lines of which are nearly symmetrically displaced each other from the central clusters of lines; the three pairs are identified by A, B, and C. We have employed a symmetric-top rotational Hamiltonian with some Kivelson’s centrifugal terms: Eqs. (1) and (2) and products of free internal-rotation |m> and symmetric-top rotational |J, k> wavefunctions as bases [abbreviated as (m, k)]. We have taken into account interaction Hamiltonians Eqs. (3)-(5), as shown below, and have assigned A series to (m, k) = (3, 1)± [B1/B2 symmetry] and B series to (m, k) = (3, -1)± [A1/A2 symmetry], and tentatively ascribed C series to (m, k) = (6, 0)± [B1/B2 symmetry]. These three series are split in the first order. The C series showed anomalous J dependence of the intensity, which is probably
A07
18

0
1
2
3
4
5
6
7
8
9
1097.2 1097.3 1097.4 1097.5 1097.6 1097.7 1097.8 1097.9/ MHz
J
A
A B
C C
B cntr c-h c-ℓ
2ℓ1 2ℓ2 3ℓ2
3ℓ3
3ℓ1
4ℓ1 5ℓ1 5ℓ2 5ℓ3
6ℓ1 6ℓ2 6ℓ3
2h1
3h1
4h1
5h1
6h1
caused by relaxation inhomogeneously taking place among internal-rotation and overall-rotation energy levels. The Hamiltonians used are
𝐻𝐻0 = 𝐵𝐵𝐽𝐽2 + (𝐴𝐴 − 𝐵𝐵)𝐽𝐽𝑧𝑧2 + 𝐹𝐹(𝑝𝑝 − 𝜌𝜌𝐽𝐽𝑧𝑧)2 + 𝑉𝑉122
(1 − 𝑐𝑐𝑐𝑐𝑐𝑐12𝛼𝛼) (1)
𝐻𝐻1 = 𝐽𝐽2[𝐺𝐺(𝑝𝑝 − 𝜌𝜌𝐽𝐽𝑧𝑧)2 + 𝐿𝐿(𝑝𝑝 − 𝜌𝜌𝐽𝐽𝑧𝑧)𝐽𝐽𝑧𝑧 − 𝐷𝐷𝐽𝐽𝐽𝐽𝐽𝐽𝑧𝑧2 − 𝐷𝐷𝐽𝐽𝐽𝐽2 + 𝑈𝑈12(1− 𝑐𝑐𝑐𝑐𝑐𝑐12𝛼𝛼)] (2)
𝐻𝐻3 = 𝑈𝑈3[𝑒𝑒3𝑖𝑖𝑖𝑖𝐽𝐽𝑔𝑔+ + 𝑒𝑒−3𝑖𝑖𝑖𝑖𝐽𝐽𝑔𝑔−] (3)
𝐻𝐻6 = 𝑒𝑒6𝑖𝑖𝑖𝑖𝑈𝑈6𝐴𝐴𝐽𝐽𝑔𝑔+2 + 𝑈𝑈6𝐵𝐵𝐽𝐽𝑔𝑔−2+ 𝑒𝑒−6𝑖𝑖𝑖𝑖[𝑈𝑈6𝐵𝐵𝐽𝐽𝑔𝑔+2 + 𝑈𝑈6𝐴𝐴𝐽𝐽𝑔𝑔−2] (4)
𝐻𝐻12 = 𝑖𝑖[𝑉𝑉12𝑎𝑎 + 𝑈𝑈12𝑎𝑎𝐽𝐽2](𝑒𝑒12𝑖𝑖𝑖𝑖 − 𝑒𝑒−12𝑖𝑖𝑖𝑖)𝐽𝐽𝑧𝑧 (5)
It is quite difficult to assign the central cluster lines. Most of the “lines” probably consist of several component lines barely resolved one another. We have noticed that the frequencies of the series labeled as c-h, c-ℓ, 3ℓ1, 3ℓ2, and 2ℓ1 in Fig.1 are closely fit to the expression: f0 + f1n2, where n = 0, 1, 2, 3, and 4, respectively, and the running number n may be identified as either k or m., k being more reasonable than m. We have also searched and assigned spectra of 13C and 34S isotopic species in natural abundance. The rotational constants thus determined for the two isotopic species are 1093.6564 (37) and 1095.4166 (9) MHz, which lead to the rs value of C-S: 1.8808 (7) Å. This value may be compared with the ra 1.887 (8) Å reported by Marsden et al.2) The present study determined the internal-rotation potential barrier V12 to be small: -0.211 (97) cm-1; the internal rotation in CF3SF5 is essentially free, as expected. The negative sign of V12 means that the equilibrium conformation is staggered. The DFT molecular parameters obtained by present quantum chemical calculations, agreed with those reported previously.3) Molecular constants calculated were compared with the present results. The V12 obtained by MP2/6-311++G(d, p) was in much closer agreement with the observed than those by DFT.
References 1) P. Kisliuk and G. A. Silvey, J. Chem. Phys. 20 (1952) 517. 2) C. J. Marsden, et al. J. Mol.Struct. 131 (1985) 299. 3) W. Xu, et al. Mol. Phys. 102 (2004) 1415.
Fig. 1 Observed frequencies of the transitions from J = 2←1 up to 10←9, divided by 2(J +1)
A07
19

Some Theoretical Considerations on the Microwave Three-wave Mixing Experiments
Takayoshi AmanoJet Propulsion Laboratory, California Institute of Technology, Pasadena, CA 91109, USA
Patterson and Doyle demonstrated that optical iso-mers could be discriminated by using microwave three-wave mixing experiments [1]. Apparently their work wascarried out, being stimulated by a theoretical work onmicrowave triple resonance by Hirota [2]. Subsequentlytheir work was followed by several investigations per-formed by using similar techniques [3–8]. Grabow pre-sented theoretical background on this microwave three-wave mixing experiments [9]. Also Lobsiger et al. gavesimilar theoretical explanations [8].
For C1 enantiomers, all the dipole moment compo-nents along the principal moment of inertia axes are non-zero. The sign of the product of the three componentsshould be different for the different enantiomers. Thisis the reason why the experiments are designed to ob-serve the phenomena that depend on it; triple resonanceor microwave three-wave mixing. In this investigation,we present some theoretical background of those experi-ments which is similar to that given by Grabow [9]. How-ever, in the end, we will see a different factor which mightevoke a different perspective on the experiments.
Consider a three level system depicted in Fig. 1.Assume, for simplicity, that a system is similar to thatused in Patterson and Doyle; the transition between thelevels 1 and 2 is a c-type transition and between the lev-els 2 and 3 an a-type, and between the levels 1 and 3a b-type. The time evolution of the wave functions isgenerally described as a linear combination of the threeeigenstates with time dependent coefficients such as
Ψ(t) =∑i
ai(t)φ(i). (1)
The density matrix ρ is defined to be ρij = aia∗j as its ma-
c-type
a-type
b-type
FIG. 1: First shine a pulse radiation which is resonant tothe transition between the levels 1 and 2. Immediately afterthis pulse, we apply the second pulse to excite the transi-tion between the levels 2 and 3. Following these preparationprocesses, observe free induction decay from the level 3 to 1.
trix element. The time dependent density matrix equa-tion is given by
ihdρ
dt= [H, ρ], (2)
where the Hamiltonian H consists of the zero-th ordermolecular Hamiltonian and the interaction with the ap-plied external radiation field,
H = H0 +H′. (3)
We assume two resonant microwave radiations are ap-plied to excite the transitions between the levels 1 and 2and the levels 2 and 3. Therefore
H′ = −µE(t) (4)
E(t) = E0cos ωt+ E ′0cos ω′t (5)
where ω = (E2 − E1)/h and ω′ = (E3 − E2)/h. As thetransition between the levels 1 and 2 is a c-type tran-sition, the Rabi frequency Ω12(=µ12E0/h) can be writ-ten as iΩ, and accordingly Ω21 = −iΩ with Ω being areal quantity by adapting the phase convention used inmicrowave spectroscopy ( see, for example, Townes andSchawlow ). For the transition between the levels 2 and3, Ω23 = Ω32 = Ω′, and Ω′ is real.
By using the rotating wave approximation,
ρ12 = ρ12eiωt, ρ23 = ρ23e
iω′t, ρ13 = ρ13eiωteiω
′t,
and by defining three Bloch vector components for eachof the three transitions,
uc = ρ12 + ρ21, vc = i(ρ21 − ρ12), wc = ρ11 − ρ22
ua = ρ23 + ρ32, va = i(ρ32 − ρ23), wa = ρ22 − ρ33
ub = ρ13 + ρ31, vb = i(ρ31 − ρ13), wb = ρ11 − ρ33
the equations of motion can be written as
uc = Ωwc +Ω′
2vb, vc = −Ω′
2ub, wc = −Ωuc − Ω′
2va
ua =Ω
2ub, va = −Ω′wa +
Ω
2vb, wa =
Ω
2uc + Ω′va
ub =Ω′
2vc − Ω
2ua, vb = −Ω′
2uc − Ω
2va, wb = −Ω
2uc +
Ω′
2va.
Suppose first we apply a pulse radiation field which isresonant to the c-type transition of the time duration of∆t to excite the transition between the levels 1 and 2.Then we obtain,
uc(∆t) = wc(0)sin(Ω∆t)
vc(∆t) = wc(0)cos(Ω∆t)
wa(∆t) =1
2wc(0)[1− cos(Ω∆t)] + wa(0)
wb(∆t) = −1
2wc(0)[1− cos(Ω∆t)] + wb(0),
A08
20

with all other components to be zero. Following thispulse, we apply a resonant radiation to excite the a-typetransition between the levels 2 and 3.
ua(t) = 0
va(t) = −(1
2wc(0)[1− cos(Ω∆t)] + wa(0))sinΩ′(t−∆t)
wa(t) = (1
2wc(0)[1− cos(Ω∆t)] + wa(0))cosΩ′(t−∆t)
ub(t) = 0
vb(t) = wc(0)sin(Ω∆t)sinΩ′
2(t−∆t)
wb(t) = −1
2(wa(0))(1− cosΩ′(t−∆t)) + wb(0)
uc(t) = wc(∆t)sin(Ω∆t)cosΩ′
2(t−∆t)
vc(t) = 0
wc(t) =1
2wc(0)cos(Ω∆t)(1− cosΩ′(t−∆t))
+ wc(0)cos(Ω∆t).
Now we see that the polarization of the b-type transi-tion is induced through this “double resonance” process.The induced polarization is expressed for this transitionas
P = NTr(µρ) (6)
It can be written explicitly as
P = N(µ13ρ31 + µ31ρ13)
= Nµ[(ρ31 + ρ13)cosω′′t− i(ρ31 − ρ13)sinω′′t] (7)
where ω′′ = ω+ω′. Here we assume the matrix elementsof the dipole moment, µ13 and µ31, are real and equal,and designated as µ, but the sign can be either positive ornegative. This induced polarization generates the electricfield and the relationship between the two is given by
P =1
2χE0eiω
′′t + c.c. (8)
where χ is complex susceptibility, χ = χ′ − iχ′′. Thesusceptibility is related to the density matrix elements as
follows;
χ′E0 = Nµ(ρ31 + ρ13) = Nµub (9)
χ′′E0 = iNµ(ρ31 − ρ13) = Nµvb (10)
Power emitted (or absorbed) is given by
W = E∂P
∂t=ω′′
2E20χ′′
Therefore we obtain
W = Nω′′
2E0µwc(0)sin(Ω∆t)sin
Ω′
2(t−∆t)
= (N1(0)−N2(0))ω′′
2E0µsin(Ω∆t)sin
Ω′
2(t−∆t)
(11)The emitted power is maximized by applying sequen-
tially π/2- and π-pulses. As formulated above, the in-duced polarization from the two-step pumping processappears to depend on the product of the matrix elementsof the three dipole moment components, µa, µb, and µc.In the treatment presented above, the Rabi frequenciesare implicitly assumed to be the signed quantities. Thisassumption should be examined carefully. In all cases fortwo level systems, the sign of the dipole moment doesnot matter, and we automatically use the absolute valueof the dipole moment in calculating the Rabi frequency.In general, the oscillation frequency of the polarizationis given by Ω = ±
√(ω − ω0)2 + Ω2, as the radiation fre-
quency may not be in exact resonance. The sign of Ωcan be either positive or negative, but the sign has noth-ing to do with the sign of the dipole moment. It shouldbe noted that, in the microwave three-wave mixing ex-periments done so far, the process was the three-stepsequential two-level processes. If the sign of the prod-uct of the three dipole moment components really playsa role, the power given in eq.(11) indicates emission forone enantiomer, on the other hand the signal correspondsto absorption for the other enantiomer. This is not rea-sonable.
[1] D. Patterson and J. M. Doyle. Phys. Rev. Lett.,111,023008(2013).
[2] E. Hirota. Proc. Jpn. Acad. B, 88,120-128(2012).[3] D. Patterson, M. Schnell, and J. M. Doyle. Nature,
497,475-478(2013).[4] D. Patterson and M. Schnell. Phys. Chem. Chem. Phys.,
16,11114-11123(2014).[5] V. A. Shubert, D. Schmitz, D. Patterson, J. M. Doyle, and
M. Schnell. Angew. Chem. Int. Ed., 53,1152-1155(2014).[6] V. A. Shubert, D. Schmitz, and M. Schnell. J. Mol. Spec-
trosc., 300,31-36(2014).[7] V. A. Shubert, D. Schmitz, C. Medcraft, A. Krin, D. Pat-
terson, J. M. Doyle, and M. Schnell. J. Chem. Phys.,142,214201(2015).
[8] S. Lobsiger, C. Perez, L. Evangelisti, K. K. Lehmann, andB. H. Pate. J. Phys. Chem. Lett., 6,196-200(2015).
[9] J. Grabow. Angew. Chem. Int. Ed., 52,11698-11700(2013).
A08
21

Infrared Spectrum of Hydrogen Fluoride Anion Isolated in Solid Argon
(NSRRC) Yu-Jong Wu, Meng-Chen Liu, Chih-Hao Chin, Tzu-Ping Huang
E-mail: [email protected]
Hypervalent molecules are one of the exceptions to the octet rule. Bonding in most
hypervalent molecules is well rationalized by the Rundle–Pimentel model (three-center
four-electron bond), and high ionic bonding between the ligands and the central atom
is essential for stabilizing hypervalent molecules. Here, we produced one of the
simplest hypervalent anions, HF−, which is known to deviate from the Rundle–Pimentel
model, and identified its ro-vibrational features shown in Fig. 1. High-level ab inito
calculations reveal that its bond dissociation energy is comparable to that of dihalides,
as supported by secondary photolysis experiments with irradiation at various
wavelengths. The charge distribution analysis suggested that the F atom of HF− is
negative and hypervalent and the bonding is more covalent than ionic.
Fig. 1 Partial IR spectra of electron-bombarded (2000 eV, 0.3 mA) matrix samples at
10 K. (A) CH3F/Ar (1/500), (B) CH4/Ar (1/500), and (C) Ar. The ro-vibrational transitions
of the observed bands are assigned.
A09
22

Variation of H-bond properties with density in astrophysical ice structures
(Instituto de Estructura de la Materia, IEM-CSIC, Madrid, Spaina, Universidad Complutense
de Madrid, Madrid, Spainb, Institute of Low Temperature Science, Hokkaido University,
Sapporo, Japanc)
Rafael Escribanoa, Pedro C. Gómezb, Víctor J. Herreroa
, Naoki Watanabec
([email protected], [email protected], [email protected],
The interpretation of infrared measurements of remote sources, like in astronomical missions,
often relies on the knowledge of the density of the sample measured by other means. For icy
samples containing water, the analysis of the infrared spectra may reveal the presence of
different kinds of O-H bonding types, from free or nearly free O-H bonds to O-H…O hydrogen
bonds of diverse strength. Each bonding type has a different signature, but also this signature
may vary with the density of the sample.
We have chosen for this investigation a mixture of water and methane, plus a relevant amount
of nitrogen, frozen at 50 K, to simulate the possible content of a spot at the surface of Pluto,
the Pulfrich crater [1], recently observed by the New Horizons mission. By varying the size of
the cell containing this mixture of molecules, we can study the effect of the corresponding
density of the sample on the predicted IR spectra.
We have covered a large density range, from a very low value that simulates a gas-phase
mixture, to values corresponding to solids under fairly high internal stress, with a middle range
that could be expected to cover the values of mixtures at astronomical conditions.
Fig. 1. Sample with density 0.75 g
cm-3. Two unit cells are shown to
better appreciate the optimized
structure. Note the apparent
porosity of the sample.
Fig. 2. Predicted IR spectrum of the
sample in Fig. 1.
References
[1] W.M. Grundy et al, Science 351, aad9189, 2016.
A10
23

Infrared spectra of protonated aniline in solid para-hydrogen
Yu-Syuan Chena, Masashi Tsugea and Yuan-Pern Leea,b
aDepartment of Applied Chemistry and Institute of Molecular Science, National Chiao-Tung University, Hsinchu 30010, Taiwan
bInstitute of Atomic and Molecular Sciences, Academia Sinica, Taipei 10617, Taiwan
Aniline is a prototypical aromatic amine. It
contains two types of basic centers that can accept an
approaching proton, namely the amino group and the
aromatic ring. The alkaline properties of aniline in
solution result from the stabilization of the
nitrogen-protonated form when solvated. However, the
site of protonation in gaseous aniline is unclear [1].
Previously, the studies on protonated aniline in the gas
phase are mainly based on mass spectrometry and thus
provide only indirect, and sometimes ambiguous,
information about the preferred protonation site of
aniline [2]. Therefore, understanding the protonation
site of aniline without solvent is desirable.
A new method for investigating the IR spectra of protonated species and their
neutral counterparts was developed in our laboratory using electron bombardment
during deposition of a gaseous mixture of para-hydrogen (p-H2) matrix host
containing a small proportion of guest molecules. This method produces mainly
protonated parent molecules and corresponding neutrals without fragmentation; the
IR spectra show true absorption intensity with small linewidths, excellent
signal-to-noise ratio, and wide spectral coverage [3].
We applied this technique to investigate the IR spectrum of protonated aniline
in a solid p-H2 matrix. We grouped spectral lines into various species according
to their behaviors after maintaining in darkness and upon secondary photolysis;
the assignments were derived on comparison with quantum-chemical calculations
using the B3LYP/CC-pVTZ method. The results indicate that three protonated isomers
are observed: protonation on carbon 2 (absorption lines at 3479.0, 3391.8, 1666.7,
1503.9, 1451.8, 1418.9, 1341.5, 1188.1, 776.7 and 736.3 cm-1), on carbon 4
(absorption lines at 3482.5, 3395.2, 1669.0, 1523.1, 1337.1, 1197.5, 886.4, 884.1
and 816.8 cm-1), and on the nitrogen atom (absorption lines at 3302.8, 3278.8 and
3236.0 cm-1); the numbering of the carbon atoms is shown in the Figure.
[1] F. M. Pasker, N. Solcà and O. Dopfer, J. Phys. Chem. A. 110, 12793 (2006).
[2] M. J. Nold and C. Wesdemiotis, J. Mass. Spectrom. 31, 1169 (1996).
A11
24
[3] M. Bahou, P. Das, Y. -F. Lee, Y. -J. Wu and Y. -P. Lee, Phys. Chem. Chem. Phys.
16, 2200 (2014).
A11
25

Phonon-mediated nuclear spin relaxation of H2O trapped in Ar matrix
(Gakushuin Univ.) Koichiro Yamakawa, Shinya Azami, Ichiro Arakawa
Water molecules are classified into two kinds of nuclear spin isomers, i.e., ortho
and para, just like hydrogen molecules. The abundance ratio of ortho to para, so called
ortho-to-para ratio (OPR), has attracted much attention in the fields of astronomy and
interstellar physics [1,2]. Since the nuclear spin conversion (NSC) of gaseous H2O
through radiation is extremely slow [3], one assumed that OPR provides information of
the temperature where an interstellar medium was formed [1]. However, recent
investigations have revealed that NSC of H2O proceeds much faster in condensed systems
[4,5]. Thus, interest in the NSC mechanism and channels is getting greater. In the
present work, we devised a theoretical model of the phonon-mediated nuclear spin
relaxation of H2O trapped in cryomatrices to correctly describe the temperature
dependence of the NSC rate [6]. For the purpose of testing the validity of this model,
we also monitored the rotational relaxation of H2O in solid Ar associated with the
nuclear spin flip to experimentally obtain the NSC rates in the temperature range of
5-15 K.
After baking at 373 K for 24 hours, the interior of a vacuum chamber went below
1 10-8 Pa. An oxygen-free copper block was screwed in the bottom of a helium
continuous-flow cryostat, which was mounted on the vacuum chamber. A 15 15 5 mm3
gold plate mechanically fixed on the copper block was used for the substrate.
Temperature of the substrate was measured with a silicon diode sensor and was raised
with a heater wrapped around the bottom part of the cryostat. The substrate and block
were covered with a radiation shield attached to the cryostat, so that the helium flow
made the substrate temperature as low as 5.2 K. The gases of H2O and Ar were mixed in
the gas handling system equipped with a quartz oscillator gage; distilled water was
preliminarily degassed by multiple freeze-pump-thaw cycles whereas the Ar gas (99.9999%
purity) was used without further purification. The molar ratio of Ar to H2O was set
to be 1.0 104 using the standard manometric technique. The mixed gas was dosed through
a variable leak valve onto the substrate kept at 13 K. Infrared spectra were recorded
with a Fourier transform infrared spectrometer and a HgCdTe detector at the resolution
of 2 cm-1. We used the reflection configuration, where the incident angle of infrared
light was 80 degrees. The whole optical path was evacuated in order to eliminate infrared
absorption by atmospheric CO2 and H2O.
In Fig. 1, time evolution of the infrared spectrum of H2O in solid Ar is shown.
The time when the substrate temperature settled at 7.0 K was set to be 0 s. Sharp
absorption peaks at 1608 (O1), 1624 (P1), and 1636 cm−1 (O2) are assigned to the 110 ←
101, 111 ← 000, and 212 ← 101 rovibrational transitions of H2O, respectively [7,8]. In
the notation of Jkk’, the quantum number of the rotational angular momentum is denoted
by J , and that of its projection on the a (c) axis of H2O is expressed by k (k’).
While P1 corresponds to the transition of para H2O, O1 and O2 originate from the ortho
species. P1 grew with increasing time whereas O1 and O2 decayed. This time evolution
A12
26
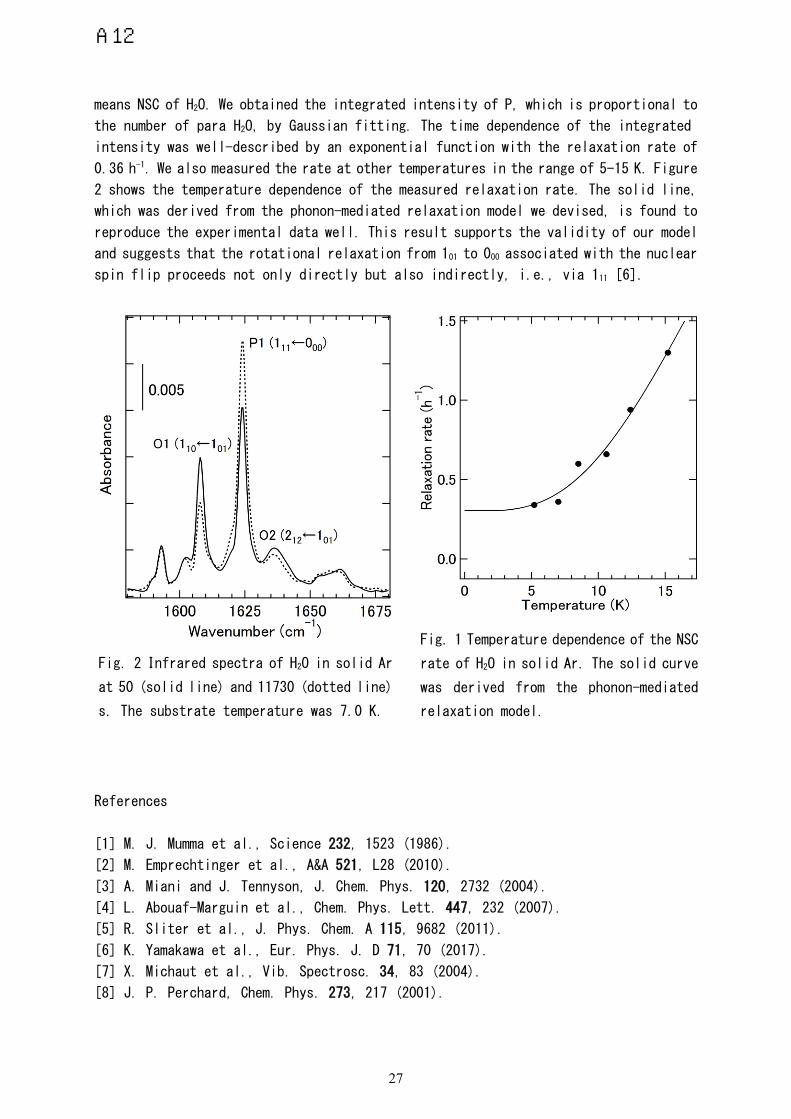
means NSC of H2O. We obtained the integrated intensity of P, which is proportional to
the number of para H2O, by Gaussian fitting. The time dependence of the integrated
intensity was well-described by an exponential function with the relaxation rate of
0.36 h-1. We also measured the rate at other temperatures in the range of 5-15 K. Figure
2 shows the temperature dependence of the measured relaxation rate. The solid line,
which was derived from the phonon-mediated relaxation model we devised, is found to
reproduce the experimental data well. This result supports the validity of our model
and suggests that the rotational relaxation from 101 to 000 associated with the nuclear
spin flip proceeds not only directly but also indirectly, i.e., via 111 [6].
References
[1] M. J. Mumma et al., Science 232, 1523 (1986).
[2] M. Emprechtinger et al., A&A 521, L28 (2010).
[3] A. Miani and J. Tennyson, J. Chem. Phys. 120, 2732 (2004).
[4] L. Abouaf-Marguin et al., Chem. Phys. Lett. 447, 232 (2007).
[5] R. Sliter et al., J. Phys. Chem. A 115, 9682 (2011).
[6] K. Yamakawa et al., Eur. Phys. J. D 71, 70 (2017).
[7] X. Michaut et al., Vib. Spectrosc. 34, 83 (2004).
[8] J. P. Perchard, Chem. Phys. 273, 217 (2001).
Fig. 2 Infrared spectra of H2O in solid Ar
at 50 (solid line) and 11730 (dotted line)
s. The substrate temperature was 7.0 K.
Fig. 1 Temperature dependence of the NSC
rate of H2O in solid Ar. The solid curve
was derived from the phonon-mediated
relaxation model.
A12
27

Cross-Contamination of the Fitting Parameters in Multidimensional Tunneling
Treatments
(Kanazawa University, Kanazawa, Japana, NIST, Gaithersburg, MD, USAb) Nobukimi Ohashia,
Jon T. Hougenb
In this talk we examine the two-dimensional tunneling formalism used previously
to fit the hydrogen-transfer and internal-rotation splittings in the microwave spectrum
of 2-methylmalonaldehyde in an effort to determine the origin of various
counterintuitive results concerning the isotopic dependence of the internal-rotation
splittings in that molecule. We find that the cause of the problem lies in a “parameter
contamination” phenomenon, where some of the numerical magnitude of splitting
parameters from modes with large tunneling splittings “leaks into” the parameters
of modes with smaller tunneling splittings. We find that such parameter contamination,
which greatly complicates the determination of barrier heights from the
least-squares-fitted splitting parameters, will be a general problem in spectral fits
using the multi-dimensional tunneling formalism, since it arises from subtle
mathematical features of the non-orthogonal framework functions used to set up the
tunneling Hamiltonian. Transforming to a physically less intuitive orthonormal set
of basis functions allows us to give an approximate numerical estimate of the
contamination of tunneling parameters for 2-methylmalonaldehyde by combining a
dominant tunneling path hypothesis with results recently given for the
hydrogen-transfer--internal-rotation potential function for this molecule.
A13
28

Conformational Structures of Indole-3-acetic Acid by UV-UV hole-burning and
IR-dip spectroscopy
(Gyeongsang Nat. Univ.) Yeon Guk Seong, Cheol Joo Moon, Ahreum Min, Ahreum Ahn, Myong
Yong Choi ([email protected])
Indole-3-acetic acid (IAA) is the most common plant hormone that plays an essential
role in the regulation of plant growth and fruit development. The special role in nature
has led us to investigate the intrinsic properties of IAA in the gas phase. We have
measured the electronic spectra of IAA by employing a resonant two-photon ionization
(R2PI) and UV-UV hole-burning (UV-UV HB) technique in the free jet conditions. As a
result, we identified three different conformers of IAA. A combination of infrared-dip,
R2PI, UV-UV HB spectroscopy is used to characterize the IAA conformers. Further
investigation with ab initio and density functional theory calculations of IAA is
carried out for the study of potential energy landscapes of IAA.
A14
29

Rapid Non-radiative Decay of Jet-cooled 2-hydroxyformanilide: IR-dip
Spectroscopy and Computational Studies
(Gyeongsang Nat. Univ.) Cheol Joo Moon, Yeon Guk Seong, Ahreum Min, Ahreum Ahn, Myong
Yong Choi ([email protected])
In this study, we present the conformational investigations and excited state dynamics
of jet-cooled 2-hydroxyformanilide (2-HFA). The number of conformers and their
structures of 2-HFA are assigned on the basis of resonance enhanced multiphoton
ionization (REMPI), ultraviolet-ultraviolet hole burning (UV–UV HB), infrared-dip
(IR-dip) spectroscopy. From comparison between REMPI and UV–UV HB spectra, three
species coexist in the supersonic jet. Two species among them are 2-HFA-AC (Anti and
Cis) and the other is 2-HFA-AT (Anti and Trans). The similar UV-UV HB spectra are due
to the anharmonic coupling between the peptide group and some ring deformations in the
excited state. We speculate that the observance of IR upstream in the IR-dip spectrum
might come from the contribution of 2-HFA-ST (Syn and Trans). The structures of these
conformers are determined by the IR-dip spectroscopy and Franck−Condon simulations.
Also, the observed spectra are compared with the predictions of ab initio and density
functional theory calculations.
A15
30

High-resolution Fourier transform emission spectroscopy of
the A2ΠΠΠΠi - X
2ΠΠΠΠi band of the OCS
+ ion
Yoshihiro Nakashima, Kensuke Harada,Keiichi Tanaka and Takehiko Tanaka
Department of Chemistry, Faculty of Sciences, Kyushu University,
Motooka, Nishiku, Fukuoka 819-0395, Japan
High resolution Fourier transform (FT) emission spectroscopy of the A2Πi - X2
Πi band of OCS+
generated by Penning ionization with metastable He* atom was performed in the 370 - 490 nm UV region
at a resolution of 0.03 cm-1. The ν1 (CO stretching) progression bands from the ground vibrational state of
A2Πi to the ν1 excited states of X2
Πi were observed for the v1 = 0 ← 2 - 5 bands of the Ω = 3/2 and 1/2
components. The parity doubling were resolved for the P- and R-branch lines for Ω = 1/2.
Observed ν1 progression bands were analyzed together with the origin bands reported by LIF study to
give the accurate molecular constants of OCS+. The spin-orbit interaction constants A0 determined are
-381.0(56) and -126.5(56) cm-1, respectively, for the X2Πi and A2
Πi states to agree with the previously
reported ones. The CO bond length for the A2Πi state is longer by 0.1756 Å than that for the X2
Πi state,
while the CS bond length shorter by 0.0905 Å, as determined by the observed rotational constants B0 and
Franck-Condon factors, implying the excited state has much weaker CO bond than that of the ground state.
The large change in the molecular structure between A2Πi and X2
Πi causes the prominent ν1 progression
bands observed in the present FT emission spectrum.
<<<<Introduction>>>> For the OCS+ ion, observation
of the A2Πi - X2
Πi emission band is limited only
from the vibrational ground state of A2Πi to the ν1
(CO stretch) vibrational excited states of the X2Πi
state (Fig. 1). It is because the internal conversion
(IC) occurs from the A2Πi state to the highly excited
vibrational levels of X2Πi state and the OCS+ ion
rapidly predissociates to S+(4Su) + CO(X1Σ
+) due to
the crossing of a repulsive 4Σ
− state. In the present
study1), we report a Fourier transform (FT) emission
spectroscopy of the A2Πi - X2
Πi band of OCS+ for
both the Ω=3/2 and 1/2 spin components to give the
accurate molecular constants in the X2Πi state. <<<<Experiment>>>> The OCS+ ion was generated by
Penning ionization of OCS with metastable helium
atoms, He*+OCS → He+ (OCS+)*. Emitted UV light was introduced to a FT spectrometer (Brucker
IFS-120 HR) to be recorded with a resolution of 0.03 cm-1 accumulating for 60 hours in total. Four
CO-stretch progression bands (v1= 0→2-5) were observed in the frequency range of 21,000-27,000 cm-1
Fig.1 AFig.1 AFig.1 AFig.1 A----X Emission BandsX Emission BandsX Emission BandsX Emission Bands of of of of OCSOCSOCSOCS++++
A16
31
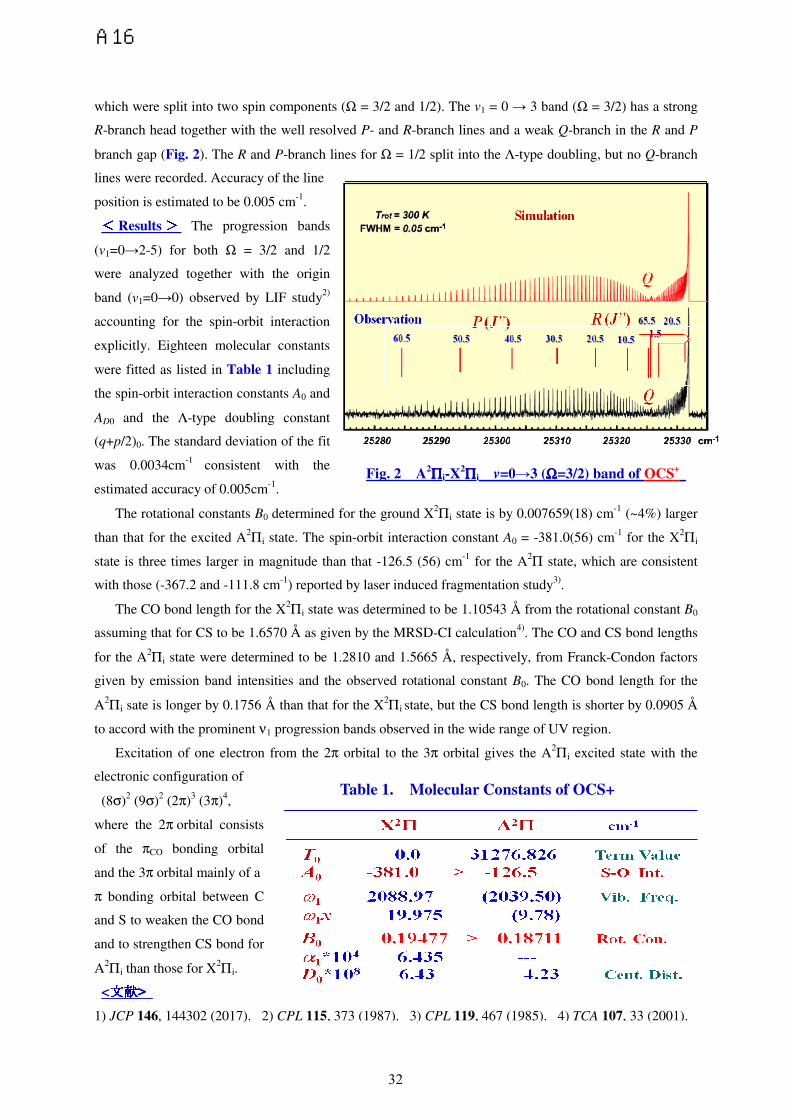
which were split into two spin components (Ω = 3/2 and 1/2). The v1 = 0 → 3 band (Ω = 3/2) has a strong
R-branch head together with the well resolved P- and R-branch lines and a weak Q-branch in the R and P
branch gap (Fig. 2). The R and P-branch lines for Ω = 1/2 split into the Λ-type doubling, but no Q-branch
lines were recorded. Accuracy of the line
position is estimated to be 0.005 cm-1. <<<<Results>>>> The progression bands
(v1=0→2-5) for both Ω = 3/2 and 1/2
were analyzed together with the origin
band (v1=0→0) observed by LIF study2)
accounting for the spin-orbit interaction
explicitly. Eighteen molecular constants
were fitted as listed in Table 1 including
the spin-orbit interaction constants A0 and
AD0 and the Λ-type doubling constant
(q+p/2)0. The standard deviation of the fit
was 0.0034cm-1 consistent with the
estimated accuracy of 0.005cm-1.
The rotational constants B0 determined for the ground X2Πi state is by 0.007659(18) cm-1 (~4%) larger
than that for the excited A2Πi state. The spin-orbit interaction constant A0 = -381.0(56) cm-1 for the X2
Πi
state is three times larger in magnitude than that -126.5 (56) cm-1 for the A2Π state, which are consistent
with those (-367.2 and -111.8 cm-1) reported by laser induced fragmentation study3).
The CO bond length for the X2Πi state was determined to be 1.10543 Å from the rotational constant B0
assuming that for CS to be 1.6570 Å as given by the MRSD-CI calculation4). The CO and CS bond lengths
for the A2Πi state were determined to be 1.2810 and 1.5665 Å, respectively, from Franck-Condon factors
given by emission band intensities and the observed rotational constant B0. The CO bond length for the
A2Πi sate is longer by 0.1756 Å than that for the X2
Πi state, but the CS bond length is shorter by 0.0905 Å
to accord with the prominent ν1 progression bands observed in the wide range of UV region.
Excitation of one electron from the 2π orbital to the 3π orbital gives the A2Πi excited state with the
electronic configuration of
(8σ)2 (9σ)2 (2π)3 (3π)4,
where the 2π orbital consists of the πCO bonding orbital and the 3π orbital mainly of a
π bonding orbital between C
and S to weaken the CO bond and to strengthen CS bond for
A2Πi than those for X2
Πi.
<文文文文献献献献>>>>
1) JCP 146, 144302 (2017). 2) CPL 115, 373 (1987). 3) CPL 119, 467 (1985). 4) TCA 107, 33 (2001).
Fig. 2 A2ΠΠΠΠi-X
2ΠΠΠΠi v=0→3 (ΩΩΩΩ=3/2) band of OCS
+
Table 1. Molecular Constants of OCS+
A16
32

Quantum Zeno effect in field-free methanol gas
(Shandong Univ.a, Kashigar Univ.b),
Zhen-Dong Suna,b
The quantum Zeno effect has been observed for the ultra-cold 9Be+ ions in a magnetic
field[1] and at room temperature for 13CH3F gas in an external electric field[2]. Now we
demonstrate the observation of the quantum Zeno effect at room temperature in field-free
methanol (CH3OH) gas.
The CH3OH molecule has the torsion of the CH3 group and of the OH group with
respect to each other[3]. The molecules of CH3OH gas are mixed by different species of
nuclear-spin isomers (NSIs) whose nuclear spins of identical nuclei in the CH3 group are
entangled with each other. It is from the three spin–1/2 hydrogen nuclei of this CH3 group
that the ortho-CH3OH and para-CH3OH are modified, which has a total nuclear spin
quantum number I = 3/2 and 1/2, respectively. We show in this study that the ortho-para
conversion of CH3OH isomers can be induced by non-magnetic molecular collisions in a
quantum relaxation process from a non-equilibrium concentration of them prepared by a
technique of Light-induced drift[4] towards the zero equilibrium level of their populations.
The ortho-para conversion rates have been obtained by using a least-square method to fit
an exponential function to the observed curves of the population variations of the ortho
and para isomers at low pressures from 0.3 to 2 Torr. The pressure dependence of the
obtained conversion rates clearly show the inhibition of the interconversion between the
ortho-CH3OH and para-CH3OH isomers by frequent collisions of the re-population
molecules with increasing pressures. We attribute this interesting quantum phenomenon
to the NSIs-torsion-specific states-mixing systems of CH3OH. The torsion mediates the
intermodes couplings for the strongly mixing near-degenerate ortho–para level pairs and
providing doorway channels for population and intramolecular energy re-distribution[5].
Usually the energy gaps between two states of molecular ions and molecules can be
narrowed via splitting of the levels by the applied external electric and/or magnetic field.
Here, the observation of the quantum Zeno effect at room temperature is the first time for
a field-free gas induced by non-magnetic molecular collisions.
A17
33

I express sincere thanks to Profs. Kojiro Takagi, Yoshiki Moriwaki, Fusakazu Matsushima,
and R. M. Lees for very helpful discussions. I acknowledge financial support from the National
Natural Science Foundation of China (Grants No. 91536105 and 11174186).
References
[1] W. M. Itano, D. J. Heinzen, J. J. Bollinger, and D. J. Wineland, Phys. Rev. A 41, 2295 (1990).
[2] B. Nagels, L. J. F. Hermans, and P. L. Chapovsky, Phys. Rev. Lett. 79, 3097 (1997).
[3] G. Moruzzi, B. P. Winnewiser, M. Winnewiser, I. Mukhopadhyay, and F. Strumia,
Microwave, Infrared and Laser Transitions of Methanol: Atlas of Assigned Lines from 0 to
1258 cm-1 (CRC Press, Boca Raton, FL, 1995).
[4] F. Kh. Gel’mukhanov and A. M. Shalagin, JETP Lett. 29, 711(1979).
[5] R. M. Lees, L.-H. Xu, J. W. C. Johns, B. P. Winnewisser, and M. Lock, J. Mol. Spectrosc.
243, 168 (2007).
A17
34
Ab Initio Calculations of Torsionally Mediated Hyperfine Splittings in E States of
Acetaldehyde
Li-Hong Xu1, E.M. Reid1, B. Guislain1, J.T. Hougen2, E.A. Alekseev3,4, I. Krapivin3
1 Department of Physics and Centre for Laser, Atomic, and Molecular Sciences,
University of New Brunswick, Saint John, NB, E2L 4L5, Canada
2 Sensor Science Division, National Institute of Standards and Technology,
Gaithersburg, MD 20899-8441, USA. 3 Institute of Radioastronomy of National Academy of Sciences of Ukraine,
Chervonopraporna 4, 61002 Kharkov, Ukraine. 4 Quantum Radiophysics Department of V.N. Karazin Kharkiv National University,
Svobody Square 4, 61022, Kharkov, Ukraine
Hyperfine splittings in methanol (CH3OH) have been revisited in three recent
publications.
[i] Coudert et al. [JCP 143 (2015) 044304] published an analysis of splittings observed
in the low-J range. They calculated 32 spin-rotation, 32 spin-spin, and 16 spin-torsion
hyperfine constants using the ACES2 package. Three of these constants (czz0, czz
0,h and
sz0,h) were adjusted to fit hyperfine patterns for 12 transitions.
[ii] Three present authors and collaborators [JCP 145 (2016) 024307] analyzed medium
to high-J experimental Lamb-dip measurements in methanol and presented a theoretical
spin-rotation explanation that was based on torsionally mediated spin-rotation hyperfine
operators. These contain, in addition to the usual nuclear spin and overall rotational
operators, factors in the torsional angle of the form ein. Such operators have non-
zero matrix elements between the two components of a torsion-rotation trE state, but
have zero matrix elements within a trA state. More than 55 hyperfine splittings were
successfully fitted using three parameters (cxx2, cyy
2, and cxy2) and the fitted values agree
well with ab initio values obtained in [i]. [iii] Lankhaar et al. [JCP 145 (2016) 244301]
published a reanalysis of the data set from [i], using CFOUR recalculated hyperfine
constants based on their rederivation of the relevant expressions. They explain why
their choice of fixed and floated parameters leads to numerical values for all parameters
that seem to be more physical than those in [i]. The results in (ii) raise the question of
whether large torsionally-mediated spin-rotation splittings will occur in other methyl-
rotor-containing molecules. This abstract presents ab initio calculations of torsionally
mediated hyperfine splittings in the E states of acetaldehyde using the same three
operators as in [ii], and spin-rotation constants computed by Gaussian09. We explore
the first 13 K states for J from 10 to 40 and t = 0, 1, and 2. Our calculations indicate
that hyperfine splittings in CH3CHO are just below current measurement capability.
This conclusion is confirmed by available experimental measurements.
Keywords by relevance: Large amplitude motions, internal rotation – (Hyper)fine
structure, tunneling – Microwave and THz – Theory and Computation
A18
35

Molecular Vibronic Spectra in Solution Simulated by Damped
Franck-Condon Factors
Chen-Wen Wang, Chaoyuan Zhu and Sheng-Hsien Lin
Department of Applied Chemistry, National Chiao-Tung University,
1001, Ta-Hsueh Rd., Hsinchu 300, Taiwan
E-mail address: [email protected]
Abstract Franck-Condon factors bridge the gap between theoretical modeling and experimental
observations for molecular electronic spectroscopy and electron transfer. Under the displaced
harmonic oscillator approximation, multidimensional Franck-Condon factors are decomposed
into a product of many one-dimensional (1D) Franck-Condon (FC) factors, which are
successfully applied to simulate molecular vibronic spectra in gases phase. For dealing with
simulation of the spectra in solution, various ab. initio methods, such as polarizable
continuum model (PCM) and explicit solvent model, added correction in static interactions
between solute and solvent molecules. However, how to treat dynamic correction to the
spectra is not well-studied. We have recently developed the dynamic correction method
leading to direct modification of Franck-Condon factors by damped oscillators. This method
was applied to simulate absorption and fluorescence spectra of perylene, isoquinoline, rubrene
molecule in solutions. The present simulation presents nice physical insights for dynamic
correction to solvent-enhanced vibronic spectra.
References
[1] C.-W. Wang, L. Yang, C. Zhu, J.-G. Yu and S. H. Lin, J. Chem. Phys. 141, 2014,
084106.
[2] Y. H. Liu, S. M. Wang, C.-W. Wang, C. Zhu, K.-L. Han and S. H. Lin, J. Chem. Phys.
145, 2016, 164314.
[3] Y. Hu, C.-W. Wang, C. Zhu, F. L. Gu and S. H. Lin, RSC Adv., 2017,7, 12407.
A19
36
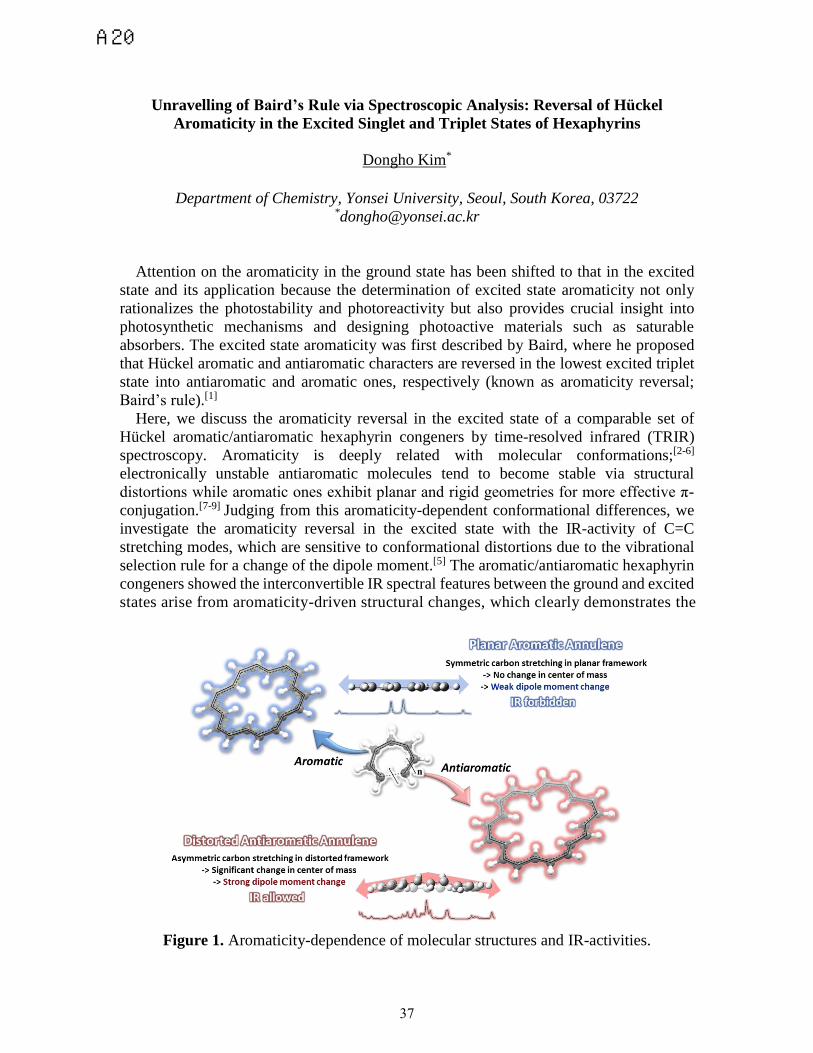
Unravelling of Baird’s Rule via Spectroscopic Analysis: Reversal of Hückel
Aromaticity in the Excited Singlet and Triplet States of Hexaphyrins
Dongho Kim*
Department of Chemistry, Yonsei University, Seoul, South Korea, 03722 *[email protected]
Attention on the aromaticity in the ground state has been shifted to that in the excited
state and its application because the determination of excited state aromaticity not only
rationalizes the photostability and photoreactivity but also provides crucial insight into
photosynthetic mechanisms and designing photoactive materials such as saturable
absorbers. The excited state aromaticity was first described by Baird, where he proposed
that Hückel aromatic and antiaromatic characters are reversed in the lowest excited triplet
state into antiaromatic and aromatic ones, respectively (known as aromaticity reversal;
Baird’s rule).[1]
Here, we discuss the aromaticity reversal in the excited state of a comparable set of
Hückel aromatic/antiaromatic hexaphyrin congeners by time-resolved infrared (TRIR)
spectroscopy. Aromaticity is deeply related with molecular conformations;[2-6]
electronically unstable antiaromatic molecules tend to become stable via structural
distortions while aromatic ones exhibit planar and rigid geometries for more effective π-
conjugation.[7-9] Judging from this aromaticity-dependent conformational differences, we
investigate the aromaticity reversal in the excited state with the IR-activity of C=C
stretching modes, which are sensitive to conformational distortions due to the vibrational
selection rule for a change of the dipole moment.[5] The aromatic/antiaromatic hexaphyrin
congeners showed the interconvertible IR spectral features between the ground and excited
states arise from aromaticity-driven structural changes, which clearly demonstrates the
Figure 1. Aromaticity-dependence of molecular structures and IR-activities.
A20
37

aromaticity reversal in the excited state. Our unconventional findings by the IR
spectroscopy will provide deeper insight into the effect of aromaticity reversal on the
photochemical synthesis as well as the photostability and photoreactivity for photoactive
materials.
[1] Baird, N. C. J. Am. Chem. Soc. 1972, 94, 4941–4948.
[2] Sung, Y. M.; Yoon, M. C.; Lim, J. M.; Rath, H.; Naoda, K.; Osuka, A.; Kim, D. Nat.
Chem. 2015, 7, 418–422.
[3] Sung, Y. M.; Oh, J.; Kim, W.; Mori, H.; Osuka, A.; Kim, D. J. Am. Chem. Soc. 2015,
137, 11856–11859.
[4] Oh, J.; Sung, Y. M.; Kim, W.; Mori, S.; Osuka, A.; Kim, D. Angew. Chem. Int. Ed.
2016, 55, 6487-6491.
[5] Sung, Y. M.; Oh, J.; Naoda, K.; Lee, T.; Kim, W.; Lim, M.; Osuka, A.; Kim, D.
Angew. Chem. Int. Ed. 2016, 55, 11930–11934.
[6] Hong, Y.; Oh, J.; Sung, Y. M.; Tanaka, Y.; Osuka, A.; Kim, D. Angew. Chem. Int. Ed.
2017, 56, 2932-2936.
[7] Sung, Y. M.; Oh, J.; Cha, W.; Kim, W.; Lim, J. M.; Yoon, M. C.; Kim, D. Chem. Rev.
2017, 117, 2257-2312.
[8] Cha, W.; Kim, T.; Ghosh, A.; Zhang, Z.; Ke, X.; Ail, R.; Lynch, V. M.; Jung, J.; Kim,
W.; Lee, S.; Fukuzumi, S.; Park, J. S.; Sessler, J.; Chandrashekar, T. K.; Kim, D. Nat.
Chem. Under revision.
[9] Ueda, M.; Jorner, K.; Sung, Y. M.; Mori, T.; Kim, D.; Ottosson, H.; Aida, T.; Itoh, Y.
Nat. Commun. Under revision.
A20
38

Theoretical Study on Geometrical Isotope Effect and
Rotational Constants of Polyatomic Molecules
(Hiroshima Univ.a, Kyoto Univ.b, Conflex Corp.c, FOCUSd) Takayoshi Ishimotoa,
Masaaki Babab, Naofumi Nakayamac, Umpei Nagashimad
e-mail: [email protected]
It is of great importance to determine the geometrical structure of an isolated
polyatomic molecule. Recently, it has been shown the possibility of the direct
comparison in the experimental spectroscopic observations and ab initio theoretical
calculation due to the achievements of both accurate measurements and calculations.
However, in the usual ab initio calculations, the equilibrium structures are
obtained, although the determine structures by the experiment mean the averaged
structures. This difference becomes larger when the mass of atom becomes smaller, i.e.,
hydrogen case. In addition, due to the anharmonicity of the potential, it is well known
that the X-D distance in D-compounds are shorter than the X-H one in H-compounds. But,
it is difficult to discuss the difference of X-H/X-D distances under the conventional
ab initio calculations.
To take into account the geometrical changes by the H/D isotope effect, we
developed the multi-component molecular orbital (MC_MO) approach [1]. The MC_MO method
enables one to analyze the quantum effects of a proton (deuteron) because the MC_MO
method determines both the electronic and the protonic (deuteronic) wavefunctions
simultaneously and directly. We have already found that the MC_MO method can be used
to analyze the geometrical isotope effect and kinetic isotope effect induced the
difference in quantum behavior between protons and deuterons. Before the analysis of
spectroscopic properties, we first optimized the H/D-compounds for polyatomic
molecules, such as, acetaldehyde, acetone, benzene, and methoxy radical. The rotational
constants based on the optimized structures including H/D geometrical isotope effect
showed good agreement with the experimental value. We clearly found that the geometrical
changes induced by the H/D isotope effect influence the spectroscopic properties, such
as rotational constants[2-4].
Acknowledgements
Activities of Advanced Automotive Research Collaborative Laboratory in Hiroshima
University are supported by MAZDA Corporation.
References
[1] T. Ishimoto, M. Tachikawa, and U. Nagashima, Int. J. Quantum Chem., 109, 2677 (2009).
[2] T. Ishimoto, Y. Ishihara, H. Teramae, M. Baba, and U. Nagashima, J. Chem. Phys.,
128, 184309 (2008).
[3] T. Ishimoto, Y. Ishihara, H. Teramae, M. Baba, and U. Nagashima, J. Chem. Phys.,
129, 214116 (2008).
[4] T. Ishimoto, M. Baba, U. Nagashima, N. Nakayama, and M. Koyama, J. Comput. Chem.
Jpn., 15, 199 (2016).
A21
39

Conformational Structures of Jet-cooled Acetaminophen-water Clusters: A Gas
Phase Spectroscopic and Computational Study
(Gyeongsang National Univ.a, Chungbuk National Univ.b) Ahreum Mina,b, Ahreum Ahna,
Cheol Joo Moona, Yeon Guk Seonga, Nam Joon Kimb, Myong Yong Choia
Acetaminophen (AAP) is a widely used over-the-counter antipyretic and analgesic, a
major ingredient in various cold and flu drugs, Tylenol®. On the basis of the results
with AAP monomer, we would like to step further on the study of AAP-water clusters.
For the acetaminophen (AAP)-water clusters (AAP-(H2O)1) have been investigated by
mass-selected resonant two-photon ionization (R2PI), ultraviolet-ultraviolet
hole-burning (UV-UV HB), infrared-dip (IR-dip), and infrared-ultraviolet hole-burning
(IR-UV HB) spectroscopy. Each syn- and anti-AAP rotamer has three distinctive binding
sites (–OH, >CO, and >NH) for a water molecule, thus 6 different AAP-(H2O)1 conformers
are expected to exist in the molecular beam. The origin bands of the AAP(OH)-(H2O)1
and AAP(CO)-(H2O)1 conformers (including its syn- and anti-conformers) in the R2PI
spectrum are shifted to red and blue compared to those of the AAP monomer, respectively.
The spectral assignments of the origin bands in the R2PI spectrum and the IR vibrational
bands in the IR-dip spectra for the four lowest-energy conformers of AAP-(H2O)1, [syn-
and anti-AAP(OH)-(H2O)1 and syn- and anti-AAP(CO)-(H2O)1], are aided by ab initio and
time-dependent density functional theory (TDDFT) calculations. Further investigation
on the IR-dip spectra has revealed a hydrogen-bonded NH stretching mode, supporting
the presence of the syn-AAP(NH)-(H2O)1 conformer. Moreover, by employing IR-UV HB
spectroscopy, we have reconfirmed the existence of the syn-AAP(NH)-(H2O)1 conformer,
which happened to be buried underneath the broad background attributed from the
AAP(OH)-(H2O)1 conformers
Figure 1. IR-dip and calculated IR bar spectra of three major syn- AAP-(H2O)1 conformers.
The optimized structures of 6 different conformers of AAP-(H2O)1 in the ground state.
The relative energies are shown below the corresponding structure (kJ/mol, zero-point
energy corrected).
A22
40

Vibrational Predissociation of the à state of the C3Ar complex
in the excitation energy region of 25410-25535 cm-1
(Institute of Atomic and Molecular Sciences) Yi-Jen Wang, Yen-Chu Hsu
About 11 C3Ar bands near the 0 4− 0− 000 and 0 2
+ 0− 000 transitions of the Ã
1u−X
~ 1
+g system of
C3 have been studied by both laser-induced fluorescence and wavelength-resolved emission(WRE)
techniques. Two prominent pairs of C3Ar features were observed to the red of each of these two C3
transitions. Each pair consists of a type A band and a type C band, with the type C band lying about 3
cm-1 above the type A band. Rotational analysis showed that three of the bands are comparatively
sharp, with line widths of 0.035 cm-1
, but the pair at 25504 and 25507 cm-1 shows clear evidence of
diffuseness. The spectral widths of the rotational lines do not depend on the excitation energies in any
simple way. Most of the spectral features in the WRE spectra can be assigned as emission from
vibrationally excited levels of the à state of the C3 fragments down to the ground electronic state. Two
different types of vibrational excitation of the C3 fragments have been found: pure C3-bending and
antisymmetric C-C stretching. The branching ratios of the C3 product states, the C3Ar vdW binding
energy, and propensity rules for vibrational predissociation processes will be presented.
A23
41

Variations in the electron detachment spectra of F…H2O Anion induced by proton
motion
(Institute of Atomic and Molecular Sciences, Academia Sinica Taiwana)
Kaito Takahashia [email protected]
For the understanding of the solvation structure of ions in the aqueous phase,
one has to define observables that change with solvation structure. In the condensed
phase due to complex thermal fluctuation, the definition of the structure becomes very
unambiguous. Therefore, the researchers in the gas phase community have studied size
selected gas phase charged clusters to help decode the complexity. Through the
comparison with theoretical simulations, vibrational spectra of anion clusters have
given information toward the geometrical structure of these clusters. On the other hand,
photodetachment and X-ray absorption spectra are used to probe the electronic structure
of anions in the aqueous phase. In most previous studies on the photodetachment spectra,
the simulation of the spectra was performed by calculating the vertical detachment
energies at equilibrium geometries, at cluster cut out from classical trajectories or
at zero-point vibration distributions. Here, we aim to provide new insight from the
simulation of vibrational state dependent photodetachment spectra for X…(H2O)n anion,
where X= F, Cl, Br. Utilizing the reflection principle, we simulated the
photodetachment spectra from different vibrational excited states for F-H2O, Cl-H2O and
Br-H2O.1 From these spectra, we can observe changes in the electron distribution between
the anion and neutral X…H2O system that are induced by vibrational excitation. Notably,
for F-H2O, the excitation of the ionic hydrogen bonded (IHB) OH stretching vibration
causes a large tail on the low energy side of the photodetachment spectra compared to
the detachment from the zero-point vibration state. This low tail shows that IHB OH
stretching vibration of F-H2O causes charge delocalization from F- to the oxygen atom
in H2O and the photodetachment from FH…OH- occurs at lower energies.
A24
42
Photoinduced Proton Transfer of N-Methyl-Hydroxyquinolinium to Small Water
Clusters
(Department of Chemistry, Ulsan National Institute of Science and Technology (UNIST)a,
Center for Soft and Living Matter, Institute for Basic Science (IBS)b) Taewan Kima,
Won-Woo Parka, and Oh-Hoon Kwona,b* ([email protected])
The excited-state proton transfer (ESPT) to water was studied in the presence
of a series of strong photoacids, N-methyl-n-hydroxyquinolinium ions, with a hydroxyl
group at 3(NM3HQ+), 5(NM5HQ+), 6(NM6HQ+), 7(NM7HQ+) and 8(NM8HQ+) positions, in an aprotic
solvent of acetonitrile.
We measured excited-state lifetimes of the prototropic species of NMnHQ+ using
picosecond-resolved fluorescence spectroscopy and analyzed their chemical kinetics to
reveal the ESPT mechanism. The results show that water, as a base, forms small clusters
during the ESPT process, the sizes of which have are: three for NM7HQ+, two for NM3HQ+
and NM6HQ+, and one for NM5HQ+ and NM8HQ+.
From the Förster analysis modified from its original version [1], acid
dissociation constants in excited state (pKa*) of the photoacids were evaluated and
found to correlate with the size of the water clusters as base; the number of molecules
constituting the water clusters tend to decrease as the photoacid becomes acidic, i.e.,
with lower pKa* values. From the comparison with our previous results reporting the
size of alcohol clusters as Brønsted base in the ESPT of the same photoacids [2-4],
it is found that water is less reactive in acid-base reactions than alcohol when
hydrogen-bond network is limited to form small clusters.
References
[1] Tolbert, L. M.; Solntsev, K. M. Acc. Che. Res. 2002 35, 19-27
[2] Park, S. Y.; Lee, Y. M.; Kwac, K.; Jung, Y.; Kwon, O.-H. Chem. Eur. J. 2016, 22,
4340-4344
[3] Lee, Y, M.; Park, S. Y.; Kim, H.; Kim, T. G.; Kwon, O.-H. Methods Appl. Fluoresc.
2016, 4, 024004
[4] Park, S. Y.; Kim, T. G.; Ajitha, M. J.; Kwac, K., Lee, Y. M.; Kim, H.; Jung, Y.;
Kwon, O.-H. Phy. Chem. Chem. Phys. 2016, 18, 24880-24889
A25
43

Figure 1: All the deuterated benzenes.
High-resolution spectroscopy of deuterated benzenes (Kyoto Univ.a, Institute of Molecular Scienceb, The Univ. of Tokyoc, Tokyo Inst. of Tech.d)
Sachi Kunishigea, Takaya Yamanakab, Masaaki Babaa, Masakazu Nakajimac, Yasuki Endoc and Yasuhiro Ohshimad
We performed spectroscopic experiments to elucidate the properties of the 13 deuterated benzenes in the S0 and S1 states. The molecular structure of benzene was determined by microwave spectroscopy and geometric calculation. The deuterium effects on the normal coordinates and rotational structures were seen in the high-resolution mass-selective REMPI spectra. 【Introduction】 Deuteration changes nuclear motions such as vibration or rotation. Especially, partly deuterium substitution in benzene could reduce the molecular symmetry from D6h symmetry into D3h, C2v and so on (Figure 1). These changes would make the vibrational or rotational structure quite different. The objective of the present study is to clarify the change of spectra of benzenes by deuteration.
【Experiments】
The supersonic jet method was used in all the experiments. For the sample we synthesized a mixture of 13 deuterated benzenes by maintaining the mixture of C6H6 and C6D6 at 800 K for 7 h with alumina powder. 【Results】
For elucidating the molecular structure of benzene in the electronic ground state, we determined the rotational constants of some deuterated benzenes by microwave spectra. Then the least-squared fit was performed using the observed and calculated rotational constants, assuming that all bond angles are 120°. The result suggests that the molecular structure at the zero-vibrational level in the S0 state is the almost same for all the deuterated benzenes. This is different from other molecules or radicals such as CH4 in which r0(C-H) – r0(C-D) = 5 mÅ. Then we observed the rotationally-resolved high-resolution spectra of the 61 band for all the partly deuterated benzenes to clarify the property of deuterated benzenes in the S1 state. The ν6 (e2g) vibration splits into two components, 6a and 6b, in the lower molecular symmetry than D3h. Furthermore, the Coriolis interaction exists between 6a and 6b which shifts the energy of rotational levels. We clarified the mass dependence of this interaction through observation and theory.
【Reference】
[1] S. Kunishige et al., J. Chem. Phys. 143, 244302(2015) [2] S. Kunishige et al., J. Chem. Phys. 143, 244303(2015) [3] S. Kunishige et al., J. Chem. Phys. 143, 244304(2015)
B01
44
PRECISION SATURATED ABSORPTION SPECTROSCOPY OF H3+
Yu-Chan Guan1, Yung-Hsiang Chang1, Yi-Chieh Liao1 and Jow-Tsong Shy1, 2
1Institute of Photonics Technologies, National Tsing Hua University, 101, Section 2, Kuang-Fu Rd.,
Hsinchu 30013, Taiwan
2Department of Physics, National Tsing Hua University, 101, Section 2, Kuang-Fu Rd., Hsinchu 30013,
Taiwan
Abstract:
In our previous work on the Lamb dips of the ν2 fundamental band of H3+, the
saturated absorption spectrum was obtained by the third-derivative spectroscopy using
frequency modulation [1]. However, the frequency modulation also causes error in
absolute frequency determination. To solve this problem, we have built an
offset-locking system to lock he OPO pump frequency to an iodine-stabilized
Nd:YAG laser. With this modification, we are able to scan the OPO idler frequency
precisely and obtain the profile of the Lamb dips. Double modulation (amplitude
modulation of the idler power and concentration modulation of the ion) is employed
to subtract the interference fringes of the signal and increase the signal-to-noise ratio
effectively. To Determine the absolute frequency of the idler wave, the pump wave is
offset locked on the R(56) 32-0 a10 hyperfine component of 127I2, and the signal wave
is locked on a GPS disciplined fiber optical frequency comb (OFC). All references
and lock systems have absolute frequency accuracy better than 10 kHz. Here, we
demonstrate its performance by measuring one transition of methane and sixteen
transitions of H3+. This instrument could pave the way for the high-resolution
spectroscopy of a variety of molecular ions.
[1] H.-C. Chen, C.-Y. Hsiao, J.-L. Peng, T. Amano, and J.-T. Shy, Phys. Rev. Lett.
109, 263002 (2012).
B02
45

Doppler-free two-photon absorption spectroscopy of vibronic excited states of naphthalene with reference to an optical frequency comb
(UECa, Fukuoka Univ.b, Kyoto Univ.c) A. Nishiyamaa, K. Nakashimab, M. Misonob, M. Babac
1. INTRODUCTION In the excited states of polyatomic molecules, there are some interesting phenomena such as, internal conversion (IC), intersystem crossing (ISC), and intramolecular vibrational energy redistribution (IVR). In the first electronic excited state of naphthalene, it was reported that IVR become dominant for the excess energy (Ex) larger than about 2000 cm-1. In this study, we observed Doppler-free two-photon absorption (DFTPA) spectra of three transitions, A1B1u (v4 = 1, Ex = 1560 cm-1) <- X1Ag (v = 0), A1B1u (v4 = 1, v8 = 1, Ex = 2260 cm-1) <- X1Ag (v = 0) , and A1B1u (v4 = 1, v7 = 1, Ex = 2545 cm-1) <- X1Ag (v = 0), in the following, we call "orange band," "yellow band," and "lemon band," respectively. Then, we analyze the linewidth of rovibronic lines in each band. 2. EXPERIMENT Figure 1 shows our experimental setup. This system consists of DFTPA system for naphthalene and frequency measurement system [1]. The light source for DFTPA system is a single mode CW dye laser. Its output power is about 1.8W, and the linewidth is about 130 kHz. Most part of the dye laser output is used to observe DFTPA spectra of naphthalene. The resonance frequency of the Fabry-Perot interferometer is locked to the dye laser frequency by Pound-Drever-Hall method. The frequency of the dye laser is scanned and the fluorescence intensity is observed by the photon counting system. We use a GPS-disciplined Ti:Sapphire optical frequency comb as a frequency measure. The spectral range of the Ti:Sapphire comb is broadened by a photonic crystal fiber. A part of the dye laser output is split to measure its frequency. An acousto-optic frequency shifter in double pass configuration shifts the dye laser frequency to realize wide range continuous frequency measurements [2].
Figure 1. Experimental setup. PCF, photonic crystal fiber; PBS, polarizing beam splitter;
EOM, electro-optic modulator; AOFS, acousto-optic frequency shifter; APD, avalanche
photodiode; DG, diffraction grating; PMT, photomultiplier tube.
Ti:S Comb
CW dye Laser
I2 PMT
APDEOM
PBS λ/4PBS
λ/4
AOFS
PCF
APD
FrequencyCounter
RF Synthesizer
Com
pute
r
DG
Naphthalene Cell
B03
46

3. RESULTS AND DISCUSSION
The observed spectra are shown in the figure 2. They are a part of spectra of the lemon band, the yellow band, and the orange band from top to bottom. For the orange and yellow bands, linewidths are about 2.5 MHz, and they show small dependences on the rotational quantum numbers. On the other hand, the linewidths in the lemon band spectra become broad, and depend on the rotational quantum numbers. This means that the IVR become dominant in the upper state of the lemon band transition. [1] A. Nishiyama, K. Nakashima, A. Matsuba, and M. Misono, J. Mol. Spectrosc., 318, 40 (2015). [2] A. Nishiyama, A. Matsuba, and M. Misono, Opt. Lett., 39, 4923 (2014).
Figure 2. Observed spectra.
34277.22 34277.25
33577.03 33577.06
p
y
Wavenumber [cm-1]
34562.04 34562.07
B03
47

High-sensitive and precise measurement of Doppler-free two-photon
absorption spectra of Rb using dual-comb spectroscopy
(aUniv. Electro-Communications, bJST, ERATO MINOSHIMA IOS Project, cJSPS)
Akiko Nishiyamaa,b,c, Satoru Yoshidaa,b, Takuya Harikia, Yoshiaki Nakajimaa,b,
Kaoru Minoshimaa,b
Introduction
Dual-comb techniques are applicable to high-resolution and precise spectroscopies
[1,2]. In this work, we demonstrated Doppler-free two-photon absorption dual-comb
spectroscopy of Rb. We obtained high signal-to-noise ratio spectra of the 5S1/2 – 5D5/2
transition and precisely determined absolute frequencies of the hyperfine spectra.
Experiment
Figure 1(a) depicts the principle of the two-photon absorption spectroscopy using the
dual-comb technique [3]. In spite of the weak comb mode power, two-photon
transitions which are nonlinear processes are observable due to the contribution of
many comb mode pairs with the same sum frequency. We observe the fluorescence
from the excited states, and obtain the spectra by taking the fast Fourier-transform of
the fluorescence signals. The sensitivity of the dual-comb measurement is
significantly improved by the fluorescence detection scheme.
The experimental setup is illustrated in Fig. 1(b). We used second-harmonic
generations (SHG) of mode-locked Er-doped fiber lasers. The center wavelength of
the SHG spectra were adjusted near 778 nm by temperature control of PPLN crystals
Fluorescencen×Δfrep
(a)
frep+Δfrep
Energ
y
Comb 1 Comb 2
frep
lock
lock
comb 1
comb 2
Fiber Amp
PPLN
(b)
cw
PMT
λ/4λ/4
λ/2λ/2λ/2
Diffraction grating
λc = 778 nmΔλ = 5 nmfrep = 56.6 MHzΔfrep = 100 Hz
Diffraction grating filter
Rb cell
Fig. 1 (a) Principle of the two-photon dual-comb spectroscopy. (b) Experimental setup. PPLN: periodically-poled lithium niobate, PMT: photomultiplier tube.
B04
48
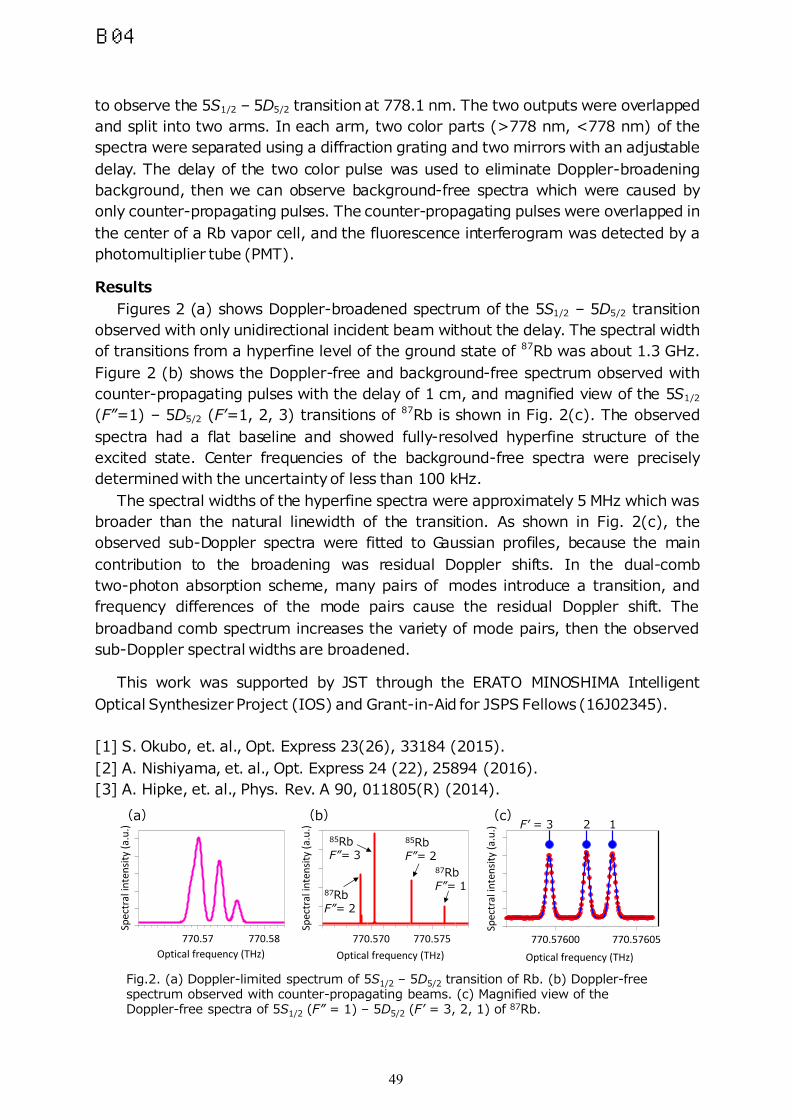
to observe the 5S1/2 – 5D5/2 transition at 778.1 nm. The two outputs were overlapped
and split into two arms. In each arm, two color parts (>778 nm, <778 nm) of the
spectra were separated using a diffraction grating and two mirrors with an adjustable
delay. The delay of the two color pulse was used to eliminate Doppler-broadening
background, then we can observe background-free spectra which were caused by
only counter-propagating pulses. The counter-propagating pulses were overlapped in
the center of a Rb vapor cell, and the fluorescence interferogram was detected by a
photomultiplier tube (PMT).
Results
Figures 2 (a) shows Doppler-broadened spectrum of the 5S1/2 – 5D5/2 transition
observed with only unidirectional incident beam without the delay. The spectral width
of transitions from a hyperfine level of the ground state of 87Rb was about 1.3 GHz.
Figure 2 (b) shows the Doppler-free and background-free spectrum observed with
counter-propagating pulses with the delay of 1 cm, and magnified view of the 5S1/2
(F”=1) – 5D5/2 (F’=1, 2, 3) transitions of 87Rb is shown in Fig. 2(c). The observed
spectra had a flat baseline and showed fully-resolved hyperfine structure of the
excited state. Center frequencies of the background-free spectra were precisely
determined with the uncertainty of less than 100 kHz.
The spectral widths of the hyperfine spectra were approximately 5 MHz which was
broader than the natural linewidth of the transition. As shown in Fig. 2(c), the
observed sub-Doppler spectra were fitted to Gaussian profiles, because the main
contribution to the broadening was residual Doppler shifts. In the dual-comb
two-photon absorption scheme, many pairs of modes introduce a transition, and
frequency differences of the mode pairs cause the residual Doppler shift. The
broadband comb spectrum increases the variety of mode pairs, then the observed
sub-Doppler spectral widths are broadened.
This work was supported by JST through the ERATO MINOSHIMA Intelligent
Optical Synthesizer Project (IOS) and Grant-in-Aid for JSPS Fellows (16J02345).
[1] S. Okubo, et. al., Opt. Express 23(26), 33184 (2015).
[2] A. Nishiyama, et. al., Opt. Express 24 (22), 25894 (2016).
[3] A. Hipke, et. al., Phys. Rev. A 90, 011805(R) (2014).
Spec
tral
inte
nsi
ty (
a.u
.)
770.57605770.57600
Optical frequency (THz)
Spec
tral
inte
nsi
ty (
a.u
.)
770.58770.57
Optical frequency (THz)
F’ = 3 2 1(a)
Spec
tral
inte
nsi
ty (
a.u
.)
770.575770.570
Optical frequency (THz)
87RbF”= 2
85RbF”= 3
85RbF”= 2
87RbF”= 1
(b) (c)
Fig.2. (a) Doppler-limited spectrum of 5S1/2 – 5D5/2 transition of Rb. (b) Doppler-free spectrum observed with counter-propagating beams. (c) Magnified view of the Doppler-free spectra of 5S1/2 (F” = 1) – 5D5/2 (F’ = 3, 2, 1) of 87Rb.
B04
49

Absolute frequency measurement of the molecular iodine hyperfine transition at 647 nm (National Tsing Hua Univ.a) Yao-Chin Huanga, Yu-Chan Guana, Jow-Tsong Shya, Li-Bang Wanga
Molecular iodine (I2) has played an important role in optical frequency standards for many
applications. The most striking element of the iodine absorption spectrum is the long series of the B-X
system in the range from the green to near-IR and has very strong strength and narrow linewidth in the
region close to the dissociation limit. Molecular iodine is commonly used for frequency stabilization
of laser.
Iodine absorption lines at 647 nm are very close to the doubling wavelength (2×323 nm) of the 2S-3P
transition of atomic lithium (Li). Therefore, these iodine lines can be frequency references for Li atom
research, e.g., the development of laser cooling and the measurement of hyperfine intervals. The
frequency references at 647 nm using a simple iodine cell are particularly helpful for atomic physics
laboratories where no optical frequency combs are available.
In this work, we perform Doppler-free saturation spectroscopy in an iodine vapor cell using
modulation transfer spectroscopy. The effect of pressure shift is investigated by changing the cold
finger temperature and extrapolating the absolute transition frequency at zero pressure. The saturated
absorption signal is used to lock the laser frequency, and the absolute frequency of the transition lines
are measured by an optical frequency comb. A frequency stability of 5×10-12 at a 200 s integration
time is achieved when the light source is stabilized to the P(46) 5-4 a15 line. To our knowledge, there
are no precision measurements around this wavelength, and our results provide useful input for the
theoretical predictions.
B05
50

CO2 line intensities near 1.6μm by cavity ring-down spectroscopy
(Univ Sci & Technol China)P Kang, J Wang, L-G Tao, Y R Sun, A-W Liu, T-P Hua, S-M Hu
Accurate parameters of the CO2 transitions in the 1.6 μm region are needed for
monitoring global CO2 concentration in the atmosphere. Line intensities with relative
uncertainty lower than 0.5% are required. However, discrepancies up to 3-10% have
been reported between experimental data and calculated results [1-4]. We present
measurements of the CO2 lines in this region using frequency-locked cavity ring-down
spectroscopy. Ro-vibrational transitions of the 30011-00001 band with line intensities
in the order of 10-25 to 10-24 cm/molecule have been studied. We have been able to
determine the line intensities with an accuracy of 0.5%, which fulfills the requirements
for remote sensing applications. We also present a comparison among present results,
HITRAN data, and recent calculations.
Reference:
[1] R. A. Toth et al., J. Mol. Spectrosc. 239, 221-242 (2006).
[2] E. Zak et al., J. Quant. Spectrosc. Radiat. Transf. 177, 31-42 (2016).
[3] O. L. Polyansky et al., Phys. Rev. Lett. 114, 243001 (2015).
[4] S. A. Tashkun et al., J. Quant. Spectrosc. Radiat. Transf. 152, 45-73 (2015).
B06
51
Mid-infrared saturated absorption spectroscopy inside the hollow fiber using difference
frequency generation source
D.N. Patel1, Tzu-Han Su
2, Hsiang-Chen Chui
2 and
Jow-Tsong Shy
1, 3
1Department of Physics, National Tsing Hua University, 101, Section 2, Kuang-Fu Rd., Hsinchu 30013, Taiwan
2Department of Photonics, National Cheng Kung University, No.1, University Road, Tainan City 70101, Taiwan
3Institute of Photonics Technologies, National Tsing Hua University, 101, Section 2, Kuang-Fu Rd., Hsinchu 30013,
Taiwan
Email: [email protected]
Abstract:
Saturation spectroscopy is recognized as a powerful tool to observe the frequency
precession far below the Doppler limit [1]. We have performed the mid-infrared Doppler-free
spectroscopy inside the hollow fiber using a difference frequency generation (DFG) source. We
have established a widely tunable mid-infrared DFG source using a 1 W tapered amplifier
boosted external cavity diode laser (ECDL) system and a 10 W YDFA (ytterbium-doped fiber
amplifier) boosted Nd:YAG laser system. The two laser beams from ECDL and Nd:YAG laser
systems are mixed in a 50 mm long MgO doped periodically poled lithium niobate (MgO:PPLN)
crystal to generate the DFG radiation over the tuning range of 3.97 to 4.71 µm. The maximum
power of DFG source is about 3 mW. The iodine stabilization scheme is used to stabilize the
Nd:YAG laser frequency and saturated absorption spectroscopy is performed on R(60) transition
of CO2 fundamental (0001 ← 00
00) band at 4.193 µm inside a hollow fiber of diameter 300 µm
and length 100 cm while keeping the CO2 pressure at 100 mTorr. The hollow fiber is
manufactured by Opto-Knowledge Systems Inc. having the attenuation of 3dB over 100 cm
length. The observed spectrum is fitted with a combination of Gaussian and Lorentzian profile
and the full width half maximum (FWHM) of the Lamb dip is reported to 4.56±0.23 MHz. We
have also determined the line width (4.40±0.15 MHz) of Lamb dip in well agreement with the
measured dip using the dependence of peak amplitude of the third derivative signal with respect
to the modulation width [2]. The comparison of width with free space measurements will be
discussed [3]. The third derivative locking method is used to lock the ECDL frequency to a
hyperfine transition of CO2. This study may potentially be used in the generation of compact
mid-IR frequency standard source.
[1] T. W. Hansch, I. S. Shahin, and A. L. Schawlow, Nature-Phys. Sci. 235, 63 (1972).
[2] H.-M. Fang, S.-C. Wang and J.-T. Shy, Opt. Commun. 257, 76 (2006).
[3] C.-C. Liao, K.-Y. Wu, Y.-H. Lien, J.-T. Shy, High precision mid-IR spectroscopy of 12
C16
O2: 0001←00
00 band
near 4.3 µm, Proceedings of the 63rd
Ohio State University International Symposium on Molecular Spectroscopy,
Columbus, Ohio, 2008.
B07
52

Electronic transitions of tungsten monosulfide
L. F. Tsang1, Man-Chor Chan1, Wenli Zou2, and Allan S-C. Cheung3*
1Department of Chemistry, The Chinese University of Hong Kong, Shatin, NT, Hong Kong 2Institute of Modern Physics, Northwest University, Xi'an, Shaanxi, China and Shaanxi Key Laboratory for Theoretical Physics Frontiers, Xi'an, Shaanxi, China.
3Department of Chemistry, The University of Hong Kong, Pokfulam Road, Hong Kong *Email: [email protected] Abstract
Electronic transition spectrum of the tungsten monosulfide (WS) molecule in the near infrared region between 725 nm and 885 nm has been recorded using laser ablation/reaction free-jet expansion and laser induced fluorescence spectroscopy. The WS molecule was produced by reacting laser - ablated tungsten atoms with 1% CS2 seeded in argon. Fifteen vibrational bands with resolved rotational structure have been recorded and analyzed, which were organized into seven electronic transition systems. The ground state has been identified to be the X3-(0+) state with bond length, ro, and vibrational frequency, G1/2, determined to be 2.0676 Å and 556.7 cm-1 respectively. In addition, vibrational bands with = 1 component in lower state have also been analyzed. Least-squares fit of the measured line positions yielded molecular constants for the electronic states involved. Spectroscopic constants and potential energy curves of 30 low-lying Λ-S states and Ω sub-states of the WS molecule have been calculated using state-averaged complete active space self-consistent field (SA-CASSCF) and followed by MRCISD+Q (internally contracted multi-reference configuration interaction with singles and doubles plus Davidson’s cluster correction). The active space consists of 10 electrons in 9 orbitals corresponding to the W 5d6s and S 3p shells. The lower molecular orbitals from W 5s5p and S 3s are inactive but are also correlated, and relativistic effective core potential (RECPs) are adopted to replace the core orbitals with 60 (W) and 10 (S) core electrons, respectively. The spin-orbit coupling (SOC) is calculated via the state-interaction (SI) approach with RECP spin-orbit operators using SA-CASSCF wavefunctions, where the diagonal elements in the SOC matrix are replaced by the corresponding MRCISD+Q energies calculated above. The calculated spectroscopic properties of the ground and low-lying electronic states are generally in good agreement with our experimental determinations. This work represents the first experimental investigation of the electronic and molecular structure of the WS molecule.
B08
53

The low-lying electronic states of scandium monocarbide, ScC
(Institute of Atomic and Molecular Sciences ) Chiao-Wei Chen, Anthony J. Merer , Yen-Chu Hsu
Extensive wavelength-resolved fluorescence studies have been carried out for the electronic bands of ScC
and Sc13
C lying in the range 14000 - 16000 cm1
. Taken together with detailed rotational analyses of
these bands, they have clarified the natures of the low-lying electronic states. The ground state is an =
3/2 state, with a vibrational frequency of 648 cm1
, and the first excited electronic state is an = 5/2 state,
with a frequency of 712 cm1
, lying 155.57 cm1
higher. These states are assigned as the lowest spin-
orbit components of X2i and a
4i, respectively. The quartet nature of the a state is confirmed by the
observation of the 43/2 component 18.69 cm
1 above the
45/2 component. The strongest bands in the
region studied go to two 47/2 excited states, lying 14355 and 15445 cm
1 above X
23/2. Extensive
doublet-quartet mixing occurs, which results in some complicated emission patterns. The energy order,
a above X
2, is consistent with the ab initio calculations of Mavridis et al,.
a but differs from that found
by Simard et al.b in the isoelectronic YC molecule.
a A. Kalemos, A. Mavridis and J.F. Harrison, J. Phys. Chem. A155, 755 (2001).
b B. Simard, P.A. Hackett and W.J. Balfour, Chem. Phys. Lett., 230, 103 (1994).
B09
54
Laser spectroscopic study of the B/B' 2∑
+ v=9, 10, 11 and 18 levels of CaH
(Univ. of Toyamaa, Univ. New Brunswick
a)
Kyohei Watanabea, Kaori Kobayashi
a, Fusakazu Matsushima
a,
Yoshiki Moriwakia,Stephen C. Ross
b
Spectroscopic studies on Calcium monohydride (CaH) have been carried out
for long time. It was 1908 that electric transitions of CaH were observed for the
first time through solar observations [1]. The first laboratory spectroscopy is the
C2Σ
+ - X
2Σ
+ transitions in near-UV region in 1925 [2]. Despite the long history
of study of this molecule, the discrepancy exists between the experimental and
theoretical analysis in higher vibrational levels of the second excited the
B/B’2∑
+ state. The B/B’
2∑
+ state is formed by the avoided crossing with the D
state, resulting in a double minimum potential energy function[3]. Then there are
strong perturbations between the B/B’2∑
+ and the D
2Σ
+ states. We have observed
electric rotationa-vibrational transition of the B/B’2Σ
+ - X
2Σ
+ above the
double-minimum potential energy for experimentally elucidating the
perturbation between the B/B’2∑
+ and the D
2Σ
+, for the general knowledge of
molecule structure.
We observed four vibrational levels and attributed them to the B/B’ 2Σ
+ (v=12,
13, 14 and 16) - X2Σ
+ transitions, and five levels which had been previously
miss assigned to the D state reassigned to the B/B’ state [4]. In additional to this,
we recently observed the B/B' (ν=9, 10, 11, 18) levels. Then we observed
unusual behaviors of vibrational structure, rotational structure and line intensity
as follows;
・ The vibrational spacing energy have oscillation pattern for higher vibraional
levels.
・ O-C value for some rotational line are much larger than RMS value
・ Line intensity: Low J rotational transition lines even vibrational states in the
B/B’ state is weak and especially the J=0→1 transition lines are completely
missing
We consider that there should be perturbation with some other electric states.
In this talk, we report assignments of new four vibrational levels and discuss the
perturbation.
[1] C. M. Olmsted, Astrophys. J. 27, 66(1908).
[2] R. S. Mulliken, Phys. Rev. 25, 509 (1925).
[3] H. Martin, J. Chem. Phys. 88 (1988) 1797.
[4] K. Watanabe et al., Chem. Phys. Lett. 657, 1 (2016).
B10
55

Vibronic Emission Spectroscopy of Jet-Cooled Benzyl-type Radicals Generated from Corona Discharge of Chloro-Substituted o-Xylenes
(Department of Chemistry, Pusan National University, Pusan 46241, Korea)
Sang Kuk Lee ([email protected])
Abstract: Jet-cooled but vibronically excited chloro-substituted methylbenzyl radicals were generated
from corona discharge of precursors, chloro-substituted o-xylenes with a large amount of carrier gas
helium in a technique of corona excited supersonic expansion. From the analysis of the spectra
observed, we can identify each benzyl-type radical formed by comparing the observation with the ab
initio calculation, from which the red-shift of the origin band of the chloro-substituted methylbenzyl
radicals was explained in terms of the lowest occupied molecular orbital (LUMO).
Introduction: Whereas benzyl radical, a prototypic aromatic free radical, has been the subject of
numerous spectroscopic studies, chloro-substituted benzyl radicals have received less attention, due to
the difficulties associated with production of radicals from precursors. The weak C-Cl bond can be
easily dissociated in corona discharge of high voltage, leading to the formation of other benzyl-type
radicals. During past years, we have concentrated the spectroscopy of chloro-substituted methylbenzyl
radicals produced from corona discharge of precursor seeded in a large amount of helium carrier gas
using a pinhole-type glass nozzle in a technique of corona excited supersonic expansion.
Experiment: For the production of jet-cooled but vibronically excited benzyl-type radicals, we have
employed a technique of corona excited supersonic expansion coupled with a pinhole-type glass
nozzle which has been well developed in this laboratory. The precursors were vaporized in a glass
vessel of 2 atom helium gas and undergone corona discharge of less than 2 kV during supersonic jet
expansion. The weak green-blue emission was recorded to obtain the vibronic emission spectra shown
in Fig. 1 using a long path monochromator (Jobin Yvon U1000).
Results and Discussion: From the analysis of the spectra observed, we obtained the spectroscopic
data listed in Table 1 from the assignment of the origin band of each benzyl-type radical using the
substituent effect on electronic transition energy, especially of orientation effect of substituents. The
large and small red shifts were confirmed for the 5-chloro- and 3-chloro-o-methylbenzyl radicals,
respectively. The elliptic shape of the molecular orbitals at the lowest unoccupied state agrees well
Table1 1. Red-shifts of chloro-substituted-o-methylbenzyl radicals in the D1→D0 transitiona
Molecules Origin band Shiftb Differencec
3-chloro-o-methylbenzyl 20680 1322 143
4-chloro-o-methylbenzyl 21376 626 31
5-chloro-o-methylbenzyl 20270 1732 -267
6-chloro-o-methylbenzyl 20418 1584 35
aMeasured in vacuum (cm-1).
B11
56

with the observation, leading to the understanding the orbital shape of delocalized π electrons shown
in Fig. 2. We believe this is the first attempt to describe the orbital motion of delocalized π electrons
on the benzene ring perturbed by substituents.
Figure 1. The vibronic emission spectra observed from the corona discharge of chloro-substituted
o-xylene precursors seeded in a large amount of carrier gas helium. The top and bottom spectra were
observed from 3-chloro-o-xylene and 4-chloro-o-xylene, respectively.
Figure 2. The 2-dimensional shape of lowest unoccupied molecular orbital of the chloro-substituted
methylbenzyl radicals. The (a), (b), (c), and (d) represent the 3-chloro-, 4-chloro-, 5-chloro-, and
6-chloro-methylbenzyl radicals, respectively. The elliptic shape of molecular orbitals is believed to
attribute to the size of red-shift of the origin band of the benzyl-type radical in the D1→D0 transition.
19000 19500 20000 20500 21000 21500 22000
Wavenumber (cm-1)
Inte
nsi
ty (
Arb
. Unit
)
* *
CH2•
Cl
CH2•
Cl
CH2•
CH2•
Cl
CH2•
ClCl
CH2•
Cl
CH2•
Cl
+
Cl
CH2•
Cl
CH2•
Cl
CH2•
++
(b) (a) (c) (d)
B11
57
High-resolution laser spectroscopy and Zeeman effect of nitrate radical (Kyoto Univ.a, Kobe Univ.b, Hiroshima City Univ.c, The Grad. Univ. for Adv. Stds.d)
Kohei Tada a, Michihiro Hirata b, Shunji Kasahara b, Takashi Ishiwata c, and Eizi Hirota d
1. Introduction
The nitrate radical (NO3) is one of the important intermediate species in various chemical
reactions involving nitrogen oxides and ozone [1]. In the ancient time the NO3 was identified by a
significant visible absorption, and this absorption system is now well known to correspond to an
optically allowed B 2E′ ← X 2A2′ electronic transition. The 0 – 0 band of the B – X transition is the
strongest band in intensity, which is located at 15100 cm-1, and some bands corresponding to the
transitions to the vibrationally excited states lie in 15850 – 16100 cm-1 region.
The NO3 is regarded as one of the important models for understanding the intra-molecular
interactions in polyatomic radicals; thus, we have investigated the B – X transition of the NO3 by
applying rotationally-resolved high-resolution laser spectroscopic methods [2-4]. In this talk, we
summarize our studies of the 0 – 0 bands of the 14NO3 and 15NO3, and also we report the progress of
the analysis of the transitions to the vibrationally excited states.
2. Experimental
Dinitrogen pentoxide (N2O5) was employed as a precursor of the NO3, and the NO3 was
generated by the pyrolysis reaction of the N2O5: N2O5 → NO3 + NO2 after jet-expanding the mixture
of N2O5 vapor and helium gas into a high-vacuum chamber through a pulsed nozzle. The sample gas
was shaped into a molecular beam with mechanical apertures. A single-mode ring dye laser (Coherent,
CR699-29) pumped by a Nd: YVO4 laser (Coherent, Verdi V-10) was used as a light source. The
molecular beam was crossed with the dye laser beam at the right angles to reduce the Doppler width,
and we observed rotationally-resolved laser-induced fluorescence (LIF) spectra. The linewidth of the
rotational lines was typically 25 MHz, which is mainly the residual Doppler width. The absolute
wavenumbers of the signals were calibrated to the accuracy of 0.0001 cm-1 by the simultaneous
measurements of the fringe patterns of a cavity-length-stabilized etalon and Doppler-free saturation
spectra of molecular iodine. The contamination of the NO2 to the NO3 spectrum was unavoidable in
our experimental setup; thus, we observed the LIF spectra of the NO2 to distinguish the NO3 signals
from the NO2 signals.
3. The 0 – 0 band of the 14NO3 isotopologue [2,4]
More than 3000 rotational lines with less rotational regularity were found in the observed
15070 – 15145 cm-1 region. Based on the NO2 experiment the contamination of the NO2 signals was
confirmed to be negligible in this energy region. In the observed spectrum remarkable strong line pairs
with energy spacing of 0.0248 cm-1 were found. This spacing is the same in magnitude with the
spin-rotation splitting of the X 2A2′ (υ″ = 0, k″ = 0, N″ = 1) level, where N is the quantum number of
the total angular momentum excluding the electronic spin, and k is that of the projection of N along
the molecular-fixed z axis. Then we found that the B 2E′ state is described well in Hund’s case (a) and
the spin-orbit interaction splits this state into the 2E′3/2 and the 2E′1/2, because if this state is described in
Hund’s case (b) this 0.0248 cm-1 spacing is not detected directly due to the selection rule F1 ↔ F1 and
F2 ↔ F2. Based on the selection rules ∆k = +1, ∆J = 0, ±1, the line pairs with the 0.0248 cm-1 spacing
B12
58

should be assigned as the transitions to the 2E′3/2 (P′ = 1.5, J′ = 1.5), 2E′1/2 (P′ = 0.5, J′ = 0.5) or 2E′1/2
(P′ = 0.5, J′ = 1.5) level, where J is the quantum number of the total angular momentum and P is that
of the projection of J along the z axis. We observed the three types of Zeeman splitting up to 360 G
with a pair of solenoid to distinguish these three types of transitions from each other. Finally, we
identified seven transitions to the 2E′3/2 (P′ = 1.5, J′ = 1.5) and 15 transitions to the 2E′1/2 (P′ = 0.5, J′ =
0.5). From the density of the excited states we concluded that the B 2E′ state interacts vibronically with
the dark A 2E″ state via the e′ type (asymmetric stretching and in-plane bending) vibrational modes.
The effective spin-orbit interaction constant was estimated to be –21 cm-1, based on the energy spacing
of the averaged transition energies to the 2E′3/2 (15100 cm-1) and the 2E′1/2 (15121 cm-1).
In order to extend the assignment of rovibronic transitions to larger quantum numbers, we
re-analyzed our high-resolution spectrum mainly based on the ground state combination differences.
Owing to the selection rules ∆k = +1, ∆J = 0, ±1, the set of six rotational lines rP|k″|(J′ + 1)F′2, rP|k″|(J′ +
1)F′1, rQ|k″|(J′)F′2, rQ|k″|(J′)F′1, rR|k″|(J′ – 1)F′2, and rR|k″|(J′ – 1)F′1, which share an upper (k′, J′) level,
should be identified. We made rotational assignments for 162 lines (27 six-line sets) up to |k″| = 15, J′
= 18.5. The molecular constants of the B 2E′3/2 state were roughly estimated as B = 0.49(4) cm-1, C =
0.22(3) cm-1, and T0 = 15099(8) cm-1. On the other hand, those of the B 2E′1/2 state were roughly
estimated as B = 0.49(3) cm-1, C = 0.28(2) cm-1, and T0 = 15110(5) cm-1.
4. The 0 – 0 band of the 15NO3 isotopologue [3]
We observed the rotationally-resolved LIF spectrum of the 15NO3 in 15080 – 15103 cm-1
region, where about 200 strong lines and several thousand weak lines were found. We assumed that the 15NO2 contamination is negligible, and the excited B 2E′ state can be described in Hund’s case (a). We
identified two transitions to the 2E′3/2 spin-orbit component, whereas six transitions to the 2E′1/2. For the
intrinsic B 2E′1/2 state we successfully made the rotational assignments of the k = 1 ← 0 stack up to J′ =
10.5, and the molecular constants of this upper state were determined as T0 = 15098.20(4) cm-1, B =
0.4282(7) cm-1, and DJ = 4 × 10⁻⁴ cm-1. The spin-orbit interaction constant of the B 2E′ state was
estimated to be –12 cm-1 as the lower limit in magnitude.
5. The vibrationally excited B 2E′ states of the 14NO3 isotopologue
The vibronic band located at around 15900 cm-1 was assigned as the 420 band of the B – X
transition [5]. The high-resolution spectrum in 15860 – 15920 cm-1 has been observed, and we are in
the progress of analyzing this spectrum. We identified many strong line pairs with the 0.0248 cm-1
spacing corresponding to the transitions to the levels with the smallest quantum numbers of both the 2E′3/2 and 2E′1/2 spin-orbit components. These line pairs are not random in distribution but consisting of
band groups, and we found that these 2E′3/2 and 2E′1/2 groups appear alternately.
[1] R. P. Wayne, I. Barnes, P. Biggs, J. P. Burrows, C. E. Canosa-Mas, J. Hjorth, G. Le Bras, G. K.
Woortgat, D. Perner, G. Poulet, G. Restelli, H. Sidebottom, Atmos. Environ. 25A, 1 (1991).
[2] K. Tada, W. Kashihara, M. Baba, T. Ishiwata, E. Hirota, and S. Kasahara, J. Chem. Phys. 141,
184307 (2014).
[3] K. Tada, K. Teramoto, T. Ishiwata, E. Hirota, and S. Kasahara, J. Chem. Phys. 142, 114302 (2015).
[4] K. Tada, T. Ishiwata, E. Hirota, and S. Kasahara, J. Mol. Spectrosc. 321, 23 (2016).
[5] M. Fukushima, and T. Ishiwata, 67th Int. Symp. Mol. Spectrsc. TI06 (2012).
B12
59

Vibronic Coupling in the 𝑨𝟐′ 𝟐 state of NO3
Masaru Fukushima and Takashi Ishiwata
Faculty of Information Sciences, Hiroshima City University
Asa-Minami, Hiroshima 731-3194, Japan
For the vibrational structure of the 𝐴1′ 1 state of NO3, two assignments are
proposed; a traditional assignment and one proposed by Stanton [1]. The major
difference is the position of the 3 fundamental, at 1492 and ~1000 cm-1, respectively.
To solve this problem, we have measured dispersed fluorescence (DF) spectrum from
the single vibronic levels (SVL's) of the state of jet cooled NO3, for both isotopomers, 14NO3 and 15NO3 [2]. The spectrum from the vibration-less level consists of three
regions; (I) regions around 1050 and 1500 cm-1, (II) the region below 1850 cm-1 except
(I), and (III) the region above 1850 cm-1. Region II displays relatively regular vibrational
structure including 1 fundamental and 4 progressions, 40n, n = 0, 1, 2, 3, and 10
140n, n
= 0, 1, 2. Region III possesses congested structure with levels thought to be heavily
mixed difficult to vibrationally characterize. In this paper, we will focus the vibrational
structure of the region I and the 2nd over-tone region of 1, ~2000 cm-1, in region III,
and discuss vibronic coupling in the 𝐴1′ 1 state.
First of all, three important findings are described. (1) We have found a new vibronic
band very close to the 1 fundamental in region I [2], and thus two relatively intense
vibronic bands are observed in the 1 fundamental region, ~1050 cm-1, on the DF
spectrum. In contrast, no bands have been detected in this region of the IR spectrum [3].
(2) In the 1500 cm-1 region of (I), only one intense band at 1500 cm-1 is observed on DF,
while two bands at 1492 and 1499 cm-1, which are e’ and a1’ bands, respectively, are
identified on IR hot bands [3]. (3) In the 2 1 region, two bands, at 2010 and 2118 cm-1,
are observed on DF, and both are attributed to be a1’, because they have not been
observed on IR [4]. The two bands show regular isotope shift [2]. Assuming Stanton’s
assignment, the levels at 1055 cm-1 (observed only on DF) and 1492 cm-1 (observed
only on IR) will be attributed to the e’ bands of the 3 fundamental and 3 + 4
combination levels, respectively, and his calculated DF spectrum quite nicely
reproduces the observed [1]. However, this calculated DF spectrum does not match the
observed DF spectrum. If the new band at 1055 cm-1 is labeled an e’ band of the 3
fundamental, then the e’ band of the combination, i.e. the 1492 cm-1 band, should be
observed even in DF, but it isn’t, while the a1’ band at 1500 cm-1 was remarkably
observed in both DF and IR. In addition to this mismatch at ~1500 cm-1, it is unusual for
IR that no e’ bands in region I have been observed; e.g. the 3 fundamental, expected to
lie at 1055 cm-1, should be observed in the IR spectrum, because the e’ band of the
combination at 1492 cm-1 is observed as the strongest band. Generally, a1’ bands are
preferentially observed in DF. Thus we think that the two intense bands at 1055 and
B13
60
1499 cm-1 on DF are both attributed to a1’. The inverse isotope shift of the 1
fundamental lying close to the former [2] is easily understandable, and the major
component of the latter is thought to be the 2nd over-tone of 2 (this is an out-of-plane
umbrella mode, and the fundamental is at 762 cm-1 [3]), in which a favorable Franck-
Condon factor is expected. This raises the question, what is the 1055 cm-1 a1’ band ?
We assign the 1055 cm-1 band to the 3rd over-tone of the 4 asymmetric ( e' ) mode, 3
4 ( a1' ). We also assigned a weaker band at about 160 cm-1 above the new band to
one with a final vibrational level of 3 4 ( a2' ). The 3 4 ( a1' ) and ( a2' ) levels are ones
with l = ±3. On the basis of experimental evidence of the strong correlation of the spin-
orbit constant upon the 4 vibrational level, Hirota proposed a new vibronic coupling
mechanism which suggests degenerate vibrational modes induce electronic orbital
angular momentum even in non-degenerate electronic states and 𝐾 = Λ + 𝑙 (this is
written as Λ = Λ + 𝑙 in [5]) should be conserved, where Λ is the induced Λ [5]. According
to this, one of the components of the 3rd over-tone level,| 𝐾 = +3 ; Λ = 0 ; 𝑣4 = 3 , 𝑙 =
+3 ⟩ , can have contributions of three components, | +3 ; +1 ; 3 , +2 ⟩ , | +3 ; +2 ; 3 ,
+1 ⟩ , and | +3 ; +3 ; 3 , 0 ⟩ . The counter pair of the state, | −3 ; 0 ; 3, −3 ⟩ , has
contributions of | −3 ; −1 ; 3, −2 ⟩ , | − 3 ; −2 ; 3 , −1 ⟩ , and | − 3 ; −3 ; 3 , 0 ⟩ .
Accordingly, it is expected that there are sixth-order vibronic couplings, ( 𝑞+2 𝑄+
4 +
𝑞−2 𝑄−
4 ) and ( 𝑞+4 𝑄+
2 + 𝑞−4 𝑄−
2 ) , for the 1st and 2nd components, respectively,
among the three between the two 3 4 components with l = ±3, | +3 ; 0 ; 3, +3 ⟩ and
| −3 ; 0 ; 3, −3 ⟩. The two 6th order couplings above can be interpreted as 2nd order
coupling of the 3rd order couplings, ( 𝑞+ 𝑄+2 + 𝑞− 𝑄−
2 )2 : Hirota-type [6] and ( 𝑞+2 𝑄+ +
𝑞−2 𝑄− )2 : dynamical-Jahn-Teller-type, respectively. In the case of Renner-Teller
interaction which is a typical of vibronic interactions, the 6th order couplings are weaker
than the Renner-Teller term ( the 4th order term, ( 𝑞+2 𝑄−
2 + 𝑞−2 𝑄+
2 ) ), but stronger
than the 8th order term, ( 𝑞+4 𝑄−
4 + 𝑞−4 𝑄+
4 ). It is well known in linear molecules that
the former, the 4th order term, shows huge splitting, comparable with vibrational
frequency, among the vibronic levels of electronic states, and the latter, the 8th order
term, shows considerable separation, ~10 cm-1, for electronic states. Consequently,
the ~160 cm-1 splitting at v4 = 3 is attributed to the 6th order interaction. The relatively
strong intensity for the band to 3 4 ( a1' ) can be interpreted as part of the huge 0-0
band intensity, because the 3 4 ( a1' ) level, | ± 3 ; 0 ; 3 , ±3 ⟩, can connect with the
vibration-less level, | 0 ; 0 ; 0 , 0 ⟩, through the Hirota- and dynamical-Jahn-Teller-types
coupling above. 3 4 ( a1' ) has two-fold intensity because of the vibrational
wavefunction, | +3; 0 ; 3, +3 ⟩ + | −3; 0 ; 3, −3 ⟩, while negligible intensity is expected for
3 4 ( a2' ) with | +3; 0 ; 3, +3 ⟩ − | −3; 0 ; 3, −3 ⟩ due to cancellation.
[1] J. F. Stanton, J. Chem. Phys. 126, 134309 (2007) and 69th ISMS, paper MI16.
[2] M. Fukushima and T. Ishiwata, 68th ISMS, paper WJ03.
[3] K. Kawaguchi et al., J. Phys. Chem. A 117, 13732 (2013). [4] T. Ishiwata et al., J. Phys. Chem. A 82, 980 (2010). [5] E. Hirota, J. Mol. Spectrosco. 310, 99 (2015). [6] E. Hirota, K. Kawaguchi, T. Ishiwata, and I. Tanaka, J. Chem. Phys. 95, 771 (1991).
B13
61

The Microwave Spectroscopy of Ground State CD3SH
(Univ. of Toyamaa, Kanazawa Univ.b) Kaori Kobayashia, Wataru Nakamuraa,
Tatsuro Matsushimaa, Shozo Tsunekawaa and Nobukimi Ohashib
Methyl mercaptan (methanethiol, CH3SH) is an interstellar organic molecule
containing sulfur. We have studied an isotopologue, CD3SH by using microwave
spectroscopy. In this study, 484 A-species transitions up to J = 46 and Ka = 10 and
581 E-species transitions up to J = 46 and Ka = 10 in the ground state were
least-squares-analyzed by using the pseudo-principal axis method (PAM) Hamiltonian
with 22 parameters consisting of rotational, centrifugal distortion, and
internal-rotational constants.
The methyl mercaptan molecule has similar molecular structure to methanol and its
rotational spectra has also similar characteristics including torsional-rotational
interaction. This molecule was also identified in interstellar Sgr B2 in 1979 [1].
The triply-deuterated methanol, CD3OH was found in IRAS 16293−2422 [2] encouraged us
to study this CD3SH molecule. Previous microwave studies on this molecule are limited
[3-5].
We also introduced pseudo-principal axis method (pseudo-PAM) [6], which was
successfully applied to the analysis of the HCOOCH3 in the second torsional excited
state. The internal-rotation parameter of methyl formate is about 0.08, which is fairly small, while CD3SH has much larger of about 0.8.
The spectra was taken by the conventional Stark/source-modulation microwave
spectrometer. The enriched sample was purchased from the manufacturer (MSD isotopes) and used
without further purification. The 12-240 GHz
frequency region was observed at room temperature
without gap. Fig. 1 shows an example spectrum.
Based on the preceding studies, we were able
to make predictions and to extend the assignments.
In total, we analyzed 1065 transitions by using the
pseudo-PAM method. The comparison with the
rho-axis method (RAM) will be shown.
References [1] R. A. Linke, M. A. Frerking, and P. Thaddeus, 234 (1979) Astrophys. J., L139-L142.
[2] B. Parise, A. Castets, E.Herbst, E.Caux, C. Ceccarelli, I. Mukhopadhyay, and A.
G. G. M. Tielens, 416 (2004) Astron. Astrophys., 159.
[3] T. Kojima, J. Phys. Soc. Jpn., 15 (1960) 1284-1291.
[4] Akihiro Kimura, University of Toyama, Master’s Thesis (1983).
[5] Tomoaki Hayashi, University of Toyama, Master’s Thesis (1990).
[6] K. Kobayashi, K. Takamura, Y. Sakai, S. Tsunekawa, H. Odashima, N. Ohashi, Astrophys.
J. Suppl. Ser. 205 (2013) 9-15.
Fig. 1 Spectrum of CD3SH in the ground state. The asterisk denotes the unresolved K doublets.
B14
62

Mass-analyzed threshold ionization spectroscopy of some sandwich molecules.
(IAMS, Academia Sinica, Taiwana, G. A. Razuvaev Institute of Organometallic Chemistry,
Russian Academy of Sciencesb) Sheng-Yuan Tzenga([email protected]), Pei-Ying
Wua([email protected]), Sergey Yulievich Ketkovb([email protected]), and Wen-Bih
Tzenga([email protected])
We applied the photo ionization efficiency and mass-analyzed threshold ionization (MATI)
techniques to record the cation spectra of (η6-benzene)(η6-biphenyl)chromium and
bis(η6-biphenyl)chromium. The adiabatic ionization energies (IEs) of these two
sandwich molecules are determined to be 43374 and 42874 ± 10 cm-1, respectively. The
prominent features appeared at 63, 150, 209, and 270 cm-1 with respect to the 0+ band
in the MATI spectrum of (η6-benzene)(η6-biphenyl)chromium result from the ring bending
vibrations of the cation. We also performed the density functional theory (DFT)
calculations at the B3PW91/6-311++G(d,p) level to predict the optimized molecular
structure, transition energy, and vibrational frequency for these species. These
calculations underestimates the IEs of these species by no more than 2%. The 0+ band
in the MATI spectrum of bis(η6-biphenyl)chromium has a full width at half maximum of
about 200 cm-1, which is much broader than a typical value of 10-20 cm-1. This broad
spectral feature likely results from overlap of the 0+ bands of six conformational isomer.
Our DFT calculations support the present experimental findings.
B15
63

Study of 2-Chloro-4-fluoroanisole by two-color resonant two-photon mass-analyzed
threshold ionization spectroscopy
(IAMS, Academia Sinica, Taiwana) Yu-Che Suna([email protected]), Wen-Bih
Tzenga([email protected])
We applied the resonant two-photon ionization (R2PI) and mass-analyzed threshold
ionization (MATI) spectroscopic techniques to record the vibronic and cation spectra
of 2-chloro-4-fluoroanisole (2C4FAN). The band origin of the S1← S0 electronic
transition of 2C4FAN was found at 34 621 ± 2 cm-1 and the adiabatic ionization energy
was determined to be 67 204 ± 5 cm-1. These spectra provide information about the active
vibrations of this molecule in the electronically excited S1 state and cationic ground
D0 state. Comparing these experimental data of 2C4FAN with those of o-chloroanisole,
p-fluoroanisole, and anisole, we can learn the effect of the nature and the location
on the ring of substituents on transition energy and molecular vibration.
B16
64

One-photon mass-analyzed threshold ionization (MATI) spectroscopy of
thietane cation
(Kangwon National Univ.) Yu Ran Lee, Hong Lae Kim, and Chan Ho Kwon*
E-mail:[email protected]
Thietane as a four-membered heterocyclic ring compound is prototypical molecule for
studying on equilibrium configuration of the neutral and the cation. We have measured
the high-resolution vibrational spectrum of theitane (trimethylene sulfide) cation in
the gas phase by employing the vacuum ultraviolet mass-analyzed threshold ionization
(VUV-MATI) technique. The measured VUV-MATI spectrum featured complicatedly in the low
frequency region, which demonstrated notably the twin peaks separated by 17 cm-1 with
the FWHM of ~8 cm-1 as the lowest frequency bands. Peaks in the low frequency region
of the observed spectrum of thietane cation could be successfully reproduced by solving
the Schrodinger equation with one-dimensional (1D) symmetric double-well potentials
along the ring puckering coordinates on both the S0 and D0 states of thietane,
respectively, which revealed as a progression of the ring puckering vibrational mode.
The values of the interconversion barrier and the ring puckering angle on the S0 state,
the parameters used for the quantum chemical calculations, were assumed to be 274 cm-1
and 26°. The barrier and the angle on the D0 state, however, are found to be 48.0 cm-1
and 18.2°, respectively, where such small barrier height and puckering angle for the cation suggest that the conformation of thietane cation on the D0 state should be more
planar than that of the thietane neutral. Then, the accurate ionization energy of
thietane was determined to be 69,762 ± 3 cm-1 (8.6493 ± 0.0004 eV) under the zero field
limit.
B17
65

One-photon vacuum ultraviolet mass-analyzed threshold ionization
(VUV-MATI) spectroscopy of crotonaldehyde
(Kangwon National Univ.) Sung Man Park, Hong Lae Kim, and Chan Ho Kwon*
E-mail:[email protected]
We measured the cationic vibrational spectrum of crotonaldehyde (2-butenal) using
one-photon vacuum ultraviolet mass-analyzed threshold ionization (VUV-MATI)
spectroscopy. The VUV radiation was generated by four-wave difference frequency
mixing in Kr gas. From the origin band in the MATI spectrum, the adiabatic ionization
energy of crotonaldehyde determined to be 9.7501 ± 0.0005 eV (78642 ± 0.0004 cm-
1). This value is in agreement with the previous one. To analyze the cationic
vibrational spectrum, we performed the Franck-Condon simulation at M062x/aug-cc-
pVDZ level, which revealed to be four stereo isomers of trans-s-trans, trans-s-cis,
cis-s-trans, and cis-s-cis crotonaldehyde. Most of vibrational peaks observed in
the spectrum were assigned to that of trans-s-trans crotonaldehyde and the remained
peaks were assigned to the vibrational peaks of trans-s-cis, cis-s-trans, or cis-
s-cis crotonaldehyde. The adiabatic ionization energies of trans-s-cis, cis-s-trans,
and cis-s-cis crotonaldehyde were determined to be 9.7619 ± 0.0005 eV (78737 ± 4
cm-1), 9.7121 ± 0.0005 eV (78335 ± 4 cm-1), and 9.6481 ± 0.0005 eV (77819 ± 4 cm-
1), respectively.
B18
66

Conformer-specific ion spectroscopy of isobutanal
(Kangwon National Univ.) Yu Ran Lee, Hong Lae Kim, and Chan Ho Kwon*
E-mail:[email protected]
Isobutanal is an aliphatic aldehyde which has been extensively considered as one of
important intermediates in isomerization reaction as well as astrochemical relevant
models in the interstellar medium. We report conformer-specific ionization dynamics
and cationic vibrational spectra of the isobutanal utilizing one-photon mass-
analyzed threshold ionization (MATI) spectroscopy using the vacuum ultraviolet (VUV)
laser pulse for the first time. The conformational preference of isobutanal in the
various supersonic expansion conditions was explored to identify the conformers,
from which the intrinsic ionization dynamics were elucidated by directly measuring
the VUV-MATI spectrum corresponding to each conformer. The observed conformer-
specific vibrational spectra of isobutanal cations could be definitely analyzed
through the Franck-Condon simulations at the B3LYP/cc-pVTZ level for isobutanal
conformers, trans and gauche. Most of all, we confirm that there exist two stable
conformers as gauche and trans in the lowest ionic state as well as the neutral
ground state, producing by accurate adiabatic ionization energies of 78,557 ± 3
cm-1 (9.7398 ± 0.0004 eV) and 78,136 ± 3 cm-1 (9.6878 ± 0.0004 eV), respectively.
Notably, only gauche conformer undergoes the unique geometrical change upon
ionization, resulting in the progression of the CHO torsional mode.
B19
67

Vacuum ultraviolet mass-analyzed threshold ionization spectroscopy of
hydrazoic acid (HN3)
(Kangwon National Univ.) Do Won Kang, Hong Lae Kim, and Chan Ho Kwon*
E-mail:[email protected]
We obtained the vibrational spectrum of hydrazoic acid (HN3) cation in the electronic
ground state by utilizing the vacuum ultraviolet mass-analyzed threshold ionization
(VUV-MATI) spectroscopy for the first time. For the one-photon ionization of
hydrazoic acid, the tunable and coherent vacuum ultraviolet (VUV) radiation in the
86200-88100 cm-1 (10.687-10.923 eV) range was generated by non-resonant four-wave
sum frequency mixing (ωVUV = 2ωUV+ωVis) in Xe and Ar mixture. The accurate ionization
energy of HN3 was determined to be 86,591 5 cm-1 from the 0-0 band position in the
MATI spectrum. To assign the peaks observed in the MATI spectrum, we carried out
the Franck-Condon simulations employing various methods and levels, from which the
precise structure of HN3 could be determined. It revealed that the observed spectrum
displayed mainly totally symmetric vibrational modes of A’for the linear HN3.
B20
68

Vacuum Ultraviolet Mass-Analyzed Threshold Ionization Spectroscopy of
Tetrahydrofuran
(Kangwon National Univ.) Sung Man Park, Chan Ho Kwon*, Hong Lae Kim*
E-mail:[email protected]
A vibrational spectrum of tetrahydrofuran (THF) cation in the gas phase was measured
by one-photon vacuum ultraviolet mass analyzed threshold ionization (MATI)
spectroscopy. The cation of a designated mass was detected with a time-of-flight
mass spectrometer by pulsed field ionization of the molecule in the high Rydberg
states delayed by a laser pulse scanning across the region of the vibrational
spectrum. From the position of the 0-0 band in the zero field limit and the
photoionization efficiency curve, the accurate first adiabatic ionization energy
was measured, which is 9.4256 eV. The observed ionization energy was assigned as a
result of the transition of the molecule with C2 symmetries on both the ground S0
and cationic ground D0 states. Quantum chemical calculations for the molecule in
the S0 and D0 states were performed and the peaks in the spectrum were successfully
assigned employing the dipole selection rules between the S0-D0 transition and
Franck-Condon factors calculated by varying structural parameters, which determines
the accurate molecular structure of the tetrahydrofuran cation.
B21
69

Temperature effect on the microscopic hydration structures of phenol cation
(Kitasato Univ.) Itaru Kurusu, Reona Yagi, Ryota Kato, Yashutoshi Kasahara, Haruki Ishikawa
E-mail: [email protected]
Temperature effects on the hydration structure is very important to understand microscopic nature of the
hydrogen bond network. One of the temperature effects on the hydration structure in the cluster is a
change in relative populations among the isomers. In the present study, we have carried out ultraviolet
photodissociation spectroscopy of hydrated phenol cation trapped in the temperature-variable ion trap.
We have succeeded in observing a clear change in the relative populations between the isomers having
distinct hydration structures. The temperature-dependence observed is well interpreted by flexibility of
the hydration structures of the isomers obtained by theoretical calculations.
Introduction
Hydrogen bond plays an important role in various chemical and biological process. To investigate the
microscopic nature of hydrogen bond, a large number of spectroscopic studies of the gas-phase
molecular clusters have been carried out and hydration structures of various systems have been
determined so far. Since hydration structures are flexible in nature, temperature effect is very important.
One of the temperature effects on the microscopic hydration structure is a change in relative populations
among the isomers. In the present study, we have carried out ultraviolet (UV) photodissociation (PD)
spectroscopy of hydrated phenol cation, [PhOH(H2O)5]+, trapped in our temperature-variable 22-pole
ion trap. We have succeeded in observing a clear temperature dependence of the relative populations of
the isomers having distinct hydration structures. Possible hydration structures of the clusters are
obtained by density functional theory (DFT) calculations. The relative populations of the isomers are
also estimated by statistical mechanically based on the results of the DFT calculation. In the present
paper, we would like to discuss the temperature effect on the hydration structure of [PhOH(H2O)5]+
based on the experimental and theoretical results.
Experimental and computational details
In the present study, we used our temperature-variable 22-pole ion trap apparatus [1]. The hydrated
phenol cation clusters were generated by the combination of laser ionization and supersonic expansion
techniques. The clusters produced were mass-separated by the first quadrupole mass filter and then
introduced into the 22-pole ion trap. The ions in the trap were temperature-controlled by the He buffer
gas cooling method. After the achievement of the thermal equilibrium condition, UV laser light was
irradiated to the clusters. The photofragment ions were mass-analyzed and detected by the second
quadrupole mass analyzer. Possible hydration structures of isomers of [PhOH(H2O)5]+ were obtained by
the DFT calculation at B97X-D/6-311++G(3df,3pd) level. We also estimated Gibbs energy of the
isomers at various temperatures based on statistical mechanics. Then relative populations of the isomers
were obtained assuming the Boltzmann distribution.
B22
70

Results and Discussion
In the present study, we evaluated the vibrational temperatures of the ions in the trap based on the relative
intensities of hot bands in the electronic spectra of phenol-trimethylamine cation, [PhOH-TMA]+. Since
a proton of the phenol moiety is transferred to trimethylamine side, the chromophore of the UV transition
is a phenoxy radical in the cluster. The UV transition observed in the present study corresponds to the
D3-D0 transition of the phenoxy radical. As a result, vibrational temperatures of the [PhOH-TMA]+ are
almost the same as the temperature of the trap except for the case when the temperature of the trap is set
below 30 K. The vibrational temperature of 30 K is the lowest one achieved in our trap.
Then, we measured the UV photodissociation spectrum of [PhOH(H2O)5]+ at vibrational
temperatures from 30 to 150 K. In Figure 1, the spectra observed at 30 K and 150 K are shown. In the
spectra measured at 30 K, only one isomers are observed. Hereafter, this isomer is referred to as isomer
A. As the temperature elevates, another isomer is observed in the spectra. In Figure 1(b), the 0-0 band
of a newly appeared species (isomer B) is denoted as B. The intensity of the 0-0 band of the isomer B is
larger than that of the isomer A. This indicates an inversion of the relative populations between the
isomers A and B occurs around at 150 K. Anyway, these spectra clearly indicates the change in the
relative population between the two isomers along the temperature elevation.
Possible structures of the isomers A and B are also shown in Figure 1. They have distinct
hydration structures and are expected to exhibit different temperature dependence in the relative
populations. The isomer B has a flexible chain type hydration structure, which indicates a large entropic
contribution in the temperature
dependence. On the other hand, the
hydration structure of the isomer A
involves ring type structure. It
should be less flexible than the
chain type structures. Thus, the
inversion of the relative population
experimentally observed around
150 K is qualitatively interpreted
by the difference in the flexibility
of the hydration structures of the
isomers A and B.
Details of the discussion
will be presented in the paper.
[1] H. Ishikawa et al. Chem. Phys. Lett. 514, 234 (2011).
Figure 1. Photodissociation spectra of [PhOH(H2O)5]+ measured at
(a) T = 30 K and (b) T = 150 K. Possible hydration structures of the
isomers A and B are inserted.
B22
71

Proton diffusion dynamics along a diol as a proton-conducting wire in a
photo-amphiprotic model system
(Center for Soft and Living Matter, Institute for Basic Science (IBS)a, Department of
Chemistry, School of Natural Science, Ulsan National Institute of Science and
Technology (UNIST)b)
Ye-Jin Kima, b ([email protected]), Kyeong Eun Mun([email protected]), and Oh-Hoon
Kwona, b ([email protected])
We investigated the dynamics of excited-state proton transfer (ESPT) of
photo-amphiprotic 7-hydroxyquinoline (7HQ) in the presence of a hydrogen (H)-bond
bridging diol in a polar aprotic medium. The formation of 1 : 1 H-bonded complexes of
7HQ with various diols of different alkane chain lengths was revealed using steady-state
electronic spectroscopy. With femtosecond-resolved fluorescence spectroscopy, cyclic
H-bonded 1 : 1 complexes were found to undergo facile ESPT from the acidic enol to the
basic imine group of 7HQ via the H-bond bridge. Through quantum chemical calculations,
we found that the proton-transfer rate of the well-configured H-bonded complex
correlated with the intramolecular H-bond length of a H-bond wiring diol molecule.
Noncyclic, singly H-bonded 7HQ with a diol molecule was observed to undergo ESPT once
another diol molecule diffuses to the noncyclic complex and accomplishes the formation
of a reactive cyclic H-bonded 7HQ-(diol)2 complex, which was evidenced by the
observation that the overall proton-transfer rate constant decreases when a
longer-chain diol was used as the bridging wire part. The kinetic isotope effect on
the proton relay was investigated to confirm that the nature of the activation barrier
for the proton diffusion along the wire is isotope-sensitive proton tunnelling, while
for the non-cyclic configuration, the isotope-insensitive H-bond bridge formation is
a prerequisite for ESPT.
Figure Transition of the reaction coordinate for the ESPT of cyclic H-bond bridged
complexes of 7HQ. (a) H-bonded complex with two alcohol molecules as a H-bond bridge.
(b) H-bond complex with one diol molecule as the bridge. RDM denotes the
rate-determining step.
B23
72

Orientation change and structure according to the various pH conditions of
4-amino-4’-cyanobiphenyl on silver surfaces: SERS and DFT study
(Kangwon National Univ.) So Young Eom, Hong Lae Kim*, and Chan Ho Kwon*
E-mail: [email protected]
Surface-enhanced Raman Scattering (SERS) spectra of 4-amino-4’-cyanobiphenyl
(44ACBP) adsorbed on Ag colloidal nanoparticles were measured in various pH conditions.
In neutral and alkaline solutions, the molecule should be adsorbed flat on the surface
whereas in acidic solution, the molecule should vertically be adsorbed through the
CN-metal bonding due to protonation in the amine group. The peaks observed in the spectra
were assigned in comparison to those in the normal Raman spectra taking advantage of
quantum chemical density functional theory (DFT) calculations. The adsorption behavior
could be identified from spectral analyses of relative enhancement of the in-plane
against the out-of-plane vibrational modes observed in the SERS spectra. The
orientation of 44ACBP adsorbed on the Ag surface could be reversibly controlled to flat
or vertical orientation by changing pH in solution.
B24
73

Study of Hydrogen-Bonding Energetics and Dynamics of Biological Water Using
Ultrafast Electronic Spectroscopy
(Center for Soft and Living Matter, Institute for Basic Science (IBS)a, Department of
Chemistry, School of Natural Science, Ulsan National Institute of Science and
Technology (UNIST)b, Department of Molecular Science and Technology, Ajou Universityc)
Young Jae Kima,b, Byeong Sung Leec, Tae Hyeon Yooc, Oh-Hoon Kwona,b* ([email protected])
When water molecules locate near a biological macromolecule such as protein,
their properties are known to deviate from those of water molecules in bulk. Those water
molecules in the vicinity of protein surfaces are called biological water. Biological
water plays crucial roles in the structure, dynamics and function of biological entities
including protein-protein and protein-substrate interactions [1]. Therefore, the study
of the energetics and dynamics of biological water is an essential step towards better
understanding the characteristics of biological phenomena.
At a biological surface, the hydrogen bond of a water molecule among them can
be either replaced by that to a hydrophilic protein surface or limited depending on
the topology, hydrophobicity, and/or the charged state of the protein surface (and
pocket). The hydration dynamics of biological water has been intensively explored,
experimentally and theoretically, to show its deceleration compared to the dynamics
of bulk water [1-3]. On the other hand, its energetics has been overlooked, which is
a key to understand the molecular interactions at biological surfaces.
Here we report the analysis of the hydrogen-bond energy of biological water
through chemical kinetics analysis of excited-state proton transfer (ESPT) mediated
by a water hydrogen-bond bridge. The fluorescent, non-canonical amino acid,
7-azatryptophan (AW), was used in this study as a probe. The chromophore of AW,
7-azaindole, is well-known for undergoing ESPT catalyzed by a water molecule, for which
7-azaindole competes with other water molecules to form a cyclic hydrogen-bond bridge.
The probe is inserted to a coiled-coil protein to selectively probe the water energetics
at the surface of the protein [4]. From the measurements of the femtosecond-resolved
fluorescence spectra of the fluorescent amino acids installed, the hydration dynamics
was also investigated.
References
[1] Bhattacharyya, K. Chem. Commun. 2008, 25, 2848-2857
[2] Zhong, D.; Pal, S. K.; Zewail, A. H. Chem. Phys. Lett. 2011, 503, 1-11
[3] Qin, Y.; Wang, L.; Zhong, D. Proc. Natl. Acad. Sci. USA 2016, 113, 8424-8429
[4] Kwon, O.-H.; Yoo, T. H.; Othon, C. M.; Van Deventer, J. A.; Tirrell, D. A.; Zewail,
A. H. Proc. Natl. Acad. Sci. USA 2011, 107, 17101-17106
B25
74
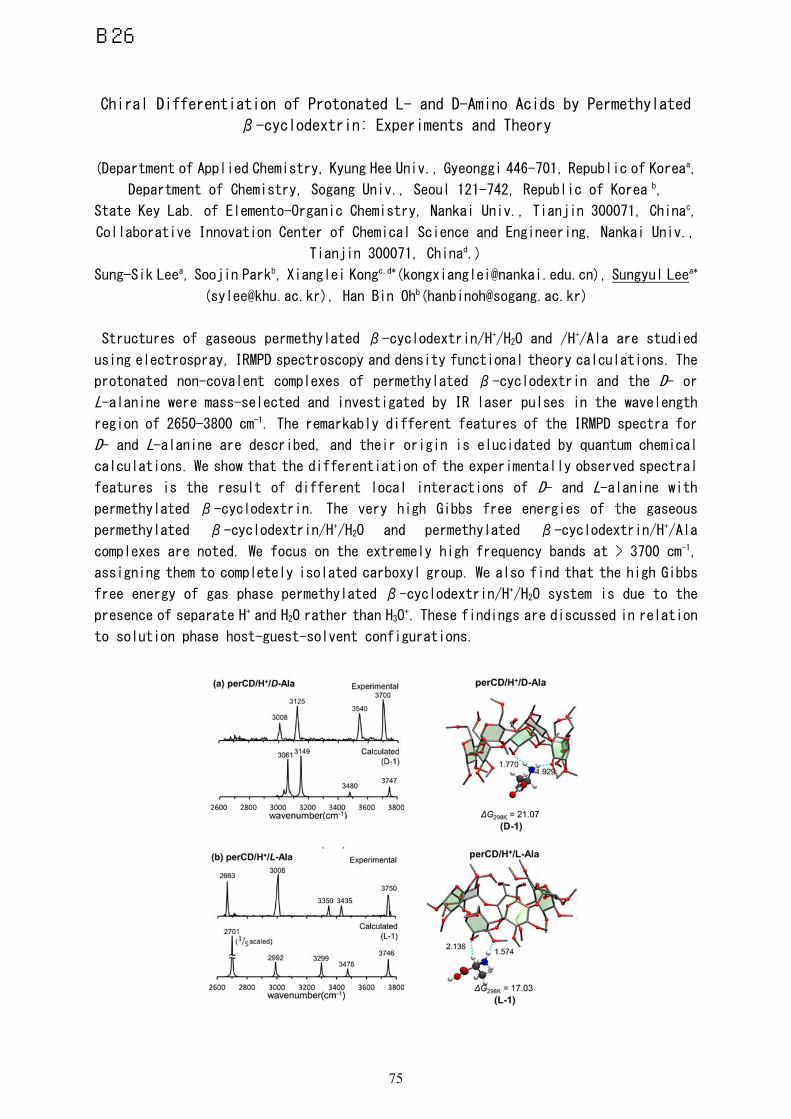
Chiral Differentiation of Protonated L- and D-Amino Acids by Permethylated
β-cyclodextrin: Experiments and Theory
(Department of Applied Chemistry, Kyung Hee Univ., Gyeonggi 446-701, Republic of Koreaa,
Department of Chemistry, Sogang Univ., Seoul 121-742, Republic of Korea b,
State Key Lab. of Elemento-Organic Chemistry, Nankai Univ., Tianjin 300071, Chinac,
Collaborative Innovation Center of Chemical Science and Engineering, Nankai Univ.,
Tianjin 300071, Chinad.)
Sung-Sik Leea, Soojin Parkb, Xianglei Kongc,d*([email protected]), Sungyul Leea*
([email protected]), Han Bin Ohb([email protected])
Structures of gaseous permethylated β-cyclodextrin/H+/H2O and /H+/Ala are studied
using electrospray, IRMPD spectroscopy and density functional theory calculations. The
protonated non-covalent complexes of permethylated β-cyclodextrin and the D- or
L-alanine were mass-selected and investigated by IR laser pulses in the wavelength
region of 2650-3800 cm-1. The remarkably different features of the IRMPD spectra for
D- and L-alanine are described, and their origin is elucidated by quantum chemical
calculations. We show that the differentiation of the experimentally observed spectral
features is the result of different local interactions of D- and L-alanine with
permethylated β-cyclodextrin. The very high Gibbs free energies of the gaseous
permethylated β-cyclodextrin/H+/H2O and permethylated β-cyclodextrin/H+/Ala
complexes are noted. We focus on the extremely high frequency bands at > 3700 cm-1,
assigning them to completely isolated carboxyl group. We also find that the high Gibbs
free energy of gas phase permethylated β-cyclodextrin/H+/H2O system is due to the
presence of separate H+ and H2O rather than H3O+. These findings are discussed in relation
to solution phase host-guest-solvent configurations.
B26
75

Photodissociation of CF2ICF2I and CF2I2 in solution probed by femtosecond infrared
spectroscopy
(Pusan National Univ.) Seongchul Park, Joohyang Shin, Changwon Yang, Youngshang Pak,
and Manho Lim
Photodissociation dynamics of CF2ICF2I and CF2I2 in solution was investigated by probing
the C–F stretching mode using femtosecond infrared spectroscopy after excitation with
a 267-nm photon. Dissociation of the first I atom was faster than 0.3 ps after the UV
absorption. All of the resulting haloethyl radicals undergo the secondary dissociation
with two time constants; the radical from the anti-CF2ICF2I in CCl4 and in acetonitrile
solutions dissociate with time constants of 175 ± 5 ps and 40 ps, respectively. The
radical from gauche-CF2ICF2I in both solutions dissociates with the same time constant
of 7 ± 1 ns. Some portion of the radical from CF2ICF2Br geminately rebinds and the
remaining forms CF2CF2 with a time constant of 160 ns. A photodissociation mechanism
that explains the conformer-dependent dissociation rate as well as solvent-dependent
dissociation rate was suggested based on a potential energy surface calculated CASSCF.
B27
76

Hydration Characteristics of a Water Pool in a Nano-Confined System Probed by
a Superphotoacid
(Department of Chemistry, School of Natural Science, Ulsan National Institute of
Science and Technology (UNIST)a, Center for Soft and Living Matter, Institute for Basic
Science (IBS)b) Jae-Heon Parka, Hak-Won Nhoa and Oh-Hoon Kwona,b* ([email protected])
The reverse micellar system is a representative biomimetic molecular system.
A reverse micelle consists of a non-polar solvent phase, an interfacial region of
surfactant molecular layer and a water pool [1]. The characteristics of a reverse
micelle system varies with the size of the reverse micelle, mainly the size of the water
pool confined in a nanometer core. The water nanopool can be further distinguished as
two different regions; boundary water and free water. In the boundary water region,
the water molecules have strong dipole-ion interaction with the surfactant head groups,
so the boundary water motion is more restricted than free water motion [2,3]. The motion
of water molecules in the free water region becomes similar with that of bulk water.
Here, we investigated the hydration characteristics of a water pool in the
Aerosol-OT (sodium bis[2-ethylhexyl] sulfosuccinate) reverse micelle by measuring the
fluorescence of cationic superphotoacid, N-methyl-7-hydroxyquniolinium (NM7HQ+) ion
in a water nanopool. NM7HQ+ is a strong photoacid with a much lower pKa value when excited
by light than in the ground state which triggers the excited-state deprotonation of
the cationic NM7HQ+ (C) giving birth to a product, keto form (K). The two prototropic
species have different formal charges, which affect residence sites and diffusive
motions in the confined environment of the reverse micelle.
The excited-state dynamics of NM7HQ+ was analyzed by measuring
picosecond-resolved emission spectra (TRES). The spectral deconvolution of the TRES
into the spectra of the two prototropic species allowed for the differentiation of the
spectral shift from the excited-state population dynamics. As a result, we could
successfully resolve the hydration dynamics in the water pool and correlate it to
proton-transfer dynamics. Also, the time-dependent florescence anisotropy
measurements revealed the rotational diffusion dynamics of the two prototropic species.
References
[1] Shirota, H.; Horie, K. J. Phys. Chem. B 1999, 103, 1437-1443 [2] Chatterjee A.; Maity B.; Seth D. Phys. Chem. Chem. Phys. 2013, 15, 1894-1906 [3] Kwon O.–H.; Kim T. G.; Lee Y.-S.; Jang D.-J. J. Phys. Chem. B 2006, 110, 11997-12004
B28
77

Local Mode-Based Infrared Probe Spectra: a Case Study of Formic Acid-Water
Clusters and Solutions
(Institute of Theoretical Chemistry, Jilin University) Yang Conga, Hui Lib
Email: [email protected]
A new method based on perturbation theory and statistical method is developed to simulate
the IR spectra of clusters and solutions. This approach could be used to quickly predict
more accurate spectra corresponding to formic acid C=O stretching in water clusters and
condensed states than traditional methods. Vibrational localization method[1] can be used to
select the most related modes to the C=O stretching, which is helpful to find a more effective
vibrational space in following calculations. Ab initio molecular dynamics simulation is used
to sample intermolecular configurations of clusters, and quantum treatment based on the
perturbation approximation is made following that. Fourier transformation is performed to
get the spectrum with not only peak positions but also line shapes. Hence, the method could
get an experiment-comparable time-dependent transition frequencies of the system. This
method was firstly successfully applied in the study of HCl-water clusters[2]. In this work, we
will extend this approach and applied it in studying the IR proble spectra of formic
acid-water clusters and solutions.
[1] Christoph R. Jacob, Sandra Luber and Markus Reiher J. Phys. Chem. B, 113(18) 6558-6573 (2009)
[2] Rui-Jie Xue, Adam Grofe, He Yin, Zexing Qu, Jiali Gao,and Hui Li. J. Chem. Theory. Comput. 13, 191-201
(2017)
B29
78