1q21 results laying the foundations of the upcoming 2024
TRANSCRIPT

Natixis - 30, avenue Pierre Mendès France - 75013 Paris – Address: BP 4 - 75060 Paris Cedex 02 - France – Tel: +33 1 58 32 30 00 - www.natixis.com Limited liability company with a Board of Directors, with a share capital of 5,052,644,851.20 euros - Trade register No. 542 044 524 - VAT: FR 73 542 044 524
C3 - Restricted Natixis
Paris, May 6, 2021
1Q21 results
Laying the foundations of the upcoming 2024 strategic plan
Reported net income at +€225m in 1Q21 (€(204)m in 1Q20) and underlying net income1 at +€239m (€(81)m in 1Q20)
Underlying RoTE1 at 10.4% in 1Q21
Basel 3 FL CET1 ratio2 at 11.6% +330bps above regulatory requirements
BUSINESS ACTIVITY BUSINESSES’ UNDERLYING NET REVENUES1 AT €2.1BN IN 1Q21, UP +21% YOY
AWM: Business growth and continued AuM increase
Underlying net revenues1 excl. H2O AM up +11% YoY (flat YoY including H2O AM) mainly driven by higher management fees and financial revenues
Natixis Investment Managers’ AuM up +3% QoQ. AuM at €1,153bn3 as at end-March 2021
Positive asset management net inflows on long-term products of ~€6bn3 in 1Q21 mainly driven by North American affiliates with net inflows notably turning positive at Harris. More than €20bn3 positive net inflows on long-term products over the past 12 months
CIB: Continued development and cost of risk improvement
Underlying net revenues1 up +38% YoY (+9% excluding dividend mark-downs and XvA impacts in 1Q20). Net revenue growth mainly driven by Global markets and Global finance
Underlying cost income ratio1 improving to 58.6% in 1Q21 (78.0% in 1Q20) thanks to a positive jaw effect
Cost of risk benefiting from a favorable environment in 1Q21 although still at elevated levels at 52bps of outstandings
Underlying RoE1 at 12.3% in 1Q21
Insurance: Solid commercial activity and financials
Underlying net revenues1 up +5% YoY in 1Q21 with a positive jaw effect
Underlying RoE1 at ~30% in 1Q21
Life Insurance4: AuM growth of +4% QoQ to reach €75.7bn (of which 27% of unit-linked products)
Payments: Net revenue growth and investments
Underlying net revenues1 up +4% YoY in 1Q21 despite COVID-19 lockdown measures in France
Underlying RoE1 at 10.6% in 1Q21 while maintaining investment in order to ensure a sustainable development
FINANCIAL STRENGTH Underlying net income1 at +€239m in 1Q21 (+€225m reported) vs. €(81)m in 1Q20 (€(204)m reported). Underlying RoTE1 at 10.4% in 1Q21
Basel 3 FL CET1 ratio2 at 11.6% as at March 31, 2021 (flat vs. 4Q20), +330bps above regulatory requirements
“Natixis’ results for the first quarter of 2021 continue the positive momentum underway since the second half of 2020. Our business lines are on a sustainable growth path, underpinned by the transformation measures undertaken over recent months. These results represent a solid base for the kick-off of the 2021-2024 strategic plan and for the ongoing growth of Natixis’ four businesses under the simplification and development project presented by Groupe BPCE in February. I would like to pay tribute to the exceptional commitment of our teams who have remained fully mobilized throughout this unprecedented crisis to support our clients and contribute to a sustainable economic recovery.”
Nicolas Namias, Natixis Chief Executive Officer
2020 figures restated for the evolution of the standards applied as well as the evolution of the Asset and wealth management organization as of January 1st, 2021 (see note on methodology) 1 Excluding exceptional items. Excluding exceptional items and excluding IFRIC 21 in 4Q for cost/income, RoE and RoTE 2 See note on methodology 3 Excluding H2O AM (~€18bn AuM as at March 31, 2021) 4 Excluding reinsurance agreement with CNP
2
C3 - Restricted Natixis
1Q21 RESULTS
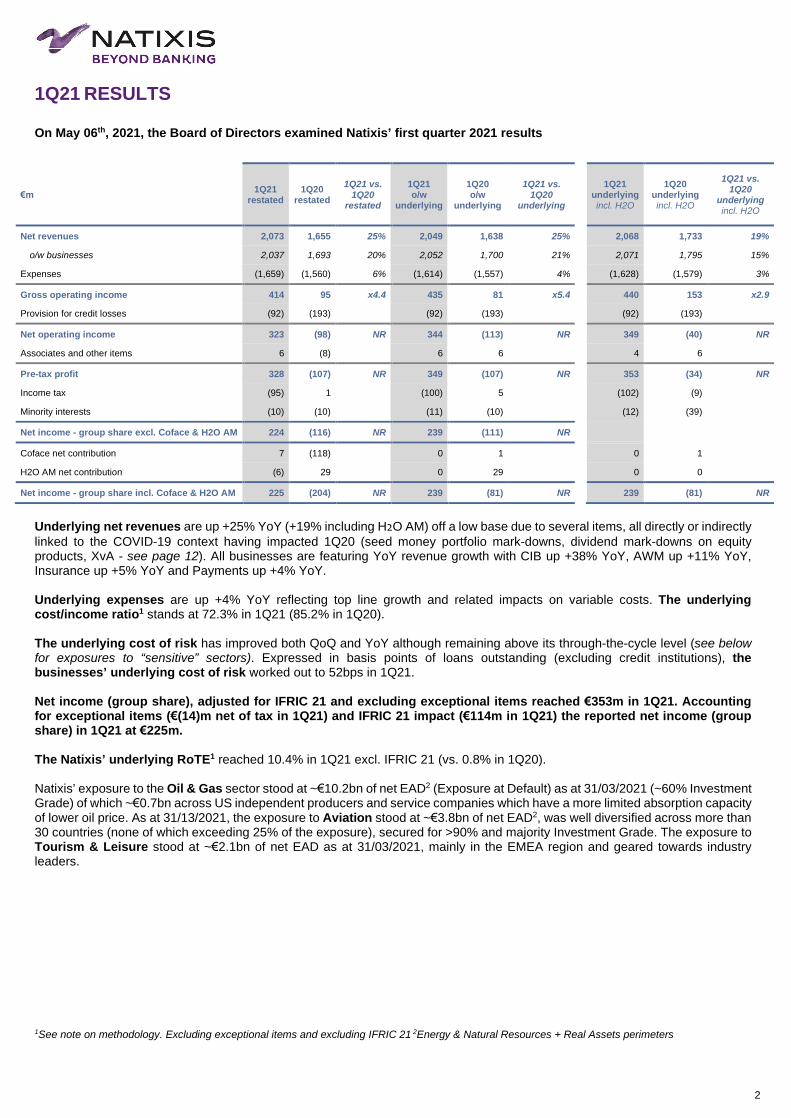
On May 06th, 2021, the Board of Directors examined Natixis’ first quarter 2021 results
€m 1Q21
restated 1Q20
restated
1Q21 vs. 1Q20
restated
1Q21 o/w
underlying
1Q20 o/w
underlying
1Q21 vs. 1Q20
underlying
1Q21 underlying incl. H2O
1Q20 underlying incl. H2O
1Q21 vs. 1Q20
underlying incl. H2O
Net revenues 2,073 1,655 25% 2,049 1,638 25% 2,068 1,733 19%
o/w businesses 2,037 1,693 20% 2,052 1,700 21% 2,071 1,795 15%
Expenses (1,659) (1,560) 6% (1,614) (1,557) 4% (1,628) (1,579) 3%
Gross operating income 414 95 x4.4 435 81 x5.4 440 153 x2.9
Provision for credit losses (92) (193) (92) (193) (92) (193)
Net operating income 323 (98) NR 344 (113) NR 349 (40) NR
Associates and other items 6 (8) 6 6 4 6
Pre-tax profit 328 (107) NR 349 (107) NR 353 (34) NR
Income tax (95) 1 (100) 5 (102) (9)
Minority interests (10) (10) (11) (10) (12) (39)
Net income - group share excl. Coface & H2O AM 224 (116) NR 239 (111) NR
Coface net contribution 7 (118) 0 1 0 1
H2O AM net contribution (6) 29 0 29 0 0
Net income - group share incl. Coface & H2O AM 225 (204) NR 239 (81) NR 239 (81) NR
Underlying net revenues are up +25% YoY (+19% including H2O AM) off a low base due to several items, all directly or indirectly linked to the COVID-19 context having impacted 1Q20 (seed money portfolio mark-downs, dividend mark-downs on equity products, XvA - see page 12). All businesses are featuring YoY revenue growth with CIB up +38% YoY, AWM up +11% YoY, Insurance up +5% YoY and Payments up +4% YoY. Underlying expenses are up +4% YoY reflecting top line growth and related impacts on variable costs. The underlying cost/income ratio1 stands at 72.3% in 1Q21 (85.2% in 1Q20). The underlying cost of risk has improved both QoQ and YoY although remaining above its through-the-cycle level (see below for exposures to “sensitive” sectors). Expressed in basis points of loans outstanding (excluding credit institutions), the businesses’ underlying cost of risk worked out to 52bps in 1Q21. Net income (group share), adjusted for IFRIC 21 and excluding exceptional items reached €353m in 1Q21. Accounting for exceptional items (€(14)m net of tax in 1Q21) and IFRIC 21 impact (€114m in 1Q21) the reported net income (group share) in 1Q21 at €225m. The Natixis’ underlying RoTE1 reached 10.4% in 1Q21 excl. IFRIC 21 (vs. 0.8% in 1Q20). Natixis’ exposure to the Oil & Gas sector stood at ~€10.2bn of net EAD2 (Exposure at Default) as at 31/03/2021 (~60% Investment Grade) of which ~€0.7bn across US independent producers and service companies which have a more limited absorption capacity of lower oil price. As at 31/13/2021, the exposure to Aviation stood at ~€3.8bn of net EAD2, was well diversified across more than 30 countries (none of which exceeding 25% of the exposure), secured for >90% and majority Investment Grade. The exposure to Tourism & Leisure stood at ~€2.1bn of net EAD as at 31/03/2021, mainly in the EMEA region and geared towards industry leaders. 1See note on methodology. Excluding exceptional items and excluding IFRIC 21 2Energy & Natural Resources + Real Assets perimeters

3
C3 - Restricted Natixis
1Q21 RESULTS Exceptional items
€m 1Q21 1Q20
Exchange rate fluctuations on DSN in currencies (Net revenues) Corporate center 39 24
Provision for litigation (Net revenues) CIB (15) (0)
Contribution to the Insurance solidarity fund (Net revenues) Insurance 0 (7)
Transformation & Business Efficiency Investment costs (Expenses) Business lines & Corporate center (28) 0
Real estate management strategy and other (Expenses) Business lines & Corporate center (17) (3)
Impact of Liban default on ADIR Insurance (Associates) Insurance 0 (14)
Coface residual stake valuation (Coface net contribution) Coface 7 (7)
Coface capital loss (Coface net contribution) Coface 0 (112)
H2O AM exchange rate fluctuations (H2O AM net contribution) H2O AM (6) 0
Total impact on income tax 5 (4)
Total impact on minority interests 1 0
Total impact on net income (gs) (14) (123)
Breakdown of Transformation & Business Efficiency Investment costs by businesses
€m 1Q21 1Q20
AWM (6) 0
CIB (7) 0
Insurance (0) 0
Payments (1) 0
Corporate center (14) (0)
Impact on expenses (28) 0
Real estate management strategy and other - €(14)m in the Corporate center and €(3)m in Payments in 1Q21. Mainly Corporate center in 1Q20

4
C3 - Restricted Natixis
Unless specified otherwise, the following comments and data refer to underlying results, i.e. excluding exceptional items (see details page 3)
Asset & Wealth Management
€m 1Q21 1Q20 1Q21
vs. 1Q20
1Q21 vs. 1Q20
constant FX
Net revenues 755 680 11% 17%
o/w Asset Management1 689 615 12% 19%
o/w Employee savings plan 25 24 4% 4%
o/w Wealth management 41 41 1% 1%
Expenses (581) (559) 4% 9%
Gross operating income 174 121 44% 58%
Provision for credit losses (2) 1
Associates and other items (0) (2)
Pre-tax profit 172 119 44%
Cost/income ratio2 76.4% 81.7% (5.3)pp
RoE after tax2 10.4% 9.1% 1.3pp
AWM including H2O AM
€m 1Q21 1Q20 1Q21
vs. 1Q20
Net revenues 773 774 0%
o/w Asset Management1 707 710 0%
o/w Employee savings plan 25 24 4%
o/w Wealth management 41 41 1%
Expenses (594) (581) 2%
Gross operating income 179 193 (7)%
Provision for credit losses (2) 1
Associates and other items (2) (2)
Pre-tax profit 175 192 (9)%
The AWM underlying gross operating income is up +44% YoY in 1Q21. AM net revenues excluding performance fees are up +10% YoY in 1Q21, mainly driven by higher management fees and financial revenues. AM perf. fees reached €18m in 1Q21 vs. €3m in 1Q20 (excl. H2O AM) and are mainly coming from Loomis. The net revenue contribution is up YoY across affiliates in both North America and Europe. AWM underlying expenses are up +4% in 1Q21 including a -4% YoY reduction in AM non-comp expenses at constant exchange rate, translating into positive jaws. The Asset management overall fee rate excluding performance fees and excluding H2O AM is at ~23bps in 1Q21 and ~37bps excl. Ostrum AM (-0.7bps QoQ). Fee rate at ~34bps for North American affiliates and at ~39bps for European affiliates excl. Ostrum AM, which fee rate stands at ~3bps. Asset management AuM3 are up +3% QoQ at €1,153bn with positive net inflows, a positive market effect (+€9bn) and FX/other impact (+€22bn). An improvement in funds’ performance and percentile rankings can be noticed in 1Q21 with ~75% of funds in the first two quartiles on a 3-year view and ~85% on a 5-year view (o/w ~30% in the first decile). AM net inflows3 on LT products reached ~€6bn in 1Q21 driven by North American affiliates across fixed income and equity strategies. Positive net inflows at Harris Associates (AuM now >$115bn) driven by institutional accounts. Flat flows into European affiliates with a continued strong momentum for ESG strategies and private assets offsetting outflows on life insurance products. The US and International distribution platforms are supportive of the flow dynamics with >€20bn of net inflows on LT products over the last 12 months.
1Asset management including Private equity 2 See note on methodology. Excluding exceptional items and excluding IFRIC 21 3 Europe including Dynamic Solutions and Vega IM AuM, excluding H2O AM (€18bn AuM as at 31/03/2021). US including WCM IM
5
C3 - Restricted Natixis
Unless specified otherwise, the following comments and data refer to underlying results, i.e. excluding exceptional items (see details page 3)
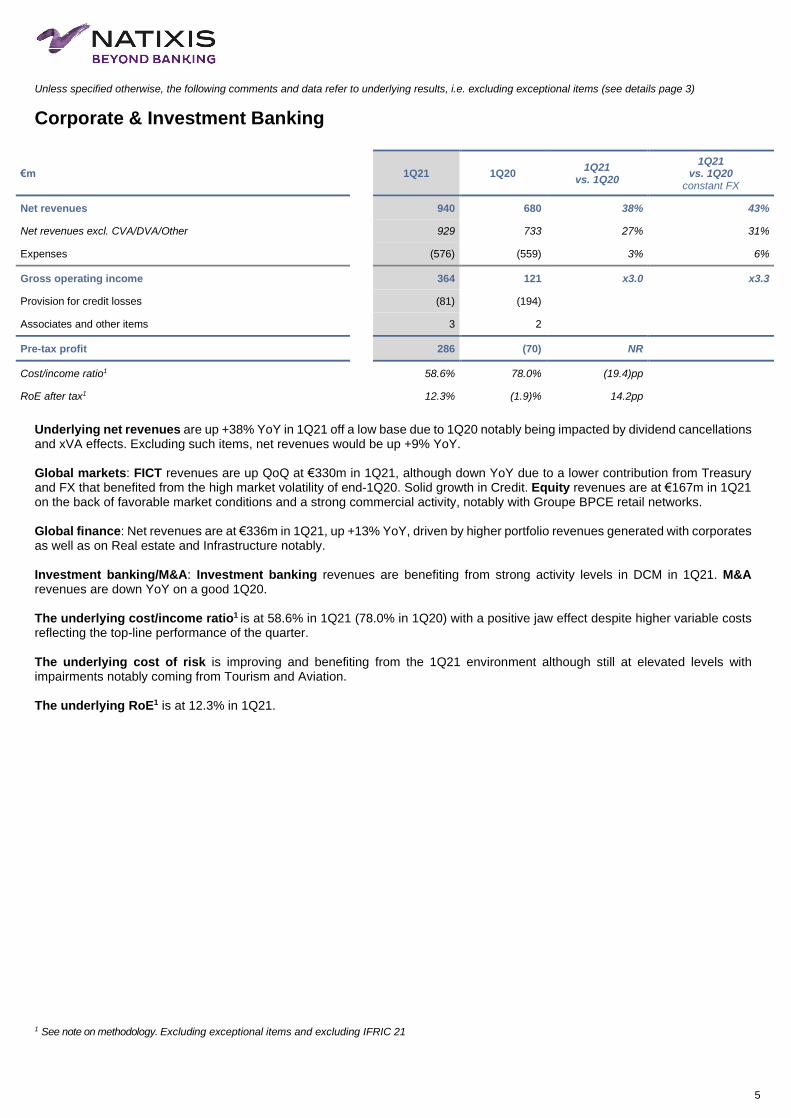
Corporate & Investment Banking
€m 1Q21 1Q20 1Q21
vs. 1Q20
1Q21 vs. 1Q20
constant FX
Net revenues 940 680 38% 43%
Net revenues excl. CVA/DVA/Other 929 733 27% 31%
Expenses (576) (559) 3% 6%
Gross operating income 364 121 x3.0 x3.3
Provision for credit losses (81) (194)
Associates and other items 3 2
Pre-tax profit 286 (70) NR
Cost/income ratio1 58.6% 78.0% (19.4)pp
RoE after tax1 12.3% (1.9)% 14.2pp
Underlying net revenues are up +38% YoY in 1Q21 off a low base due to 1Q20 notably being impacted by dividend cancellations and xVA effects. Excluding such items, net revenues would be up +9% YoY. Global markets: FICT revenues are up QoQ at €330m in 1Q21, although down YoY due to a lower contribution from Treasury and FX that benefited from the high market volatility of end-1Q20. Solid growth in Credit. Equity revenues are at €167m in 1Q21 on the back of favorable market conditions and a strong commercial activity, notably with Groupe BPCE retail networks. Global finance: Net revenues are at €336m in 1Q21, up +13% YoY, driven by higher portfolio revenues generated with corporates as well as on Real estate and Infrastructure notably. Investment banking/M&A: Investment banking revenues are benefiting from strong activity levels in DCM in 1Q21. M&A revenues are down YoY on a good 1Q20. The underlying cost/income ratio1 is at 58.6% in 1Q21 (78.0% in 1Q20) with a positive jaw effect despite higher variable costs reflecting the top-line performance of the quarter. The underlying cost of risk is improving and benefiting from the 1Q21 environment although still at elevated levels with impairments notably coming from Tourism and Aviation. The underlying RoE1 is at 12.3% in 1Q21.
1 See note on methodology. Excluding exceptional items and excluding IFRIC 21

6
C3 - Restricted Natixis
Unless specified otherwise, the following comments and data refer to underlying results, i.e. excluding exceptional items (see details page 3)
Insurance
€m 1Q21 1Q20 1Q21
vs. 1Q20
Net revenues 240 229 5%
Expenses (138) (134) 4%
Gross operating income 102 95 7%
Provision for credit losses 0 0
Associates and other items 2 3
Pre-tax profit 104 99 6%
Cost/income ratio1 52.7% 51.9% 0.8pp
RoE after tax1 33.0% 33.3% (0.3)pp
Underlying net revenues are up +5% YoY in 1Q21. Underlying expenses are up +4% YoY in 1Q21 i.e. a positive jaw effect of +1pp. The underlying cost/income ratio1 is at 52.7% in 1Q21, slightly up vs. 1Q20 (51.9%). The gross operating income is up +7% YoY in 1Q21. The underlying RoE1 is at 33.0% in 1Q21, in line with its 1Q20 (33.3%) and 2020 levels (33.2%). Commercial indicators2
€3.5bn gross inflows and €2.3bn net inflows for Life insurance in 1Q21, up vs. 1Q20 with a strong dynamism in January/February (+18% YoY). €75.7bn of AuM as at end-March 2021 (+4% QoQ) of which 27% in unit-linked products (37% of gross inflows). The P&C and Personal Protection equipment rate is at 28.7% (+0.8pp QoQ) for the Banques Populaires and at 32.1% for the Caisses d’Epargne (+0.6pp QoQ). The P&C combined ratio is at 92.8% in 1Q21 (+2.5pp YoY). 1 See note on methodology. Excluding exceptional items and excluding IFRIC 21 2 Excluding reinsurance agreement with CNP

7
C3 - Restricted Natixis
Unless specified otherwise, the following comments and data refer to underlying results, i.e. excluding exceptional items (see details page 3)
Payments
€m 1Q21 1Q20 1Q21
vs. 1Q20
Net revenues 117 113 4%
Expenses (102) (93) 10%
Gross operating income 15 20 (26)%
Provision for credit losses (0) 2
Associates and other items 0 0
Pre-tax profit 14 21 (32)%
Cost/income ratio1 86.9% 81.9% 4.9pp
RoE after tax1 10.6% 15.7% (5.1)pp
Underlying net revenues are up +4% YoY in 1Q21 despite COVID-related restriction measures in France:
Payment Processing & Solutions: Net revenues up +6% YoY in 1Q21 with a number of card transactions processed up +2% vs. 1Q20. Contactless transactions accounting for ~45% of transactions in 1Q21, up YoY (~31% in 1Q20). Growth of instant payment transactions (x2.1 vs. 1Q20);
Digital: PayPlug continues to benefit from its positioning across small and medium-sized merchants (business volumes x2.1 YoY in 1Q21) and with growth across Groupe BPCE retail networks (business volumes x4.7 YoY in 1Q21). Dalenys featuring dynamic activity levels with business volume growth at +30% YoY in 1Q21;
Benefits: Issuing volumes for the Reward activity titres cadeaux are up +17% YoY in 1Q21 and +23% YoY for meal vouchers. Inflection on the Comitéo marketplace activity confirmed, reflecting latest commercial successes. Strengthening of synergies and activities through the acquisition of Jackpot which offers an API that publishes and distributes e-gift cards from the largest brands on demand.
The underlying cost/income ratio1 is at 86.9% in 1Q21 (81.9% in 1Q20) with investments maintained in order to ensure sustainable development and despite the temporary slowdown in revenue growth. The underlying RoE1 is at 10.6% in 1Q21 (15.7% in 1Q20). 1 See note on methodology. Excluding exceptional items and excluding IFRIC 21

8
C3 - Restricted Natixis
Unless specified otherwise, the following comments and data refer to underlying results, i.e. excluding exceptional items (see details page 3)
Corporate Center
€m 1Q21 1Q20 1Q21
vs. 1Q20
Net revenues (3) (62)
Expenses (217) (214) 2%
SRF (135) (163) (17)%
Other (82) (51)
Gross operating income (220) (276) (20)%
Provision for credit losses (8) (2)
Associates and other items 1 2
Pre-tax profit (227) (275) (18)%
Underlying net revenues are close to nil in 1Q21, an uplift vs. 1Q20 which embedded a negative €(71)m FVA (Funding Value Adjustments) impact due to the deteriorating market conditions of March 2020. Underlying expenses are marginally up YoY off a low base with a reduction in the SRF contribution. The underlying gross operating income is improving vs. 1Q20.

9
C3 - Restricted Natixis
FINANCIAL STRUCTURE
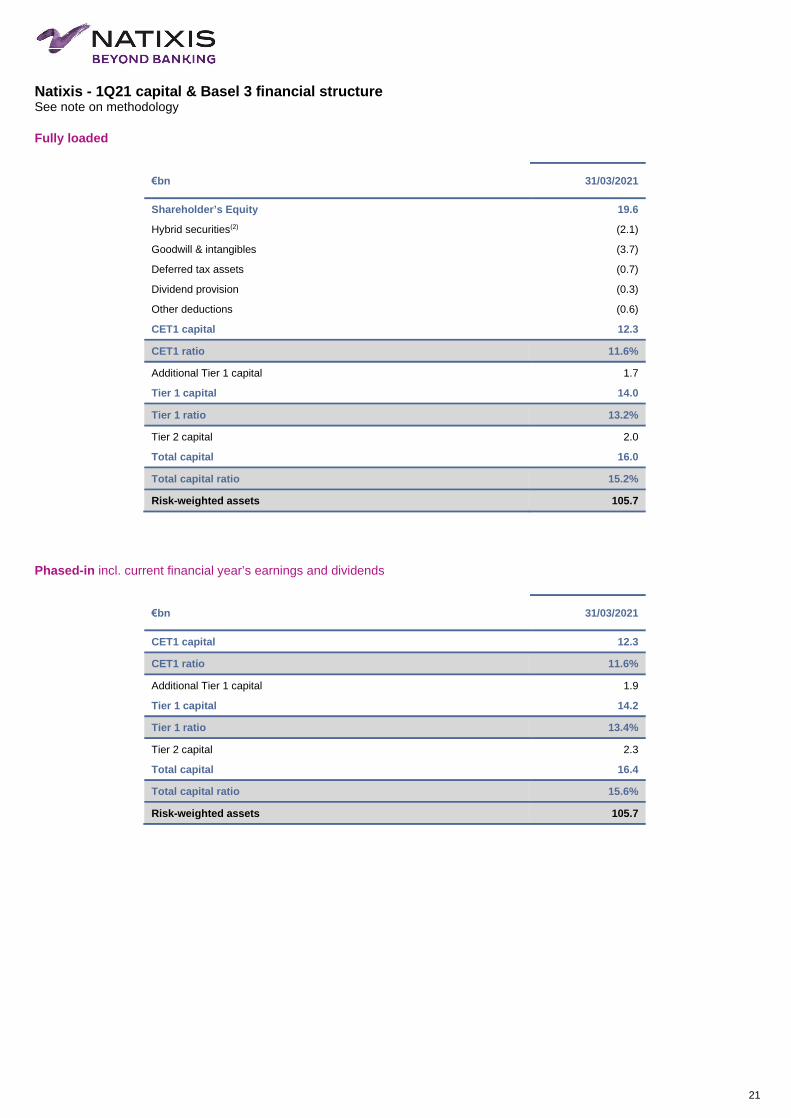
Basel 3 fully-loaded1 Natixis’ Basel 3 fully loaded CET1 ratio worked out to 11.6% as at March 31, 2021.
- Basel 3 fully loaded CET1 capital amounted to €12.3bn - Basel 3 fully loaded RWA amounted to €105.7bn
Main 1Q21 CET1 ratio impacts:
- +34bps related to the earnings capacity - (11)bps related to the IFRIC21 impact - (11)bps related to the FY21 accrued dividend (based on a 60% payout) - (8)bps related to RWA and other
As at March 31, 2021 Natixis’ Basel 3 fully loaded capital ratios stood at 13.2% for the Tier 1 and 15.2% for the Total capital. Proforma for the estimated 2021 regulatory impacts related to TRIM Banks and SA-CCR (~20bps cumulative negative impact post mitigation) as well as the impact coming from Natixis’ sale of its 50.01% stake in H2O AM (+10bps), Natixis’ Basel 3 fully-loaded CET1 ratio would stand at 11.5%.
Basel 3 phased-in incl. current financial year’s earnings and dividends1 As at March 31, 2021, Natixis’ Basel 3 phased-in capital ratios incl. current financial year’s earnings and dividends stood at 11.6% for the CET1, 13.4% for the Tier 1 and 15.6% for the Total capital.
- Core Tier 1 capital stood at €12.3bn and Tier 1 capital at €14.2bn
- Natixis’ RWA totaled €105.7bn, breakdown as follows: - Credit risk: €71.0bn - Counterparty risk: €7.5bn - CVA risk: €1.7bn - Market risk: €12.5bn - Operational risk: €13.0bn
Book value per share Equity capital (group share) totaled €19.6bn as at March 31, 2021, of which €2.0bn in the form of hybrid securities (DSNs) recognized in equity capital at fair value (excluding capital gain following reclassification of hybrids). Natixis’ book value per share stood at €5.48 as at March 31, 2021 based on 3,155,441,451 shares excluding treasury shares (the total number of shares being 3,157,903,032). The tangible book value per share (after deducting goodwill and intangible assets) is €4.24. Post 2021 dividend accrual based on a 60% payout ratio, the tangible book value per share is €4.18.
Leverage ratio1 The leverage ratio worked out to 4.4% as at March 31, 2021.
Overall capital adequacy ratio As at March 31, 2021, the financial conglomerate’s excess capital was estimated at around €2.9bn. 1 See note on methodology

10
C3 - Restricted Natixis
APPENDICES Note on methodology: The results at 31/03/2021 were examined by the board of directors at their meeting on 06/05/2021. Figures at 31/03/2021 are presented in accordance with IAS/IFRS accounting standards and IFRS Interpretation Committee (IFRIC) rulings as adopted in the European Union and applicable at this date. Following the evolution in standards adopted for the 1Q21 financial disclosures and the evolution in the Asset & Wealth Management’s organization since January 1st, 2021, the 2020 quarterly series have been restated: Evolution of the standards applied: - The analytical remuneration rate of capital has been lowered in order to reflect the decrease in long term sovereign interest rates in
Europe and in the US, whilst still keeping a 10-year average reference rate ;
- The analytical allocation rate for structure charges from Natixis holding functions to the business lines have been reviewed based on a recent analysis on allocated resources from the different support functions towards the business lines.
This evolution of the standards applied is neutral at Natixis consolidated level, however it impacts each business lines and the corporate center, at the revenue level for the first point and at the expense level for the second point. Besides, Natixis RoTE calculation is adjusted in order to exclude unrealized or deferred gains and losses recognized in equity (OCI), as it is already done for the calculation of Natixis RoE. Evolution in Asset Management: During 1Q21, the final memorandum of understanding regarding the sale of Natixis’ 50.01% stake in H2O AM to the management of the company has been signed. The 2020 quarterly series have been restated to isolate the net contribution of H2O AM on a single line item at the bottom of Natixis’ income statement. The other income statement line items (net revenues, expenses…) are now being presented excluding H2O AM. In 2021, the contribution of H2O AM to Natixis’ income statement will be limited to the EUR/GBP evolution which will be classified as an exceptional item (see page 3). Business line performances using Basel 3 standards: - The performances of Natixis business lines are presented using Basel 3 standards. Basel 3 risk-weighted assets are based on CRR-
CRD4 rules as published on June 26th, 2013 (including the Danish compromise treatment for qualified entities). - Natixis’ RoTE is calculated by taking as the numerator net income (group share) excluding DSN interest expenses (the associated
tax benefit being already accounted for in the net income following the adoption of IAS 12 amendment). Equity capital is average shareholders’ equity group share as defined by IFRS, after payout of dividends1, excluding average hybrid debt, unrealized or deferred gains and losses recognized in equity (OCI) as well as average intangible assets and average goodwill
- Natixis’ RoE is calculated by taking as the numerator net income (group share) excluding DSN interest expenses (the associated tax benefit being already accounted for in the net income following the adoption of IAS 12 amendment). Equity capital is average shareholders’ equity group share as defined by IFRS, after payout of dividends1, excluding average hybrid debt and unrealized or deferred gains and losses recognized in equity (OCI)
- RoE for business lines is calculated based on normative capital to which are added goodwill and intangible assets for the business
line. Normative capital allocation to Natixis’ business lines is carried out on the basis of 10.5% of their average Basel 3 risk-weighted assets. Business lines benefit from remuneration of normative capital allocated to them
Net book value is calculated by taking shareholders’ equity group share (minus distribution of dividends proposed by the Board of Directors but not yet approved by the General Shareholders' Meeting1), restated for hybrids and capital gains on reclassification of hybrids as equity instruments. Net tangible book value is adjusted for goodwill relating to equity affiliates, restated goodwill and intangible assets as follows:
€m 31/03/2021
Goodwill 3,596
Restatement for AWM deferred tax liability & others (333)
Restated goodwill 3,263
1 Dividend proposal for FY20 deducted from the net book value and the net tangible book value. For Natixis’ RoE and RoTE calculation, the FY21 accrued dividend, based on a 60% payout ratio, is also deducted

11
C3 - Restricted Natixis
€m 31/03/2021
Intangible assets 662
Restatement for AWM deferred tax liability & others (7)
Restated intangible assets 655
Own senior debt fair-value adjustment: calculated using a discounted cash-flow model, contract by contract, including parameters such as swap curves and revaluation spread (based on the BPCE reoffer curve). Adoption of IFRS 9 standards, on November 22, 2016, authorizing the early application of provisions relating to own credit risk as of FY16 closing Phased-in capital and ratios incl. current financial year’s earnings and dividends: based on CRR-CRD4 rules as reported on June 26, 2013, including the Danish compromise - phased in. Presentation including current financial year’s earnings and accrued dividend1 Fully loaded capital and ratios: based on CRR-CRD4 rules as reported on June 26, 2013, including the Danish compromise - without phase-in. Presentation including current financial year’s earnings and accrued dividend1 Leverage ratio: based on delegated act rules, without phase-in (presentation including current financial year’s earnings and accrued dividend1) and with the hypothesis of a roll-out for non-eligible subordinated notes under Basel 3 by eligible notes. Repo transactions with central counterparties are offset in accordance with IAS 32 rules without maturity or currency criteria. Leverage ratio disclosed including the effect of intragroup cancelation - pending ECB authorization Exceptional items: figures and comments on this press release are based on Natixis and its businesses’ income statements excluding non-operating and/or exceptional items detailed page 3. Figures and comments that are referred to as ‘underlying’ exclude such exceptional items. Natixis and its businesses’ income statements including these items are available in the appendix of this press release Restatement for IFRIC 21 impact: the cost/income ratio, the RoE and the RoTE excluding IFRIC 21 impact calculation in 1Q21 takes into account ¼ of the annual duties and levies concerned by this accounting rule Earnings capacity: net income (group share) restated for exceptional items and the IFRIC 21 impact Expenses: sum of operating expenses and depreciation, amortization and impairment on property, plant and equipment and intangible assets IAS 12: As of 3Q19, according to the adoption of IAS 12 (income taxes) amendment, the tax benefit on DSN interest expenses previously recorded in the consolidated reserves is now being accounted for in the income statement (income tax line) 1 Dividend proposal for FY20 deducted as well as the FY21 accrued dividend, based on a 60% payout ratio

12
C3 - Restricted Natixis
Natixis - Consolidated P&L (restated)
€m 1Q20 2Q20 3Q20 4Q20 1Q21 1Q21
vs. 1Q20
Net revenues 1,655 1,544 1,738 2,239 2,073 25%
Expenses (1,560) (1,282) (1,371) (1,558) (1,659) 6%
Gross operating income 95 261 367 681 414 x4.4
Provision for credit losses (193) (289) (210) (159) (92)
Associates (8) 1 2 (1) 5
Gain or loss on other assets (0) 4 2 1 0
Change in value of goodwill 0 0 0 0 0
Pre-tax profit (107) (23) 161 522 328 NR
Tax 1 (2) (57) (130) (95)
Minority interests (10) (8) (9) (24) (10)
Net income - group share excl. Coface & H2O AM (116) (33) 94 367 224 NR
Coface net contribution (118) (27) (41) (7) 7
H2O AM net contribution 29 3 (14) (38) (6)
Net income - group share incl. Coface & H2O AM (204) (57) 39 323 225 NR
Restated figures (see note on methodology). See page 13 for the reconciliation of the restated figures with the accounting view
Main observable impacts from the COVID-19 context in 2020 (excluding items classified as exceptional)
€m 1Q20 2Q20 3Q20 4Q20 2020
Net revenues (288) (106) 59 107 (226)
Seed money portfolio mark-downs AWM (32) (17) 18 60 30
- Listed (34) 25 16 30 36
- Unlisted 2 (42) 3 31 (6)
Dividend mark-downs on equity products CIB (130) (143) 1 (11) (283)
CVA/DVA impact CIB (55) 1 26 43 16
FVA impact Corporate Center (71) 53 14 15 10
Cost of risk CIB (115) (210) (190) (95) (610)
Total pre-tax profit impact (403) (316) (131) 12 (836)
CET1 capital (507) 342 104 336 275
OCI (389) 299 70 294 274
PVA (118) 43 34 42 1
Risk-weighted assets (€bn) 3.2 6.7 (4.4) (0.5) 4.9
Credit RWA 1.7 0.9 (0.6) 0.2 2.1
- RCF drawdowns & new money3 1.7 0.4 (0.4) 0.0 1.7
- State-guaranteed loans3 0.0 0.5 (0.2) 0.2 0.4
Market RWA 1.0 6.0 (3.4) (1.7) 1.9
CVA RWA 0.5 (0.2) (0.4) 1.0 0.9
Total CET1 ratio impact (bps) (90)bps (40)bps 60bps 20bps (45)bps

13
C3 - Restricted Natixis
Natixis - Reconciliation between management and accounting figures 1Q20
€m 1Q20
underlying Exceptional
items 1Q20
restated
Coface
restatement H2O
restatement 1Q20
reported
Net revenues 1,638 17 1,655 0 95 1,750
Expenses (1,557) (3) (1,560) 0 (22) (1,582)
Gross operating income 81 14 95 0 73 167
Provision for credit losses (193) 0 (193) 0 0 (193)
Associates 6 (14) (8) (6) 0 (14)
Gain or loss on other assets (0) 0 (0) (112) 0 (112)
Pre-tax profit (107) (0) (107) (118) 73 (152)
Tax 5 (4) 1 0 (14) (13)
Minority interests (10) 0 (10) 0 (29) (39)
Net income - group share excl. Coface & H2O AM (111) (4) (116) (118) 29
Coface net contribution 1 (119) (118) 118 0 0
H2O AM net contribution 29 0 29 0 (29) 0
Net income - group share incl. Coface & H2O AM (81) (123) (204) 0 0 (204)
1Q21
€m 1Q21
underlying Exceptional
items 1Q21
restated Coface
restatement H2O
restatement 1Q21
reported
Net revenues 2,049 24 2,073 0 19 2,092
Expenses (1,614) (45) (1,659) 0 (14) (1,673)
Gross operating income 435 (21) 414 0 5 419
Provision for credit losses (92) 0 (92) 0 0 (92)
Associates 5 0 5 7 0 13
Gain or loss on other assets 0 0 0 0 (8) (7)
Pre-tax profit 349 (21) 328 7 (3) 333
Tax (100) 5 (95) 0 (2) (96)
Minority interests (11) 1 (10) 0 (2) (11)
Net income - group share excl. Coface net contribution 239 (15) 224 7 (6)
Coface net contribution 0 7 7 (7) 0 0
H2O AM net contribution 0 (6) (6) 0 6 0
Net income - group share incl. Coface net contribution 239 (14) 225 0 0 225

14
C3 - Restricted Natixis
Natixis - IFRS 9 Balance sheet
Assets (€bn) 31/03/2021 31/12/2020
Cash and balances with central banks 42.1 30.6
Financial assets at fair value through profit and loss1 207.1 210.4
Financial assets at fair value through Equity 13.0 13.2
Loans and receivables1 113.5 112.6
Debt instruments at amortized cost 1.9 1.9
Insurance assets 114.1 112.7
Non-current assets held for sale 0.3 0.7
Accruals and other assets 7.5 6.8
Investments in associates 0.7 0.9
Tangible and intangible assets 1.9 1.9
Goodwill 3.6 3.5
Total 505.7 495.3
Liabilities and equity (€bn) 31/03/2021 31/12/2020
Due to central banks 0.0 0.0
Financial liabilities at fair value through profit and loss1 202.2 208.5
Customer deposits and deposits from financial institutions1 129.2 114.2
Debt securities 33.9 35.7
Liabilities associated with non-current assets held for sale 0.1 0.1
Accruals and other liabilities 8.1 7.8
Insurance liabilities 107.0 104.2
Contingency reserves 1.7 1.6
Subordinated debt 3.9 3.9
Equity attributable to equity holders of the parent 19.6 19.2
Minority interests 0.2 0.2
Total 505.7 495.3
1 Including deposit and margin call

15
C3 - Restricted Natixis
Natixis - 1Q21 P&L by business line
€m AWM CIB Insurance Payments Corporate Center 1Q21
restated
Net revenues 755 925 240 117 36 2,073
Expenses (587) (583) (138) (103) (248) (1,659)
Gross operating income 168 342 102 14 (211) 414
Provision for credit losses (2) (81) 0 (0) (8) (92)
Net operating income 166 261 102 14 (220) 323
Associates and other items (0) 3 2 0 1 6
Pre-tax profit 166 264 104 14 (219) 328
Tax (95)
Minority interests (10)
Net income - group share excl. Coface & H2O AM 224
Coface net contribution 7
H2O AM net contribution (6)
Net income - group share incl. Coface & H2O AM 225
Asset & Wealth Management
€m 1Q20 2Q20 3Q20 4Q20 1Q21 1Q21
vs. 1Q20
Net revenues 680 684 720 1,012 755 11%
Asset Management1 639 648 681 952 713 12%
Wealth management 41 36 40 61 41 1%
Expenses (559) (529) (565) (685) (587) 5%
Gross operating income 121 155 156 327 168 39%
Provision for credit losses 1 (11) (10) (7) (2)
Net operating income 121 144 146 320 166 37%
Associates 0 0 0 0 0
Other items (2) (3) (1) (1) (0)
Pre-tax profit 119 141 145 320 166 39%
Cost/Income ratio 82.2% 77.3% 78.4% 67.7% 77.7%
Cost/Income ratio excl. IFRIC 21 81.7% 77.5% 78.6% 67.8% 77.2%
RWA (Basel 3 - in €bn) 14.0 14.1 14.4 14.1 14.2 1%
Normative capital allocation (Basel 3) 4,604 4,623 4,602 4,585 4,560 (1)%
RoE after tax (Basel 3)2 8.9% 8.5% 6.8% 15.4% 9.4%
RoE after tax (Basel 3) excl. IFRIC 212 9.1% 8.4% 6.7% 15.3% 9.6%
1 Asset management including Private equity and Employee savings plan 2 Normative capital allocation methodology based on 10.5% of the average RWA-including goodwill and intangibles

16
C3 - Restricted Natixis
Corporate & Investment Banking
€m 1Q20 2Q20 3Q20 4Q20 1Q21 1Q21
vs. 1Q20
Net revenues 680 511 695 885 925 36%
Global markets 277 103 272 420 490 77%
FIC-T 365 277 213 250 315 (14)%
Equity (33) (175) 33 127 167 NR
CVA/DVA desk (56) 1 25 43 7
Global finance1 298 321 321 343 336 13%
Investment banking2 103 99 93 126 96 (7)%
Other 2 (12) 8 (3) 4
Expenses (559) (478) (512) (556) (583) 4%
Gross operating income 121 33 183 330 342 x2.8
Provision for credit losses (194) (275) (199) (152) (81)
Net operating income (73) (242) (16) 178 261 NR
Associates 2 2 2 3 3
Other items 0 (0) 0 (0) 0
Pre-tax profit (70) (240) (13) 181 264 NR
Cost/Income ratio 82.2% 93.5% 73.7% 62.8% 63.1%
Cost/Income ratio excl. IFRIC 21 78.0% 95.4% 75.0% 63.8% 60.3%
RWA (Basel 3 - in €bn) 65.4 69.2 65.4 69.7 71.2 9%
Normative capital allocation (Basel 3) 6,757 7,120 7,171 6,942 7,571 12%
RoE after tax (Basel 3)3 (3.2)% (9.9)% (0.6)% 7.6% 10.4%
RoE after tax (Basel 3) excl. IFRIC 213 (1.9)% (10.3)% (1.0)% 7.2% 11.4%
1 Including Film industry financing 2 Including M&A 3 Normative capital allocation methodology based on 10.5% of the average RWA-including goodwill and intangibles

17
C3 - Restricted Natixis
Insurance
€m 1Q20 2Q20 3Q20 4Q20 1Q21 1Q21
vs. 1Q20
Net revenues 222 229 221 233 240 8%
Expenses (134) (116) (117) (123) (138) 4%
Gross operating income 88 113 104 110 102 16%
Provision for credit losses 0 0 0 0 0
Net operating income 88 113 104 110 102 16%
Associates (11) (2) (1) (4) 2
Other items 0 0 0 0 (0)
Pre-tax profit 77 111 103 106 104 35%
Cost/Income ratio 60.2% 50.8% 52.8% 52.9% 57.6%
Cost/Income ratio excl. IFRIC 21 53.6% 52.9% 55.0% 55.0% 52.7%
RWA (Basel 3 - in €bn) 7.6 7.6 8.1 8.8 8.9 17%
Normative capital allocation (Basel 3) 965 896 893 941 1,021 6%
RoE after tax (Basel 3)1 21.0% 34.6% 32.4% 31.1% 29.7%
RoE after tax (Basel 3) excl. IFRIC 211 25.3% 33.0% 30.9% 29.6% 33.0%
1 Normative capital allocation methodology based on 10.5% of the average RWA-including goodwill and intangibles

18
C3 - Restricted Natixis
Payments
€m 1Q20 2Q20 3Q20 4Q20 1Q21 1Q21
vs. 1Q20
Net revenues 113 85 117 115 117 4%
Expenses (93) (94) (97) (102) (103) 11%
Gross operating income 19 (9) 20 13 14 (28)%
Provision for credit losses 2 0 (0) 1 (0)
Net operating income 21 (9) 20 14 14 (35)%
Associates 0 0 0 0 0
Other items 0 0 0 0 0
Pre-tax profit 21 (9) 20 14 14 (35)%
Cost/Income ratio 82.8% 110.5% 83.0% 88.6% 88.1%
Cost/Income ratio excl. IFRIC21 82.2% 110.8% 83.2% 88.8% 87.5%
RWA (Basel 3 - in €bn) 1.1 1.2 1.1 1.1 1.1 (5)%
Normative capital allocation (Basel 3) 391 403 414 405 413 6%
RoE after tax (Basel 3)1 15.1% -5.9% 13.6% 9.3% 9.6%
RoE after tax (Basel 3) excl. IFRIC 211 15.5% -6.0% 13.4% 9.1% 10.1%
Standalone EBITDA calculation Figures excluding exceptional items2
1Q20 2Q20 3Q20 4Q20 1Q21
Net revenues 113 85 117 115 117
Expenses (93) (91) (96) (99) (102)
Gross operating income - Natixis reported excl. exceptional items 20 (6) 21 16 15
Analytical adjustments to net revenues (0) (1) (1) (1) (1)
Structure charge adjustments to expenses 5 4 4 4 5
Gross operating income - standalone view 24 (2) 25 19 19
Depreciation, amortization and impairment on property, plant and equipment and intangible assets
4 4 5 5 5
EBITDA 28 2 30 24 24
EBITDA = Net revenues (-) Operating expenses. Standalone view excluding analytical items and structure charges
1 Normative capital allocation methodology based on 10.5% of the average RWA-including goodwill and intangibles 2 See page 3

19
C3 - Restricted Natixis
Corporate Center
€m 1Q20 2Q20 3Q20 4Q20 1Q21 1Q21
vs. 1Q20
Net revenues (39) 34 (15) (6) 36
Expenses (216) (65) (81) (92) (248) 15%
SRF (163) (2) (0) (0) (135) (17)%
Other (53) (63) (81) (92) (113)
Gross operating income (254) (31) (96) (98) (211) (17)%
Provision for credit losses (2) (4) (1) (1) (8)
Net operating income (256) (34) (97) (100) (220) (14)%
Associates 0 (0) 0 0 (0)
Other items 2 7 3 2 1
Pre-tax profit (254) (27) (94) (98) (219) (14)%
RWA (Basel 3 - in €bn) 9.1 9.3 9.8 9.6 9.8 8%
Corporate Center 1Q21 RWA including the contribution from the residual stake in Coface

20
C3 - Restricted Natixis
1Q21 results: from data excluding non-operating items to reported data
€m 1Q21
underlying
FX fluctuations on DSN in currencies
Provision for
litigation
Transformation & Business
Efficiency Investment
costs
Real estate management strategy and
other
Coface residual
stake valuation
H2O AM FX fluctuations
1Q21 restated
Net revenues 2,049 39 (15) 2,073
Expenses (1,614) (28) (17) (1,659)
Gross operating income 435 39 (15) (28) (17) 0 0 414
Provision for credit losses (92) (92)
Associates 5 5
Gain or loss on other assets 0 0
Pre-tax profit 349 39 (15) (28) (17) 0 0 328
Tax (100) (10) 4 7 5 (95)
Minority interests (11) 1 (10)
Net income - group share excl. Coface & H2O AM
239 29 (11) (20) (13) 0 0 224
Coface net contribution 0 7
7
H2O AM net contribution 0 (6) (6)
Net income - group share incl. Coface & H2O AM
239 29 (11) (20) (13) 7 (6) 225
21
C3 - Restricted Natixis
Natixis - 1Q21 capital & Basel 3 financial structure See note on methodology
Fully loaded
€bn 31/03/2021
Shareholder’s Equity 19.6
Hybrid securities(2) (2.1)
Goodwill & intangibles (3.7)
Deferred tax assets (0.7)
Dividend provision (0.3)
Other deductions (0.6)
CET1 capital 12.3
CET1 ratio 11.6%
Additional Tier 1 capital 1.7
Tier 1 capital 14.0
Tier 1 ratio 13.2%
Tier 2 capital 2.0
Total capital 16.0
Total capital ratio 15.2%
Risk-weighted assets 105.7
Phased-in incl. current financial year’s earnings and dividends
€bn 31/03/2021
CET1 capital 12.3
CET1 ratio 11.6%
Additional Tier 1 capital 1.9
Tier 1 capital 14.2
Tier 1 ratio 13.4%
Tier 2 capital 2.3
Total capital 16.4
Total capital ratio 15.6%
Risk-weighted assets 105.7

22
C3 - Restricted Natixis
IFRIC 21 effects by business line Effect on expenses
€m 1Q20 2Q20 3Q20 4Q20 1Q21
AWM (4) 1 1 1 (4)
CIB (28) 9 9 9 (25)
Insurance (15) 5 5 5 (12)
Payments (1) 0 0 0 (1)
Corporate center (113) 38 38 38 (92)
Total Natixis (161) 54 54 54 (133)
Normative capital allocation and RWA breakdown - 31/03/2021
€bn RWA EoP
% of total
Goodwill & intangibles
1Q21
Capital allocation
1Q21
RoE after tax
1Q21
AWM 14.2 15% 3.1 4.6 9.4%
CIB 71.2 75% 0.2 7.6 10.4%
Insurance 8.9 9% 0.1 1.0 29.7%
Payments 1.1 1% 0.3 0.4 9.6%
Total (excl. Corp. Center) 95.4 100% 3.7 13.6
RWA breakdown (€bn) 31/03/2021
Credit risk 71.0
Internal approach 59.5
Standard approach 11.5
Counterparty risk 7.5
Internal approach 6.6
Standard approach 0.9
Market risk 12.5
Internal approach 6.0
Standard approach 6.5
CVA 1.7
Operational risk - Standard approach 13.0
Total RWA 105.7

23
C3 - Restricted Natixis
Fully loaded leverage ratio1 According to the rules of the Delegated Act published by the European Commission on October 10, 2014, including the effect of intragroup cancelation - pending ECB authorization
€bn 31/03/2021
Tier 1 capital1 14.3
Total prudential balance sheet 391.9
Adjustment on derivatives (30.4)
Adjustment on repos2 (15.7)
Other exposures to affiliates (39.5)
Exposure to central banks (19.3)
Off balance sheet commitments 46.1
Regulatory adjustments (4.9)
Total leverage exposure 328.1
Leverage ratio 4.4%
1 See note on methodology. Without phase-in - supposing replacement of existing subordinated issuances when they become ineligible 2 Repos with clearing houses cleared according to IAS32 standard, without maturity or currency criteria

24
C3 - Restricted Natixis
Net book value as at March 31, 2021
€bn 31/03/2021
Shareholders’ equity (group share) 19.6
Deduction of hybrid capital instruments (2.0)
Deduction of gain on hybrid instruments (0.1)
Distribution (0.2)
Net book value 17.3
Restated intangible assets1 (0.7)
Restated goodwill1 (3.3)
Net tangible book value2 13.4
€
Net book value per share 5.48
Net tangible book value per share 4.24
Net tangible book value per share of €4.18 post FY21 dividend accrual, based on a 60% payout ratio
1Q21 Earnings per share
€m 31/03/2021
Net income (gs) 225
DSN interest expenses on preferred shares adjustment (27)
Net income attributable to shareholders 199
Earnings per share (€) 0.06
Number of shares as at March 31, 2021
31/03/2021
Average number of shares over the period, excluding treasury shares 3,153,805,866
Number of shares, excluding treasury shares, EoP 3,155,441,451
Number of treasury shares, EoP 2,461,581
Net income attributable to shareholders
€m 1Q21
Net income (gs) 225
DSN interest expenses on preferred shares adjustment (27)
RoE & RoTE numerator 199
1 See note on methodology 2 Net tangible book value = Book value - goodwill - intangible assets

25
C3 - Restricted Natixis
RoTE1
€m 31/03/2021
Shareholders’ equity (group share) 19,595
DSN deduction (2,122)
Dividend provision (308)
Intangible assets (655)
Unrealized/deferred gains and losses in equity (OCI) (561)
Goodwill (3,263)
RoTE Equity end of period 12,686
Average RoTE equity (1Q21) 12,559
1Q21 RoTE annualized with no IFRIC 21 adjustment 6.3%
IFRIC 21 impact 114
1Q21 RoTE annualized excl. IFRIC 21 9.9%
RoE1
€m 31/03/2021
Shareholders’ equity (group share) 19,595
DSN deduction (2,122)
Dividend provision (308)
Unrealized/deferred gains and losses in equity (OCI) (561)
RoE Equity end of period 16,603
Average RoE equity (1Q21) 16,453
1Q21 RoE annualized with no IFRIC 21 adjustment 4.8%
IFRIC 21 impact 114
1Q21 RoE annualized excl. IFRIC 21 7.6%
Doubtful loans
€bn 31/12/2020 31/03/2021
Gross customer loans outstanding 69.3 69.6
- Stage 1+2 65.7 65.7
- Stage 3 3.6 3.9
Stock of provisions 1.4 1.5
% of Stage 3 loans 5.2% 5.5%
Stock of provisions / Gross customer loans 2.0% 2.1%
1See note on methodology.

26
C3 - Restricted Natixis
Disclaimer This media release may contain objectives and comments relating to the objectives and strategy of Natixis. Any such objectives inherently depend on assumptions, project considerations, objectives and expectations linked to future and uncertain events, transactions, products and services as well as suppositions regarding future performances and synergies.
No Insurance can be given that such objectives will be realized. They are subject to inherent risks and uncertainties, and are based on assumptions relating to Natixis, its subsidiaries and associates, and the business development thereof; trends in the sector; future acquisitions and investments; macroeconomic conditions and conditions in Natixis' principal local markets; competition and regulation. Occurrence of such events is not certain, and outcomes may prove different from current expectations, significantly affecting expected results. Actual results may differ significantly from those implied by such objectives.
Information in this media release relating to parties other than Natixis or taken from external sources has not been subject to independent verification, and Natixis makes no warranty as to the accuracy, fairness, precision or completeness of the information or opinions herein. Neither Natixis nor its representatives shall be liable for any errors or omissions, or for any prejudice resulting from the use of this media release, its contents or any document or information referred to herein.
Included data in this press release have not been audited.
NATIXIS financial disclosures for the first quarter 2021 are contained in this press release and in the presentation attached herewith, available online at www.natixis.com in the “Investors & shareholders” section.
Contacts
www.natixis.com
Our information is certified with blockchain technology. Check that this press release is genuine at www.wiztrust.com.
Investor Relations [email protected] Damien Souchet Noémie Louvel
+33 1 58 55 41 10 +33 1 78 40 37 87
Press Relations [email protected] Daniel Wilson Sonia Dilouya Vanessa Stephan
+33 1 58 19 10 40 +33 1 58 32 01 03 +33 1 58 19 34 16