1q18 earnings presentation - investor cloudcdn.investorcloud.net › famsa › ... ›...
TRANSCRIPT

1Q18 Earnings
Presentation
2
1Q18AGENDA
Operational Strategies ………..….……3
Famsa Mexico …………………………..5
Famsa USA …………………………..…..7
Banco Famsa ……………………….…...9
Consolidated Results…………….…….13
Financial Position Items……….………18

Operational Strategies
4
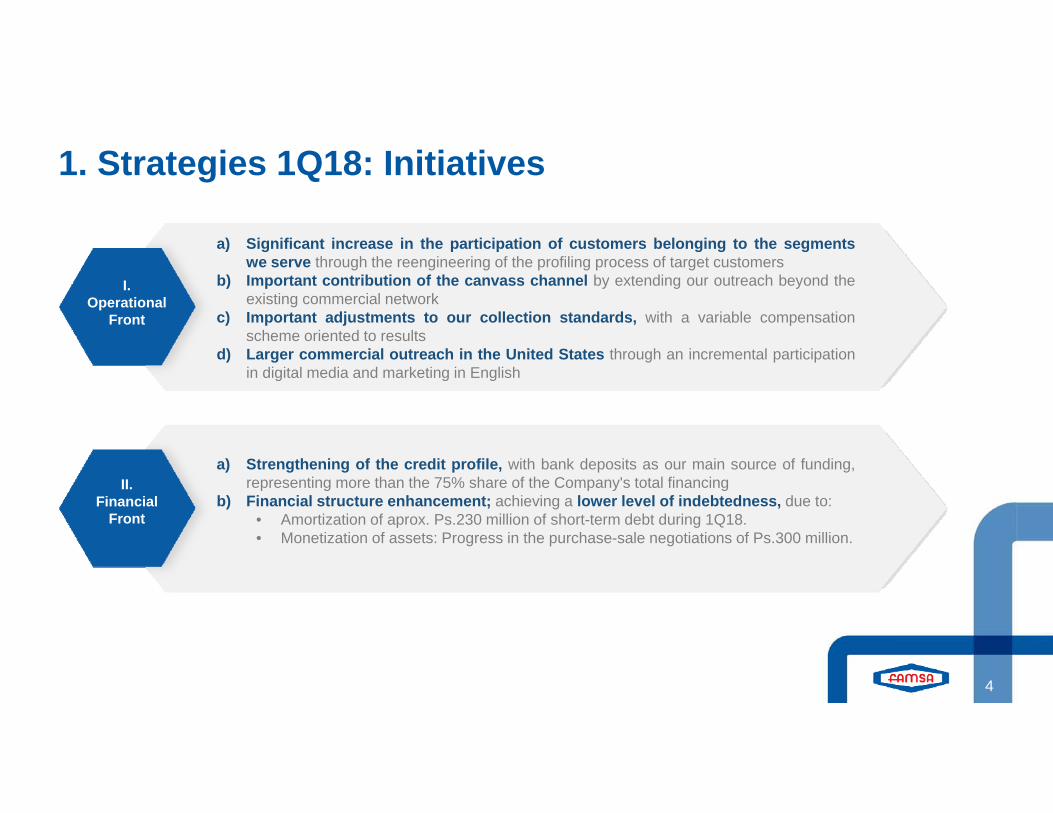
1. Strategies 1Q18: Initiatives
II. Commercial
Network
I. Operational
Front
II. Financial
Front
a) Significant increase in the participation of customers belonging to the segmentswe serve through the reengineering of the profiling process of target customers
b) Important contribution of the canvass channel by extending our outreach beyond theexisting commercial network
c) Important adjustments to our collection standards, with a variable compensationscheme oriented to results
d) Larger commercial outreach in the United States through an incremental participationin digital media and marketing in English
IV.Cost
Reduction
a) Strengthening of the credit profile, with bank deposits as our main source of funding,representing more than the 75% share of the Company's total financing
b) Financial structure enhancement; achieving a lower level of indebtedness, due to:• Amortization of aprox. Ps.230 million of short-term debt during 1Q18.• Monetization of assets: Progress in the purchase-sale negotiations of Ps.300 million.

Famsa Mexico
6
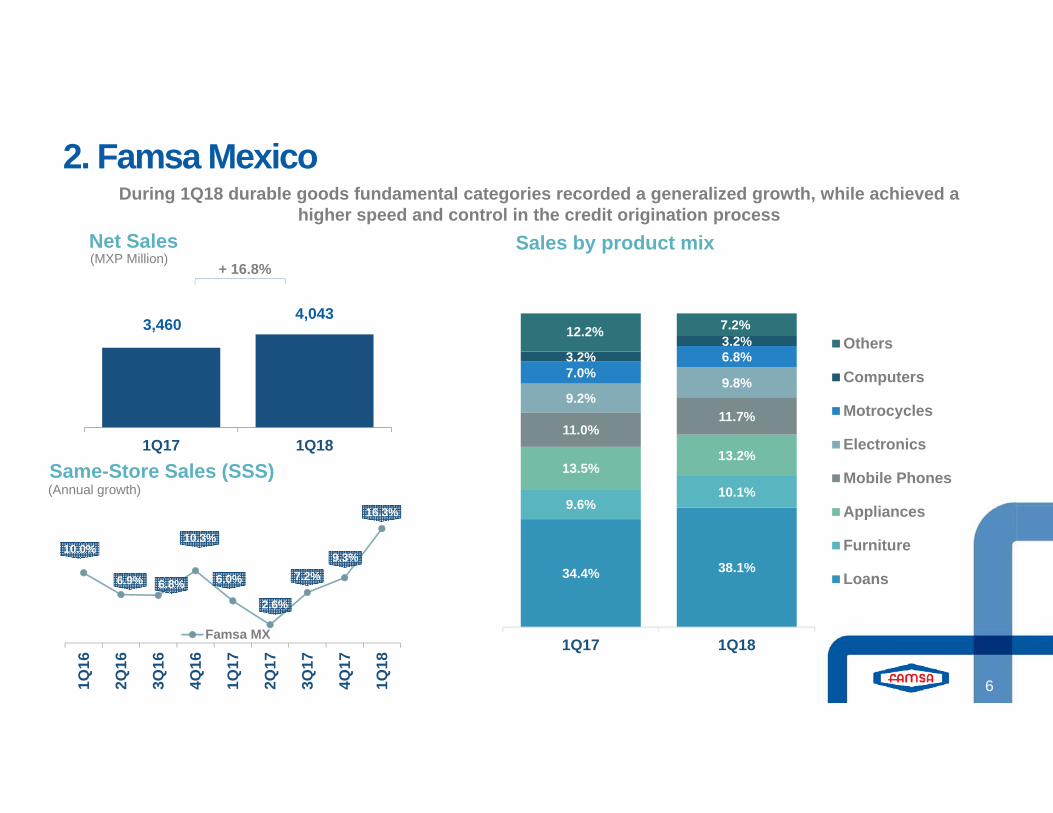
During 1Q18 durable goods fundamental categories recorded a generalized growth, while achieved a higher speed and control in the credit origination process
2. Famsa Mexico
Sales by product mix
Same-Store Sales (SSS)
10.0%
6.9% 6.8%
10.3%
6.0%
2.6%
7.2%9.3%
16.3%
1Q16
2Q16
3Q16
4Q16
1Q17
2Q17
3Q17
4Q17
1Q18
Famsa MX
3,4604,043
1Q17 1Q18
Net Sales(MXP Million)
+ 16.8%
(Annual growth)
34.4% 38.1%
9.6%10.1%
13.5%13.2%
11.0%11.7%
9.2%9.8%
7.0%6.8%3.2%3.2%
12.2% 7.2%
0.00%
20.00%
40.00%
60.00%
80.00%
100.00%
120.00%
1Q17 1Q18
Others
Computers
Motrocycles
Electronics
Mobile Phones
Appliances
Furniture
Loans

Famsa USA
8
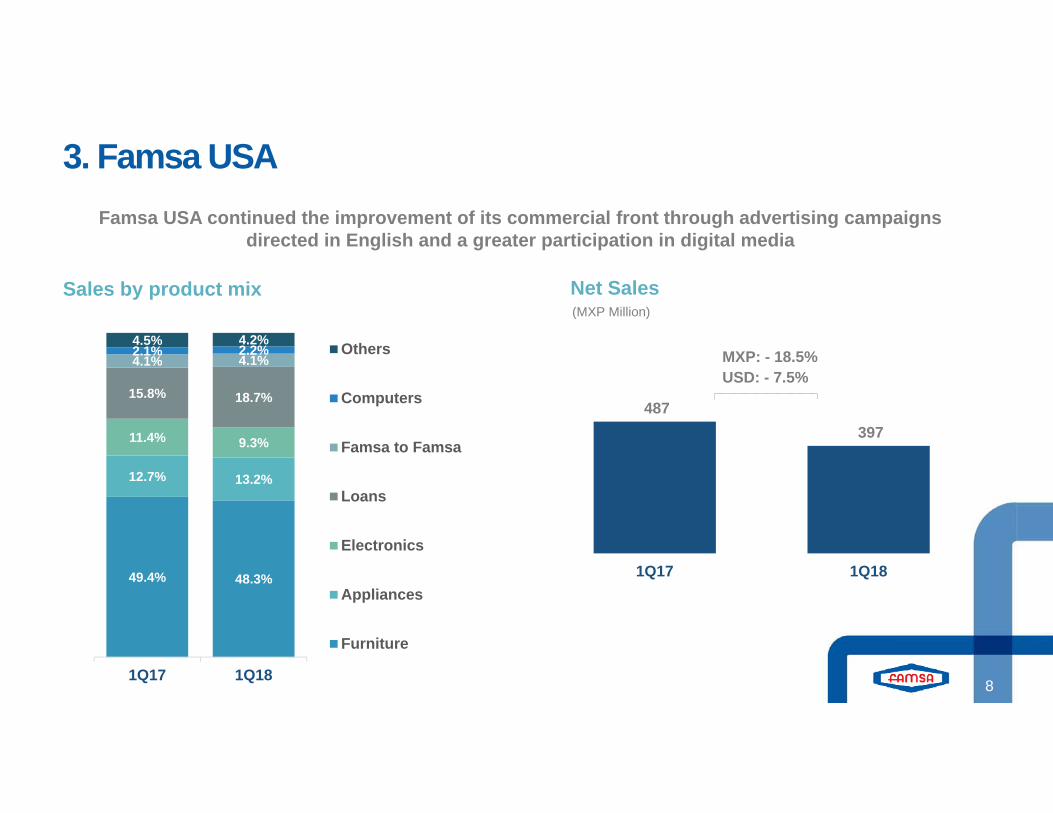
Famsa USA continued the improvement of its commercial front through advertising campaigns directed in English and a greater participation in digital media
3. Famsa USA
Sales by product mix Net Sales (MXP Million)
487 397
1Q17 1Q18
MXP: - 18.5%USD: - 7.5%
49.4% 48.3%
12.7% 13.2%
11.4% 9.3%
15.8% 18.7%
4.1% 4.1%2.1% 2.2%4.5% 4.2%
0.0%
20.0%
40.0%
60.0%
80.0%
100.0%
120.0%
1Q17 1Q18
Others
Computers
Famsa to Famsa
Loans
Electronics
Appliances
Furniture

Banco Famsa

10
Bank deposits as of March 31, 2018 accounted for a participation above 75% of the Company’s total financing, which amounted to Ps.26,286 million
4. Banco Famsa
Famsa card, credit cards, microcredits,
SMEs, Fovisste, enterprises,
Credinero and Prendinero
Deposits
e-Banking, ATMs, payroll,
TPVs, remittances,
money orders and insurance
Savings, payroll, checks and investments
Services
Loans
(MXP Million)Bank Deposits
+ 21.3%
Funding Cost
21,675 23,295 24,491 24,994 26,286
1Q17 2Q17 3Q17 4Q17 1Q18
5.5% 5.9% 6.3% 6.5% 6.7%
11%
15%
74%
1Q17
Demand Deposits
Opnl Availability
Time Deposits
12%
11%
77%
1Q18
Demand Deposits
Opnl Availability
Time Deposits
Bank Deposits Mix

11
PYME Microcredit Empresarial Others Financial
4. Banco Famsa
4,483 4,537 4,843 4,959 5,152
1Q17 2Q17 3Q17 4Q17 1Q18
+ 14.9%
*Gross BalanceSource: Banco Famsa
Portfolio of Loans*(MXP Million)
Commercial NPL ratio
12% 3%
49%17%
19%
1Q17
Portfolio of Loans Mix
1.8% 0.9% 0.9% 1.5% 1.1%
We estimate to double our SMEs credit origination towards 2019 with an incremental contribution fromour canvassing channel
15%
51%
17%
17%
1Q18
12
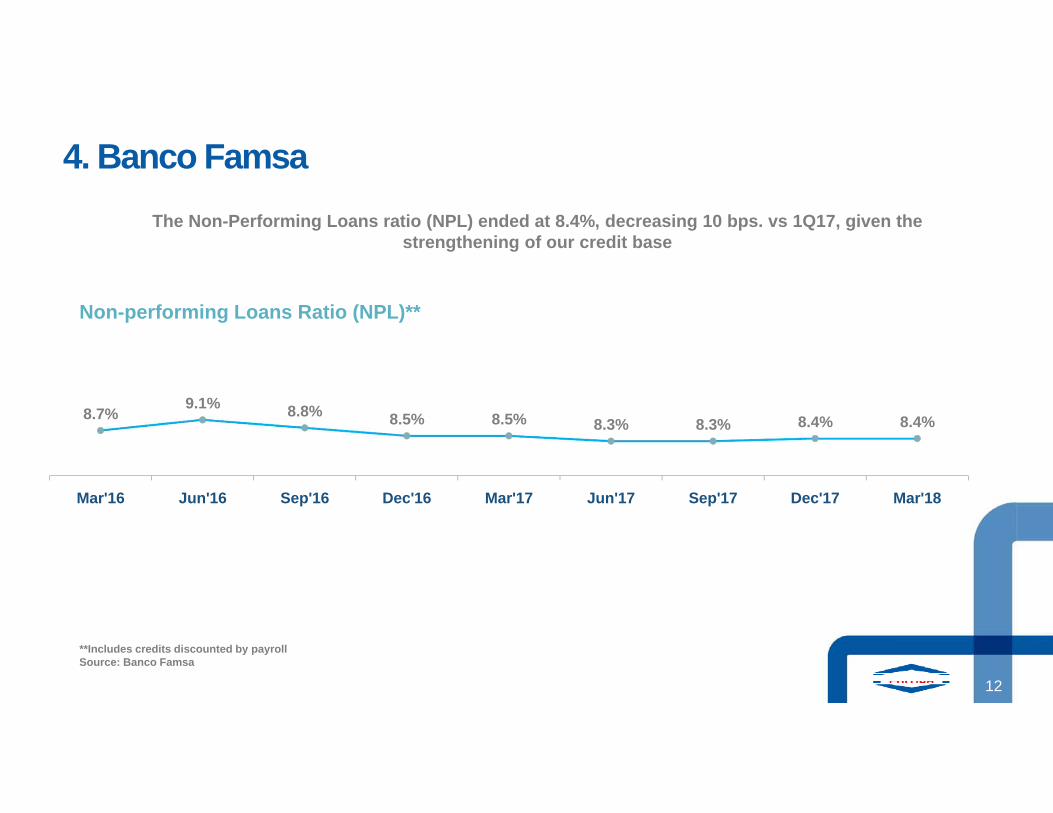
8.7% 9.1% 8.8% 8.5% 8.5% 8.3% 8.3% 8.4% 8.4%
Mar'16 Jun'16 Sep'16 Dec'16 Mar'17 Jun'17 Sep'17 Dec'17 Mar'18
Non-performing Loans Ratio (NPL)**
**Includes credits discounted by payrollSource: Banco Famsa
4. Banco FamsaThe Non-Performing Loans ratio (NPL) ended at 8.4%, decreasing 10 bps. vs 1Q17, given the
strengthening of our credit base

Consolidated Results
14
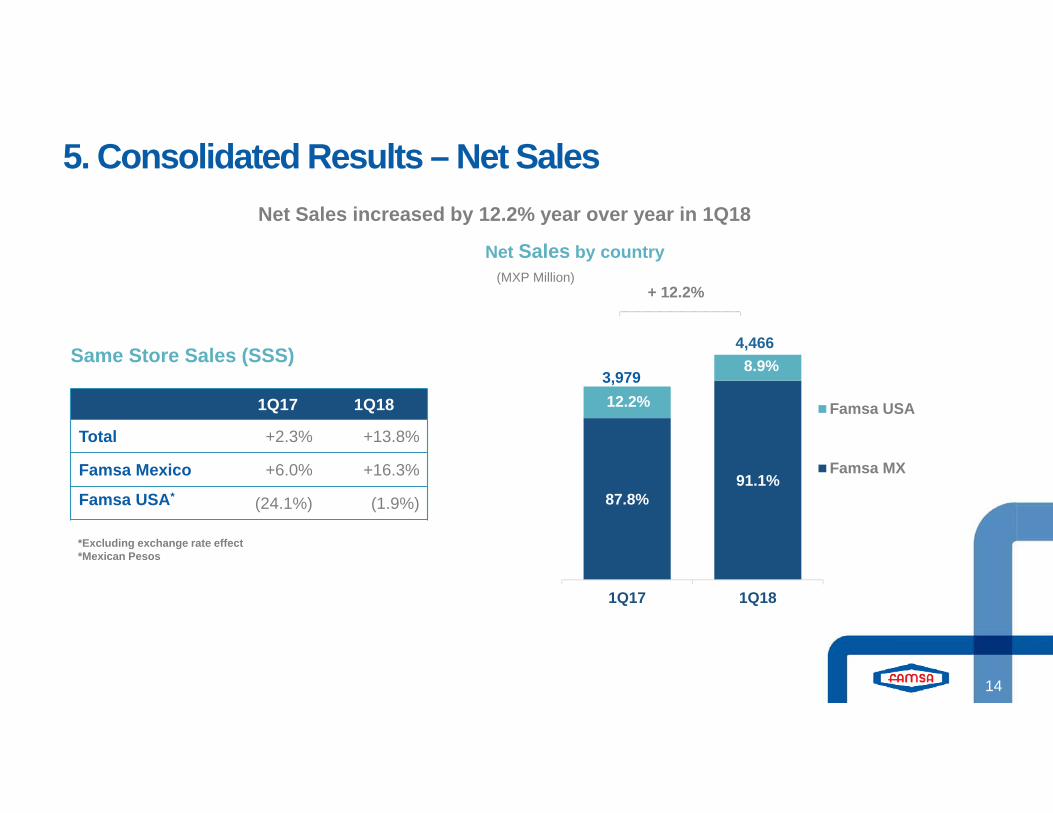
87.8%91.1%
12.2%
8.9%3,979
4,466
1Q17 1Q18
Famsa USA
Famsa MX
Net Sales increased by 12.2% year over year in 1Q18
5. Consolidated Results – Net Sales
*Excluding exchange rate effect*Mexican Pesos
Same Store Sales (SSS)
1Q17 1Q18
Total +2.3% +13.8%
Famsa Mexico +6.0% +16.3%
Famsa USA* (24.1%) (1.9%)
Net Sales by country(MXP Million)
+ 12.2%

15
5. Consolidated Results – Net SalesNet Sales by product mix
- 5.3%
Business-units Retail-area
449 447
66 584 3
40 383 1
562 546
1Q17-m2* 1Q18-m2*
PawnshopBranches
BankingBranches
PL USABranches
StoresUSA
Stores MX377 376
26 2226 24
395 388
4412
868 822
1Q17 1Q18
- 2.7%
*m2 in thousands.
32.1% 36.1%
14.5%13.4%
13.4%13.2%
9.6%10.6%
9.5%9.7%
6.2%6.1%3.1%3.1%
11.6% 7.8%
1Q17 1Q18
Others
Computers
Motorcycles
Electronics
Mobile Phones
Appliances
Furniture
Loans

16
5. Consolidated Results
1,6731,855
232187
1,9052,042
1Q17 1Q18
Famsa USA Famsa MX*
45.7%47.9%
Gross Profit(MXP Million)
+ 7.2%
*Includes other segments and intercompanies
260 277
1Q17 1Q18
(MXP Million)Financial expenses(1)
6.2%6.5%
(1) Financial expenses = Interest paid
+ 6.6%

17
427 495
-11 -14
416 481
1Q17 1Q18Famsa USA Famsa MX*
+ 15.5%
(MXP Million)
10.8%10.5%
EBITDA
5. Consolidated Results
*Includes other segments and intercompanies
8.2% 4.2%
326
189
1Q17 1Q18
Net Income(MXP Million)
- 41.9%
Financial Position Items

19
18,517 19,522
4,360 4,5432,323 2,015
25,200 26,080
4Q17 1Q18
Consumer USA
Commercial MX
Consumer MX
Trade receivables
2.8%
+ 3.5%(MXP Million)
6. Financial Position Items
2,194 2,215
251 2272,445 2,442
4Q17 1Q18
Famsa USA
Famsa MX
- 0.1%
Inventories(MXP Million)
7,255 7,227
4Q17 1Q18
- 0.4%
Stockholders’ equity(MXP Million)
24,994 26,286
7,383 7,44232,377 33,728
4Q17 1Q18
Net Debt
Bank Deposits
Net debt & bank deposits(MXP Million) + 4.2%

20
1,33566
1,007
250444 274 465
1,870
272
2,54071
2018 2019 2020 2021 2022 >2023Debt Securities Credit Lines Foreign Debt
16% 16%
52% 50%
32% 34%
9,026 8,595
8,300 8,400 8,500 8,600 8,700 8,800 8,900 9,000 9,100
0%
20%
40%
60%
80%
100%
120%
4Q17 1Q18Debt Securities Credit Lines Foreign Debt
- 4.8%
6. Financial Position Items: Debt StructureDebt Profile(MXP Million)
Debt Maturity Schedule(MXP Million)
73% 75%
12% 11%15% 14%
34,020 34,880
33,400 33,600 33,800 34,000 34,200 34,400 34,600 34,800 35,000
0%
20%
40%
60%
80%
100%
120%
4Q17 1Q18Bank Deposits Debt Securities* Bank Loans
+ 2.5%Funding Sources(MXP Million)
* Includes local notes and foreign senior notes.

21
66%
34%
4Q17
6. Financial Position Items: Debt Structure
Debt Profile: By Currency
66%
34%
1Q18
MXP USD
Debt Profile: By Interest Rate
35%
65%
4Q17
32%
68%
1Q18
Fixed Rate Floating Rate
22
The material presented below contains certain general information to date regarding Grupo Famsa, S.A.B. Of C.V. (Collectively, "Famsa Group" or the"Company"). The information is showed as a summary form and is not intended to be complete. There is no representation or warranty, express orimplied, regarding the accuracy, impartiality or integrity of this information.
This presentation contains, or may be deemed to contain, forward-looking statements. By their nature, forward-looking statements involve risks anduncertainties because they relate to events and depend on circumstances that may or may not occur in the future. The future results of Grupo Famsa,S.A.B. de C.V. and its subsidiaries may differ from the results expressed in, or implied by, the forward-looking statements set out herein, possibly to amaterial degree.
We warn that an important number of factors could cause that the actual results to differ from the plans, targets, expectations, estimates and intentionsexpressed in this presentation. In no event shall neither the Company nor any of its affiliates, directors, officers, agents or employees be liable to thirdparties for any investment or business decision made or for the actions taken based on the information and statements contained in this presentation.
The market-related information and the competitive position of Grupo Famsa, including the market estimates used throughout this presentation wereobtained from reliable public sources and the Company assumes no obligation as to the accuracy of said disclosure. information.
This presentation and its contents are the property of the Company and may not be reproduced or distributed in whole or in part without the prior writtenconsent from Grupo Famsa. Whoever receives this presentation, must comply with the applicable legal provisions and must obtain each and every one ofthe authorizations that apply to him. Neither the Company nor any of its affiliates, directors, officers, agents or employees shall be liable to third parties forsuch provisions.
All the relevant information of the issuer, in particular that relating to risk factors, is contained in the annual report of Grupo Famsa for fiscal year 2016 andin the other reports disclosed by the Company, which can be found in the websites of The Mexican Stock Exchange www.bmv.com.mx andwww.grupofamsa.com.
Note on Forward-Looking Statements

Investor Relations
Paloma [email protected]+52 (81) 8389 3405
ContactWe have a strong commitment to keeping you updated.
Please do not hesitate to contact us.