1msu.ac.zw/elearning/material/1188204485macroeconomics... · web viewtypical uses for this...
TRANSCRIPT
MACROECONOMICS
MODULE EC104
Written by Giya.G, Abel.S and substantially revised and edited by Ndlovu.E DEPARTMENT OF ECONOMICSMIDLANDS STATE UNIVERSITY
©2005

CHAPTER ONE
INTRODUCTION
Macroeconomics
Macroeconomics is concerned with the study of the whole economy. Macroeconomics is
concerned with the study of economy wide aggregates, such as the analysis of total
output and employment, total consumption, total investment and national product.
(Vaish,1995). It is concerned with the behaviour of the economy as a whole- with booms
and recessions, the economy’s total output of goods and services and growth of out[put,
the rates of inflation and unemployment, balance of payments, exchange rates etc.
Because it is closely related to real world issues, macroeconomics also involves many
non-economic factors such as political, historic, cultural and sociological factors.
(Dornbusch et al, 1998).
Macroeconomic ProblemsThese arise when the economy suffers from high unemployment, inflation, or a balance
of payments deficit. Therefore the government sets itself certain macroeconomic
objectives:
Low unemployment
Low inflation
A balance of payments surplus
Economic growth
Macroeconomics and Microeconomics
The line between macroeconomics and microeconomics is less sharp than it used to be,
but it is still there.
1

What makes this module different is that we focus on the economy as a whole.
Instead of talking about the demand and supply of (say) pizza, we talk about the demand and supply of output.
Instead of talking about what determines the demand for workers in the pizza industry, we talk about what determines the total demand for workers.
BUSINESS CYCLE
Business Cycles (or trade cycle)A business cycle is the more or less regular pattern of expansion (recovery) and
contraction (recession) in economic activity around a growth trend (Dornbusch et al,
1998). Business cycles can also be described as the periodic booms and slumps in
economic activities. The ups and downs in the economy are reflected by the fluctuations
in aggregate economic magnitudes, such as, production, investment, employment, prices,
wages, bank credits etc. The upward and downward movements in these magnitudes
show different phases of a business cycle (Dwivedi, 1996). Basically there are only two
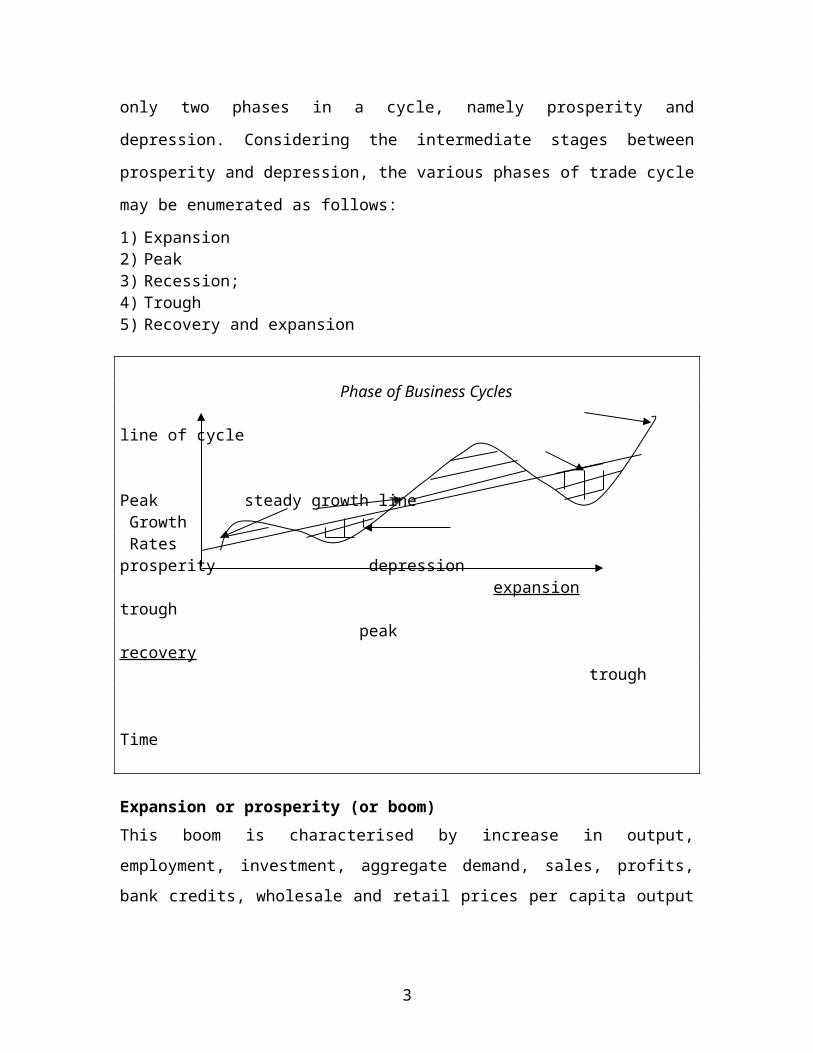
phases in a cycle, namely prosperity and depression. Considering the intermediate stages
between prosperity and depression, the various phases of trade cycle may be enumerated
as follows:
1) Expansion 2) Peak 3) Recession; 4) Trough5) Recovery and expansion
Phase of Business Cycles line of cycle
Peak steady growth line Growth Rates prosperity depression expansion trough peak recovery trough Time
2

Expansion or prosperity (or boom)This boom is characterised by increase in output, employment, investment, aggregate
demand, sales, profits, bank credits, wholesale and retail prices per capita output and a
rise in standard of living. The growth rate eventually slows down and reaches the peak.
However:
A boom increases spending on imports, causing balance of payments problems.
Once high levels of employment have been reached, output cannot be increased any further and the boom causes inflation.
Peak This is characterized by slacking in the expansion rate, the highest level of
prosperity, and downward slide in the economic activities from the peak.
RecessionThe phase begins when the downward slide in the growth rate becomes rapid and steady.
Output, employment, prices, etc. register a rapid decline, though the realised growth rate
may still remain above the steady growth line. So long as growth rate exceeds or equals
the expected steady growth rate, the economy enjoys the period of prosperity, high and
low. When the growth rate goes below the steady growth rate, it marks the beginning of
depression in the economy. Depression begins when growth rate is less than zero i.e. the
total output, employment, prices, bank advances etc. decline during the subsequent
periods. In other words there is a slump in the economy. [A slump reduces spending on
imports, thus improving the balance of payments. Reduced total spending lowers
inflationary pressure.] The span of depression spreads over the period growth rate stays
below the secular growth rate or zero growth rate in a stagnated economy.
TroughThis is the phase during which the downtrend in the economy slows down and eventually
stops and the economic activities once again register an upward movement. Trough is the
period of most severe strain on the economy.
3
RecoveryWhen the economy registers a continuous and rapid upward trend in output, employment,
etc, it enters the phase of recovery though the growth rate. When it exceeds this rate, the
economy once again enters the phase of expansion and prosperity. If economic
fluctuations are not controlled by the government, the business cycles continue to recur as
stated above.
Why worry about business cycles?Business cycles, cause not only harm to business but also misery to human beings by
creating unemployment and poverty. Governments in many countries assume the role of
a key player in employment and stabilization. Stabilization broadly means preventing the
extremes of ups and downs or booms and depression in the economy without preventing
factors of economic growth to operate.
Trade Cycles or business cycles- simplified diagram
Government Macroeconomic Policies
Macroeconomic Policy Objectives
All governments like to achieve the following 4 major macroeconomic policy objectives:
(a) Full employment of labour force.
(b) A stable price level.
4

(c) B.O.P equilibrium ( surplus is desirable)
(d) A satisfactory rate of economic growth.
On full employment, of labour force it is not possible to achieve this in the strictest sense.
The use of official unemployment statistics as basis for setting policy objectives is also
suspect. The list by government includes those defined as being unemployed by
government rather than those who would be willing to take up paid employment should it
become available. Some people on the register may be unemployable-aged, disabled,
criminals and those not intending to work.
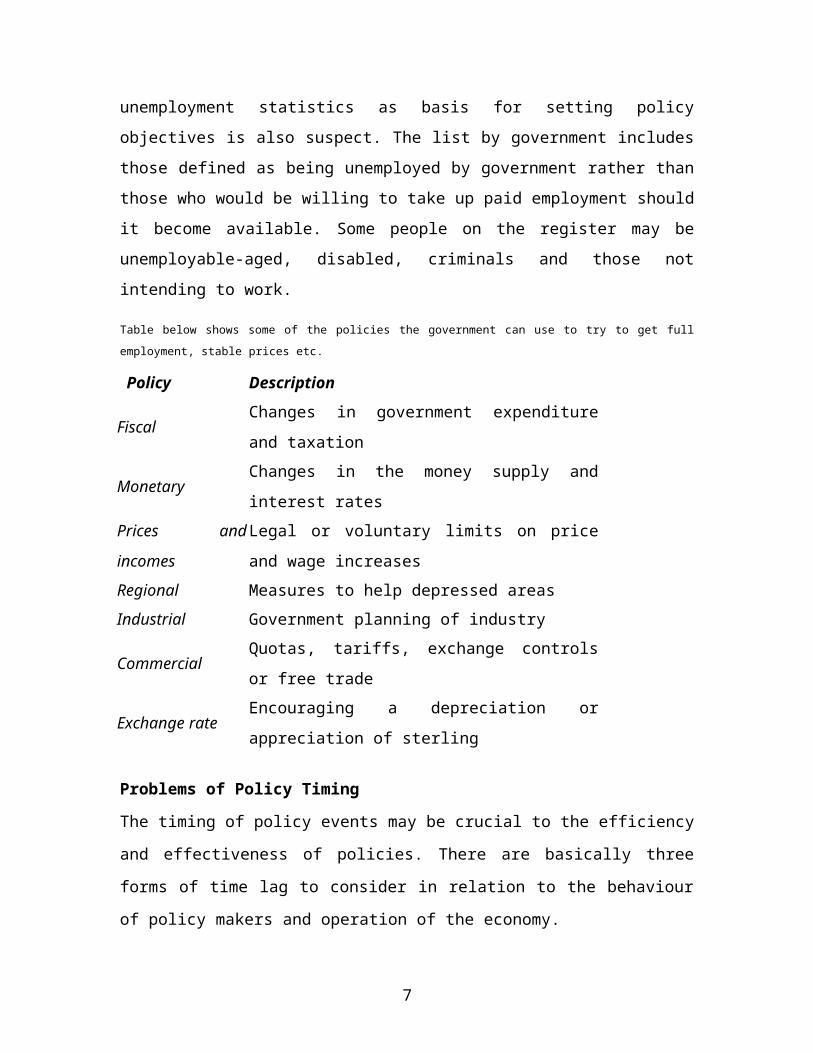
Table below shows some of the policies the government can use to try to get full employment, stable prices etc.
Policy Description
Fiscal Changes in government expenditure and taxation
Monetary Changes in the money supply and interest rates
Prices and incomes Legal or voluntary limits on price and wage increases
Regional Measures to help depressed areas
Industrial Government planning of industry
Commercial Quotas, tariffs, exchange controls or free trade
Exchange rate Encouraging a depreciation or appreciation of sterling
Problems of Policy Timing
The timing of policy events may be crucial to the efficiency and effectiveness of policies.
There are basically three forms of time lag to consider in relation to the behaviour of
policy makers and operation of the economy.
(a) Recognition lag- authorities perceive problems after some time.
(b) Administration lag- it takes time to set up the necessary administrative machinery in
motion. For example Parliament approves income tax measures after debate but
monetary policy options take days or hours to implement.
(c) Implementation lag- by the time the policy is implemented, new issues have arisen
hence new policies have to be implemented/formulated or adapt the policy
instruments introduced.
5
Chief Instruments of Economic Policy
The two important subdivisions of economic policy are the monetary policy and the fiscal
policy. These two policies are applied as mutually complementary policies to serve as
instruments of government’s economic policy which is applied to achieve certain social
goals. Often the two overlap, because it is almost impossible to envisage any major fiscal
or monetary measure which does not affect the other.
A. Fiscal Policy. This is the policy of government with regard to level of government
spending and tax structure. Government expenditure includes transfer payments,
government current expenditures and budgetary balance (extent of borrowing).
Taxation (i) provides the funds to finance expenditure. (ii) Can also be used for
income redistribution. Taxes are subdivided into direct and indirect. (i) Direct taxes –
these are levied directly on persons / corporates and include income tax, corporate
tax, poll tax and inheritance taxes, import duties. Typical uses for this instrument are
a reduction in income inequalities, regulate aggregate demand, protection of domestic
producers, reduce poverty, and provision of infrastructure and to adjust balance
between aggregate demand and supply. Import duties are important sources of
revenue in many African countries. Countries impose import tariffs for some or all of
the following reasons: (a) Revenue, protection to local producers, (b) discriminate
between essential and non-essential goods and (c) B.O.P purposes. (ii)Indirect tax is
levied on a thing and is paid by an individual by virtue of association with that thing,
e.g. local rates on property, sales taxes and excise duties. Tax structure can be
regressive proportional or progressive. Tax incentives may be given - investment
allowances, tax holidays, accelerated depreciation allowances, duty-free imports; no-
tax concessions may be given by government for e.g. provision of roads, water and
power. In some African countries rural taxation- was used e.g. Cameroon, Mali and
Sudan.
Problems of Fiscal Administration
(a) Tax evasion
(b) Shortage of trained and experienced staff.
6

(c) Corruption.
(d) attitudes towards payment of taxes.
(e) poor co-ordination of budgets with development plans.
B. Monetary Policy- the manipulation of the volume of credit, interest rates and other
monetary variables. Monetary policy is a policy which employs central bank’s control
over the supply, cost and use of money as an instrument for achieving certain given
objectives of economic policy. The policy is used to improve credit and saving
facilities and to regulate macroeconomic balance of the economy. All governments
run deficits in that their total spending exceeds the value of their tax and other current
receipts. The deficit is financed by long-term borrowing from abroad and from local
residents. Sometimes the long-term borrowings will not cover the gap which means it
has to be financed by other means. Government usually fills the gap by short-term
borrowing from the central and commercial banks. This borrowing from the banking
system (deficit financing) usually has highly expansionary effects on money supply.
In other words it increases the money supply by the amount of the deficit but is likely
also to result in secondary increases in money supply by increasing the cash base of
the banking system and hence its ability to lend more to private borrowers. (N.B.
Expansionary does not mean inflationary). Monetary policy can be used for anti-
inflationary purposes. Much industrial and commercial expansion is financed by bank
credit (especially for working capital) so to restrict bank lending is liable to place a
brake on new investment and economic expansion. It is possible for credit restrictions
to be pushed to the extent of forcing a deflation on the economy, with serious
avoidable loses of output and employment. Some economists have argued in favour
of the use of high interest rates to curb aggregate demand. The effect of a move along
these lines is to encourage the holding of larger money balances, reducing the
pressure of demand for commodities.
Critique of the interest rate Reservations to the interest rate issue have been raised:
(a) Higher interest rates may discourage investment and thus impede the development
of the economy. It can be counter argued that higher interest rates will raise the
productivity of new investments because now only projects which promise large
7
returns will be undertaken. Hence it may be possible to sustain the overall rate of
economy growth even from a reduced volume of investment.
(b) A successful induction of people to substantially increase their money holdings
may due to the withdrawal of purchasing power from commodity markets may be
deflationary.
(c) Several studies have found the elasticity of demand for money with respect to the
cost of holding it to be rather small. If this is the case, it would take a very large
rise in interest rates to affect a significant increase in the demand for money.
Limitations of the state in achieving Macroeconomic Policy Objectives
(i) too many ministries, often with competing interests, too many public
corporations and too many boards of one kind or another.
(ii) Too much corruption of civil service, civil servants badly motivated.
(iii) Too much red tape.
(iv) Too much political instability with governments often changed by military
coups and other unconstitutional means. Governments are therefore
preoccupied with tasks of maintaining their own popularity, authority and
power.
8

CHAPTER TWO
NATIONAL INCOME ACCOUNTING National Income is the outcome or the end result of all economic activities. Economic
activities generate two kinds of flows (i) money flows- these are in exchange for services
of factors of production in the form of flows- these are in exchange for services of factors
of production in the form of wages, rent, interest and profits (i.e factor earnings) (ii)
Product flows, are flows of consumer goods and services and productive assets. All
human activities which create goods and services that can be valued at market price are
broadly the economic activities.
Macroeconomics deals with a number of large totals or aggregates, which are used to
conceptualize and measure key components of the economy. The most fundamental of
these is the total output of goods and services, conventionally referred to as the national
income. (Official data in most countries is now actually reported on a "domestic" rather
than a "national" basis. The distinction, which is unimportant for most purposes, relates
to the treatment of investment income received from non-residents and paid to non-
residents. "Domestic income" is that produced within a country by all producers
operating there, whether foreign or not. "National income" is that produced only by
"nationals" of that country, whether they are producing it there or elsewhere.)
There is nothing inconsistent in referring to total output as income. Although what is
earned as income can be measured separately from what is produced, the two aggregates
are necessarily the same in amount. Before going on to see why, note that in either case
such large totals can be expressed only in terms of money, not physical products as such.
It is impractical to try to measure output or income in real, physical terms, simply
because it is impossible to sum apples and oranges or any of the millions of goods and
services which are produced and received as income in a modern economy. Instead,
physical quantities must be converted to a common measure and the measure used for
this purpose is the national unit of account, the dollar, pound, or other currency.
The value of total output or income in an economy during some accounting period,
usually a year or quarter of a year, is a significant statistic. It is generally used as an
indicator of the economy’s performance. Because a larger output or income is equated
with a rise in the economic well being of a country’s population, a higher output or
9
income is considered desirable and a lower one undesirable. The economy’s overall
performance is tracked by the changing value of the total output or income statistic.
Similarly, comparisons of relative well-being among different countries are based on
these statistics and a host of political and social as well as economic implications flow
from their behaviour over time.
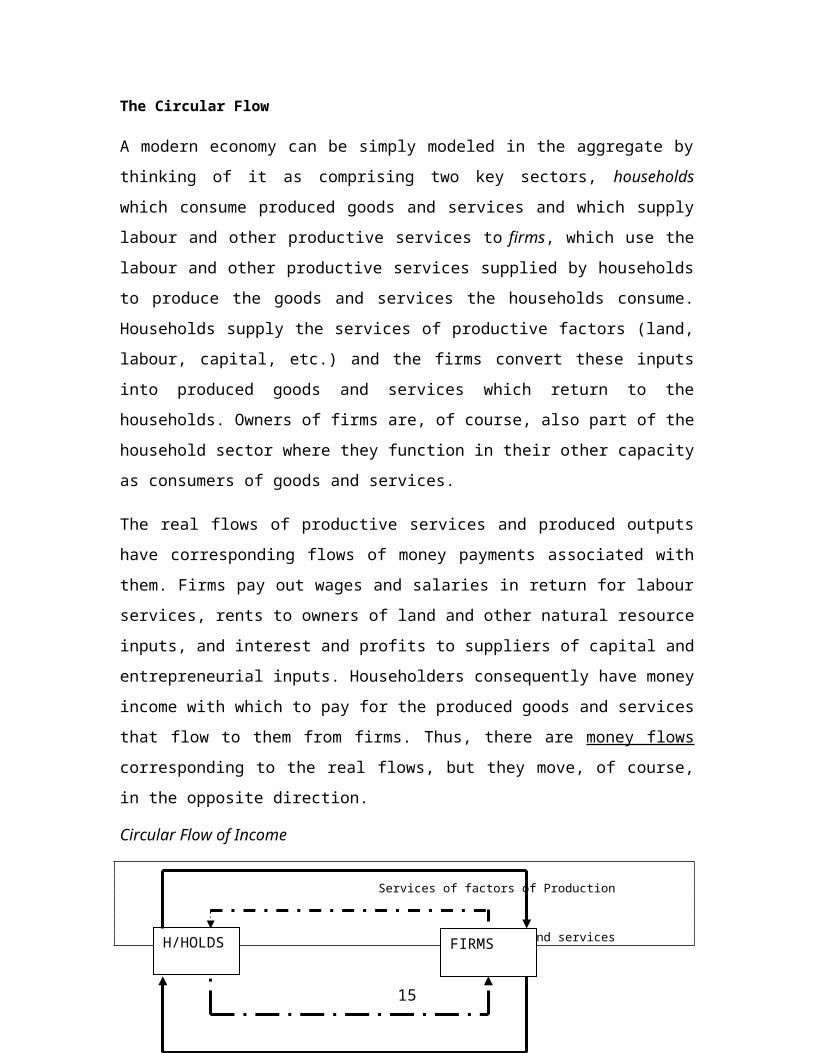
The Circular Flow
A modern economy can be simply modeled in the aggregate by thinking of it as
comprising two key sectors, households which consume produced goods and services and
which supply labour and other productive services to firms, which use the labour and
other productive services supplied by households to produce the goods and services the
households consume. Households supply the services of productive factors (land, labour,
capital, etc.) and the firms convert these inputs into produced goods and services which
return to the households. Owners of firms are, of course, also part of the household sector
where they function in their other capacity as consumers of goods and services.
The real flows of productive services and produced outputs have corresponding flows of
money payments associated with them. Firms pay out wages and salaries in return for
labour services, rents to owners of land and other natural resource inputs, and interest and
profits to suppliers of capital and entrepreneurial inputs. Householders consequently have
money income with which to pay for the produced goods and services that flow to them
from firms. Thus, there are money flows corresponding to the real flows, but they move,
of course, in the opposite direction.
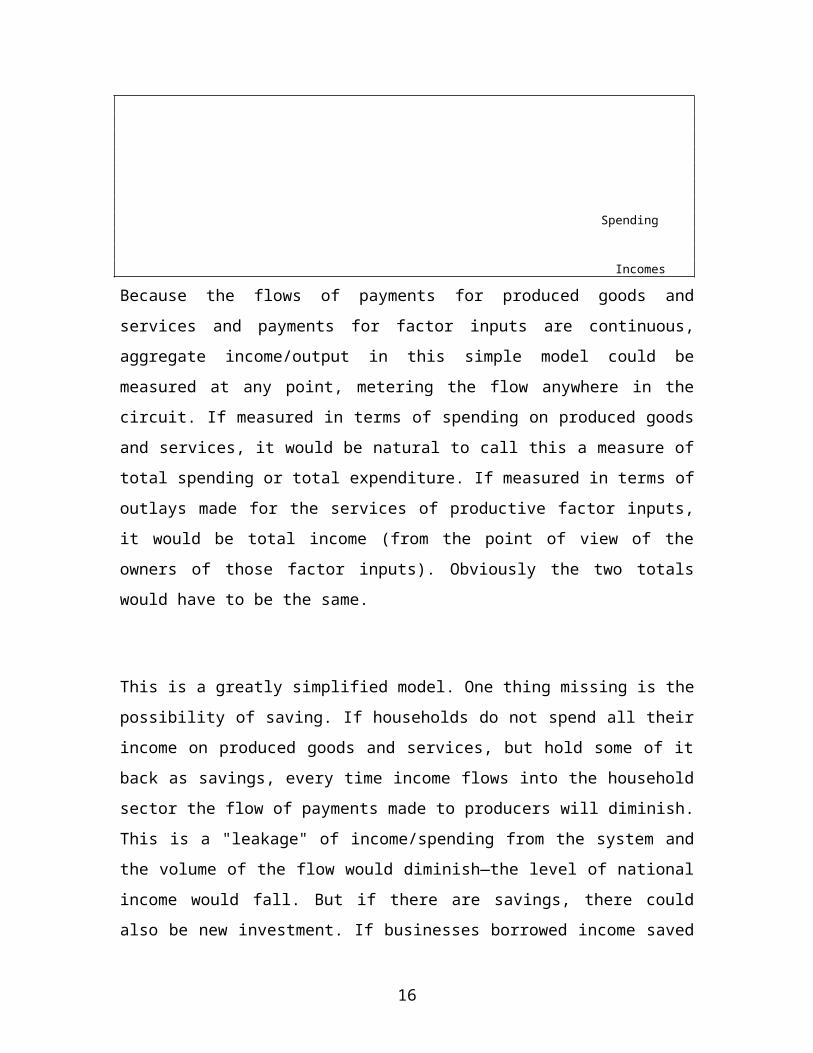
Circular Flow of Income
Services of factors of Production
Goods and services
Spending
Incomes
H/HOLDS FIRMS
10
Because the flows of payments for produced goods and services and payments for factor
inputs are continuous, aggregate income/output in this simple model could be measured
at any point, metering the flow anywhere in the circuit. If measured in terms of spending
on produced goods and services, it would be natural to call this a measure of total
spending or total expenditure. If measured in terms of outlays made for the services of
productive factor inputs, it would be total income (from the point of view of the owners
of those factor inputs). Obviously the two totals would have to be the same.
This is a greatly simplified model. One thing missing is the possibility of saving. If
households do not spend all their income on produced goods and services, but hold some
of it back as savings, every time income flows into the household sector the flow of
payments made to producers will diminish. This is a "leakage" of income/spending from
the system and the volume of the flow would diminish—the level of national income
would fall. But if there are savings, there could also be new investment. If businesses
borrowed income saved by households and used it to finance the building of new plant or
for other business purposes, it would be injected back into the income stream (in the form
of payments to workers and other factor owners who supplied the necessary real inputs
needed to produce the new capital). Banks and other financial intermediaries serve as the
nexus through which savings are converted into investment spending and returned to the
income stream.
In the simple economy above we can write the identity of output produced and output
sold as Y ≡ C+I. That is all output produced is either consumed or invested. The
corresponding identity for the disposition of personal income is that the income is
allocated on C (Consumption) and part is saved (S). This implies that Y ≡ C+S. It also
flows that C+I ≡ Y ≡ C + S. Subtracting C from both sides gives I ≡ Y - C ≡ S which
shows that saving is also income less consumption and also investment is identically
equal to saving.
If another complication, government, is added to the simple model, another potential for a
leakage of income from the system is introduced. Governments impose taxes (T) on
households (and firms) and this results in a diversion of income from the private sector to
government. This is another leakage and it too has a corresponding potential for injecting
11

such income back into the stream, this time in the form of government spending on
produced goods and services. Taxation reduces disposable income. Disposable income is
given by Yd ≡ Y-T and also Yd ≡ C+S. Thus C+S ≡ Yd ≡ Y-T
Finally, most real world economies are not closed loops. Instead they are "open" to the
rest of the world, with leakages from domestic income/expenditure flows in the form of
payments made for goods and services produced abroad ( imports, M) and injections of
income back into the domestic flows as a result of sales of goods by domestic firms to
consumers abroad (exports, X). As already seen, there can also be important flows of
savings and investment between one country and the rest of the world.
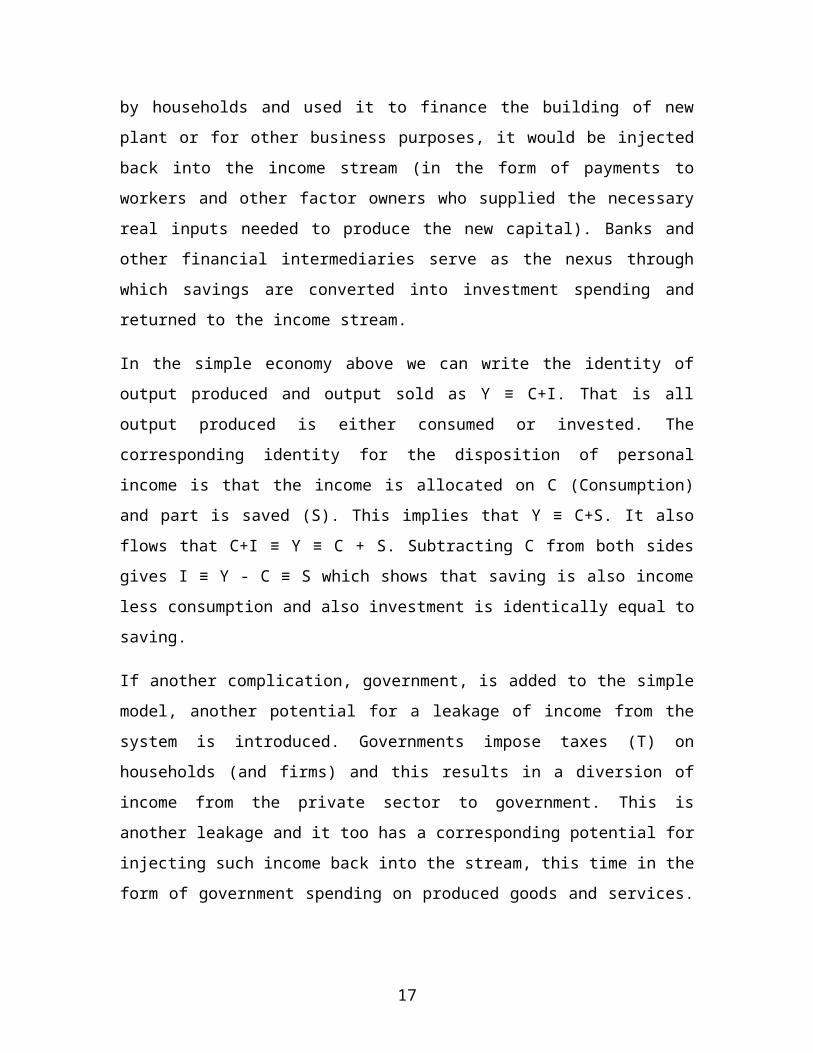
Circular Flow of Income
Services of factors of Production
Goods and services
Spending
Incomes
LEAKAGES/WITHDRAWALS INJECTIONSSavings InvestmentsTaxation Government ExpenditureImports Exports
From the diagram Y = C + I + G + (X-M) = C + S + T
The important ideas to understand at this point are that national income or expenditure
can be thought of as a continuous flow which can be measured in different ways
( Product ≡ income ≡ expenditure on the product) and that this simple process is
complicated by the possibilities of leakages and injections arising from private saving and
investing; government taxation and spending; and foreign trade and capital movements.
THE NATIONAL ACCOUNTS
H/HOLDS FIRMS
12
All the economies today measure the volume of aggregate income, usually defined as
Gross Domestic Product, in much the same way.
Gross Domestic Product (GDP)
Refers to the total monetary value of all goods and services produced within the
geographic boundaries of a nation during a given year. The word “domestic” implies that
only the income produced in that country is accounted for. The income that arises from
investments and possessions owned abroad is thus not included in the GDP estimates.
Calculation of GDP
-calculated simply by valuing the outputs of all “final” goods and services at “market”
prices ( i.e. actual prices at which they are bought and sold) and then adding the total.
N.B. The market value of all intermediate products- those used to produce the final
output is excluded from the calculation of GDP since the values of intermediate goods are
already implicitly included in the market prices of the final goods. “Gross” implies not all
output was available for private/public consumption and investment, part went to replace
or maintain worn out capital equipment.
Nominal and Real GDP
Two measures of GDP are given: nominal GDP (also called current dollar GDP) and real
(constant dollar) GDP. Nominal GDP measures the value of output at the prices
prevailing at the time of production, while real GDP measures the output produced in any
one period at the prices of some base year. The growth rate of the economy is usually
taken to be the rate at which real GDP is increasing.
Whatever their minor differences, all national accounting conventions follow the basic
pattern identified in the preceding discussion of the circular flow of income and
expenditure. There are always at least two main calculations, one which sums total
expenditures on goods and services produced, the other of total income received as a
result of producing those same goods and services. Because both are measures of the
same thing they must, by definition, yield the same total.
13

In national accounting in ex-post sense expenditure on production is always equal to
production and income. Product ≡ Income ≡ Expenditure on the product
Why two measures if the total must be the same? One reason is that two estimates
provide a check on one another with respect to accuracy. Another is that the two
measures break down into different components, some of which are more useful for
certain purposes than others.
GROSS NATIONAL PRODUCT (GNP)
This is the most important and widely used measure of national income. It is the most
comprehensive measure of a nation’s productive activities. It is defined as the value of all
final goods and services produced during a specific period, usually one year (Dwivedi,
1996). In other words it refers to that part of the GDP that is actually produced and
earned by or transferred to resident nationals of that country. Earnings of foreigners
which arise out of their domestic economic activities are thus excluded. For
Zimbabweans working abroad their income is included in the GNP of Zimbabwe. Where
there is substantial foreign participation in the economy and a large part of total domestic
income is earned and repatriated by foreigners and foreign companies as in many LDCs,
GDP will be much larger than GNP. As a result statistics of GDP growth may give a false
impression of the economic performance of a particular developing nation. GNP is
therefore a more appropriate measure of national income.
NET NATIONAL PRODUCT (NET NATIONAL PRODUCT)
Net National Product = Gross National Product– Depreciation. Net National Product
(NNP) is calculated by deducting from GNP the depreciation of existing capital stock
over the course of the period. The production of GNP causes wear and tear to the existing
capital stock, for example, machines wear out as they are used. It is a more accurate
measure of national product but in real life GNP is mostly because net investment (Gross
Investment – Depreciation) is difficult to measure especially as rate of depreciation is not
known (straight line, declining or reducing balance?) or may be quite inaccurate.
Depreciation estimates may also not be quickly available.
14

MEASUREMENT OF NATIONAL INCOME
There are three methods or approaches for measuring total output, namely :
1). Expenditure
2). Income method
3). Value Added or Output approach
A. The Expenditure Approach
Measuring total output by the expenditure method involves breaking down total spending
on all goods and services produced into four categories: (a) Expenditures by consumers
on goods and services (abbreviated simply to the letter C); (b)Expenditures by businesses
on capital goods (total investment spending, I); (c) Expenditure by government on goods
and services, G); and (d) Net exports (the total value of exports minus the total value of
imports, X-M). Because all spending done in the country falls into one or other of these
four categories, we can say that total expenditure is the sum of C+I+G+(X-M). We now
examine each of these four main components of total spending.
Consumption (C)
Consumption spending is the total of all outlays made by households on final goods and
services. In all countries it is by far the largest component of total spending. It covers
spending on an enormous range of items, including durable goods like television sets and
cars, non-durable goods like food and clothing, and personal services such as legal
advice, hairdressing, and dental care. But it usually excludes spending on houses, which
is customarily (and arbitrarily) treated as investment expenditure. C also excludes
purchases of second-hand goods that were produced in some earlier accounting period so
as not to double count the value of such output.
Government Expenditure on Goods and Services (G)
All governments payments to factors of production in return for factor services rendered
are counted as part of the GDP. Much of the spending done by governments in the
15
developed countries today takes the form of simple transfers of income from taxpayers to
those eligible for the wide range of income supplements available to assist the elderly, the
sick and the unemployed, or as payments of interest to holders of the public debt. Such
transfer payments do not represent spending on current production and consequently, are
not counted in national income determination. What is counted is government spending
on goods and services, many of which are bought by the government on behalf of the
public and which are ultimately "consumed" by households: education, health care
services, national defence, roads, water and sewage systems, postal services. Because so
many of these goods and services are provided "free" or in other ways that bypass
markets, it is difficult to determine their value in the same way that the value of the other
items entering into C would be determined. Consequently, national income accountants
value government spending on the basis of what the government pays for the goods and
services it requires.
Another complication with government spending on goods and services is that such
spending is often done on things like highways which are themselves capable of being
used to assist in the production of other goods. Logically, such spending should be
thought of as investment spending and included in the next category to be discussed.
Some countries produce their accounts in such a form that government spending can be
separated into two categories, current spending on goods and services, and investment
spending, but if the main concern is to understand the causes of year-to-year cyclical
fluctuations in the level of national income rather than the causes of its longer term
growth (which may be strongly affected by the level of investment as opposed to current
spending) it is convenient to stick with the traditional categories of spending which
emphasize the different motivations driving the spending decisions of ordinary
consumers, private investors and governments. Here, investment spending refers to
private investment spending unless otherwise stated.
Investment (I)
Investment is the production of goods that are not for immediate consumption. The goods
are called investment goods (inventories and capital goods including residential housing)
The total investment in an economy is called Gross Investment.
16
We count the construction of new houses as part of GDP, but we do not add trade in
existing houses. We do however, count the value of the estate agents commission in the
sale of existing houses as part of GDP. The estate agent provides a current service in
bringing buyer and seller together, and that is appropriately part of current output.
Total or gross investment Expenditure may be divided into two main categories:
(i) Expenditure on capital goods—purchases of plant and equipment either to replace
existing capacity that is wearing out or to increase capacity. This is often called fixed capital formation.
(ii) Expenditure on inventories. Many businesses find it convenient or necessary to
hold certain supplies of goods on hand, in which case investment in inventories
may be considered voluntary. But business conditions are uncertain and so firms
may also find themselves holding stocks because they miscalculated demand. In
either case, firms are considered to be investing when they accumulate
inventories. On the other hand, if their inventories decrease they are
"disinvesting." Inventory investment is highly volatile, changing greatly in
amount and composition from year to year.
Gross investment, then, is the total amount of (usually private) spending during the
accounting period on capital goods (defined as structures, machinery and equipment, and
inventories). Because capital by its nature consists of things that are used in the
production of other goods and services, it is inevitable that it will wear out or
"depreciate." The amount necessary for replacement is called Depreciation or capital
consumption allowance. Gross Investment – Depreciation = Net Investment. Unless it is
continually renewed, the stock of capital in the economy will gradually be depleted.
Handling depreciation is one of the more difficult parts of national income accounting.
Again, the best treatment depends on what the data are meant to be used for. If the
concern is with the long-term growth of the economy, net investment (total investment
during the accounting period minus depreciation) is the important concept because it
measures the growth of the economy’s capital stock over time. But if the purpose is to
understand short term, annual fluctuations in the level of total spending it is better to
work with gross investment.
17
Net Exports (X-M)
A significant part of total spending in most countries goes toward the purchase of goods
produced abroad rather than domestically. As noted in discussing the circular flow, such
outlays represent spending which leaks from the domestic economy to the rest of the
world and is consequently treated as a negative entry in measures of total domestic
spending. But it is offset to a greater or lesser degree by the spending of non-residents on
goods produced and exported to international markets. It is often convenient, therefore, to
take domestic spending on imports and foreign spending on exports as a combined value,
usually called net exports, a value which may be positive or negative in any accounting
period depending on which component, exports or imports, is larger.
Summing these four expenditure components, C+I+G+(X-M), gives a single figure, the
total amount of spending done in the economy during the accounting period. It should be
possible to arrive at exactly the same figure by summing all income received in the
economy during the accounting period. (GDP = Y = C+I+G+(X-M),
B. Measuring Total Output by the Income Method
As seen in discussing the circular flow, what the firms producing the national output see
as costs of production, owners of productive factors see as income. Factor costs and
factor incomes are consequently the same thing viewed from different perspectives.
GDP = wages+ rents + interest + non-income charges
Quantitatively, by far the most important and certainly the simplest factor costs to
measure are the payments made by employers for labour services. These payments are
usually reported in the official statistics under a heading such as "Wages, salaries, and
supplementary labour income," with the latter term referring to employee benefits such as
pensions, workers’ compensation benefits, and employer contributions to unemployment
insurance funds or other worker social security schemes. Most other factor payments,
however, are much more difficult to track. Consider a farming operation. How should any
net income derived from farming be classified? Part of it must be a return to the services
of land the farmer is using ( rent). Part must be a return to the farmer’s own input of
labour (wages). Part might be considered a return to setting up and operating the
business(profit). These are difficult to separate. Because of such problems, the national
18
accounts typically use definitions of factor payments which owe more to convenience
than to the logic of factor classification: net income of farm operators, corporation
profits, net income of unincorporated business, and interest and other investment income.
Summing all these items yields the total amount received during the accounting period by
the owners of productive factors. But if this figure for factor costs or income is compared
with the total arrived at by the expenditure method, it falls considerably short of the
amount expected.
Indirect taxes and subsidies result in a discrepancy between the market price and the
factor cost of goods and services. The market price of most goods and services includes
indirect taxes, such as general sales tax, value- added tax and excise taxes with the result
that the market price is greater than the price the seller of the good or service receives. On
the other hand, subsidies paid to producers to keep the market price of certain goods and
services lower than it would otherwise be, result in the producers’ income being greater
than the market price. To calculate the GDP at factor cost, i.e. the amount received by the
factors of production that produced the goods and services concerned, we therefore have
to deduct indirect taxes from the GDP at market prices and add back subsidies. Thus:
factor cost ≡ market price – indirect taxes + subsidies. This point becomes important
when relate GDP to the incomes received by the factors of production.
C. Output Approach or the Value Added Method
A third method is available for estimating the total output of the economy and it is called
the "value added method" because it simply sums the net value of the output produced by
all the firms in the economy. GDP is the value of final goods and services produced. The
insistence on final goods is simply to make sure that we do not double count This
approach measures GDP in terms of values added by each of the sectors of the economy.
This is conceptually simple, but in practice complex because of the need to avoid double
counting. There are many interactions among firms in a modern economy. Many produce
goods that are sold not to final users as consumer goods, but to other firms. Consider a
firm producing power supply devices for computers. It buys components from suppliers,
assembles them, and sells the finished product to another firm which incorporates it into a
computer. If the value of the power supplies was measured when they were produced and
again as part of the price of the finished computer, total output would obviously be
19

exaggerated. Dealing with this requires that the value of each firm’s output be reduced by
the amount of all payments made by that firm to obtain inputs. This involves considerable
work, but the resulting data are often very useful because they yield a breakdown of
national output on an industry-by-industry basis. In formula terms:
Value Added = output of firm - output purchased from other firms.
If we follow the course of this process, we will see that the sum of values added at each
stage of process is equal to the final value of the item sold. Value added is also the basis
for the Value added Tax (VAT).
A problem associated with the value added approach is valuation of inventories of goods
produced but unsold. Unsold inventories are valued at market prices yet profits ( or
losses) have not been realised; prices may fall or rise; goods may not be sold. This means
that a rise in market prices causes a rise in value of the existing inventories. To avoid this
distortion a correction is made to eliminate changes in the value of inventories due to
price changes; that is stock appreciation should be deducted from the value.
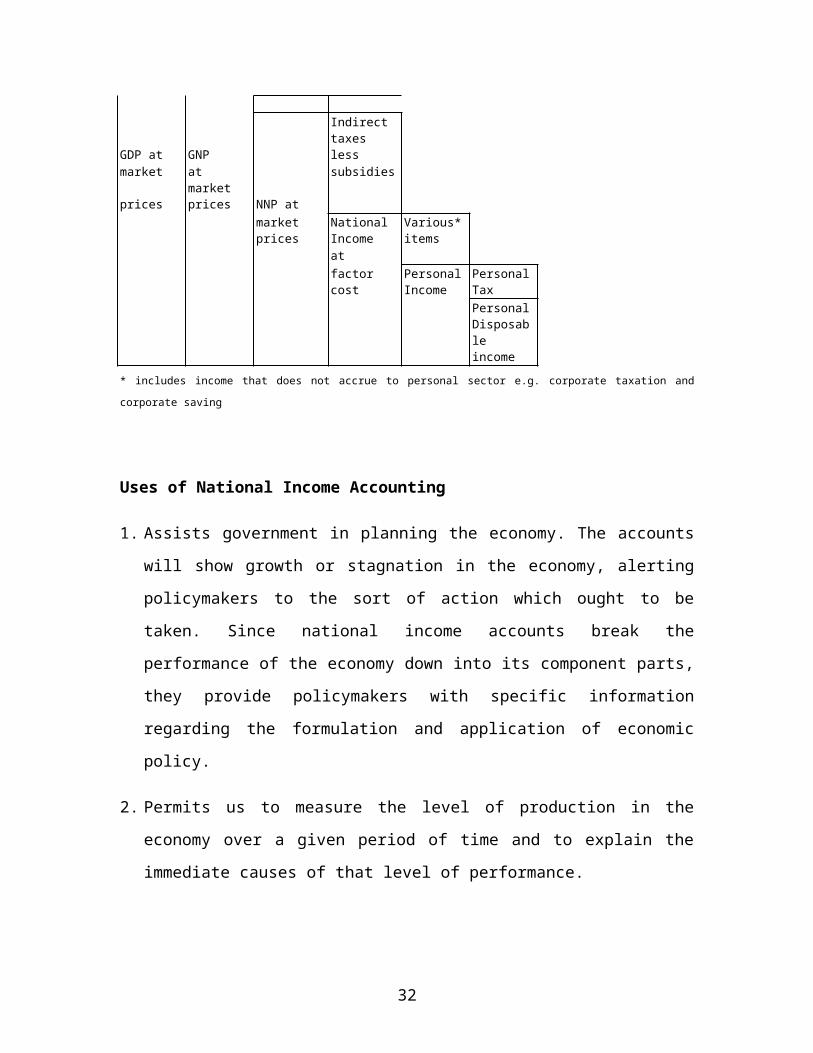
The table below summarizes the relationships. For example from the third and fourth columns NNP at market prices – indirect taxes add subsidies = national income at factor cost.
Net factorpayments
Depreciation
Indirect taxesGDP at GNP less market at market subsidiesprices prices NNP at
market National Various*prices Income items
at factor Personal Personalcost Income Tax
PersonalDisposable income
* includes income that does not accrue to personal sector e.g. corporate taxation and corporate saving
20

Uses of National Income Accounting
1. Assists government in planning the economy. The accounts will show growth or
stagnation in the economy, alerting policymakers to the sort of action which ought to
be taken. Since national income accounts break the performance of the economy
down into its component parts, they provide policymakers with specific information
regarding the formulation and application of economic policy.
2. Permits us to measure the level of production in the economy over a given period of
time and to explain the immediate causes of that level of performance.
3. By comparing the national income accounts over a period of time, the long-run course
which the economy has been following can be plotted.
4. To compare standards of living of different countries- the problem is the countries
being compared use different currencies. The simplest means of dealing with the
problem is to use the Exchange rates between countries to convert the GNP of each
nation to a common currency e.g. US$. Most international comparisons use this
method. The second method used is Purchasing Power Parity. (a) Exchange rate
conversion- the method is simple and straightforward but this does not meet our
needs fully. We are seeking to measure differences in standard of living among areas,
but exchange rate reflects purchasing power of currencies for goods traded in
international markets. Goods and services not traded on international market may not
be correctly taken into account. (b) Purchasing power parity- the method involves
determination of the relative purchasing power of each currency by comparing the
amount of each currency required to purchase a common bundle of goods and
services in the domestic market of the currency’s country of origin. This information
is then used to convert the GNP of each nation to a common monetary unit. Estimates
using Purchasing Power Parity method are a more accurate indicator of international
differences in per capita GNP than exchange rate conversion method.
5. As a measure of welfare and national development, GNP per capita may be rising
over a period of time implying a rise in economic welfare and economic
development. Criticisms include the following- output of weaponry may rise, crime
21
may rise (use of more police), motor vehicle production (more pollution) may also
rise (showing increasing GNP) yet in terms the people are not better off or even
worse off. Output may also have been of capital goods. GNP per capita gives no
indication of how national income is actually distributed and who is benefiting from
growth of production. A rising level of absolute and per capita GNP may obscure the
reality that the poor are no better off than before. As an index of improved economic
welfare GNP growth rates are inadequate for the generality. Despite its shortcomings,
GNP provides a useful measure especially if it is accompanied by indicators like life
expectancy, infant mortality rates, education, literacy and income distribution.
6. For soliciting international aid from other countries or multilateral organizations.
7. National income and product estimates by sector of origin of national product reveal
contributions made by different sectors of the economy.
PROBLEMS OF GDP MEASUREMENTGDP data are far from perfect measures of either economic output or welfare. Problems
of GDP measurement are:
(1) Badly measured outputs-some outputs do not go through the market, e.g. government
output (such as defence) is not sold in the market. Also there is nothing comparable
available that would make it possible to estimate the value of government output. It is
therefore valued at cost. Other non-market activities, including do -it- yourself work
and volunteer activities, are also excluded from GDP.
(2) Unrecorded economy- many transactions that go through the market escape
measurement. e.g. payment for a handyman’s services is not recorded in the GDP
data as it is unlikely to be declared, illegal traffic in drugs. The main problem is that
the relative importance of such activities may have been changing. If such activities
become more important over time , then measured real GDP will understate the rate
of growth of total economic activity. Why there might have been an increase in
unrecorded transactions (i) rising tax rates (which make it more tempting not to
declare sales or income,) and the growing importance of the so called informal
activities outside the modern sector of the economy.
22
(3) Data revisions- when they first appear, GDP data are not firm estimates. The reason is
that many of the data are not measured directly, but are based on surveys and guesses.
Considering the GDP is supposed to measure the value of all production of goods and
services in the economy, it is not surprising that not all the data are available within a
few weeks after the period of production. The data are revised as new figures come
in, as the CSO and RBZ improve their data collection methods and estimates.
Adjusting National Income Data to Allow for Price Changes
One difficulty with using money values to express national accounting magnitudes is that
the value of money may change over time. If there is a general rise in all prices, or a fall
in all prices, the monetary unit either decreases or increases in value. Trying to measure
distance with a ruler that shrank or expanded significantly between measurements would
obviously be a frustrating and not very useful activity. Inflation, defined as a general rise
in the price level, or deflation, a general fall in the price level, are common enough to
make it necessary to adjust national income data to remove the effect of changes in the
purchasing power of the dollar or other monetary unit being used to measure the value of
total output. This is done by developing indexes which show how the prices of the goods
and services produced in any one year have changed relative to the prices of those goods
and services in some other year. Setting up these indexes of prices is not difficult in
principle, although it can be an expensive, time-consuming task in practice. Consider a
simple example in which only a single commodity is the subject of interest, men’s shoes.
In the following table the price of men’s shoes in each year is compared with the price
prevailing in one particular year. The base year in the example is year 2000, (this can be
written as 2000=100) although it could have been any one of the five years. The price in
any particular year is then divided by the price in the base year to get the ratio of prices
shown in the third column. Because these ratios are usually expressed as percentages,
they are then multiplied by 100 to obtain the price index numbers shown in the last
column.
Year 1999 2000 2001 2002 2003
23

Price($) 20 40 50 60 80
Price Ratio 20/40=0.5 40/40=1 50/40=1.25 60/40=1.5 80/40=2
Price Index 50 100 125 150 200
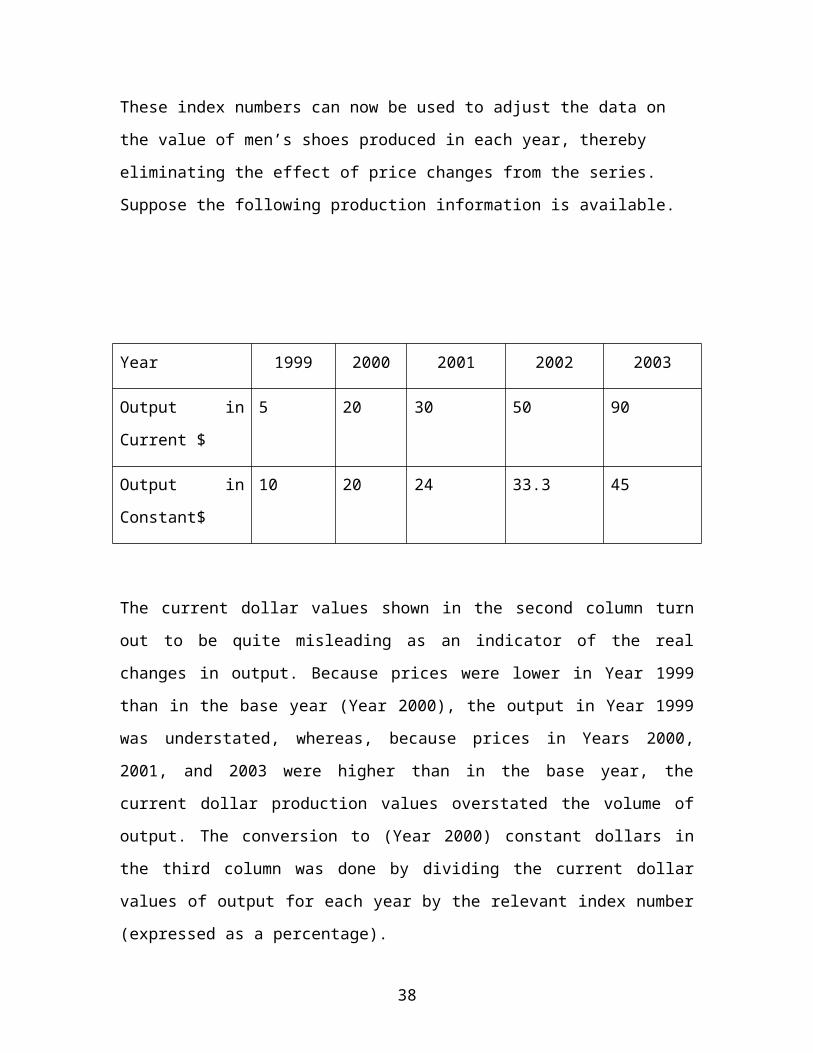
These index numbers can now be used to adjust the data on the value of men’s shoes
produced in each year, thereby eliminating the effect of price changes from the series.
Suppose the following production information is available.
Year 1999 2000 2001 2002 2003
Output in Current
$
5 20 30 50 90
Output in
Constant$
10 20 24 33.3 45
The current dollar values shown in the second column turn out to be quite misleading as
an indicator of the real changes in output. Because prices were lower in Year 1999 than
in the base year (Year 2000), the output in Year 1999 was understated, whereas, because
prices in Years 2000, 2001, and 2003 were higher than in the base year, the current dollar
production values overstated the volume of output. The conversion to (Year 2000)
constant dollars in the third column was done by dividing the current dollar values of
output for each year by the relevant index number (expressed as a percentage).
Men’s shoes are only one of thousands of commodities which are included in the total
national income and, in practice, it is not feasible to develop price indexes for each item
24
in this way. Instead, price indexes are built up for groups of commodities which are often
defined in terms of who buys them. For example, a commonly used index measures
changes in the amounts households spend on a selected bundle of goods and services.
One of the problems with this kind of index is that it is very costly to determine which
goods should be included in such a bundle. Surveys must be made of household buying
habits to determine which goods households are buying in significant quantities and the
relative importance of various goods in typical household budgets. Because of this, years
may elapse between redefinitions of the goods which are included in the index which
makes the information the index provides of dubious value toward the end of the
redefinition cycle.
When constructing large price indexes for adjusting national income data, most statistical
agencies build up a general index from a large number of specific commodity group
indexes, so that changes in expenditure patterns within the component groups will not
seriously affect the outcome. This composite index is known as a gross domestic product
deflator. It can be used to convert any current dollar value of gross domestic product to a
constant dollar basis using the relation:
Nominal GDP/Real GDP x 100 = GDP Deflator
GDP price deflator is an index calculated from nominal and real GDP. Thus, if the
deflator is known to have a value of 125 and nominal (current dollar) gross domestic
income is 50 billion dollars, real gross domestic income is $40 billion.
The measurement of per capita incomeAll countries have adopted the conventions (the United Nations Standard National
Accounts) for the calculations of Gross National Product (GNP) and Gross Domestic
Product (GDP), and GNP or GDP per capita is the commonest indicator of the level of
development. Economic growth refers to an increase in either of these indicators. There
are however well known problems associated with the calculation of national income in
poor countries and its use as an indicator of development:
1. The necessary data are often incomplete, unreliable or not available
25
2. The accounting conventions are not necessarily appropriate; the services of
women working in the household are excluded from national statistics yet in
many poor countries, especially in sub – Saharan Africa, women are often
responsible for running the family farm as well as working in the household.
3. In most poor countries, there is a large subsistence sector – that is, farmers may
well consume all or large proportion of what they produce, rather than sending it
to the market where it would be counted for the purposes of calculating national
income. Statisticians make an allowance for this non- marketed component of
output, and for rural capital formation that may not enter the national accounts –
house building, irrigation ditches – but it is generally accepted that the value of
the activities is underestimated, thus biasing downwards the national income
figures for poor countries.
4. Income may be overstated for developed economies because a number of items
that are included as income might better be seen as costs and hence excluded from
income- the cost of travelling to work, for example, or the cost of heating the
home in temperate climates.
5. Per capita (average) incomes tell us nothing about the distribution of income. Two
countries with similar per capita income distributions, with important implications
for the welfare of their populations and the nature and characteristics of the
development process.
Significant problems arise when international comparisons of income levels are made.
Income data measured in national currencies have to be converted into a common
currency, usually the US dollar, and an exchange rate must be chosen. If poor countries
artificially maintain overvalued exchange rates (that is, the price of foreign currencies in
terms of their domestic currency is too low), this will overstate the income of the country
expressed in US dollars. Offsetting this, however, is the fact that many goods and
services in poor countries are not traded and hence have no impact on the exchange rate.
Many of these necessities of life in poor countries – basic foodstuffs for example- are
very low priced in dollar terms, and a haircut in Zimbabwe will cost less than one in Paris
or London.
26

According to World Bank data:
Mozambique with an estimated GNP per capita of US 60 in 1992 was the poorest
country in the world;
Switzerland, with a GNP per capita of US$36080, was the richest
Is the average Swiss citizen 600 times better off than the average Mozambican? To put
that question slightly differently, does it make sense to state that in Mozambique, on
average, people live on 16 cents a day?
Clearly nobody in a developed economy could survive on such a low income. Given that
the majority of Mozambicans do survive, it must be the case that the necessities essential
for survival cost less in Mozambique than for example in Switzerland, and/ or $60 is not
a meaningful estimate of per capita income in Mozambique. This is not to deny that a
huge gap exists between the average incomes of very rich and very poor countries, nor
should it lessen our concern with such inequalities. But it does mean that the gap on
average is not as great as the statistics would suggest and a number of attempts have been
made to compute more meaningful comparisons.
Measurement of the Standard of LivingThe value of this year's national income is a useful measure of how well-off a country is
in material terms. However, inflation increases the money value of national income but
does not provide us with any more goods to consume. Real national income is found by
applying the equation:
Real national income = Money national income/Retail price index x 100.
The standard of living refers to the amount of goods and services consumed by
households in one year and is found
(i) by applying the equation:
Standard of living = Real national income/ Population = national income per capita
27
A high standard of living means households consume a large number of goods and
services. Or
(ii) by counting the percentage of people owning consumer durables such as cars,
televisions, etc. An increase in ownership indicates an improved standard of living. Or
(iii) by noting how long an average person has to work to earn enough money to buy
certain goods. If people have to work less time to buy goods, then there has been an
increase in the standard of living.
Interpretation of the Standard of LivingAn increase in the standard of living may not mean a better life-style for the majority if:
Only a small minority of wealthy people consume the extra goods.
Increased output of certain goods results in more noise, congestion and pollution.
Leisure time is reduced to achieve the production increase.
There is an increase in the amount of stress and anxiety in society.
Common Misunderstanding
1. The various measures of the national product give us a tally of the nation’s income for a year. However this does not measure the nation’s wealth .The nation has great stock of capital goods .The stock of national capital is the sum total of everything that has been preserved from all that has been produced throughout our economic history. Interestingly, perhaps the greatest asset of modern economies is the skill and education of the workforce. This is called ‘human capital’ but is not included in measures of net capital stock owing to difficulty of measurement.
2. If we are assessing someone’s wealth, one of the first things we would look at is
how much money they had and whether they owned stock and shares. However
these are excluded from the calculation of national wealth. Why? The answer is
because we have already counted them in the form of real wealth such as buildings
and machines. Money and other financial assets are only claims upon wealth and
hence are simply paper certificates of ownership. Similarly, varying the amount of
money in the economy does not directly make it any richer or poorer.
28
DETERMINATION OF EQUILIBRIUM NATIONAL INCOME
Equilibrium is that position in which the opposing forces of change are in balance. In a
two sector income equilibrium equation is Y = C + I where C = a + bY e.g. 50 + 0.75Y
According to Keynesian theory of income and employment, national income depends
upon the aggregate effective demand. If aggregated effective demand falls short of the
output at which all those able and willing to work are employed, unemployment in the
economy will result. Consequently there will be a gap between economy’s actual and
optimum potential output. On the contrary if the aggregate effective demand exceeds the
economy’s full employment output inflation will result.
Equilibrium aggregate income and output is determined at that point at which total
expenditure or aggregate demand function C + I + G + (X - M) cuts the 450 equality line
(Expenditure = Income). N.B. Equilibrium does not mean full employment output.
MULTIPLIERS
When there is an increase in the level of injections, part of it will be received by a
household as extra income. The households will probably act so that part of this extra
income is then spent and part is saved. This extra consumer spending then gives rise to a
series of further incomes and expenditures. The overall increase in spending is much
higher than the initial injection. This effect is known as the multiplier effect. The greater
the proportion of the extra income that is spent (the Marginal Propensity to Consume),
the bigger the multiplier effect will be. The multiplier is defined as the ratio of the change
in national income to the change in expenditure that brought it about. The change in
expenditure might come from for example private investment (investment multiplier) or
government expenditure (government expenditure multiplier) or exports (exports
multiplier). If we let k be the multiplier;
29

Investment Multiplier
Investment Multiplier ki
To clarify the investment multiplier supposing there is an injection of $120m to build
factories and other capital goods. The impact of this investment will be more than the
$120m initially invested. The $120m spent is thus income to those who supplied the
equipment, resources etc. How much of this $120m which has been received as income
will be spent depends on the keenness of the recipients to spend it, in other words their
marginal propensity to consume. Marginal Propensity to consume (MPC) would thus be
the fraction of the income likely to be spent. Of all income earned part will be spent, part
will be consumed, ie. Y = C + S
Consumption/ Income earned = MPC = Marginal Propensity to Consume
Amount Saved or Amount earned or income = MPS (Marginal Propensity to Save) and
therefore MPC + MPS = 1. Assuming a marginal propensity of 2/3, then $80m of the
$120m will be spent in the next stage. In the next stage of the $80m income, $53m will
be consumed. The greater the MPC the greater the income that is consumed hence the
greater the amount spent at subsequent stages. To calculate the multiplier
ki = 1/(1-MPC) = 1/MPS. From the example above ki = 1/(1-2/3) = 1/ (1/3)= 3. The
greater the MPC the greater the multiplier. This means that the total increase in the
national product brought about by the investment of an initial sum of $120m is $360m.
This analysis assumes away taxation and also price increases due to high demand for
goods and services. Imports have also not been taken into account. In reality once
demand increases prices may stabilize for a short while if factories have been operating at
less than full capacity but when that happens, i.e. full capacity is reached prices start to
30
rise. The rise will also depend on whether the economy is inward looking or outward
looking in terms of raw material inputs. If inputs are imported this pushes up prices of the
inputs and as a result increase in national output of $360m will not be realized because of
the leakages. Increase in demand for finished products also causes a derived demand for
material inputs hence cost of finished goods and ancillary services will rise. On the whole
there would be a decline in the quantities that would be purchased, due to increases in
prices. Anticipated expenditure is thus not equal to actual expenditure realized. The tax
structure may be increased especially as the tax base has been widened. Once the rate of
tax has increased then disposable income diminishes hence this affects the amount of
purchases vis-à-vis savings.
Simple Investment Multiplier
Importance of the multiplier for economic policy purposes stems from the assumption
that a given initial change in autonomous investment spending causes a magnified change
in the equilibrium income in the economy. Multiplier theory states that the increase in
total income occasioned by any given increase in autonomous investment (or
consumption) outlay is a certain multiple of the original increase in autonomous
expenditure and the magnitude of the increase in total income depends upon the value of
the MPC. The investment multiplier Ki and MPC are related in such a manner that the
higher the MPC the higher the investment multiplier and vice versa.
To derive we start with Y = C + I = C + Ī and C = a + bY
Substituting in the equilibrium equation ( Y = C + I ) this becomes
Y = a +bY + Ī
Y(1-b) = a + Ī
31

Ki = 1/MPS MPS = 1 – MPC
The operation of the simple investment multiplier in the economy is thwarted by many
leakages. Consequently the actual income generated consequent upon any given increase
in autonomous investment expenditure will be less than the product of the investment
multiplier Ki and the given increase in autonomous investment ΔI. In other words
ΔY < ΔĪ. Ki . Examples of a leakages (imports); inflation (increased money spending
fails to increase real consumption); savings (higher MPS lowers the multiplier while a
lower MPS raises the multiplier. Regressive tax policy and other fiscal measures
involving redistribution of income in favour of the richer sections of the economy also
reduce the size of the multiplier as do paying off debts, or if the increase is invested in
securities.
So far we focused on the simple investment multiplier where investment was treated as
autonomous, i.e. not related to income changes. In reality increases in income also causes
increases in investment. Thus like consumption the changes in investment in the
economy are induced by change in the level of income. Induced investment is positively
related to the level of income such that an increase in income induces an increase in
investment and net investment in any given time period will be equal to the increase in
aggregate demand. It is therefore more realistic to treat total investment as being
composed partly of the autonomous investment and partly of induced investment.
Investment demand function in the form I =. IA + eY where ĪA is autonomous investment
and eY is the induced investment 0<e<1.
DerivationY=C+I and C= a + bY; and I =. IA + eY substituting gives
This is the super multiplier. The inclusion of induced investment in the model raises the
value of the investment multiplier.
32
Paradox of Thrift
The inclusion of the induced investment in the model shows the interesting phenomenon
of the “paradox of thrift” which reveals that an attempt on the part of the community to
save more out of any given income will lead to an actual decrease in the amount it will
succeed in saving. In short, the attempt to save more will be self-defeating. In fact the
community may paradoxically end up with reduced total saving.
Government Expenditure Multiplier
From the definition this multiplier is kg
Government expenditure can influence economic activity in a country. It can influence
national output and employment levels to name a few. The multiplier applies equally to
government expenditure as it does to investment. In a simple model on the determination
of national income or output, aggregate demand is given by the formula Y=C+I+G, that
is aggregate demand = Y = Consumption + Investment + Government Expenditure. If
MPC =2/3 as before the change in national will be $360m. This implies that an increase
in employment for the factors used to produce that much in output will result.
Knowledge of government expenditure multiplier would help the government in deciding
on what expenditure level would be necessary to reach the full employment level.
E=Y E=Y AD2
C,I,G AD1 C,I,G AD1
Recessionary gap ∆G Full employment Full employment
700 1000 700 1000 National Product National Product
33
In the diagrams, assuming that MPC=2/3, the multiplier is 3 an the present equilibrium is
such that the national product (aggregate demand) is at $700m and the full employment
level is at $1000m then the government can increase its expenditure to wipe the
recessionary gap by spending only $100m.
Government Spending-Investment Multiplier
When investment (I) varies as income varies, then a change in government spending
leads to a modified multiplier – the government spending – investment multiplier, kgi
where MPI = marginal propensity to invest out of income. If MPC =2/3 and MPI =1/6
(MPS = 1 – 2/3=1/3)
From this a change in government expenditure, hence aggregate demand of $120m leads
to a magnified change in income of $720m because of the multiplier factor.
∆Y = kgi ∆G = 6 x $120 = $720m.
Government Expenditure Multiplier in a closed economy, with taxes
If we assume a closed economy
1. - Government expenditure is exogenous
2. - The tax (T) depends on the tax rate (t), which is the function of incomeBudget Surplus or Deficit = G – T; G is Government expenditure; T is Taxation
If G>T there will be a budget deficit.
If G<T there will be a budget surplus.
3. where is disposable income
4. Disposable income equals total income less taxation.
=
34
5. Investment is exogenous (independent of income)
Expenditure (E) = Income (Y)
Government multiplier
Alternative approach1. 2. 3. 4. 5.
The higher the MPS and taxes the lower the amount consumed. The lower the MPS and
taxes the higher the expenditure rate and figure.
Government Expenditure Multiplier in an open economy, with taxes
35

1. 2. 3. 4. 5. M=M0 +M1Y M = import function M1 = marginal propensity to import M0 = autonomous imports6. 7. exports are exogenous because imports depend on the exchange rate. It also depends on the world price. The marginal propensity to import depends on the exchange rate. ( . Exports are exogenous in a small country because they are determined by other countries.
8.
injections = leakages
Government purchases of goods and services when added to the level of private
consumption and business investment demand cause an increase in the equilibrium
income in the economy. This is so because government purchases of goods and services
not financed by an increase in taxes, increase the aggregate effective demand and
consequently increase the equilibrium income in the same manner in which an increase in
consumption and/or investment outlay raises the equilibrium income.
Taxes on the other hand have the same impact on the economy as saving. An increase in
government taxes will, ceteris paribus, decrease the equilibrium income. Government
purchases involve government expenditure on goods and services. Total government
expenditure can be separated into government purchases of goods and services (G) and
36
government transfer payments (R). Their impact on the economy is different. While G
involve direct consumption of the purchased goods and services by government and
therefore raise aggregate demand by the full amount of government expenditure. In the
case of transfer payments (R), government pays money to individuals in the form of old
age insurance, unemployment dole payments, etc. After including government sector in a
3 sector closed economy, equilibrium aggregate income will be Y = C + I + G with no
increase in the government taxes and autonomous investment, the government purchases
multiplier will be equal to the simple investment multiplier.
Derivation. This can be derived as follows: Y = C + I + G and C = a + bY; I = ĪA where ĪA
is autonomous investment. G = Go= autonomous government expenditure.
This is the multiplier in the absence of government taxes and transfer payments with only autonomous investment.
Government transfer multiplier. A government transfer multiplier operates like the
simple multiplier except that its value is generally smaller than the value of the simple
multiplier for either government purchases or investment. Normally different transfer
payments would have different multipliers. For example, the transfer multiplier for
interest payments would be smaller than that for the unemployment compensation
payments since interest payments are mostly received by high income families owning
government bonds. These families’ MPC is low while the unemployment compensation
payments are received by the low income and poor families whose MPC is generally
high.
37

Tax Multiplier. The tax multiplier would be negative because a tax would cause a
negative change in the disposable personal income of the community. The disposable
personal income
Yd = Y –T+R where R is transfers. (It is assumed that T and R are autonomously
determined.) C = a + bYd and therefore ΔC= bΔYd
ΔC= bΔ (Y –T+R) and ΔC= bΔY –bΔT+bΔR)
The impact of taxes on consumption and therefore, on income is negative. Derivation is
Y = C + I + G
Substituting for Yd gives
for the transfers multiplier.
Lump sum tax multiplier
Lumpsum tax is tax that is a fixed amount. The lumpsum tax multiplier
ktx= - MPC/MPS. This has a negative sign because as tax increases consumption falls. If
MPC = ¾; MPS = ¼, then ktx= - MPC/MPS.= -(3/4)/ (1/4) = -3.
If MPC = 2/3 ; MPS = 1/3 then ktx= - MPC/MPS = -(2/3)/ (1/3)= -2.
∆Y = ktx.∆T T = Tax.
With a tax cut of say $10m
∆Y = ktx.∆T=-2 (-10) = $20m.
Balanced Budget multiplier
38
When a budget is balanced G=T hence ∆G = ∆T. If both G and T increase by $10m,
income increases by $10m. The multiplier for a balanced budget kBB.=1 ;
∆Y = kBB.x ∆G = 1 x ($10m) = $10m this would be an expansionary budget. If there is a
cut of say $10m , ∆Y= kBB.x ∆G= 1 x (-10) = -$10m and this is a contractionary budget.
Foreign trade multiplier. For an open economy, income and output will increase from
one period to the next as total exports increase or its total imports decrease because as a
result of both these changes the economy’s net exports expand. Conversely, domestic
economy’s income and output will fall over time as its total exports decline or total
imports rise as both these changes will tend to cause a fall in net exports. From this it
follows that the effect of imports and exports on economy’s equilibrium income and
output originates from those factors that determine the economy’s imports and exports.
Generally, a country’s total exports depend on the price of goods in the country relative
to their prices in other countries, tariff and trade policies prevalent in the country and
availability of foreign currencies in the foreign exchange markets, income in other
countries, own imports of the country, etc. Some of the more important factors that
determine a country’s exports are not directly related to conditions within that country.
Consequently, it is assumed that gross exports of a country are autonomously determined,
i.e. exports are determined by the external factors. The volume of imports is determined
by similar factors. However many of these factors are influenced by conditions within
the country. Ceteris paribus, a country’s total imports are determined by the level of
national income. In other words assuming given international price differences and
unchanging tariff, trade and foreign exchange restrictions a country’s imports are
functionally related to her national income.
Assuming a linear relationship between national income and imports of the following
form which defines the import function as M = Ma + mY, where Ma is the autonomous
spending on imports and m is the marginal propensity to import (MPM).
In the four sector open economy the equilibrium income is given by the equation Y = C +
I +G + (X-M) or by the equation S +T + M = I + G + X. Since our consumption is
39
defined by the equation of the consumption function C = a + b(Y-T) and imports are
defined by the import function equation M = Ma + mY, by substituting for the terms C
and M the above equilibrium income can be written as
Y = a + b(Y-T) + I + G +X – (Ma + mY). This can be rewritten as
Where 1/ (1-b+m) is the foreign trade multiplier for the economy in which exports are
wholly autonomously determined while both consumption spending and import
expenditure are linear functions of the level of national income. If taxes are assumed to
be functionally related to the level of income so that the total tax function is T = d + tY,
the equilibrium national income would then be
Where 1/(1-b+bt+m) is the foreign trade multiplier for the system in which
consumption, imports and taxes are all linear functions of the level of domestic income.
Furthermore if we treat investment spending also linearly related to the level of income
so that the investment demand function can be written as I = Ia + eY, the equation for the
equilibrium aggregate income will become
in which consumption, investment, imports and taxes are all linear functions of the level
of national income. The foreign trade multiplier, also called the export multiplier,
operates in exactly the same manner, as does the ordinary investment multiplier. An
increase in country’s exports causes an increase in the incomes of the exporters and
factors employed in the export industries that in turn spend a part of their increased
incomes on domestic goods. In short, the larger the marginal propensities to save and
import, smaller will be the value of the foreign trade multiplier and vice versa.
40
is the foreign trade multiplier for the economy in which the consumption, investment,
imports and taxes are all linear functions of the level of national income. A look at the
multiplier brings home the fact that ceteris paribus the value of the foreign trade
multiplier is inversely related to the value of the marginal propensity to import m such
that higher m is associated with lower foreign trade multiplier and vice versa.
Criticisms of the Multiplier Analysis
1. Simple multipliers analysis is faulty because it neglects the role of induced investment resulting from induced consumption in the determination of equilibrium income.
2. Multiplier analysis derives the multiplier on the assumption of constant MPC. Over the short period ( short-run) of a trade cycle, the marginal propensity to consume is not constant.
3. Assumes that labour and other fixed resources are idle or under-utilized in the economy.
4. Bottlenecks of particular kind of labour or at particular places may block the expansion of employment and output in the economy.
41

CHAPTER THREE
MONEY AND BANKING THEORY
Origins of MoneyThe earliest method of exchange was barter in which goods were exchanged directly for
other goods. Problems arose when either someone did not want what was being offered in
exchange for the other good, or if no agreement could be reached over how much one
good was worth in terms of the other.
Valuable metals such as gold and silver began acting as a medium of exchange.
Governments then decided to melt down these metals into coins.
By the seventeenth century people were leaving gold with the local goldsmith for safe
keeping. Receipts of £1 and £5 were issued which could then be converted back into gold
at any time. Soon these receipts were recognized as being 'as good as gold' and were
readily taken in exchange for goods. Goldsmiths became the first specialist bankers and
their receipts began to circulate as banknotes.
Only the Reserve Bank of Zimbabwe can issue banknotes in Zimbabwe. However, notes
are not usually used to buy expensive items such as cars. The buyer is more likely to
write out a cheque, which instructs his bank to transfer money from his account into the
account of the seller. Hence bank deposits act as money.
Functions of Money
Money is something which people generally accept in exchange for a good or a service.
Money performs four main functions:
a medium of exchange for buying goods and services;
a unit of account for placing a value on goods and services;
a store of value when saving;
a standard for deferred payment when calculating loans.
42

Properties or Characteristics of Money
Any item which is going to serve as money must be:
acceptable to people as payment;
scarce and in controlled supply
stable and able to keep its value
divisible without any loss of value
portable and not too heavy to carry.
Gresham’s Law- ‘ bad money drives out good money’If there are two types of money, and one is more valuable than the other , the inferior
money gets used/ circulated and it drives the valuable / superior money out of
circulation. People will hoard the good money and spend it.
MONEY SUPPLY
Definition
The money supply is the total amount of assets in circulation, which are acceptable in
exchange for goods. In modern economies people accept either notes and coins or an
increase in their current account as payment. Hence the money supply is made up of cash
and bank deposits.
Credit Creation
Some customers leave money in the bank earning interest. A bank can use these idle
deposits to make loans to people who then buy goods. Shopkeepers receive extra money,
which they redeposit with the bank. Some of this redeposited money is left to earn
interest and can be re-lent. The bank has therefore created money. If all customers were
to try to cash their deposits at once, there would not be sufficient cash. The amount of
43

money the bank can create therefore depends on the ratio of cash to liabilities that they
hold. The higher this cash ratio the less money the bank can re-lend or create.
How do banks create money?
Assume a single bank, Barclays bank
Mr. Moyo deposits $20000 cash in the bank.
By depositing $20000 in the bank, money changes its form from cash to deposit.
Mrs. Maphosa wants to borrow money for business.
Barclays Bank can lend because it knows Mr. Moyo will not withdraw all at once.
But it knows it must keep some cash as a reserve say 10% therefore Barclays
lends $18000 to Mrs. Maphosa.
By lending money to Mrs. Maphosa, the bank increases money supply to $38000
from just $20000. The bank is able to create money because people have
confidence that the cheques signed by the bank are honoured.
If the reserve ratio is r then the basic definition of money multiplier (m)
The change in total deposits (AD) =( 1/r x Deposit)
When r = 0.1 and deposit = 20000, then
The change in total deposits = D=
From this calculation changes in deposits can be as high as $200000 from an initial
deposit of $20000. If the reserve ratio increases, it limits the change in deposits
because most of the deposits are kept as reserves and not lent.
Limits to banks to create money will depend on:
Amount of reserves (liquid) assets
Reserve asset ratio
Willingness of people to borrow
Desire of people to hold cash.
44

What is regarded as reserve asset must be defined by law. The following assets
can however be regarded as reserve assets:
Cash balance with central bank
Foreign exchange
Treasury bills
Gold etc.
Definitions of money
1. = It is also called high powered
money.
2. Demand deposits notes and coins in circulation with public.
It is sometimes referred to as ‘narrow money’
3. Savings deposits with banks. It is sometimes referred to as broad money.
4. Other savings deposits etc.
Determining Money Supply
1.
2.
Where - reserve ratio
- Reserve assets
- Demand deposits
- Currency ratio
- Notes and coins in circulation
in countries like Zimbabwe, the currency ratio is very high because many people keep
notes and coins at home. This is because the banking system can at times be
inconvenient.
45
3.
4.
Where
- m is the money multiplier and is greater than 1 (m>1)
- the reserve ratio can be separated into required reserve ratio and excess
reserve ratio
- Banks hold excess reserve ratio because
1. Most banks are prudent (prudential banks ) and sensible to see whether lending is
profitable.
2. Limited liability of banks to create since people may not be willing to
borrow due to high interest rates.
46

DEMAND FOR MONEY
- refers to the amount of money held by the general public in an economy.
- The main reasons for holding money are:
1. Transactional reason/ motive
2. Speculative motive
3. Precautionary motive.
MONETARY POLICY
What is Monetary Policy?
It is the use of money or its cost, the interest rate to fine tune some economic variables
such as :
Inflation
Economic growth
Investment
Interest rates
Balance of payments
Objective of monetary policy
In general monetary policy has two major objectives:
1. To reduce inflation (stability objective)
2. To boost economic growth (growth objective)
Instruments / Measures/tools of monetary policy
47
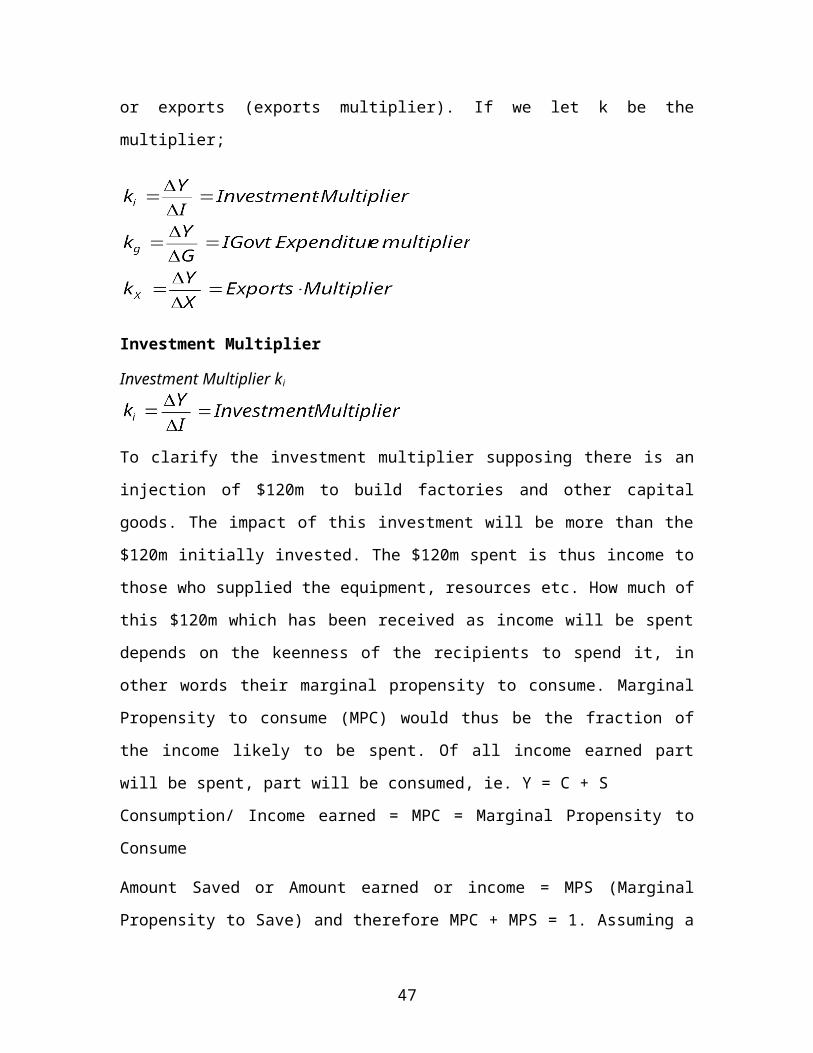
Monetary policy measures are used to increase or decrease the amount of
money, depending on the situation prevailing.
Each instrument can be used in 2ways, either to increase or decrease the
amount of money in circulation
The following are some of common instruments:
1. Bank rate
2. Open market operations
3. Rediscount rate
4. Repurchase Agreement
5. Selective credit controls
6. Moral Suasion
7. Reserve requirements
These instruments can be classified into the general or quantitative instruments and the
selective or qualitative instruments.
General or quantitative instruments
These include open market operations, changes in the minimum legal cash reserve ratio
and changes in the bank or discount rate. These instruments influence the credit creating
capacity of the commercial banks in the economy by operating directly or indirectly on
their excess cash reserves.
Selective or qualitative instruments
The instruments affect the types of credit extended by the banks. They affect the
composition rather than the size of the loan portfolios of the commercial banks. The
immediate object of imposing the selective credit controls is to regulate both the amount
and the terms on which credit is extended by the banks for selected purposes. The
48

selective credit control instruments enable the central bank to restrict unhealthy
expansion of credit for specific purposes; without at the same time airing credit
expansion in general.
Use of the Instruments/ Measures /Tools
The instruments are contractionary or expansionary, depending on the liquidity situation.
When there is too much money, monetary tools are used in contractionary way. When
there is less money, monetary tools are used in an expansionary way.
Bank Rate/ Rediscount Rate
When banks borrow from the Central Bank directly, they are charged a bank rate.
When they borrow indirectly through the discount houses, they are charged rediscount
rates.
This is the rate at which the central bank discounts first class bills.
It is a benchmark for commercial bank lending rates.
An increase in the bank rate increases lending rates and reduces the amount of
money.
A decrease in the bank rate reduces lending rates and increases the amount of
money.
Open market operations
This is buying and selling of government securities e.g. bonds (TBs). When there is too
much money, the government sells securities. The government takes the money and the
public holds securities. To reduce money supply, the government sells bonds to the
public and pays with currency (notes + coins in circulation). This reduces money
available for spending. The success of the instrument depends on whether the public
wants to buy bonds or not. To persuade people to buy bonds, the government raises
interest.
49

When there is inadequate money, the government buys securities. The government takes
the securities and the public holds money. Money is injected into the economy.
Selective credit controls
When there are liquidity problems, the central bank and even banks have preferential
treatment of clients. Credit is allocated to some selected sectors. For example, credit can
be allocated to export or productive sectors. Rationing of credit- this involves imposing a
ceiling upon its (Central Bank’s) discounts for any one bank or rejecting a proportion of
each discount application whenever total demand for loans exceeds the amount the
central bank is prepared to discount on any one day.
Regulation of consumer credit
The regulation of consumer credit is employed to regulate the terms and conditions under
which bank credit repayable in installments could be extended for purchasing or carrying
the consumer durable goods. The regulation of consumer credit is quite important in
combating inflation by restricting the aggregate consumer demand for those goods which
are in short supply in industrially developed countries where consumer credit is largely
used to finance domestic purchases. In countries where there is no consumer credit and
the banks do not participate in financing the purchase of consumer durables to any
significant degree, the method cannot be effective in curbing the inflationary pressures in
the economy.
Moral Suasion
It involves direct solicit with the Central Bank. The central bank persuades financial
institutions to be supportive of the prevailing monetary policy stance. When there is too
much liquidity, institutions are persuaded to tighten their credit allocation systems. When
there is a shortage of liquidity, institutions are persuaded to loosen their credit allocation
systems. This measure is not mandatory but persuasive and as a result it is difficult to
influence the currency ratio c/D and consequently money supply.
The instrument would succeed only if the commercial banks follow scrupulously the
leadership of the central bank. This will however depend on the strength of the central
50
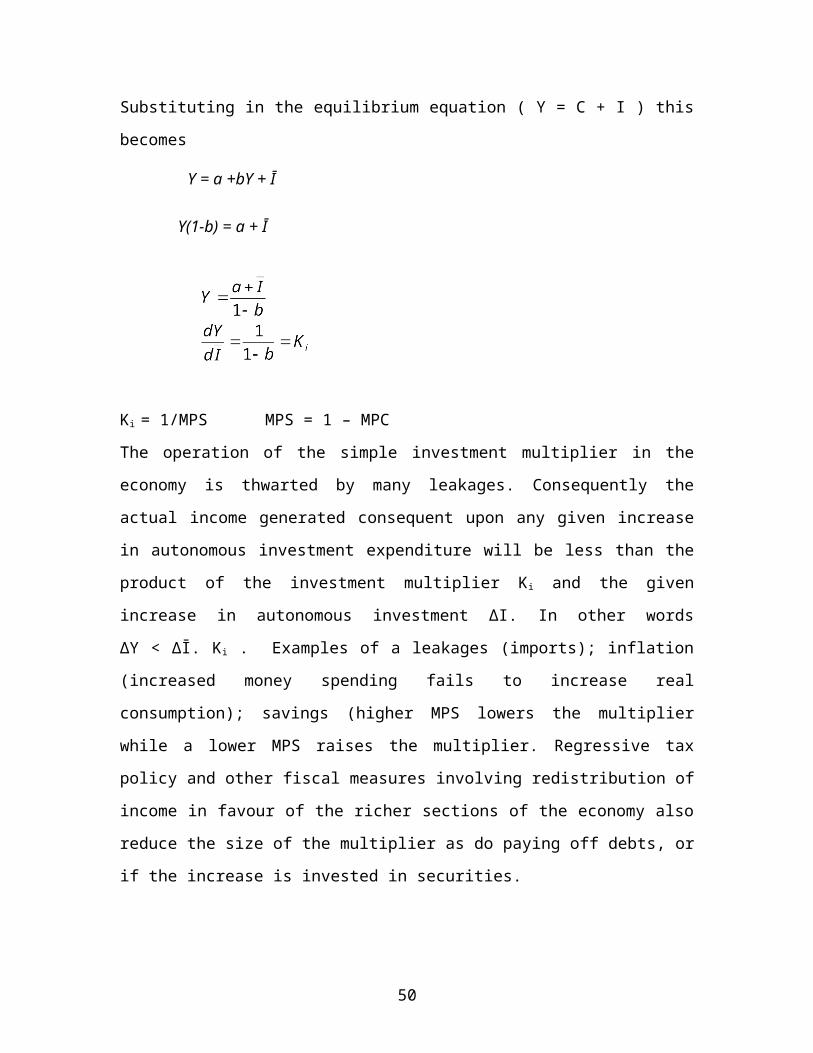
bank and the prestige enjoyed by it among the member banks. In countries with highly
liquid monetary conditions and where the central bank cannot undertake open market
operations on a massive scale to counteract the high bank liquidity, it is advisable for the
central bank to use moral suasion.
Reserve Requirements
When bank deposits are made, part of the money is kept as bank reserves and the rest
is lent out as loans. The reserve requirement is the amount of money that is kept as
reserves. The percentage of money kept as reserves is called the reserve requirements
ratio. When there is too much money, the reserve ratio is increased to reduce credit
creation. When there is a shortage the reserve ratio is reduced to increase credit
creation so as to increase money supply. The government can regulate the required
reserve ratio .
Increasing required reserve ratio reduces the lending base. The instrument is not
without its limitations: If their cash reserves are swollen, commercial banks will not
care at all for the increase in the minimum legal cash reserves ratio requirement
unless the increase is very high. They might also conduct their operations with a
lower cash reserves ratio if they are optimistic about the future, while a fall in the
minimum legal reserves ratio may fail to induce them to lend in depression. A
counteracting force may arise from a change in the banking practices. If percentages
of minimum legal cash reserves required to be kept with reserve banks differ for
different kinds of deposits held by banks e.g. with a minimum legal cash reserves
ratio of 10% against the demand deposits and of 3% against the time deposits, a
transfer of bank funds from the former to the latter would enable the banks to expand
credit and to that extent would induce them to disregard the credit restriction policy
enforced by the central bank.
Publicity
Central banks may employ the instrument of publicity in order to publicise the economic
facts in the weekly statements of their assets and liabilities, monthly bulletins containing
review of credit and business condition, and detailed annual reports stating their
operations and activities, the state of affairs of the money market and banking system and
51

general review of the trade, industry, agriculture, etc. in the country. By resorting to
publicity, the central bank enlists public opinion in favour of its monetary policy and
thereby combats opposition to its policies among political, financial and business
interests. However the method of publicity has the scope of useful application in
industrially advanced countries where public opinion is enlightened. In the developing
countries where people are mostly less educated and even those who are educated are not
acquainted with the technique of banking the method of publicity is of little use in
controlling credit.
52

CHAPTER FOUR
UNEMPLOYMENT
What is unemployment?
Definition
Unemployment is the pool of people above a specified age who are without work, are
currently available for work and are seeking work during a period of reference.
Unemployment results when the available workplaces cannot adapt to the job seekers.
When the number of persons, who offer their working capacities, exceeds the number of
available workplaces, this leads to a lack in workplaces.
Unemployment has become a serious economic problem. Majority of people can only
make living by working for others. Many millions of people are both able and willing to
work, but simply cannot find a job. Unemployment is an overwhelming concern of
policymakers and the general public. Unemployment often implies a waste of human
resources that could otherwise be producing goods and services to satisfy the needs of
society. At the same time, it can mean extreme personal hardship for the Unemployed,
and therefore it is an important social concern. Unemployment rate fluctuates widely over
time within a given country, in line with the business cycle. Unemployment increases
during recession and declines during booms.
Measurement of Unemployment
When calculating the level of unemployment the government only counts those people
who register as unemployed and claim benefit. A large number of people seeking work
either do not register or do not claim benefit and are now excluded from official figures.
Unemployment rate is the number of unemployed people as a proportion of the labour
force. The labour force is all those with work or all those seeking work.
The unemployment rate is the percentage of the labour force officially jobless. Full
employment occurs when the number of notified job vacancies exceeds the number of
registered people unemployed.
Unemployment Trends
53
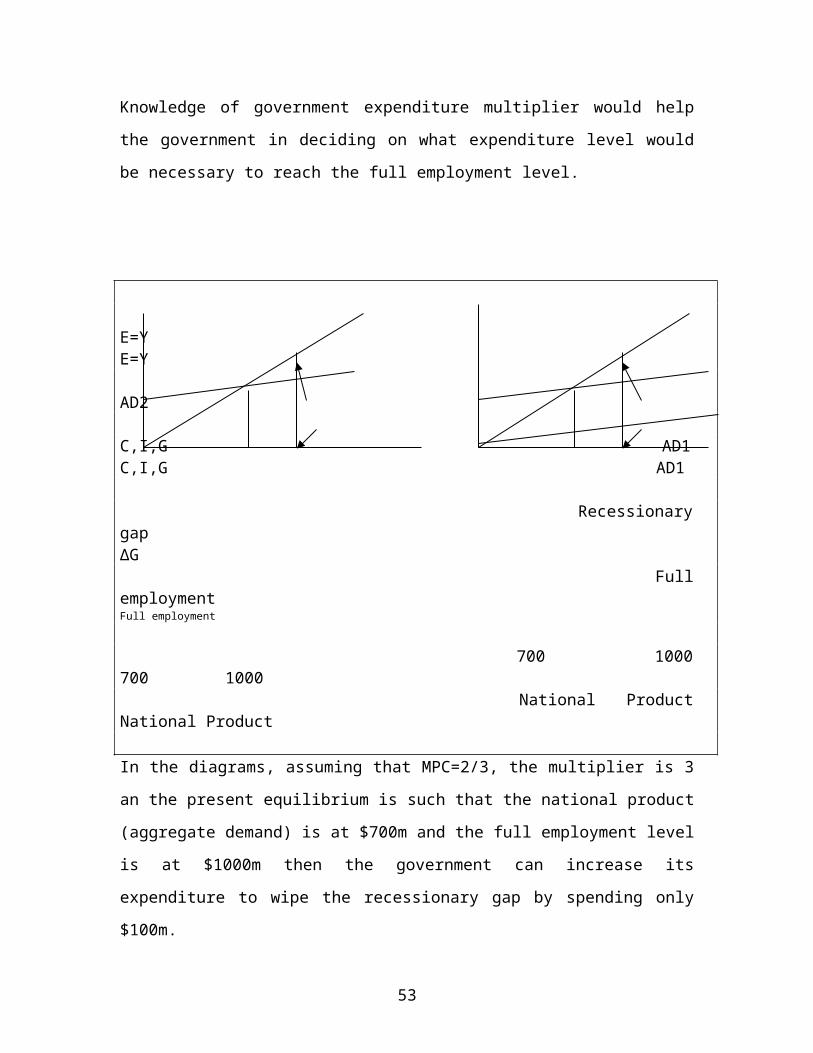
Unemployment is a flow and not a stock. There are always inflows onto the
unemployment register, and there are outflows off the register as people get jobs or join
training schemes.
If all inflows rise and all outflows except training fall then overall unemployment will
rise. Young people, women, the over-fifties and ethnic minorities tend to be the hardest
hit. Inner cities and manufacturing areas also tend to have above-average unemployment.
Natural rate of unemployment
It is that rate which corresponds to macroeconomic equilibrium, in which expected
inflation is equal to its actual level. It is that rate of unemployment to which the economy
will return after a cyclical, recession or boom.
The natural rate of unemployment is sometimes called the “the full employment” rate of
unemployment conveying the sense that unemployment is excessive only when actual
unemployment exceeds the natural level.
We generally refer to the gap between actual unemployment and the natural rate as
cyclical unemployment. In other words, cyclical unemployment is the amount of
unemployment that can be reduced by expansionary macroeconomic policies without
setting off an endless rise in the rate of inflation.
Types of unemployment
We have to differentiate between a few types of unemployment:
1. Cyclical unemployment: if a country has an economical boom then people have jobs,
if there is an economic recession people lose jobs. Cyclical unemployment is
unemployment above the natural rate.
2. Frictional unemployment: This arises because people are always flowing into and out
of unemployment. New workers are constantly entering the labour force, and existing
workers frequently leave one job and look for another. During these transitions they
spend time on their job searches e.g. you stop working in December and start your new
work in March, these period between these months is called frictional unemployment
54
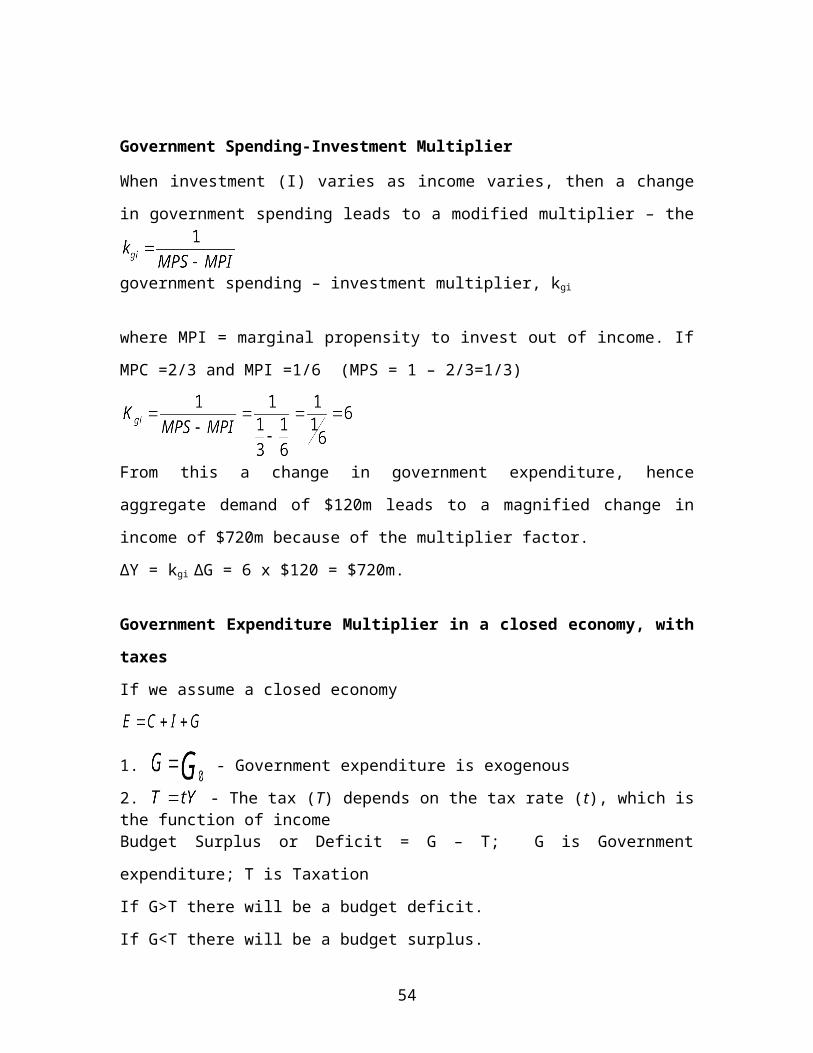
3. Structural unemployment: Structural unemployment can occur in factories when too
old machines, cannot produce enough, sell less products, cannot pay their staff, more
unemployed people. It is unemployment that exists when the economy is operating at the
natural rate. The natural rate of unemployment (Un) reflects many different phenomena
and forces such as union power, which raises real wages above full employment real
wages.
4. Hidden unemployment: dismissed people don’t ask for a new job, they also don’t
register for unemployment benefits, e.g. women after their maternity leave often stay at
home with their children. It can also include the discouraged, those nominally having
jobs for which they are paid but in fact doing nothing; and those who can be withdrawn
from rural areas because of their zero marginal product.
5. Seasonal unemployment: e.g. tourism-areas, construction sector, and agricultural
sector. In the rural areas or farming areas, everyone is fully employed during the rain
season and harvesting periods but thereafter demand for labour is very low. The
unemployment is mostly where there is single cropping
6. Structural Unemployment. This occurs when economic readjustments are not fast
enough during economic growth, so that severe pockets of unemployment occur in areas,
industries and occupations in which the demand for factors of production is falling faster
than is the supply. Policies that discourage movement among regions, industries and
occupations can raise structural unemployment.
7. Technological Unemployment- this comes about as a result of technological change.
Why unemployment is studied
1. The income aspect- income can mostly be earned if one is employed. Most economies
gain from employment of their nationals.
55
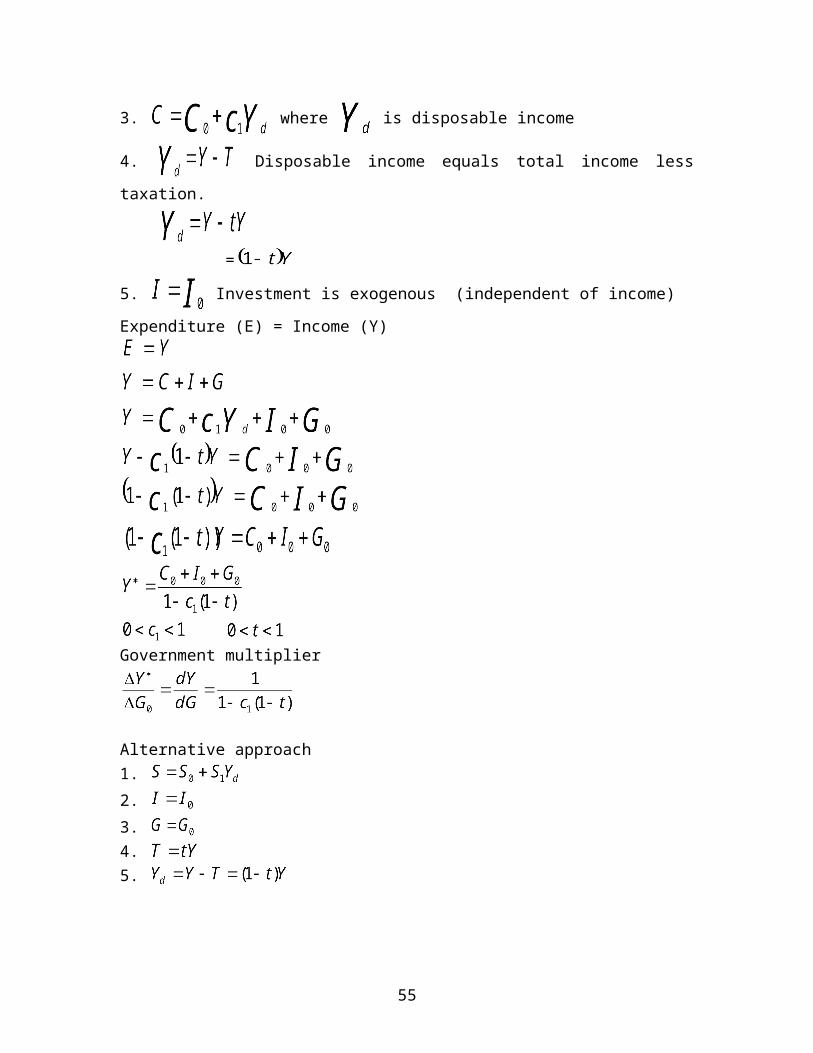
2. The production aspect of employment- concern is on the labour utilisation. If labour is
unemployed there is a waste of productive resources.
3. Recognition aspect- the type of employment determines social status and self-esteem.
Studies found that people who had been unemployed for two or more years had self-
esteem.
Causes of Unemployment
1. Rapid growth of labour forces due to high population growth rate in developing
countries. Fast growth of labour force places a strain on the ability of the economy to
generate new work opportunities on a sufficient scale to absorb rising numbers (economic
dualism and rural- urban migration).
2. Education system also contributes – the size of the educated labour force is growing
more rapidly than the economy can absorb.
3. Shortage of saving and investment- investment per worker in developing countries is
often less than that in developed countries.
4. Inefficient land tenure systems in many developing countries cause them not to be able
to utilise their expanding labour resources.
5. Inappropriate developmemnt strategies they pursued and technologies adopted. They
engaged in import substitution strategies hence limited jobs.
6. Engineering bias, minimum wage laws, government salary structures, influence of
trade unions, pay policies of multinational corporations all help to raise the urban wages
well above competitive market clearing levels.
7. Laws and conventions holding down interest rates, tax concessions for foreign
investors similarly hold the price of capital well below levels which would reflect their
scarcity in the economy.
56

Consequences of unemployment /Costs of Unemployment
Lost OutputThe opportunity cost of each unemployed person is their foregone output. Increased Benefit PaymentsEach extra person who becomes unemployed stops paying tax ( perhaps $4000) and starts
receiving benefit (upwards of $5000). The government therefore has to raise a additional
funds to finance unemployment benefits for unemployed. As the figure falls the
government pays out less unemployment benefits and receives more in tax. The savings
to the exchequer from this will be considerable.
Lost Tax Revenue
Growing unemployment means less direct and indirect tax revenue. When people lose
their jobs they will stop paying income tax, and their spending will fall considerably
reducing government receipts from VAT and other indirect taxes.
Human Costs of Unemployment
The long-term and youth unemployed feel increasingly isolated and removed (alienated)
from society. There will also be increased NHS costs as people's health often suffers
when they are unemployed, and there will be increased costs to society in terms of crime.
In our society where money means success the unemployed feel useless and consider
themselves a failure. Studies have shown that people who have been unemployed for
some time develop a low self esteem.They are dissatisfied and depressed and this may
lead to alcoholism drug problems and homelessness and even to crime.
Especially for families it’s difficult because they do not have enough money to afford
their basics of life. So because of that that government has to help financially, but this
causes high costs for working people who have to support the unemployed.
High risk groups
There are some high-risk groups, for example youths, women with little children after
their maternity leave or elderly people aged 50 and over. Lots of those people cannot find
a (good) job.
57
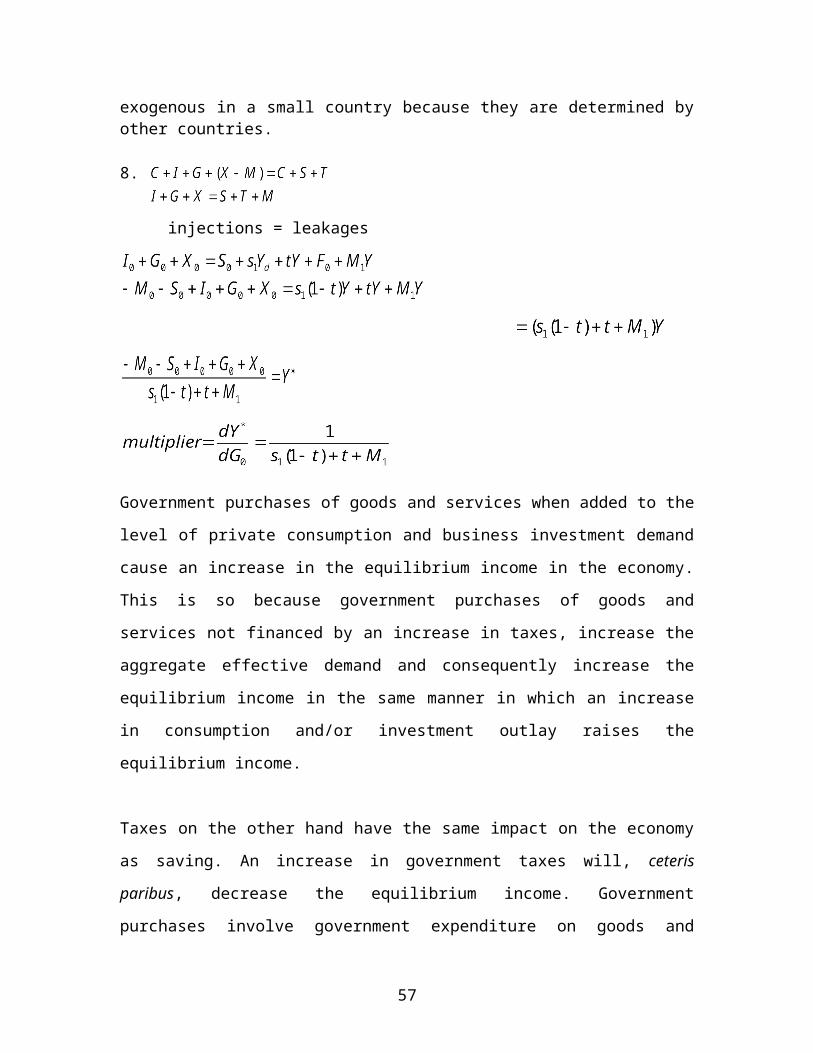
Young people are part of the high-risk group because in most cases they do not have any
practical experience and there are lots of young people searching for the same few jobs.
That is why there is a high selection rate on the job market. Firms want to employ young
people with lots of experience who want to work almost 24 hours a day and earn just a
little pocket money.
Women in general, but especially women with little children who want to work again
after their maternity leave are another high-risk group. Their problem is that the
probability of their needing time off to nurse sick children is very high, especially if they
have little kids. Another problem is that those women have not worked for the time of
their child nursing and there might be new trends, new developments or things like that.
The last high-risk group is the large group of over 50 year old people. Their problem is
that they cost too much. If a firm employs younger workers they do not have to pay as
much as they would for an older person. That is why they are fired. And it is almost
impossible for those people to find a new work place.
Solution of unemployment
Possible solutions:
Early retirement
Job-sharing
New jobs (new economy)
A general reduction of working hours
Reduction of overtime
It is very hard to find good solutions in the long run. Some ideas such as job-sharing or
early retirement are in discussion. But my opinion on that is that both, job-sharing and
early retirement are not the right way because if you share your job you won't earn
enough money to afford the basics of life for your family.
Early retirement sounds nice but it means a huge amount of costs for all the other
working people who have to pay for that. So this cannot be the right way, I suppose.
58
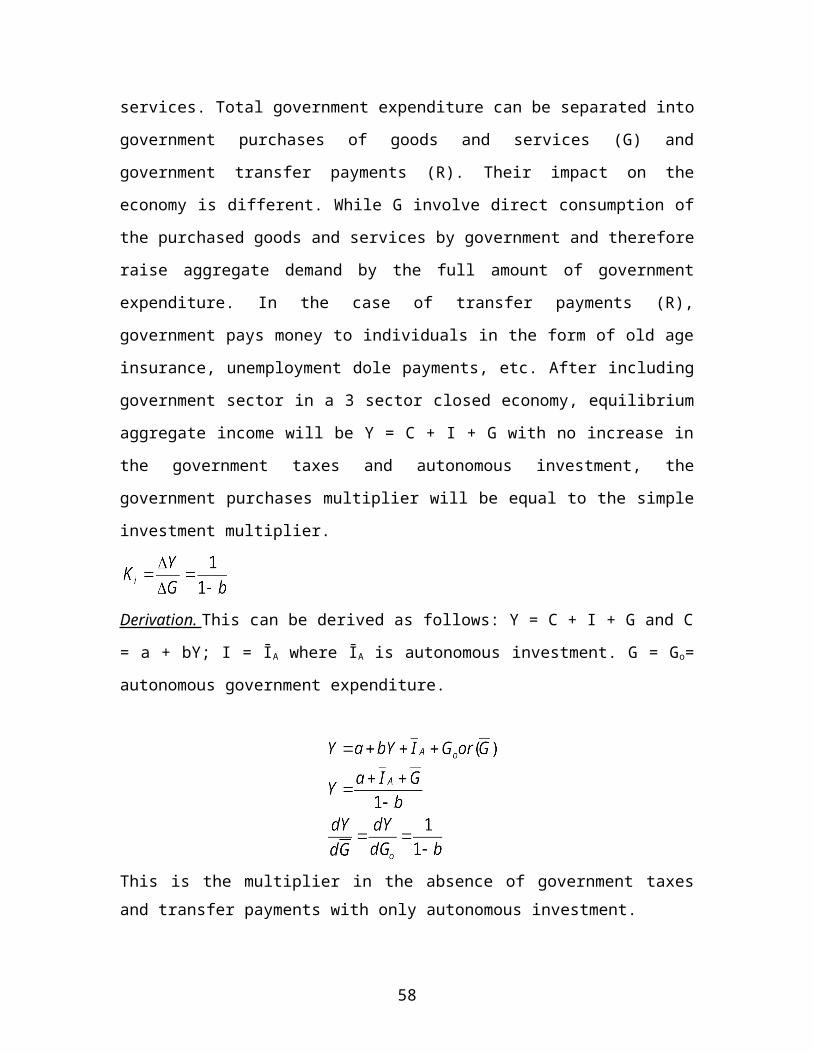
A good solution would be the attendance of further training courses, so that unemployed
people are trained to find a new job and learn new skills. The only problem about that are
the costs, which are very high and the question is who is going to pay them.
Population control- if there is population restraint the growth of developing country
labour force will be in check.
Overhaul of the education systems to change from their present academic, elitist, white-
collar job orientation to vocational and technical training systems to produce artisans and
technicians the countries desperately need.
Sectoral priorities which particularly favour the development of small-scale agriculture
and the informal sector. Small-scale agriculture and the informal sector are labour
intensive, so their development will both generate more employment and raise
productivities of those already working in them.
Incomes policies designed to prevent formal sector wage levels from being raised by
institutional factors to levels well above the true economic value of unskilled labour. This
involves attention to the government‘s own pay policies, its policies towards the trade
unions, towards multinational firms and towards minimum wage legislation.
Rural development and decentralisation- this involves coordination of programmes for
the improvement of agriculture, water, transport; access to goods and services and
appropriate land tenure- aim is to reduce rural- urban migration.
Informal Sector:The development of the sector is attractive because it does not require
complex and expensive infrastructure and has high potential for creating jobs. It uses
mostly locally produced resources or raw materials. It can be a major source of income
generation both for rural and nonagricultural informal sections of the economy. It creates
a platform for the exchange of locally produced goods and services. It provides strong
base for local entrepreneurs. It is also a source of government revenue when these
sectors grow and become registered.
Problems of the informal sector in Zimbabwe
Procedures to be followed in obtaining licences and project approval are discouraging
and they (operatives in the sector) pay high rentals to landlords.
59

Because of the high corporate tax, they would rather remain unregistered. If they are
taxed they face financial problems and hence cannot pay minimum wages.
Lack of adequate transport and infrastructure to facilitate delivery of produce to the
target market.
Lack of technological support and managerial, technical and marketing skills.
Lack of project planning and implementation.
Inability to obtain loan and credit facilities hence due to lack of collateral security,
90% of microenterprises are automatically eliminated from getting financial
assistance.
However it must be pointed out that the development path whereby there is heavy
emphasis on iunformal sector enterprise and small business development has limitations,
although it provides employment and income. The disadvantage of informal enterprise is
it does not lead to development of high technology non traditional export.It does not
invest in new technique, generate new skills and develop new products.
Types, Causes, and Remedies for Unemployment
Table below summarises the main causes and remedies for different types of
unemployment.
The average length of time workers remain unemployed is a critical measure of the
seriousness of the unemployment figures. If the average length of unemployment is short
then the economy will be healthier and people will not lose their skills from long periods
without work.
Employment and training schemes that have been used in the 1980s and 1990s
Scheme Description
Restart Programme Interviews and training for the long-term unemployed
Community
Programme
Local projects for the long-term unemployed
New Workers
Scheme
A subsidy to employers taking on youth unemployed
Job Search Scheme Return fare and allowances for job interviews
60

Job Release Scheme Older workers retire early with an allowance and are replaced by an
unemployed person
Job Splitting Scheme A subsidy to employers who encourage job sharing
Youth Training
Scheme
Two-year work experience and training for school leavers
Job Training Scheme Retraining scheme for unemployed adults
Causes and remedies of unemployment
Type Description Cause Remedy
Frictional Workers temporarily
between jobs
Delays in applying
interviewing and
accepting jobs
Improve job
information, eg
computerised job
centres
Structural Workers have the
wrong skills in the
wrong place
Declining industries
and the immobility of
labour
Subsidies and improve
the mobility of labour
Cyclical All firms need fewer
workers
Low total demand in
the economy
Increased government
spending or lower taxes
Technological Firms replace workers
with machines
Automation and
information
technology
Retraining
International Overseas firms replace
UK producers
High-priced/low-
quality UK goods
Tariffs quotas or
sterling depreciation
Regional High unemployment in
one area
Local concentration of
declining industries
Regional aid, eg
relocation grants
Seasonal Unemployment for part
of the year
Seasonal variation in
demand
Retraining
Voluntary Workers choose to
remain unemployed
More money 'on the
dole' than from
working
Remove the low-paid
from the liability to pay
income tax
CHAPTER FIVE
61

INFLATION
DEFINITIONS
There are several definitions:
(a)This is a persistent rise in the general level of prices or a persistent fall in the
purchasing power of money. The value or purchasing power of money refers to the
amount of goods or services a unit of money can buy. It should be noted that the
definition implies that an increase in some particular price is not inflationary if
compensated by falls in other prices.
(b) Inflation is the general and prolonged rise in the price level.
(c) Inflation can also be defined as to the continual increase in prices.
Inflation means the value of money is falling because prices keep rising.
MEASURES OF INFLATION
(1) Cost of living Index (*COLI)-
also called the retail price index or consumer price index. This is the most frequently
used measure and is based on observations of prices of a ‘basket’ of goods selected as
a representative of the spending patterns of consumers within some specified range of
incomes.
(2) Wholesale price index-
is the index which measures prices of commodities commonly bought and sold by
wholesalers. This index has an advantage over the consumer price index in that it
gives an earlier warning of an upsurge in prices than a retail index. It takes time for a
rise to work its way through to the shops and markets.
(3) The GNP deflator-
This is derived from comparisons of GNP estimates in current prices and in constant
prices. Prices of consumer goods, capital goods etc. are taken into consideration when
compiling this.
Calculating the Retail Price Index
62

The retail price index (RPI) can be used to measure inflation. The retail price index (RPI)
is a monthly survey carried out by the government which measures price changes. The
following procedure is used:
A basket of goods and services consumed by the average family is listed. For example, food, clothing and transport are included in the basket.
The price of items in the basket in the base (first) year is noted.
Each item in the basket is given a number value (weighted) to reflect its importance to the average family. For example, food has a higher weighting than transport.
The price of goods in the basket is recorded every month compared with base year as a percentage (price relative) using the equation:
Price relative = Current price/Base price x 100
The price relative of each item is then multiplied by its weighting.
The new RPI is found using the equation:
RPI = Total weightings x Price relative/Total weightings
The value of the RPI in the base year is always 100. After twelve months the price of good items in the basket may have risen by 25 per cent and that of housing by 20 per cent while the cost of transport is unchanged. Table below shows how the RPI for year two might then be calculated.
The RPI = Total weightings x Price relative/Total weightings = 12 100/100 = 121
Calculation of the retail price index
Basket Weighting Price relative Weightings x price relative
Food 60 125 7500
Housing 30 120 3600
Transport 10 100 1000
Total 100 12100
63
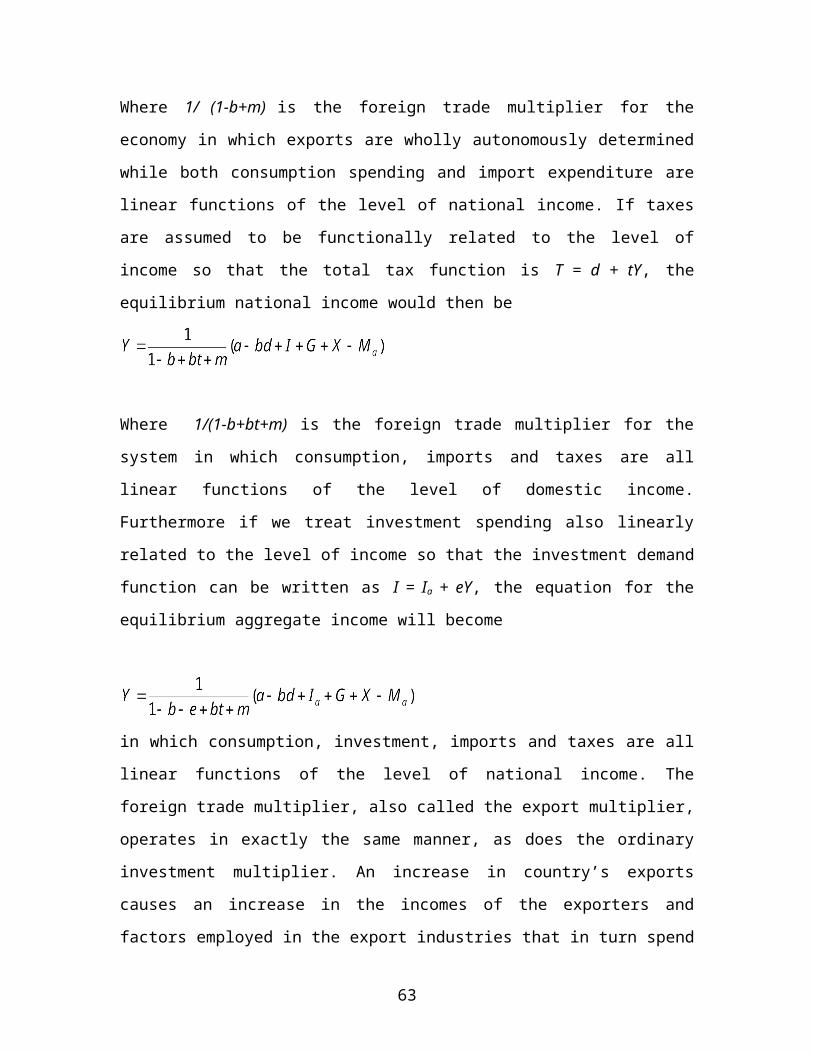
The rate of inflation is the percentage change in the RPI over the last twelve months and
is calculated using the equation:
Rate of inflation = (Current RPI - Last RPI)/Last RPI x 100
At the beginning of year two the rate of inflation is:
(121 - 100)/100 x 100 = 21 per cent
Problems in Using the Retail Price Index The RPI is narrow.
Which items should be included in or excluded from the basket of goods?
Different families have different tastes hence different weightings. How is an average family found?
Not all regions in the country experience identical price changes.
For a while new products ( eg mobile phones) may not be included in the index.
Advantages and Effects of Inflation
Not everyone suffers from inflation. Some parts of society actually benefit:
The government finds that people earn more and so pay more income tax.
Firms are able to increase prices and profits before they pay out higher wages.
Debtors (borrowers) gain because they have use of money now, when its purchasing power is greater.
Disadvantages of Inflation
People on fixed incomes are unable to buy so many goods.
Creditors (savers) lose because the loan will have reduced purchasing power when it is repaid.
Domestic goods may become more expensive than foreign-made products so the balance of payments suffers.
64

Industrial disputes may occur if workers are unable to secure wage increases to restore their standard of living.
CAUSES OF INFLATION
Supply oriented Explanations
These explanations concentrate on the cost push and structuralist theories.
Cost-push InflationCost Push Theory- this ascribes inflation to increases in cost, which are independent of
the state of aggregate demand. For most manufacturers in developing countries, the cost
of imported goods is continuously rising because of world inflation. This both directly
raises the cost of living through higher prices for finished goods imports and indirectly
through more costly imported materials used by domestic producers. In addition, trade
unions may force wages up more rapidly than increases in productivity, raising unit
labour costs. Other groups e.g farmers organizations, may also be strong enough to
prevent their own position from being eroded, and the generally low degree of
competition in modern industrial sector allows manufacturers to pass cost increases on to
consumers perhaps adding an enlarged profit margin for themselves.
Cost-push Inflation occurs when a firm passes on an increase in production costs to the
consumer. The inflationary effect of increased costs can be the result of:
Increased wages, leading to
1. a wage-price spiral, which occurs when price increases spark off a series of wage demands which lead to further price increases and so on;
2. a wage-wage spiral, which occurs when one group of workers receive a wage increase which sparks off a series of wage demands from other workers. Wages may also rise due to the trade unions, which may force the wages to rise. This squeezes profits of firms and they raise price to meet target profits.
Increased import prices which can be the result of:
1. a rise in world prices for imported raw materials;
65
2. a depreciation of the domestic currency.
Increased indirect taxation
Interest rate raises the costs of production and the general price levels. The central bank can respond by tightening money supply, which in itself raises interest rates, which increases costs of production and increases prices.
Pure cost inflation- aggregate demand held constant
With increases in costs, manufacturers shift supply from S1 to S2 toi S3. This implies loss of output, more unemployment, and rise in price level from Py to Px. There is strong union resistance to reduction in wages, cost plus pricing policies of firm selling in oligopolistic and monopolistic markets where prices are determined by costs, not state of demand. The ability to pass increases to the public makes producers less resistant to wage claims and other cost raising pressures.
S3 S2
Px S1
Py
D Qx Qy
Cost Push with Demand Adjustments
In the previous diagram there was increased unemployment, reduction in capacity utilisation and this may not be in the public’s and government’s interest. The government would find itself under pressure to increase aggregate demand enough to prevent output and employment from falling (see diagram below).
66
S3
Pz S2
price S1
D3
Py D2
D1
Qx
In the diagram, for every upward movement in the supply curve, government will induce a compensating increase in total demand (D1 to D3) so as to “validate” the cost increase and prevent output from falling below Qx. The effect is to increase the rate of inflation with price level going up to Pz.
Structuralist Theory of Inflation
This theory postulates that inflation will accompany economic development because of disequilibria created by the structural changes that are necessary to the development process. As the economy develops, incomes rise and as the incomes rise the composition of demand changes and so does the structure of output. There is however no guarantee that the productive structure will prove sufficiently adaptive to the changing composition of demand to avoid the emergence of disequilibria in product markets. Demand is greater than supply in some cases while supply is greater than demand in others. Foreign trade sector will be unable to earn enough foreign exchange to meet the growing import needs of the economy. The foreign exchange scarcities will also tend to push up prices.
Domestic food production lags behind demand. Agricultural production is often inelastic with respect to price. Increased demand will have to result in large price rises before output responds much. Food prices thus tend to move ahead of the general price level. This may induce higher prices in the industrial sector too as trade unions lodge wage claims to protect worker against effects of higher food prices.
Export earnings lag behind import needs because of the slow expansion of world demand for primary products exported by less developed countries. Artificial barriers of
67

developed countries make matters worse. Official aid flows fall far short of filling the gap between export earnings and import requirements.
Import prices join agriculture prices in setting the inflationary pace dragging other prices up behind them. Devaluation of national currency or imposition of import controls both cause price rises. Import substitution strategy also causes inflation. If therefore developments within the economy are balanced, major disequilibria in product markets and on balance of payments may be avoided thus resulting in mild inflation.
Demand-pull Inflation
Demand-pull inflation occurs when there is 'too much money chasing too few goods'
because the demand for current output exceeds supply.
Demand inflation is caused by an excess of aggregate demand for goods and services
over available supplies at a given level of prices. The natural market response to such a
situation is a rise in prices towards a market clearing equilibrium in which once more
D=S. A new equilibrium may not be achieved because of propagating forces which raise
both demand and costs and thus push prices ever higher.
Inflation is not an inevitable outcome of an increase in demand. It all depends on the
price elasticity of supply. If the elasticity is large, a small price increase may call forth a
large increase in output so that the inflation impact is slight.
In the short run, the main determinants of the supply elasticity will be the extent to which
suppliers are operating below productive capacity and the availability of foreign
exchange. If there is much surplus capacity, the principal effect of an increase in demand
will be to induce greater output, rather than to initiate an inflationary spiral. Similarly, if
there is surplus foreign exchange, the effect will be to induce a larger volume of imports.
For the economy as a whole, a large danger of demand inflation is when there is a foreign
exchange constraint and the economy is operating at near full capacity. The possibility of
demand inflation is greater the nearer the economy is to being on its production
possibility frontier.
The monetarist school of inflation (led by Milton Friedman) tries to explain the origins of
demand inflation.. The essence of the monetarist position is that inflation is always and
everywhere a monetary phenomenon. The greater the monetization of the economy the
68

greater the inflation. People whose economic lives are entirely monetized will be more
strongly affected by inflation than those who still meet many of their needs for
themselves.
The consequence of an increase in the supply of money greater than an increase in the
demand for money will be a rise in the demand for products and hence will tend to cause
inflation. People desire the convenience of holding money balance but if they6 desire
they will spend the surplus on goods and services.
Assuming the supply of money is under the control of the state and the demand for
money is a function of the level of real income, the extent of monetization of economic
activity and the net utility of holding money, there will be an increase in demand if real
income goes up. There will be a larger transactions demand for money. Barter
transactions or subsistence production become monetised. The demand for money will
also rise if interest rates on bank deposits go up or if the people expect slower inflation.
NB. Monetarists are not contending that any increase that any increase in the supply of
money is inflationary.
An economy can increase the quantity of money without inflation to extent that it is
growing in real terms, that economic activity is becoming monetised and that the net
utility of money is going up. In particular a rapidly developing economy can absorb more
non-inflationary money supply increases than a stagnant one. As long as money supply is
expanded to meet non-inflationary needs, monetary stringency may retard the pace of
development.
The figure below shows increased demand and increased prices as consumers compete to
buy up goods still available.
69

A major source of inflationary pressure is the government which can print money to buy
goods. The monetarist view of inflation can be stated in the equation:
MV = PT
Where M = the money supply,
V = the number of times each unit of money changes hands (the velocity of circulation),
P - the average price of goods, and
T = the number of goods bought (transactions).
Monetarists believe that the values of V and T are fixed so that any increase in the money
supply , must raise the level of prices (P), and this is inflationary. There is
always an associated price increase with money supply to balance the 2 sides of the
equation.
Remedies of Inflation
There are many ways for businesses, consumers and government to halt or control
inflation. The traditional Keynesian approach is to categorise inflation as being either
demand pull or cost push in nature.
Cost-push Remedies
70

Introduce price and income policies to free price and wage increases. The policies may be statutory or voluntary. Ceiling of wages or salary increases may be set. There may also be interference in the exchange rate system to keep down prices of imported goods. Labour can help fight inflation by also trying to increase productivity and cooperating with management in controlling the wage- price spiral, that is, not setting excessive wage bids. Business can help fight inflation by trying to increase the productivity of workers. This would decrease costs.
Indexation. This consists of periodic and automatic revision of incomes, financial asset values, the exchange rates and other variables so as to compensate for the effects of inflation.
Encourage an appreciation of domestic currency.
Reduce indirect taxation.
Demand-pull Remedies
For the Keynesians, where inflation is demand pull, they advocate demand management
policies:
Reduce government spending ( G).
Increase income tax (T) to reduce consumer spending.
Reduce people’s ability to borrow money by increasing interest rates and tightening credit regulations.
Reduce non-essential government expenditure. (T-G) is the budget deficit which is financed by issuing government paper (treasury bills,money) thereby contributing to the national debt. As G falls so will the deficit.
Control the supply of money. Assuming a direct relationship between the supply of money and aggregate income (Y=f(M)), a reduction in the money supply causes a preferable multiplied reduction in the aggregate demand. Interest rates can be raised to depress capital investment and credit financial consumer purchase. (This of course would have adverse effect if inflation is experienced before full employment is reached.).
Construction should be postponed in so far as feasible because this reduces investment in buildings, machinery and inventories. This reduces aggregate demand.
71

Production should also be geared towards reasonable demand and unnecessary stockpiling of raw materials and semi-finished products should be avoided.
However plausible these suggestions (or solutions) may be flimsy, for government before any economic issue can be decided the political half of the issue must be solved. This often causes government to ignore the economic issues or try to solve it in a roundabout, often unsuccessful manner. The business world is motivated by self interest hence in this situation of inflation, it seems risky to postpone expansion of the production facilities, to keep prices steady and profits low.
The consumer on the other hand is confronted by the savings paradox. He knows that more savings and less consumption would help fight inflation, but it is inflation itself that is preventing the consumer from saving more, by inducing him to spend now rather than later.
Some undesirable effects of Inflation
(1) Unjustified wealth transfers occur from net money creditors to net money debtors.
(2) When union wage contracts do not have inflation escalator clauses, and workers notice an actual decline in their real wages, they may frequently resort to strikes creating social instability.
(3) Assuming a country has fixed rates of exchange and its domestic inflation rate is higher than the inflation rate in the countries with which it is trading, it would be less competitive in the world markets. Its exports would be less and it imports more, leading to balance of payments problems.
(4) Tax revenues of government are automatically increased because inflation pushes income earners into higher tax brackets (where tax system is progressive). This may defeat the economic policy of reaching full employment because total spending decreases automatically.
(5) The usefulness of money as a store of value may be reduced and people will start to use money substitutes and will reduce their money balances and invest more in real assets, like houses, education, automobiles, etc.
(6) The operation of the credit market for example will be less effective by increasing the risk of borrowing and lending.
72

Inflation-does anyone gain?
1. Government- where there is inflation, tax resource will be redistributed in favour of the government budget. Inflation benefits the budget by reducing the real cost of servicing of the debt.
2. Farmers- where food production is relatively inelastic with respect to price.
3. Importers- where a fixed exchange rate is maintained they can raise prices on local sales of imports and get a premium.
Inflation- The losers
1. Creditors.
2. With a fixed exchange rate domestic producers of exports and of imports substitutes will be losers.
4. Consumers of farmers products.
5. Economically inactive groups e.g. housewives.
6. Modern sector wage labour force.
7. Pensioners and others on fixed income.
CAUSES FOR AND AGAINST INFLATION
PROINFLATION CASE
It is argued that inflation is necessary if there is to be growth in the economy. Inflation accompanies growth. It is also argued that inflation redistributes incomes in such a way as to raise saving and investment thus accelerating growth. According to the view, company profits and government budget are likely to benefit from inflation at the expense of consumers especially urban wage labour force. Company profit margins rise and they often reinvest large proportion of increases in profits rather than paying them out to shareholders. Workers on the other hand consume almost all their income.
Government also gains from inflation, it is argued, because of inflation tax on money balance, i.e. on everyone. The public has to forego expenditure on goods and services.
73
The reduction in spending releases real resources in the economy which can then be used for investment.
Some economists advocate for growth with inflation, in the belief that the inflationary trend will be reversed with time.
ANTIGROWTH WITH INFLATION ARGUMENTS
It is argued that inflation penalizes saving because it reduces the purchasing power of income set aside. There is also a high propensity to borrow, as repayments are cheaper.
Investment/planning decisions are difficult under uncertainty, due to inflation. Inflation may lure firms into unproductive investment decisions because their accounts will most probably mislead them about their current profitability. Because depreciation of capital equipment is mainly based on historical costs, during inflationary times, firms tend to underestimate the depreciation and overestimate company profit. Many profits of manufacturing and trading companies in times of rapid inflation are often the result of stock appreciation hence the swollen profits are therefore illusory.
Domestic inflation will raise the cost of producing exports. The profitability of exports declines thereby undermining the balance of payments position of a country.
74
CHAPTER SIX
INTERNATIONAL TRADE
Introduction
Basic condition of the world community is one of mutual interdependence. All countries
of the world rely for their national well being on international trade and payments.
Foreign currency or foreign exchange is used for effecting payments. The rate at which
one country’s currency is exchanged for another. for example Z$1800 / 1Rand is the
exchange.
Exchange Rates
An exchange rate is the price of one currency in terms of another. For Zimbabwe, the
dollar exchange rate means the number of pounds (£) can one dollar ($) buy. The
exchange rate is determined by the supply and demand for dollars) and is $2 per pound in
the diagram below:
Demand for dollars
British want to exchange pounds for dollars for two reasons:
1. To buy Zimbabwean goods and services;
2. To lend or invest in Zimbabwe.
The diagram above shows the number of dollars demanded at each and every exchange
rate. This is the D curve.
75

Supply of DollarsZimbabweans want to exchange dollars for pounds for two reasons:
1. to buy British goods and services;
2. to lend or invest in Britain.
In the diagram above S shows the number of dollars supplied by Zimbabwe at each
exchange rate.
Changes in the Exchange Rate (flexible exchange rate)
A fall in the value of the dollar (depreciation) means one dollar now buys fewer pounds.
The dollar depreciates if Britons demand fewer dollars (shown in the diagram below) or
if Zimbabweans offer more dollars. Zimbabwean exports become cheaper and its imports
become dearer. Hence, a dollar depreciation improves the balance of payments.
A rise in the value of the dollar (appreciation) means one dollar now buys more pounds.
Zimbabwean exports become dearer and its imports become cheaper. Hence a dollar
appreciation worsens the balance of payments.
Benefits of Trade
Participation in the international economy can improve living standards and the rate of
economic development. This is in 3 ways:
1. Trade provides countries with an escape from confines of their national
economies. It creates more profitable investment opportunities and this leads to
accelerated growth.
76

2. By giving access to the products of other nations, it avoids the need to strive for
self sufficiency within national boundaries- technology developed elsewhere is
available.
3. Capital flows, an integral feature of world trade and payments give developing
countries access to the savings of richer nations, to augment their own. Capital is
obtainable from private sources as well as from ‘aid’ from foreign governments
and agencies eg. World Bank.
Reasons for Trade
Domestic Non-availability
International trade is the exchange of goods and services between countries. An import is
the Zimbabwean purchase of a good or service made overseas. An export is the sale of a
Zimbabwean-made good or service overseas.
A nation trades because it lacks the raw materials, climate, specialist labour, capital or
technology needed to manufacture a particular good. Trade allows a greater variety of
goods and services.
Principle of Comparative Advantage
The principle of comparative advantage states that countries will benefit by
concentrating on the production of those goods in which they have a relative advantage.
For instance, France has the climate and the expertise to produce better wine than Brazil.
Brazil is better able to produce coffee than France. Each country benefits by specialising
in the good it is most suited to making.
France then creates a surplus of wine which it can trade for surplus Brazilian coffee.
Protectionism
Advantages of Protectionism
Protectionism occurs when one country reduces the level of its imports because of:
77

Infant industries. If sunrise firms producing new-technology goods (eg computers) are to survive against established foreign producers then temporary tariffs or quotas may be needed.
Unfair competition. Foreign firms may receive subsidies or other government benefits. They may be dumping (selling goods abroad at below cost price to capture a market).
Balance of payments. Reducing imports improves the balance of trade.
Strategic industries. To protect the manufacture of essential goods.
Declining industries. To protect declining industries from creating further structural unemployment.
Disadvantages of Protectionism
Prevents countries enjoying the full benefits of international specialization and trade.
Invites retaliation from foreign governments.
Protects inefficient home industries from foreign competition. Consumers pay more for inferior produce.
Protection Methods
Methods of trade restriction
TariffsFor every unit of import a charge is put and this fixed amount for every unit of import is
the tariff. Tariffs (import duties) are surcharges on the price of imports. The diagram
below uses a supply-and-demand graph to illustrate the effect of a tariff.
78

Note that the tariff
raises the price of the import;
reduces the demand for imports;
encourages demand for home-produced substitutes;
raises revenue for the government.
A tariff can be specific or advalorem. A specific tariff is a fixed amount for every amount of imports. An advalorem tariff is the charge per value of import.
Quotas
Quotas restrict the actual quantity of an import allowed into a country. Note that a quota:
raises the price of imports;
reduces the volume of imports;
encourages demand for domestically made substitutes.
A quota is a non tariff restriction. Another example of a non tariff restriction is an embargo. An embargo is a complete ban on imports.
79
Other Protection Techniques
1. Administrative practices can discriminate against imports through customs delays or setting specifications met by domestic, but not foreign, producers.
2. Exchange controls (currency restrictions) prevent domestic residents from acquiring sufficient foreign currency to pay for imports.
3. Prior to imports deposits . Before you import you are supposed to put aside an import value. This reduces the amount of import.
4. Technical specifications on imported goods . The government put standards on the goods imported causing rejection of some.
80

CHAPTER SEVEN
BALANCE OF PAYMENTS
Definition of the Balance of Payments
1. Is a systematic record of the economic transactions between residents of the exporting
country and residents of the foreign countries during a certain period of time or
2. Is the difference between the total earnings on both invisible and visible items and total
expenses. In order to know the position as regards international payments, government
compile records of transactions. This record of transactions is thus called the Balance of
Payments (BOP).
3 The balance of payments is a record of one country's trade dealings with the rest of the
world. Any transaction involving Zimbabwean and foreign citizens is calculated in
dollars
Dealings which result in money entering the country are credit (plus) items while
transactions which lead to money leaving the country are debit (minus) items.
Components of the Balance Of Payments
The balance of payments can be split up into three sections:
1. the current account which deal with international trade in goods and services;
2. transactions in assets and liabilities which deals with overseas flows of money from international investments and loans;
3. Monetary Account which deals with foreign currency reserves and transactions with multilateral bodies.
Current Account
The current account consists of international dealings in goods (visible trade) and
services (invisible trade). It records all transactions in goods and services, ie. visibles and
invisibles. Receipt of interest , profits and dividends on loans and investments in foreign
countries; earnings from tourism and transportation and remittances home of income
earned by nationals working abroad are included in this account as invisibles.
81
Example of current account 1985
Debits $m Credits $m Balance £m
Visible imports 80 140 Visible exports 78 072 -2 068
Invisible imports 75 007 Invisible exports 80 027 5020
By referring to above table you can see that in 1985:
Zimbabwe bought $80 140 million worth of goods made overseas.
Zimbabwe sold $78 072 million worth of goods overseas.
The difference between visible exports and imports is known as the balance of trade or visible balance. The amounted to -$2 068 million.
Zimbabwe bought $75 007 million worth of foreign-produced services.
Zimbabwe sold $80 027 million worth of services overseas.
The difference between invisible exports and imports is called the invisible balance. This amounted to $5 020 million.
Adding the balance of trade and balance on invisibles together gives the balance on the
current account. A deficit on the current account means that more goods and services
have been imported into the country than have been sold abroad. A surplus on the current
account means more goods and services have been exported than imported.
Transactions in Assets and Liabilities/ Capital account
The transactions in assets and liabilities section of the balance of payments shows all
movements of money in and out of the country for investment. This may be direct
investment - investment in productive capacity (when firms invest in other countries to
increase capital in these countries), or portfolio investment - investment in shares ,bonds
or other assets in foreign countries. Changes in assets will be outflows from Zimbabwe,
as Zimbabwean investors invest money overseas. These flows will be debits to the
Zimbabwe’s Balance of Payments. Changes in liabilities will be credits to the
Zimbabwean Balance of Payments as overseas investors invest money into the country
(Zimbabwe)
Monetary Account
82

This is also called the official financing account. It records changes in the country’s
official foreign currency/exchange reserves (consisting usually of a mixture of gold and
foreign currencies) plus transactions with the IMF and other financial institutions.
Balance of Payments Problems
Balance of payments deficit
This is of concern especially in developing countries because it affects the ability of those
countries to trade with other countries. A balance of payments deficit is a major problem
if it is persistent. This can be the result of excessive purchases of foreign goods and
services or excessive Zimbabwean investment overseas. Faced with existing or projected
balance of payments deficits on the combined current and capital accounts a variety of
policy options are available:
Correcting a Balance of Payments Deficit
1. Long term capital from the rest of the world. This has the disadvantage of external
indebtedness.
2. Using foreign currency reserves- this is a short term measure because most non-oil
producing developing countries have very few months in which to exhaust this.
3. Attracting additional inflows of short-term capital by raising interest rates. Lack of
stability in developing countries means that there is no guarantee funds will remain in the
countries, i.e. there is capital flight.
4. Import substitution- this is the local production of previously imported goods. This
requires the importation of capital equipment and protection of the infant industry by
imposing tariffs or bans on imported goods.
5. Exchange control – this is designed to control foreign currency reserves. The foreign
currency is rationed so that the most pressing needs of the country will be given top
priority when the funds are allocated., eg. capital goods and essential raw materials.
Measures also include import licensing as well as creating a state monopoly tasked to
import essentials.
83

6. Use of multiple exchange rates- different rates for currencies/ transactions. Essentials
such as exports, tourism and essential inputs for industry would have a separate rate(s) of
exchange to encourage them while for nonessentials they would be discriminatory . In
other words there is a multi-tiered market for foreign exchange.
7. Disguised depreciation- this is a policy whereby there is a deliberate effort by
government to make imports more expensive. This includes raising import duties, taxing
invisibles, taxing remittances abroad, subsidise exports, charging high fees on sales of
foreign currency. This policy is deflationary and also has loopholes.
8. Devaluation- reducing the external value of a currency. This increases the volume of
sales abroad.
9. Promoting ting export expansion- drawbacks of duty, export incentive schemes.
10. Encouraging more private investment and seeking more foreign assistance. Much of
the foreign aid comes in the form of loans which have to serviced. Interest has to be
paid on the loans. The principal has also to be repaid in future.
Balance of Payments Surplus
This is also a cause for concern because if it is persistent, partners may retaliate by
introducing import controls etc. A surplus implies an overvaluation of currency and this
leads to exports becoming less competitive on the world market. It could also be
inflationary because , it is argued by monetarists that it leads to an increase in money
supply. A persistent surplus could mean a depression of domestic living standards.
Correcting a Balance of Payments Surplus
An unwanted balance of payments surplus can be the result of excessive foreign
investment in Zimbabwe. This will place a future strain on the invisible balance. A
reduction in interest rates ( an outflow of funds on the capital account) or the scrapping of
protectionist measures (restrictive exchange controls) will correct the surplus.
84
CHAPTER EIGHT
ECONOMIC GROWTH
Definition
Economic growth refers to an increase in a country's ability to produce goods and
services. The advantage of economic growth is that an increase in real national income
allows more goods for consumption or for investment.
It is also defined as “a long term rise in capacity to supply increasingly diverse economic
goods to its population, this growing capacity based on advancing technology and the
institutional and ideological adjustments that it demands.” by Professor Kuznets. From
this definition advancing technology provides the basis or preconditions for continuous
economic growth.
Measurement of Economic Growth
It can be measured by the change in GDP or GNP over time. It can be measured at
current prices, also called nominal GDP (GNP). Real GDP is at constant prices. The best
indicator of growth is real GDP per capita.
Factors affecting Economic growth
1. Capital accumulation i.e. Accumulation of machinery, equipment and
tools etc. These lead to increased capacity of plants. Capital accumulation
also includes investment in human resources.
2. Population and labour force growth- a larger labourforce means more
productive manpower while a larger overall population increases the
potential size of domestic markets. The growing supply will have a
positive impact if the economic system can absorb and productively
employ these added workers.
3. Technological progress- this is the most important source of economic
growth. In its simplest form technological progress can be said to result
from new and improved ways of accomplishing traditional tasks. The
productive resources, if used efficiently can increase economic growth.
85

4. Weather. Because of the importance of rain-fed agriculture and agro-
industry in certain countries such as Zimbabwe, weather is also an
important determinant of economic growth in the medium term.
Developing Countries
A developing country or less developed country (LDC) is one that is not yet fully
industrialised and tends to have the following features:
Agriculture is more important than manufacturing.
There is limited specialisation and exchange.
There are not enough savings to finance investment.
Population is expanding too rapidly for available resources. Population growth is equal to or more than the rate of GNP growth in some countries. There are high and rising levels of unemployment and underemployment.
There are low incomes. In the income distribution, the gap between the rich and poor is generally greater in less developed than in developed countries.
Inadequate housing.
There are low levels of productivity. This may be due to the absence or severe lack of complementary factor inputs such as physical capital and or experienced management.
In education there are low levels of literacy, significant school dropout rates, inadequate and often irrelevant curricula and facilities.
There is poor health. Most LDC people suffer from malnutrition and ill-health and high infant mortality and have a lower life expectancy than in developed countries (DCs)
A low standard of living. A large portion of the population is living below the Poverty Datum Line.
A developed country is more fully industrialised and has a high standard of living.
Barriers to Economic Growth
86

A country can increase production if it increases the amount of resources used or makes
better use of existing factors. Economic growth is more difficult if:
A country lacks the infrastructure (underlying capital) to produce goods more efficiently. There are three types of infrastructure:
1. basic including electricity, road and telephone networks;
2. social including schools, hospitals and housing;
3. industrial including factories and offices.
A country lacks the machines or skilled labour needed to manufacture modern goods or services.
A country lacks the technical knowledge.
Workers are not prepared to accept specialisation and the division of labour.
Population growth is too rapid.
A country has too large a foreign debt.
Disadvantages of Economic Growth
Increased noise, congestion and pollution.
Towns and cities may become overcrowded.
Extra machines can be produced only by using resources currently involved in making consumer goods.
A traditional way of life may be lost.
People may experience increased anxiety and stress.
ECONOMIC DEVELOPMENT“is a multidimensional process involving the reorganization and reorientation of the
entire economic and social systems. In addition to improvements in incomes and output,
it typically involves radical changes in institutional, social and administrative structures
as well as in popular attitudes and sometimes even customs and beliefs” (Michael
Todaro- Economics for a Developing world.)
87
Economic development is also defined in terms of the reduction or elimination of
poverty, inequality and unemployment within the context of a growing economy.
Development must have the objectives of -: increasing the availability and wider
distribution of basic- food, shelter, health and protection; raising the levels of living
(higher incomes, higher employment, better education and increased attention to cultural
values).
Indicators of Economic Development.
The traditional view of economic development is GNP is an index of development.
Another common economic index of development is the use of rates of growth of per
capita GNP. Rapid industrialization was viewed as a way of having an increasing GNP,
this often at the expense of agriculture and rural areas – these were to benefit through the
“trickle down effect”.
Obstacles to Economic Development in developing countries
Overpopulation- high population growth.
Low savings rate- has hampered industrial development.
Limited range of exports.
Urbanization- this compounds population problems through congestion.
Overcrowding promotes pollution, unemployment, disease and food shortages.
Lack of an infrastructure. Because LDCs generally do not have infrastructures,
industrial firms will not normally locate plants there. Products manufactured for mass
consumption simply cannot be distributed and used without transportation and
communication facilities- few schools, roads, dams and bridges.
Solutions for Economic Underdevelopment
Foreign aid
Exportation of a major resource e.g. oil.
Industrialization and protective tariffs and quotas.
Industrialization and the export of manufactured goods.
88