1h nmr urine metabolomics is an effective prognostic
TRANSCRIPT

Vol. 4(1) pp. 1-21, October 2020
DOI: 10.5897/JMSB2020.0023
Article Number: BC1C04564954
Copyright ©2020
Author(s) retain the copyright of this article
http://www.academicjournals.org/JMSB
Journal of Metabolomics and Systems
Biology
Full Length Research Paper
1H NMR urine metabolomics is an effective prognostic
indicator in acute spinal cord injury (ASCI): A prospective case-control study
Alka Singh1, Rajeshwar Nath Srivastava1*, Tanushri Chatterji5, Suruchi Singh4, Lavini Raj1, Abbas Ali Mahdi2, Ravindra Kumar Garg3 and Raja Roy4*
1Department of Orthopaedic Surgery, King George’s Medical University (KGMU), Shahmina Road, Chowk, Lucknow,
Uttar Pradesh, India. 2Department of Biochemistry, King George’s Medical University (KGMU), Shahmina Road, Chowk, Lucknow, Uttar
Pradesh, India. 3Department of Neurology, King George’s Medical University (KGMU), Shahmina Road, Chowk, Lucknow, Uttar
Pradesh, India. 4Centre of Biomedical Research, formerly Centre of Biomedical Magnetic Resonance (CBMR), Sanjay Gandhi
Postgraduate Institute of Medical Sciences Campus, Rae Bareli Road, Lucknow, Uttar Pradesh, India. 5Department of Microbiology, Dr. Ram Manohar Lohia Institute of Medical Sciences (RMLIMS), Vibhuti Khand, Gomti
Nagar, Lucknow, Uttar Pradesh, India.
Received 15 January, 2020; Accepted 26 August, 2020
Acute spinal cord injury (ASCI) is an extremely overwhelming disease with high morbidity and mortality. Despite significant successes in understanding the pathophysiology of ASCI, little is known about limiting neurological damage and predicting recovery. Biofluid metabolomics by
1H NMR
spectroscopy for metabolites quantification specific to nervous tissue injury may determine the injury and progression. This study evaluates the urinary metabolic profile in ASCI cases on two different treatment modalities. One forty participants were enrolled. Group-1, “healthy control, n=70”, ASCI cases in Group-2 “fixation with stem cells therapy, n=35” and ASCI cases in Group-3, “fixation alone n=35”. Urine samples were collected at baseline and regular follow-ups up to the 6
th month for
1H NMR
spectroscopy. The sample spectra were subjected to multivariate Orthogonal Partial Least Square Discriminant Analysis (OPLS-DA) and Variable Importance to the Projection (VIP) analysis. The significant metabolites were correlated with neurological recovery. Acetate, creatinine, creatine, creatine phosphate, urea, and phenylalanine were found to be significant. The 3D scattered score plots in OPLS-DA represented the shifting of cases towards control in the final follow-up. It was further substantiated on VIP score plots. The metabolic aberrations in urine with disease severity in ASCI could be a potential biomarker of neurological recovery. Key words: NMR spectroscopy, metabolomics, acute spinal cord injury (ASCI), Asia impairment scale (AIS), neurological recovery.

2 J. Metabolomics Syst. Biol. INTRODUCTION Acute spinal cord injury (ASCI) is an overwhelming, extremely complex disease with high morbidity and mortality. Initial primary injury causes an irreversible impact on neural tissues, while secondary mechanisms through ischemia, hypoxia, free-radical damage, and excitotoxicity direct the future progression of injury (Kaur and Sharma, 2018). A multitude of pathological cascades and biochemical reactions involving inflammatory, immune-mediated, and endocrine turbulences govern the disease process in ASCI (Varma et al., 2013). It is primarily an incurable disease resulting in residual paralysis and disability with a worldwide incidence of 40-80 cases per million populations (Srivastava et al., 2015).
Although the pathophysiology of ASCI is better understood now, only limited success has been achieved in restoring the disability produced. Even modern treatment strategies provide marginal recovery in neurologic outcomes. Whereas the objective assessment of the neurological status, following primary insult and thereafter can be very well documented by the American Spinal Injury Association Impairment Scale (AIS), it’s validation at the biochemical and/or molecular level has not been done (Roberts et al., 2017, Schuld et al., 2016) Further, no major advancement has occurred in foretelling the expected neurological improvement in these subjects at any given time following ASCI. Newer scientific discoveries are being explored for identifying factors or biomarkers that could be potential predictors of neurological recovery in Spinal cord injury (SCI).
Animal studies have suggested that Magnetic Resonance (MR) spectroscopy is a thoughtful device, for recording spatial and temporal alterations of metabolic status in vivo in the spinal cord after SCI (Wu et al., 2016, Peng et al., 2014). Similar metabolomic studies on ASCI human subjects might provide a window of opportunities, but its analysis is challenging and requires a high volume, real-time analytical method.
1H NMR spectroscopy has
made it possible to study metabolomics in biofluids like the serum, urine, and cerebrospinal fluid (CSF) following ASCI. Monitoring of these and testing their validity for determining severity and as a predictor of neurological recovery could be a milestone in providing potential biomarkers (Singh et al., 2018, Chatterji et al., 2016)
Metabolomic studies most often focus on biofluids like blood or CSF in the case of spinal cord diseases. Although urine metabolomics is relatively unpopular, certain studies on diseases other than SCI have been done involving urine metabolites in animals as well as in humans. Recently, a study was conducted which involved
urine metabolomics for differentiating bacterial and tubercular meningitis (Chatterji et al., 2016).
Metabolites in serum as a monitoring tool for determining the severity of ASCI subjects have earlier been explored. It was a pilot study with serum proton Nuclear magnetic resonance (NMR) spectroscopic metabolic profiling wherein we found encouraging results. In this, seven metabolites were found significant amongst fifteen quantified. These seven were mainly ketone bodies and amino acids (Singh et al., 2018). Only a few animal studies have targeted their approach to urine metabolic profiling following spinal injury. Until now, no study has targeted its approach to metabolic profiling of urine in ASCI in humans. An excellent review to standardize the experiment using urine for NMR spectroscopy-based metabolomics studies already exists (Emwas et al., 2016). The quantification of metabolites in urine is therefore capable of establishing a networking map in urine samples of ASCI subjects. Based on the above hypothesis, the study was designed in ASCI cases on urinary metabolic perturbations and its follow-ups in different modalities of treatment. This is probably the 1
st
metabolomics research undertaken upon human ASCI subjects on metabolic profiling of urine through
1H NMR
spectroscopy.
MATERIALS AND METHODS The prospective case-control study was conducted in the SCI unit of the Department of Orthopaedic Surgery, KGMU in collaboration with the CBMR, SGPGIMS campus, Lucknow, India between years 2013 to 2017. The study was ethically approved under the guidelines of the Stem Cell Ethics Committee (02/ISCES-12) and Institutional Ethical Committee (IEC 60
TH ECM II-B/ P14) of KGMU,
Lucknow, India. Study target population primarily hailed from Northern India and Nepal. ASCI subjects in the age group of 18 to 65 years of either gender having thoracolumbar lesion sustained within 6 weeks of SCI were recruited as cases. All enrolled ASCI cases with the complete lesion (AIS-A grade) with a TLISS score ≥4 (Thoracolumbar Injury Severity Scale and Score). All the cases being unstable injuries (TLISS score ≥4) required posterior instrumentation by the pedicle screw - rod system (Chen et al., 2015). ASCI subjects having associated injuries such as thoracic, abdominal, and/or head injury or those not willing to participate were excluded from the study. Age, gender matched healthy subjects (controls) were amongst the relatives of the enrolled cases, having no known co-morbidity, and willing to participate in the study. Details of study and protocol were explained to the participants in their native language and consent was obtained from each enrolled participant.
Study protocol
One hundred and forty participants were enrolled. Healthy controls
*Corresponding author. E-mail: [email protected], [email protected]. Tel: +91-9415054330.
Author(s) agree that this article remain permanently open access under the terms of the Creative Commons Attribution
License 4.0 International License

were Group 1, n=70, and ASCI subjects n=70 were segregated into 2 groups on the basis of the treatment strategy. Group 2, n=35 were "fixation with stem cell therapy" and received conventional therapy (Posterior instrumentation) with augmentation (autologous bone marrow-derived mononuclear cells {BM-MNCs}). Group 3 (n=35) was “fixation alone" and managed by the conventional method only (posterior instrumentation). The urine samples were taken at the time of admission (baseline), after surgery (6
th week)
and at 3rd
and 6th-month follow-up. 3 ml of overnight fasting urine
sample of all the participants were collected using a standard protocol and immediately snap-frozen in liquid nitrogen (containing 3 mg of NaN3). Samples were stored in sterile cryovials at -80°C until NMR experimentations were performed (Chatterji et al., 2016; Beckonert et al., 2007; Emwas et al., 2015). The urine samples of five ASCI subjects were detected as contaminated thus excluded and finally, urine samples of n=31 in group 2 and n=34 in group 3 were analyzed. In multivariate analysis, two outliers in group 2 at 6
th
week and 6th month and one outlier in group 1 at baseline and 3
rd
month were identified and excluded.
Sample size
The sample size of 106 was calculated as per Daniel (1999) suggested formula (Singh et al., 2018, Daniel,1999):
N= 4 Z
2 P (1-P) / d
2
N = Sample size, P = Prevalence, = Error, d = Degree of
freedom; Z/2 = Differentiation coefficient (1.96 or 2) and P = 6%; 1-
P = 1- 06 = 0.94; Z/2 = 1.96 (Value of standard normal valuable at 5%); d = 10%; N = 2×1.96×1.96×0.06× (1-0.06) / (0.1)
2 =0.4333 /
(0.1)2 = 43.33~44; Assuming 20% loss of follow-up = 8.8~9 = 44+ 9
= 53 The total sample size required for this study was 106 (53 as
cases and 53 controls).
Posterior instrumentation, stem cell isolation, preparation and infusion in ASCI cases
The surgical technique utilized for treatment in cases in group 2 and group 3 were kept as uniform as possible. The procedure used was the traditional posterior instrumentation with titanium pedicle screws and rod system.
Autologous Bone marrow (BM) aspiration for stem cell isolation was performed under general anesthesia in subjects of group 2 before spinal surgery. One hundred and twenty mililiter of BM was aspirated using a BM aspiration needle. Differential centrifugation was performed to isolate a suspension of 10 ml MNCs rich in stem cells (Singh et al., 2018, Srivastava et al.,2015)
An automated cell counter was used for characterization and validation of the
stem cells to ensure their quality and potency with
the use of CD34+ markers, the aliveness of the cell and their numbers. At the site of injury, the prepared MNC suspension was infused using an epidermal catheter and an infusion pump in the postoperative room (Singh et al.,2018; Srivastava et al., 2015). During the surgery itself, all the steps of isolation, purification, and infusion of stem cells were done.
NMR experimental conditions and analysis
Stored samples of urine were thawed for NMR acquisition. Phosphate buffer was mixed in the urine samples for maintaining
Singh et al. 3 the pH 7.4 (Chatterji et al., 2016; Beckonert et al., 2007). In the study, Bruker Biospin Avance III 800 MHz NMR (Bruker GmBH) spectrometer was used for NMR experiments equipped with a 5 mm Triple resonance inverse (TCI) 1H/13C/15N cryoprobe with a Z-shielded gradient and a standard vertical bore, operating at a proton frequency of 800.21 MHz (18.8 T). Urine samples
1H NMR
spectra were recorded using water suppression pulse sequence 1D NOESY gradient-preset with water irradiation during a relaxation delay of 4s and mixing time of 10 mins. Other parameters were: Spectral width 16,447.4 Hz, time-domain data points 64 K, acquisition time 1.99s, and the number of scans 128 with dummy scans 4. This results in a total acquisition time of 13 min 17s per sample. All the spectra were processed by applying a line broadening of 0.3 Hz to the FID before Fourier Transformation using TOPSPIN 3.1.
Statistical analysis
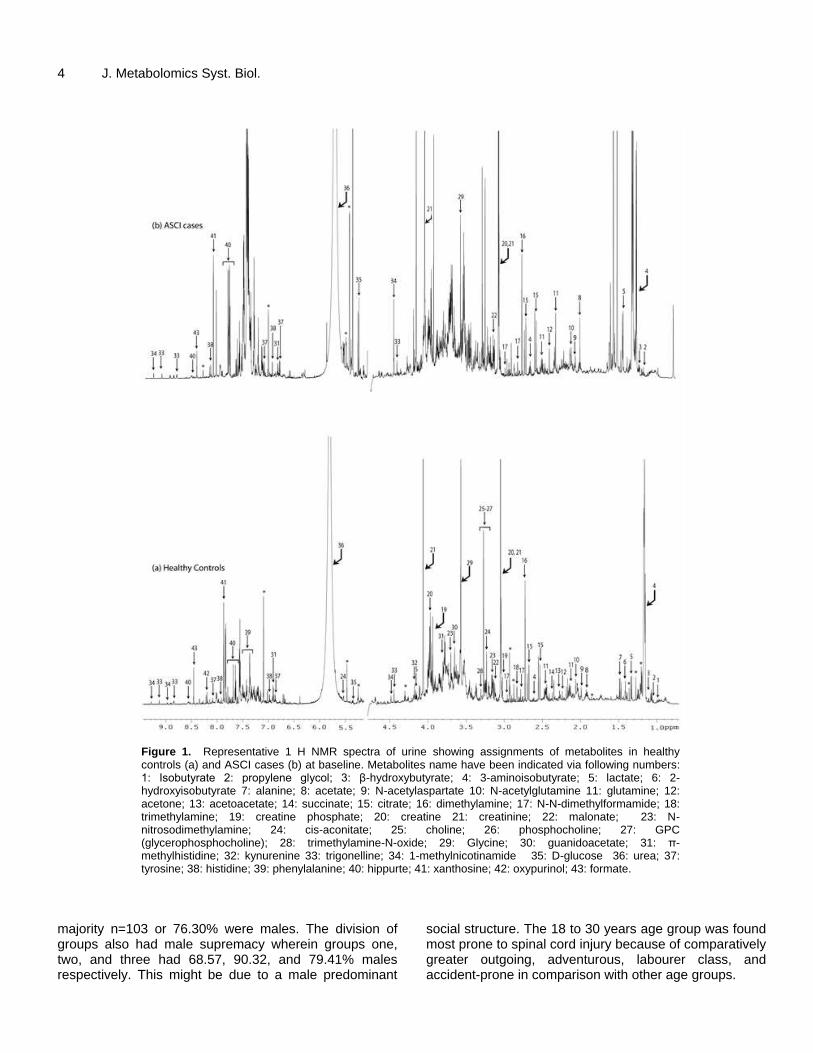
In the urine samples spectra, forty-three metabolites were recorded and quantified (Figures 1 and 2 and Supplementary Figure S1). The recorded
1H NMR spectra of urine samples were subjected to
multivariate analysis after phasing, baseline correction, and alignment. Chemical shift regions in spectra between 0.7 and 9.45 ppm were identified for urine (excluding water region 4.74 to 5.20 ppm) by digitization and binned in 0.01 ppm bucket using Amix software (version 3.8.7, Bruker Biospin, Germany). Bucket data was utilized for the integration of peak areas by scaling to the sum of its total intensity. Normalized buckets along with resulting data matrices were exported to Microsoft Excel 2007 (Microsoft Corporation, USA) and then to ‘The Unscrambler’ software package (Version 10.0.1, Camo ASA, Norway) for unsupervised multivariate Principal component analysis (PCA) and supervised Partial least square discriminant analysis (PLS-DA). The protocol of full cross-validation was used for the generation of the statistical model(s) of orthogonal signal correction-principal component analysis (OSC-PCA) and orthogonal partial least square discriminant analysis (OPLS-DA). OSC-PCA followed by OPLS-DA, demonstrated the explained total variance and R
2 and Q
2 values. OPLS-DA model
and its robustness were validated by variable importance on projection (VIP score). Hence, validation was performed based on the VIP score of the metabolites which were evaluated online through the website, "www.metaboanalyst.ca".
Statistical Package for Social Sciences (SPSS) version 16.0 was used for demographic data analysis. Paired t-test was used to compare motor and sensory scores at baseline, 6
th week, 3
rd and 6
th
months of follow-up in terms of mean and standard deviation (mean ± SD) with 95% confidence interval (CI) at the level of significance 5%. Both ASCI groups were compared with each other using student t-test analysis to evaluate the mean ± SD with 95% CI and related p values of motor and sensory scores after baseline (at 6
th
week, 3rd
and 6th month).
Outcome measures for neurological recovery
ASCI subject’s recoveries were measured in the terms of clinical improvement in sensory, motor scores of ASIA scale, and improvement in AIS grades.
RESULTS
Demographic and epidemiological information
Gender analysis revealed that out of 135 participants,
4 J. Metabolomics Syst. Biol.
Figure 1. Representative 1 H NMR spectra of urine showing assignments of metabolites in healthy controls (a) and ASCI cases (b) at baseline. Metabolites name have been indicated via following numbers: 1: Isobutyrate 2: propylene glycol; 3: β-hydroxybutyrate; 4: 3-aminoisobutyrate; 5: lactate; 6: 2-hydroxyisobutyrate 7: alanine; 8: acetate; 9: N-acetylaspartate 10: N-acetylglutamine 11: glutamine; 12: acetone; 13: acetoacetate; 14: succinate; 15: citrate; 16: dimethylamine; 17: N-N-dimethylformamide; 18: trimethylamine; 19: creatine phosphate; 20: creatine 21: creatinine; 22: malonate; 23: N-nitrosodimethylamine; 24: cis-aconitate; 25: choline; 26: phosphocholine; 27: GPC (glycerophosphocholine); 28: trimethylamine-N-oxide; 29: Glycine; 30: guanidoacetate; 31: π-methylhistidine; 32: kynurenine 33: trigonelline; 34: 1-methylnicotinamide 35: D-glucose 36: urea; 37: tyrosine; 38: histidine; 39: phenylalanine; 40: hippurte; 41: xanthosine; 42: oxypurinol; 43: formate.
majority n=103 or 76.30% were males. The division of groups also had male supremacy wherein groups one, two, and three had 68.57, 90.32, and 79.41% males respectively. This might be due to a male predominant
social structure. The 18 to 30 years age group was found most prone to spinal cord injury because of comparatively greater outgoing, adventurous, labourer class, and accident-prone in comparison with other age groups.

Singh et al. 5
Figure 2. A representative 1H NMR spectra of urine showing assignments of metabolites in healthy controls
(a-Group 1), fixation with stem cells therapy (b-Group 2) and fixation alone (c-Group 3) at final follow-up (6th
month). Metabolites name have been indicated via following numbers: 1: Isobutyrate 2: propylene glycol; 3: β-hydroxybutyrate; 4: 3-aminoisobutyrate; 5: lactate; 6: 2-hydroxyisobutyrate 7: alanine; 8: acetate; 9: N-acetylaspartate 10: N-acetylglutamine 11: glutamine; 12: acetone; 13: acetoacetate; 14: succinate; 15: citrate; 16: dimethylamine; 17: N-N-dimethylformamide; 18: trimethylamine; 19: creatine phosphate; 20: creatine 21: creatinine; 22: malonate; 23: N-nitrosodimethylamine; 24: cis-aconitate; 25: choline; 26: phosphocholine; 27: GPC (glycerophosphocholine); 28: trimethylamine-N-oxide; 29: Glycine; 30: guanidoacetate; 31: π-methylhistidine; 32: kynurenine 33: trigonelline; 34: 1-methylnicotinamide 35: D-glucose 36: urea; 37: tyrosine; 38: histidine; 39: phenylalanine; 40: hippurte; 41: xanthosine; 42: oxypurinol; 43: formate.

6 J. Metabolomics Syst. Biol. Common modes of SCI were fall from height 63.08% and road traffic accident 21.54%. The reason might be falling from trees, roofs in rural areas and construction, industrial development, and road traffic accidents in urban areas. It is also because of an increase in the number of vehicles on the road and a lack of traffic safety awareness. The most common injured segments of the thoracolumbar spine were T10-L2 levels of 78.46% (Supplementary Table S1). Neurological recovery Improvements in motor and sensory scores were observed in both ASCI groups 2 and 3, but group 2 showed better results at the 6
th-month follow-up
(Supplementary Table S2 and S3). On AIS scoring, highly significant improvement was observed in group 2 in comparison to group 3. In group 2 61.29% subjects remained in AIS A grade and the improvements of the percentage to AIS B, C, and D grades were 12.90, 16.13 and 9.68% respectively, whereas in the group 3 these AIS grades values were 67.65, 17.64, 11.76 and 2.94% respectively (Table 1). Multivariate analysis An OSC-PCA and OPLS-DA model was created for investigating the role of metabolites in differentiation amid all ASCI cases against healthy control at baseline as well as at the final follow-up (6
th month). Statistical comparison
was validated by OSC-PCA as well as OPLS-DA methods and multivariate data analysis resulted in an R
2 value of
0.91 and 0.81 and a value of Q2 were 0.81, and 0.67
respectively. In the present data set generated models were robust enough for evaluating the differentiation. The healthy controls were mentioned by blue colored square while total ASCI cases mentioned by red colored circles. The 3D OSC-PCA model generated resulted in the total explained variance of 50.21 and 50.67% respectively (Figure 3a to d).
A VIP score was used to validate the importance of the results obtained by OSC-PCA and OPLS-DA models for baseline and at 6
th-month follow-up data. This analysis
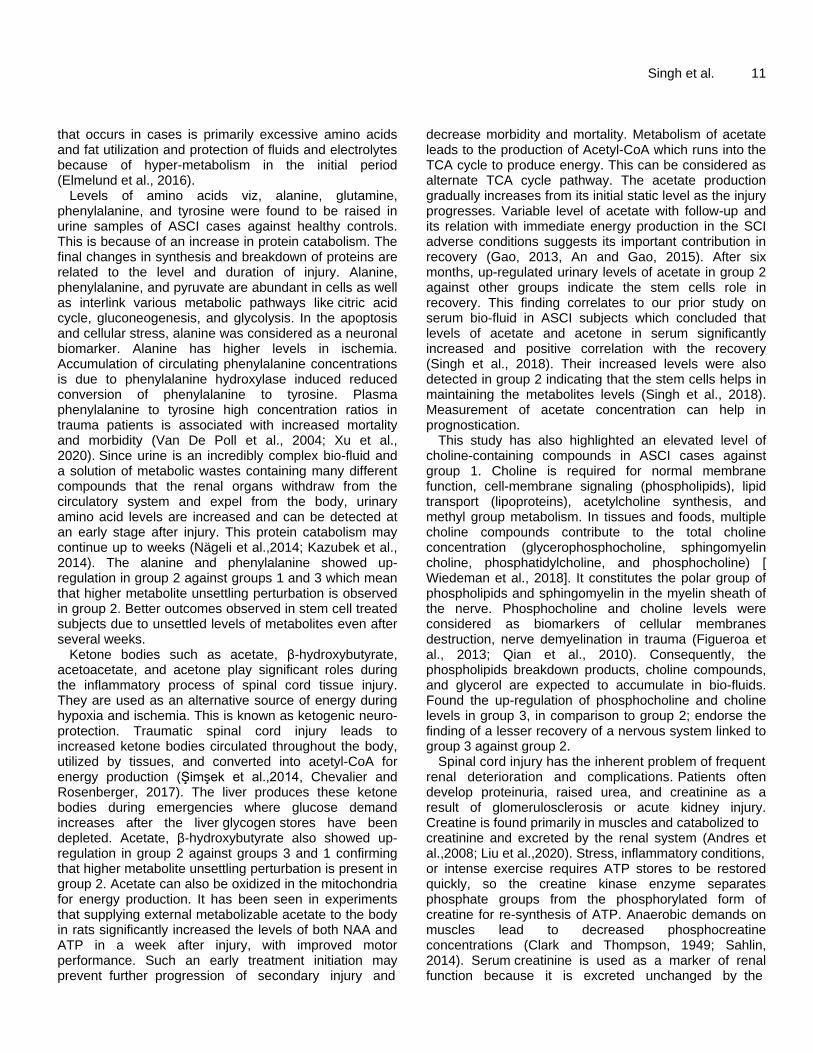
was performed using both groups as variables. The analysis of VIP scores revealed significant differences in metabolic profiles between healthy controls and ASCI cases on both occasions. The metabolites showing important metabolic perturbation were considered responsible for these differences (Supplementary Figure S2a and S2b).
The responsible metabolites emerging from baseline data processing were alanine, β-hydroxybutyrate, creatine, creatinine, creatine phosphate, glucose, phenylalanine, propylene glycol, and urea (Supplementary Figure S2a).
Metabolites emerging from final follow-up (at 6
th month)
data were acetate, creatine phosphate, creatinine, creatine, urea, and phenylalanine (Supplementary Figure S2b). The 3D scattered score plots represented the shifting of more cases towards the control group in the final follow-up, which is suggestive of improved health status and an indicator of better prognosis in ASCI cases (Figures 3c and d).
Factor loadings observed from OSC-PCA showed upregulation of significant metabolites namely, alanine, β-hydroxybutyrate, creatine, creatinine, creatine phosphate, glucose, phenylalanine, propylene glycol and urea in ASCI cases (Figures 3b and d). This finding was further validated in the VIP scores. The refinement of the above-described observations was further explored by the segregation of ASCI cases into two different treatment groups and their multivariate analysis. This analysis was further extended to find differentiation among all three groups (1, 2 and 3) at baseline and all 3 follow-ups (Figures 4a to d). Multivariate analysis after segregation of groups At all periods data matrices were obtained and processed with OSC-PCA and OPLS-DA for exploration of probable differences shown amongst the three groups (1, 2 and 3). Statistical models from supervised multivariate data analysis OPLS-DA resulted in R
2 values of 0.84, 0.81,
0.81, 0.61, and Q2 values of 0.66, 0.60, 0.53 and 0.53
respectively. Blue color squares represent group 1, pink color circles represent group 2, and green color circles represent group 3. The 3D OSC-PCA model generated resulted in the total explained variance of 50.85, 46.67, 49.99 and 46.67% respectively (Figures 4a to d).
Three-dimensional score plots expose the shifting of more cases towards the control group in different follow-ups. VIP analysis was performed to validate and to confirm these findings, VIP analysis also revealed significant metabolites responsible for the differentiation between healthy controls and ASCI cases. These metabolites were alanine, β-hydroxybutyrate, choline-containing compounds, creatine, creatinine, creatinine phosphate, glucose, propylene glycol, phenylalanine, and urea for baseline data (Supplementary Figure S3a).
The metabolites emerging from the 6th week of follow-
up data processing were alanine, β-hydroxybutyrate, choline-containing compounds, creatine, creatinine, creatine phosphate, glutamine, 3-methylhistidine, phenylalanine, and urea. The metabolites namely alanine, beta-hydroxybutyrate, creatine, glutamine, 3-methylhistidine, phenylalanine, and urea that showed upregulation in group 2 against group 3 and 1, whereas some metabolites have shown upregulation in group 3 against group 2 and 1 such as choline-containing compounds, creatinine, creatine phosphate

Singh et al. 7 Table 1. Neurological recovery comparisons via AIS scale at studied time periods.
S/N Groups AIS grade Baseline 6 week 3
rd month 6
th month
No. % No. % No. % No. %
1 Group 2
(n=31)
A 31 100 21 67.74 19 61.29 19 61.29
B 0 9 29.03 8 25.81 4 12.90
C 0 1 3.23 4 12.90 5 16.13
D 0 3 9.68
2 Group 3
(n=34)
A 34 100 31 91.18 26 76.47 23 67.65
B 0 3 8.82 7 20.59 6 17.65
C 0 1 2.94 4 11.76
D 0 1 2.94
Values are represented as number and percentage (%), AIS-A = Complete injury (No sensory nor motor function present), AIS-B = Incomplete injury (Sensory present but no motor function), AIS-C = Incomplete injury (Sensory and motor function present; motor having a muscle power less than 3), AIS-D = Incomplete injury (Sensory and motor function present; motor having muscle power of 3 or more); Group 2: Fixation with stem cells therapy, Group 3: Fixation alone.
(Supplementary Figure S3b). The data matrix from 3
rd-month follow-up revealed
responsible metabolites are acetate, creatine phosphate, creatinine, creatine, glucose, urea, and propyleneglycol. There were metabolites showing upregulation in group 2 against groups 3 and 1 namely acetate, creatine, creatine phosphate, glucose and urea, and up-regulation in group 3 against groups 2 and 1 namely creatinine, propylene glycol (Supplementary Figure S3c).
The significant metabolites from the final follow-up (at 6
th month) data were acetate, creatine, creatinine,
phenylalanine, and urea. Up-regulated metabolites in group 2 against groups 3 and 1 were phenylalanine and urea whereas some metabolites showed upregulation in group 3 against groups 2 and 1 such as acetate, creatine and creatinine (Figure 5).
The 3D-score plot projected the shifting of more group 2 cases towards the control group which is suggestive of improved health status in comparison to group 3 from the 6
th week itself till the final follow-up (in 6
th month)
(Figures 4b to d). DISCUSSION The renal excretory system is extremely vulnerable to traumatic, inflammatory, or toxic damages. These and it most easily accessible bio- fluid is an important bio-sourced for metabolomics and its application in the diagnosis and management of diseases. Despite such merits, urine has not been adequately utilized for biomarker studies in diseases and disorders of varying etiology. This holds especially in ASCI cases where little disease, and chances of recovery (Srivastava et al., 2015). Is known about the severity of the injury, course of The AIS scale has been utilized for clinically categorizing
the injury severity in the ASCI cases (Roberts et al., 2017). AIS scale is based on a 5 point scoring system from grade A (complete lesion of SCI) - grade E (normal neurological function). AIS grades are considered for classifying neurological status. The sensory and motor level is the caudal-most level having a normal motor and sensory function. These were recorded at the beginning and each follow-up. Improvement in AIS grades was observed in both the groups of cases; satisfying the notion that surgical therapy had a significant contribution to the overall management. Further, as is reported previously in this study based on serum metabolomics in ASCI, fixation with stem cell therapy better grades in comparison to fixation alone (Singh et al., 2018). This study based on urine metabolomics also had better grades in the stem cell therapy group in comparison to fixation alone. A significant difference was observed between the groups with a stem cell treated group showing better results in all the three variables (AIS grade, sensory, and motor changes are automatically reflected in urine (Emwas et al., 2016) is the simplest and score). Since stem cell augmentation was the only difference in the two groups of ASCI cases, the possibility of stem cells playing an important role in neurological healing cannot be ruled out (Srivastava et al.,2015; Nandoe et al.,2009). Another effort in this study was, if possible, to identify and document the factors that may have brought this change. A comparison among the ASCI cases group was made to obtain mean±SD and p values of significance for motor and sensory scores (Supplementary Table S2 and S3). The significant p values observed for comparison group 23 in sensory scores were 0.004, 0.018 and 0.038 respectively for all periods (6
th week, 3
rd, and 6
th month). In motor scores,
the significant p values observed for comparison groups 2 vs. 3 were 0.043 and 0.009 respectively at the initial

8 J. Metabolomics Syst. Biol.
Figure 3. (a) 3D OSC-PCA score plot of urine samples showing clear differentiation among healthy controls and ASCI cases at baseline. (b): loading plots of PC-1 of urine showing a difference in metabolic profile among healthy controls and ASCI cases at baseline. (c): 3D OSC-PCA score plot of urine samples showing clear differentiation among healthy controls and ASCI subjects in the 6
th month. (d): loading plots of PC-2
of urine showing a difference in metabolic profile among healthy controls and ASCI cases in the 6th month. Metabolites name have been
indicated via following numbers: 1: propylene glycol; 2: β-hydroxybutyrate; 3: lactate; 4: 2-hydroxybutyrate; 5: alanine; 6: acetate; 7: glutamine/N-acetyl glutamine; 8: acetone; 9: acetoacetate; 10: succinate; 11: citrate; 12: creatine; 13: creatinine; 14: choline-containing compounds; 15: Glycine; 16: glucose 17: creatine phosphate 18: trigonelline; 19: D-glucose; 20: urea; 21: histidine; 22: tyrosine; 23:phenylalanine; 24: hippurate; 25: 3-Methylhistidine; 26: oxypurinol.
two time periods (6th week and 3
rd month), and in the 6
th
month, this significance was not observed (Supplementary Table S3). These findings suggest the statistically significant improvement in neurological recovery in group 2 in comparison to group 3; however, at 6
th month the motor scores did not show significant
difference suggesting activity of stem cells was more pronounced initially for motor recovery.
Traumatic injury to the spinal cord causes acute physical injury along with the initiation of the inflammatory reaction of tissues and cells. This culminates in secondary
axonal degeneration with further progression of injury and finally necrosis or death of nerve cells. In bio-fluids like serum and urine, these chemical reactions and metabolic activities get reflected because damaged tissues release proteins and metabolites in biofluids (Basile et al., 2012; Wu and Gao, 2015). The magnitudes of metabolite changes in metabolic concentrations following SCI depict the severity of the damage (Gao et al., 2016; Da Silva et al., 2013). Conversely, a reversal in metabolic changes towards the normal values (as seen in healthy controls) would suggest no further damage is being produced.

Singh et al. 9
Figure 4. (a) 3D scattered score OPLS-DA plot of urine samples comprising all the study groups at baseline (b) 3D OPLS-DA score plot of urine samples showing clear differentiation among all the three groups at 6
th week, 3
rd month (c) and last follow-up at 6
th month (d).

10 J. Metabolomics Syst. Biol.
Figure 5. VIP scores of various metabolites in urine samples among all three groups in the 6
th month. Group 1: Healthy controls; Group 2: Fixation with stem cells therapy;
Group 3: Fixation alone.
Therefore, at any given time, a shift of these metabolic perturbations, away from and towards the normal levels, may reflect the progression or regression of the damage or disease at that given time. With this hypothesis, this study has explored specific metabolic perturbation of certain molecules in the urine of ASCI cases.
This study has detected several urine metabolites related to biochemical pathways of metabolism like the krebs cycle, glycolysis, amino acid metabolism, urea cycle, etc. Summary of common metabolites responsible for group differentiation considering all follow-ups were reproduced as alanine, acetate, β-hydroxybutyrate, choline-containing compounds, creatine, creatine phosphate, creatinine, phenylalanine, propylene glycol, and urea. This assessment of the metabolomic fingerprint of urine bio-fluid might be helpful as probable biomarkers of ASCI cases (Supplementary Table S4).
A broader picture of the metabolites maze was reproduced by tools of statistics like VIP scoring and 3D scatter plots. VIP scores replicated the list of different metabolites having prominence in spectra at different follow-ups in both groups of cases, but more so in the stem cell group. This could be due to the special characteristics of stem cells, which attribute to the nervous tissue healing. Further, the persistent significant discriminant metabolite levels at every follow-up postulate
that inflammatory pathophysiological activity was continuing and the ASCI cases were recovering even at 6 months. It was therefore inferred that stem cell inoculation triggers the neuronal recovery, which has a long-lasting effect. The following metabolites were found significant in group 2 at different follow-ups - 3-methylhistidine, alanine, β-hydroxybutyrate, creatine, glutamine, phenylalanine, urea at 6 weeks; acetate, creatine, glucose, phosphocreatine, urea at 3 months and creatine, phenylalanine, urea at 6 months. Extrapolating the finding of group 2 having fared well in comparison to others, it was imperative to search for these metabolites in group 1 as well as in group 3 but they were either less prominent or there was an absence of some of these compounds. The 3D OPLS-DA scatter plots data analysis starting from the sixth week till the final follow-up also reveals that the stem cell therapy group showed a greater trend of shifting towards the control group in comparison to fixation alone.
SCI produces a decrease in blood supply to the surrounding tissues and thereby ischemia sets in just after the trauma. This condition gets further deteriorated due to systemic hypotension and hypoxia. Ultimately, cells have to face the paucity of energy by an unsatisfactory supply of glucose and oxygen resulting in depleted ATP stores. Spinal trauma metabolic response
that occurs in cases is primarily excessive amino acids and fat utilization and protection of fluids and electrolytes because of hyper-metabolism in the initial period (Elmelund et al., 2016).
Levels of amino acids viz, alanine, glutamine, phenylalanine, and tyrosine were found to be raised in urine samples of ASCI cases against healthy controls. This is because of an increase in protein catabolism. The final changes in synthesis and breakdown of proteins are related to the level and duration of injury. Alanine, phenylalanine, and pyruvate are abundant in cells as well as interlink various metabolic pathways like citric acid cycle, gluconeogenesis, and glycolysis. In the apoptosis and cellular stress, alanine was considered as a neuronal biomarker. Alanine has higher levels in ischemia. Accumulation of circulating phenylalanine concentrations is due to phenylalanine hydroxylase induced reduced conversion of phenylalanine to tyrosine. Plasma phenylalanine to tyrosine high concentration ratios in trauma patients is associated with increased mortality and morbidity (Van De Poll et al., 2004; Xu et al., 2020). Since urine is an incredibly complex bio-fluid and a solution of metabolic wastes containing many different compounds that the renal organs withdraw from the circulatory system and expel from the body, urinary amino acid levels are increased and can be detected at an early stage after injury. This protein catabolism may continue up to weeks (Nägeli et al.,2014; Kazubek et al., 2014). The alanine and phenylalanine showed up-regulation in group 2 against groups 1 and 3 which mean that higher metabolite unsettling perturbation is observed in group 2. Better outcomes observed in stem cell treated subjects due to unsettled levels of metabolites even after several weeks.
Ketone bodies such as acetate, β-hydroxybutyrate, acetoacetate, and acetone play significant roles during the inflammatory process of spinal cord tissue injury. They are used as an alternative source of energy during hypoxia and ischemia. This is known as ketogenic neuro-protection. Traumatic spinal cord injury leads to increased ketone bodies circulated throughout the body, utilized by tissues, and converted into acetyl-CoA for energy production (Şimşek et al.,2014, Chevalier and Rosenberger, 2017). The liver produces these ketone bodies during emergencies where glucose demand increases after the liver glycogen stores have been depleted. Acetate, β-hydroxybutyrate also showed up-regulation in group 2 against groups 3 and 1 confirming that higher metabolite unsettling perturbation is present in group 2. Acetate can also be oxidized in the mitochondria for energy production. It has been seen in experiments that supplying external metabolizable acetate to the body in rats significantly increased the levels of both NAA and ATP in a week after injury, with improved motor performance. Such an early treatment initiation may prevent further progression of secondary injury and
Singh et al. 11 decrease morbidity and mortality. Metabolism of acetate leads to the production of Acetyl-CoA which runs into the TCA cycle to produce energy. This can be considered as alternate TCA cycle pathway. The acetate production gradually increases from its initial static level as the injury progresses. Variable level of acetate with follow-up and its relation with immediate energy production in the SCI adverse conditions suggests its important contribution in recovery (Gao, 2013, An and Gao, 2015). After six months, up-regulated urinary levels of acetate in group 2 against other groups indicate the stem cells role in recovery. This finding correlates to our prior study on serum bio-fluid in ASCI subjects which concluded that levels of acetate and acetone in serum significantly increased and positive correlation with the recovery (Singh et al., 2018). Their increased levels were also detected in group 2 indicating that the stem cells helps in maintaining the metabolites levels (Singh et al., 2018). Measurement of acetate concentration can help in prognostication.
This study has also highlighted an elevated level of choline-containing compounds in ASCI cases against group 1. Choline is required for normal membrane function, cell-membrane signaling (phospholipids), lipid transport (lipoproteins), acetylcholine synthesis, and methyl group metabolism. In tissues and foods, multiple choline compounds contribute to the total choline concentration (glycerophosphocholine, sphingomyelin choline, phosphatidylcholine, and phosphocholine) [ Wiedeman et al., 2018]. It constitutes the polar group of phospholipids and sphingomyelin in the myelin sheath of the nerve. Phosphocholine and choline levels were considered as biomarkers of cellular membranes destruction, nerve demyelination in trauma (Figueroa et al., 2013; Qian et al., 2010). Consequently, the phospholipids breakdown products, choline compounds, and glycerol are expected to accumulate in bio-fluids. Found the up-regulation of phosphocholine and choline levels in group 3, in comparison to group 2; endorse the finding of a lesser recovery of a nervous system linked to group 3 against group 2.
Spinal cord injury has the inherent problem of frequent renal deterioration and complications. Patients often develop proteinuria, raised urea, and creatinine as a result of glomerulosclerosis or acute kidney injury. Creatine is found primarily in muscles and catabolized to creatinine and excreted by the renal system (Andres et al.,2008; Liu et al.,2020). Stress, inflammatory conditions, or intense exercise requires ATP stores to be restored quickly, so the creatine kinase enzyme separates phosphate groups from the phosphorylated form of creatine for re-synthesis of ATP. Anaerobic demands on muscles lead to decreased phosphocreatine concentrations (Clark and Thompson, 1949; Sahlin, 2014). Serum creatinine is used as a marker of renal function because it is excreted unchanged by the

12 J. Metabolomics Syst. Biol. kidneys. An increase in urine creatinine can be due to trauma, stress, inflammatory conditions, intense exercise, or muscle injury leading to increased creatinine by increasing muscle breakdown. Consequently, the creatine and its breakdown product creatinine are expected to accumulate in bio-fluids. The up-regulation of these found in group 2, when compared to group 3, corroborates the finding of a lesser recovery of a nervous system linked to group 3 against group 2.
Propylene glycol is an unusual compound found to correlate with spinal cord injury progression. In the general population, propylene glycol is not normally present and if found is usually due to certain specific dietary products or medicine (Speth et al., 1987; Choi et al., 2010; Piantoni and Allen, 2015). It is metabolized by the liver to form lactate, acetate, pyruvate, and is excreted unchanged in the urine. In the ASCI cases, propylene glycol was present and up-regulated in group 3, when compared to groups 1 and 2. Intravenous administration of drugs uses propylene glycol as an excipient and this could explain their differential presence in ASCI cases versus healthy controls.
To summarize, this study establishes urine metabolomics by
1H NMR spectroscopy a potential tool
for quantification of metabolites specific to ASCI. This is probably, first study establishing a networking map in urine samples of ASCI human subjects identifying biomarkers for future validation. However, to validate our findings large numbers of patients with longer follow-ups are needed. The role of stem cells augmenting neurological recovery needs to be studied further and on chronic SCI cases also to validate the conclusion.
Conclusion
In urinary metabolomics profiles, significant differences were observed between healthy controls and ASCI cases from baseline until the last follow up. The metabolites responsible for group differentiation were alanine, acetate, β-hydroxybutyrate, choline-containing compounds, creatine, creatine phosphate, creatinine, phenylalanine, propylene glycol and urea. The aberrations in urinary metabolites observed between their levels and disease severity at different time intervals Acute Spinal Cord Injury could be a promising prognosticator for neurological recovery. Besides, this study involving urine metabolomics validates this findings on serum
1H NMR spectroscopy reported earlier that
surgical therapy has a significant contribution to the overall management of ASCI cases and stem cell therapy was augmenting neurological recovery.
FUNDING
The Council of Science and Technology (CST), Uttar Pradesh (UP), India provided financial support [grant
number CST/SERPD/D-294].
CONFLICT OF INTERESTS The authors have not declared any conflict of interests. ACKNOWLEDGMENTS
The authors wish to thank the CST, UP (grant number CST/SERPD/D-294) for their financial support, and CBMR, Lucknow where the
1HNMR spectroscopy was
conducted. The authors also pay sincere thanks to Dr. S K. Mandal, a statistician at CBMR for statistical analysis. ABBREVIATIONS
AIS, Asia impairment scale; ASCI, Acute Spinal Cord Injury; ASIA, American Spinal Injury Association; BM, bone marrow; CSF, cerebrospinal fluid; MNC, mono nuclear cells; MSCs or BMSCs, mesenchymal stem cells/ bone marrow mesenchymal stromal cells; NMR, nuclear magnetic resonance; NOESY, nuclear overhauser effect spectroscopy; OPLS-DA, orthogonal partial least square discriminant analysis; OSC-PCA, orthogonal signal correction-principal component analysis; SD, standard deviation; VIP, variables importance in projection. REFERENCES
An M, Gao Y (2015). Urinary biomarkers of brain diseases. Genomics,
Proteomics and Bioinformatics13(6):345-354. Andres RH, Ducray AD, Schlattner U, Wallimann T, Widmer HR (2008).
Functions and effects of creatine in the central nervous system. Brain Research Bulletin 76(4):329-343.
Basile DP, Anderson MD, Sutton TA (2012). Pathophysiology of acute kidney injury. Comprehensive Physiology 2(2):1303.
Beckonert O, Keun HC, Ebbels TM, Bundy J, Holmes E, Lindon JC, Nicholson JK (2007). Metabolic profiling, metabolomic and
metabonomic procedures for NMR spectroscopy of urine, plasma, serum, and tissue extracts. Nature Protocols 2(11):2692.
Chatterji T, Singh S, Sen M, Singh AK, Maurya PK, Husain N, Srivastava JK, Mandal SK, Roy R (2016). Comprehensive 1H NMR
metabolic profiling of body fluids for differentiation of meningitis in adults. Metabolomics 12(8):130.
Chen C-S, Huang C-H, Shih S-L (2015). Biomechanical evaluation of a new pedicle screw-based posterior dynamic stabilization device (Awesome Rod System)-a finite element analysis. BMC Musculoskeletal Disorders 16(1):81.
Chevalier AC, Rosenberger TA (2017). Increasing acetyl‐coa metabolism attenuates injury and alters spinal cord lipid content in mice subjected to experimental autoimmune encephalomyelitis. Journal of Neurochemistry 141(5):721-737.
Choi H, Schmidbauer N, Sundell J, Hasselgren M, Spengler J, Bornehag CG (2010). Common household chemicals and allergy risks in pre-school age children. PloS ONE 5(10):e13423.
Clark Jr LC, Thompson H (1949).Determination of creatine and creatinine in urine. Analytical Chemistry 21(10):1218-1221.
Da Silva L, Godejohann M, Martin Fo-PJ, Collino S, B rkle A, Moreno-
Villanueva M (2013). High-resolution quantitative metabolome analysis of urine by automated flow injection NMR. Analytical Chemistry 85(12):5801-5809.
Daniel W (1999). Biostatistics: A Foundation for Analysis in the Health Sciences, 7th edR Wiley. New York.
Elmelund M, Oturai P, Toson B, Biering-Sørensen F (2016). Forty-five-year follow-up on the renal function after spinal cord injury. Spinal Cord 54(6):445.
Emwas AH, Luchinat C, Turano P, Tenori L, Roy R, Salek RM, Ryan D, Merzaban JS, Kaddurah-Daouk R, Zeri AC, Nagana Gowda GA (2015). Standardizing the experimental conditions for using urine in NMR-based metabolomic studies with a particular focus on diagnostic studies: a review. Metabolomics 11(4):872-94.
Emwas AH, Roy R, McKay RT, Ryan D, Brennan L, Tenori L, Luchinat C, Gao X, Zeri AC, Gowda GA (2016). Recommendations and standardization of biomarker quantification using NMR-based metabolomics with particular focus on urinary analysis. Journal of proteome research 15(2):360-373.
Figueroa JD, Cordero K, llán MS, De Leon M (2013). Dietary omega-3 polyunsaturated fatty acids improve the neurolipidome and restore the DHA status while promoting functional recovery after experimental spinal cord injury. Journal of Neurotrauma 30(10):853-68.
Gao Y (2013).Urine-an untapped goldmine for biomarker discovery. Science China Life Sciences 56(12):1145-1146.
Gao X, Lin SH, Ren F, Li JT, Chen JJ, Yao CB, Wang Y (2016). Acetate functions as an epigenetic metabolite to promote lipid synthesis under hypoxia. Nature Communications 7(1):1-14.
Kaur P, Sharma S (2018). Recent advances in pathophysiology of traumatic brain injury.Current neuropharmacology 16(8):1224-1238.
Kazubek-Zemke M, Rybka J, Marchewka Z, Rybka W, Pawlik K, Długosz A (2014). Preliminary study on application of urine amino acids profiling for monitoring of renal tubular injury using GLC-MS. Advances in Hygiene and Experimental Medicine/Postepy Higieny i Medycyny Doswiadczalnej.;68.
Liu Y, Canovas R, Crespo GA, Cuartero M (2020). Thin-Layer Potentiometry for Creatinine Detection in Undiluted Human Urine Using Ion-Exchange Membranes as Barriers for Charged Interferences. Analytical Chemistry 92(4):3315-3323.
Nägeli M, Fasshauer M, Sommerfeld J, Fendel A, Brandi G, Stover JF (2014). Prolonged continuous intravenous infusion of the dipeptide L-alanine-L-glutamine significantly increases plasma glutamine and alanine without elevating brain glutamate in patients with severe traumatic brain injury. Critical Care 18(4):R139.
Nandoe Tewarie RS, Hurtado A, Bartels RH, Grotenhuis A, Oudega M (2009). Stem cell-based therapies for spinal cord injury. The Journal of Spinal Cord Medicine 32(2):105-114.
Peng J, Zeng J, Cai B, Yang H, Cohen MJ, Chen W, Sun MW, Lu CD, Jiang H (2014). Establishment of quantitative severity evaluation model for spinal cord injury by metabolomic fingerprinting. PloS ONE 9(4):e93736.
Piantoni P, Allen MS (2015). Evaluation of propylene glycol and glycerol infusions as treatments for ketosis in dairy cows. Journal of Dairy Science 98(8):5429-5439.
Qian J, Herrera JJ, Narayana PA (2010). Neuronal and axonal degeneration in experimental spinal cord injury: in vivo proton
magnetic resonance spectroscopy and histology. Journal of Neurotrauma 27(3):599-610. Roberts TT, Leonard GR, Cepela DJ (2017). Classifications in brief:
American spinal injury association (ASIA) impairment scale. Clinical Orthopaedics and Related Research 475(5):1499-1504.
Sahlin K (2014). Muscle energetics during explosive activities and potential effects of nutrition and training. Sports Medicine 44(2):167-173.
Schuld C, Franz S, Brüggemann K, Heutehaus L, Weidner N, Kirshblum SC, Rupp R (2016). International standards for neurological classification of spinal cord injury: impact of the revised worksheet (revision 02/13) on classification performance. The Journal of Spinal Cord Medicine 39(5):504-512.
Singh et al. 13 Şimşek T, Şimşek HU, Cant rk NZ (2014) Response to trauma and
metabolic changes: posttraumatic metabolism. Turkish Journal of Surgery/Ulusal Cerrahi Dergisi 30(3):153.
Singh A, Srivastava RN, Agrahari A, Singh S, Raj S, Chatterji T, Mahdi AA, Garg RK, Roy R (2018).Proton NMR based serum metabolic profile correlates with the neurological recovery in treated acute spinal cord injury (ASCI) subjects: A pilot study. Clinica Chimica Acta 480:150-60.
Speth P, Vree T, Neilen N, Newell D, Gore M (1987). Propylene glycol pharmacokinetics and effects after intravenous infusion in humans. Therapeutic Drug Monitoring 9(3):255-258.
Srivastava R, Agrahari MAK, Chandra DT, Raj S (2015). A closed, safe, and cost-effective alternative algorithm of isolation of bone marrow-derived mononuclear cells. Journal of international Academic Research for Multidisciplinary 3(1):1-11.
Srivastava R, Gopal SC, Chandra T, Chandra A, Singh A, Agrahari AK (2015). Role of Surgery, Omentoplasty and Autologous Bone Marrow-Derived Mononuclear Cells Infusion on Clinical Outcomes After Spinal Cord Injury-A Randomized Controlled Trial. International Journal of Health Sciences and Research 5(3):82-91.
Srivastava RN, Singh A, Garg RK, Agarwal A, Raj S (2015). Epidemiology of Traumatic Spinal Cord Injury: A SAARC Perspective. International Journal of Molecular Biology and Biochemistry 3(1):9-22.
Van De Poll MC, Soeters PB, Deutz NE, Fearon KC, Dejong CH (2004) Renal metabolism of amino acids: its role in interorgan amino acid exchange. The American journal of Clinical Nutrition 79(2):185-97.
Varma AK, Das A, Wallace G, Barry J, Vertegel AA, Ray SK, Banik NL (2013).Spinal cord injury: a review of current therapy, future treatments, and basic science frontiers. Neurochemical Research 38(5):895-905.
Wiedeman AM, Barr SI, Green TJ, Xu Z, Innis SM, Kitts DD (2018). Dietary choline intake: current state of knowledge across the life cycle. Nutrients 10(10):1513.
Wu J, Gao Y (2015). Physiological conditions can be reflected in the human urine proteome and metabolome. Expert review of proteomics 12(6):623-36.
Wu Y, Streijger F, Wang Y, Lin G, Christie S, Mac-Thiong JM, Parent S, Bailey CS, Paquette S, Boyd MC, Ailon T (2016). Parallel metabolomic profiling of cerebrospinal fluid and serum for identifying biomarkers of injury severity after acute human spinal cord injury. Scientific Reports 6:38718.
Xu J, Pan T, Qi X, Tan R, Wang X, Liu Z, Tao Z, Qu H, Zhang Y, Chen H, Wang Y (2020). Increased mortality of acute respiratory distress syndrome was associated with high levels of plasma phenylalanine. Respiratory Research 21:1-3.

14 J. Metabolomics Syst. Biol. SUPPLEMENTARY MATERIAL
Supplementary Figure S1. A representative 1H NMR spectra of urine showing assignments of metabolites in
healthy controls (a-Group 1), fixation with stem cells therapy (b-Group 2) and fixation alone (c-Group 3) at 6th
week. Numbers indicate the following metabolites: 1: Isobutyrate 2: propylene glycol; 3: β-hydroxybutyrate; 4: 3-aminoisobutyrate; 5: lactate; 6: 2-hydroxyisobutyrate 7: alanine; 8: acetate; 9: N-acetylaspartate 10: N-acetylglutamine 11: glutamine; 12: acetone; 13: acetoacetate; 14: succinate; 15: citrate; 16: dimethylamine; 17: N-N-dimethylformamide; 18: trimethylamine; 19: creatine phosphate; 20: creatine 21: creatinine; 22: malonate; 23: N-nitrosodimethylamine; 24: cis-aconitate; 25: choline; 26: phosphocholine; 27: GPC (glycerophosphocholine); 28: trimethylamine-N-oxide; 29: Glycine; 30: guanidoacetate; 31: π-methylhistidine; 32: kynurenine 33: trigonelline; 34: 1-methylnicotinamide 35: D-glucose 36: urea; 37: tyrosine; 38: histidine;
39: phenylalanine; 40: hippurte; 41: xanthosine; 42: oxypurinol; 43: formate.

Singh et al. 15 Supplementary Table S1. General characteristics of all subjects.
Gender
Number of subjects
Total (N=135) Group 1 (n=70) Group 2 (n=31) Group 3 (n=34)
No. % No. % No. % No. %
Male 103 76.30 48 68.57 28 90.32 27 79.41
Female 32 23.70 22 31.43 3 9.68 7 20.59
Age group (years)
18-30 73 54.07 38 54.29 18 58.06 17 50.00
31-45 42 31.11 20 28.57 10 32.26 12 35.29
46-60 20 14.82 12 17.14 3 9.68 5 14.71
Mode of injury (MOI) Total (N=65) Group 2 (n=31) Group 3 (n=34)
No. % No. % No. %
Fall from height (1) 41 63.08 20 64.52 21 61.77
Road Traffic Accident (2) 14 21.54 7 22.58 7 20.59
Weight over back (3) 5 7.69 2 6.45 3 8.82
Others (4 & 5) 5 7.69 2 6.45 3 8.82
Level of Injury
Level T4-T9 14 21.54 4 12.90 10 29.41
Level T10-L2 51 78.46 27 87.10 24 70.59
Values are represented as frequency and percentage (%); Group 1: Healthy controls, Group 2: Fixation with stem cells therapy, Group 3: Fixation alone.
Supplementary Table S2. Intra-groups comparison of sensory and motor scores at baseline, 6th week, 3
rd, and 6
th month.
Group Period Sensory score Motor score
mean±SD p value1 95% CI mean±SD p value
1 95% CI
Group 2
Baseline 1.57±15.21 0.003* -7.99 to -1.80
50.00±0.00 0.045* -2.29 to -0.02
6th
week 1.62±15.51 51.16±3.08
Baseline 1.57±15.21 0.001* -12.62 to -3.37
50.00±0.00 0.005* -6.78 to -1.34
3rd
month 1.65±17.73 54.06±7.42
Baseline 1.57±15.21 0.000* -17.28 to -5.93
50.00±0.00 0.018* -8.79 to -0.88
6th
month 1.69±19.70 54.83±10.78
6th
week 1.62±15.51 0.014* -5.51 to -0.67
51.16±3.08 0.018* -0.53 to -2.49
3rd
month 1.65±17.73 54.06±7.42
6th
week 1.62±15.51 0.002* -10.63 to -2.78
51.16±3.08 0.069 -7.65 to 0.30
6th
month 1.69±19.70 54.83±10.78
3rd
month 1.65±17.73 0.005* -6.01 to -1.20
54.06±7.42 0.57 -3.52 to 1.98
6th
month 1.69±19.70 54.83±10.78
Group 3
Baseline 1.46±17.31 0.001* -5.92 to -1.60
50.00±0.00 0.32 -0.17 to 0.06
6th
week 1.49±18.09 50.05±0.34
Baseline 1.46±17.31 0.001* -13.03 to -3.67
50.00±0.00 0.059 -1.08 to 0.02
3rd
month 1.54±19.17 50.52±1.58
Baseline 1.46±17.31 0.000* -17.82 to -7.47
50.00±0.00 0.013* -7.42 to -0.92
6th
month 1.58±19.93 54.17±9.31
6th
week 1.49±18.09 0.008* -7.88 to -1.29
50.05±0.34 0.088 -1.01 to 0.07
3rd
month 1.54±19.17 50.52±1.58
6th
week 1.49±18.09 0.000* -13.04 to 4.71
50.05±0.34 0.014* -7.35 to -0.88
6th
month 1.58±19.93 54.17±9.31

16 J. Metabolomics Syst. Biol. Supplementary Table S2. Cont.
3
rd month 1.54±19.17
0.001* -6.65 to -1.93 50.52±1.58
0.020* -6.68 to -0.60 6
th month 1.58±19.93 54.17±9.31
Values are represented as mean ± SD (standard deviation), 1Paired t-test, *significant; 95% CI (confidence interval); Group 2: Fixation with stem cells
therapy, Group 3: Fixation alone.
Supplementary Table S3. Inter-groups analysis of sensory and motor scores at baseline, 6
th week, 3
rd, and 6
th month.
Period Groups N
Sensory score Motor score
Mean±SD p-value
Sig. (2-tailed)
95% Confidence Interval
Mean±SD p-value
Sig. (2-tailed)
95% Confidence Interval
6th
week 2 31 1.62±15.51
0.004* -21.01 to -4.22 51.16±3.08
0.043* 0.03 to 2.16 3 34 1.49±18.09 50.06±0.34
3rd
month 2 31 1.65±17.73
0.018* -20.31 to -1.94 54.06±7.42
0.009* 0.93 to 6.13 3 34 1.54±19.17 50.53±1.58
6th
month 2 31 1.69±19.70
0.038* -20.28 to -0.61 54.84±10.78
0.791 -4.31 to 5.64 3 34 1.58±19.93 54.17±9.30
Values are represented as mean ± SD (Standard Deviation), 1Student t-test, *significant; 95% CI (confidence interval); Group 2: Fixation with stem
cells therapy, Group 3: Fixation alone.
Supplementary Figure S2a. VIP scores of metabolites in urine samples among healthy controls vs. ASCI cases at baseline.

Singh et al. 17
Supplementary Figure S2b. VIP scores of metabolites in urine samples among healthy controls vs. ASCI cases in the 6
th month.
Supplementary Figure S3a. VIP scores of various metabolites in urine samples among all three groups at baseline. Group 1: Healthy controls, Group 2: Fixation with stem cells therapy, Group 3: Fixation alone.
18 J. Metabolomics Syst. Biol.
Supplementary Figure S3b. VIP scores of various metabolites in urine samples among all three groups in the 6
th week. Group 1: Healthy controls, Group 2: Fixation with stem
cells therapy, Group 3: Fixation alone.
Supplementary Figure S3c. VIP scores of various metabolites in urine samples among all three groups at 3
rd month. Group 1: Healthy controls, Group 2: Fixation
with stem cell therapy, Group 3: Fixation alone.

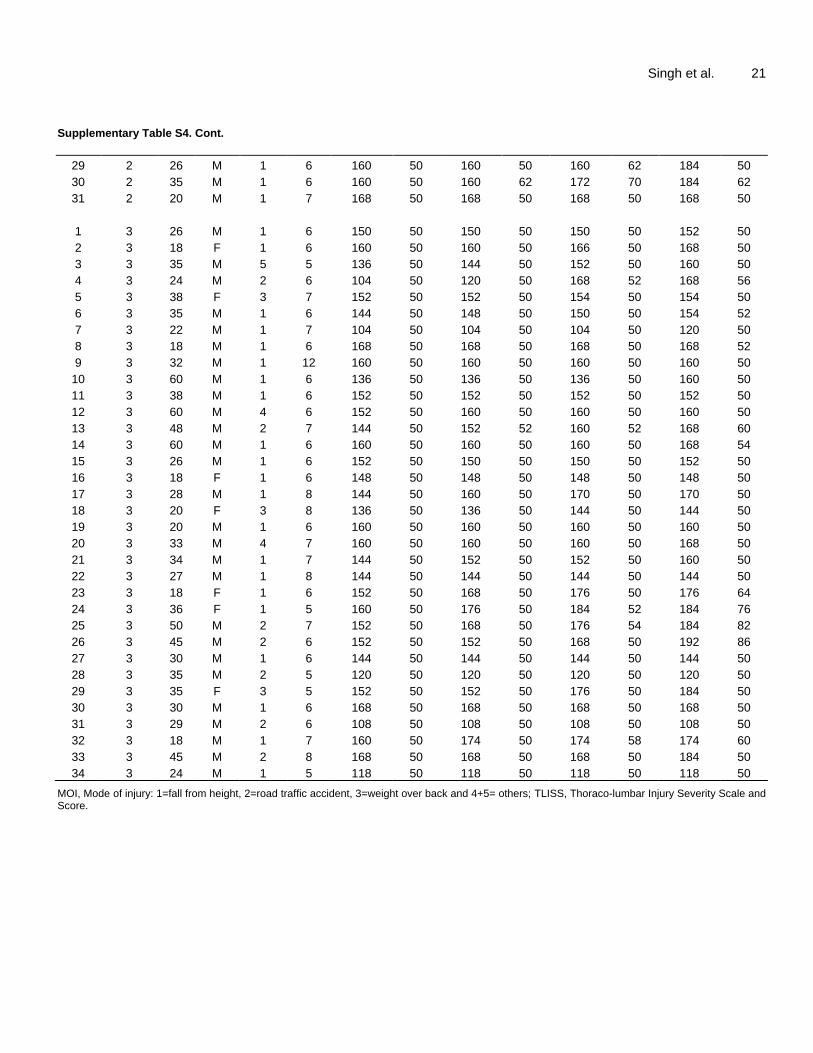
Singh et al. 19 Supplementary Table S4. Details of the ASCI subjects.
S/N Groups Age Sex MOI TILIS Baseline at 6 weeks at 3rd month 6 months
Sensory Motor Sensory Motor Sensory Motor Sensory Motor
1 1 19 F
2 1 56 M
3 1 36 M
4 1 24 M
5 1 25 M
6 1 36 F
7 1 18 M
8 1 46 F
9 1 50 M
10 1 26 M
11 1 56 F
12 1 28 M
13 1 18 F
14 1 36 F
15 1 30 M
16 1 25 F
17 1 56 F
18 1 23 M
19 1 50 F
20 1 18 M
21 1 46 M
22 1 26 F
23 1 20 F
24 1 18 M
25 1 35 F
26 1 35 M
27 1 22 M
28 1 25 M
29 1 21 M
30 1 22 M
31 1 29 M
32 1 22 M
33 1 32 M
34 1 36 F
35 1 50 M
36 1 28 M
37 1 46 M
38 1 33 M
39 1 40 M
40 1 27 M
41 1 28 M
42 1 18 F
43 1 21 M
44 1 35 F
45 1 24 M
46 1 22 M
47 1 24 M
48 1 33 M

20 J. Metabolomics Syst. Biol. Supplementary Table S4. Cont.
49 1 21 F
50 1 55 M
51 1 39 M
52 1 27 M
53 1 45 M
54 1 35 F
55 1 48 M
56 1 19 F
57 1 26 F
58 1 32 F
59 1 18 M
60 1 26 F
61 1 37 M
62 1 37 M
63 1 37 M
64 1 18 M
65 1 20 M
66 1 21 M
67 1 22 M
68 1 32 M
69 1 34 M
70 1 54 F
1 2 43 M 2 6 176 50 176 50 176 50 176 50
2 2 28 M 1 7 120 50 152 50 168 58 184 60
3 2 32 M 1 6 122 50 122 50 122 50 122 50
4 2 55 M 1 8 152 50 152 50 152 50 152 50
5 2 15 F 4 7 176 50 184 50 192 82 200 88
6 2 22 M 3 7 168 50 188 50 188 52 188 56
7 2 18 M 2 6 120 50 120 50 112 50 112 50
8 2 24 M 2 5 152 50 164 50 184 58 184 59
9 2 18 F 1 7 152 50 176 58 184 64 184 60
10 2 50 M 2 7 152 50 160 60 160 60 160 54
11 2 46 M 1 6 152 50 152 50 152 50 152 50
12 2 36 M 3 7 152 50 168 50 168 50 168 50
13 2 24 M 2 6 160 50 160 50 160 50 160 50
14 2 40 M 1 5 168 50 168 50 168 50 168 50
15 2 20 M 1 6 160 50 164 54 184 58 188 58
16 2 24 M 1 6 160 50 160 50 160 50 176 50
17 2 24 M 1 6 152 50 156 50 168 50 176 50
18 2 24 M 1 6 168 50 168 50 168 50 168 50
19 2 22 M 2 7 160 50 160 50 160 50 160 50
20 2 30 F 4 7 168 50 168 50 176 60 192 97
21 2 18 M 1 6 168 50 184 52 184 52 184 50
22 2 44 M 1 6 160 50 160 50 160 50 160 50
23 2 35 M 1 6 176 50 176 50 176 50 176 52
24 2 45 M 1 9 168 50 176 50 176 50 184 50
25 2 25 M 1 6 136 50 136 50 136 50 136 50
26 2 35 M 1 8 160 50 160 50 160 50 160 50
27 2 40 M 2 7 160 50 160 50 160 50 160 50
28 2 18 M 1 8 176 50 176 50 176 50 176 54
Singh et al. 21 Supplementary Table S4. Cont.
29 2 26 M 1 6 160 50 160 50 160 62 184 50
30 2 35 M 1 6 160 50 160 62 172 70 184 62
31 2 20 M 1 7 168 50 168 50 168 50 168 50
1 3 26 M 1 6 150 50 150 50 150 50 152 50
2 3 18 F 1 6 160 50 160 50 166 50 168 50
3 3 35 M 5 5 136 50 144 50 152 50 160 50
4 3 24 M 2 6 104 50 120 50 168 52 168 56
5 3 38 F 3 7 152 50 152 50 154 50 154 50
6 3 35 M 1 6 144 50 148 50 150 50 154 52
7 3 22 M 1 7 104 50 104 50 104 50 120 50
8 3 18 M 1 6 168 50 168 50 168 50 168 52
9 3 32 M 1 12 160 50 160 50 160 50 160 50
10 3 60 M 1 6 136 50 136 50 136 50 160 50
11 3 38 M 1 6 152 50 152 50 152 50 152 50
12 3 60 M 4 6 152 50 160 50 160 50 160 50
13 3 48 M 2 7 144 50 152 52 160 52 168 60
14 3 60 M 1 6 160 50 160 50 160 50 168 54
15 3 26 M 1 6 152 50 150 50 150 50 152 50
16 3 18 F 1 6 148 50 148 50 148 50 148 50
17 3 28 M 1 8 144 50 160 50 170 50 170 50
18 3 20 F 3 8 136 50 136 50 144 50 144 50
19 3 20 M 1 6 160 50 160 50 160 50 160 50
20 3 33 M 4 7 160 50 160 50 160 50 168 50
21 3 34 M 1 7 144 50 152 50 152 50 160 50
22 3 27 M 1 8 144 50 144 50 144 50 144 50
23 3 18 F 1 6 152 50 168 50 176 50 176 64
24 3 36 F 1 5 160 50 176 50 184 52 184 76
25 3 50 M 2 7 152 50 168 50 176 54 184 82
26 3 45 M 2 6 152 50 152 50 168 50 192 86
27 3 30 M 1 6 144 50 144 50 144 50 144 50
28 3 35 M 2 5 120 50 120 50 120 50 120 50
29 3 35 F 3 5 152 50 152 50 176 50 184 50
30 3 30 M 1 6 168 50 168 50 168 50 168 50
31 3 29 M 2 6 108 50 108 50 108 50 108 50
32 3 18 M 1 7 160 50 174 50 174 58 174 60
33 3 45 M 2 8 168 50 168 50 168 50 184 50
34 3 24 M 1 5 118 50 118 50 118 50 118 50
MOI, Mode of injury: 1=fall from height, 2=road traffic accident, 3=weight over back and 4+5= others; TLISS, Thoraco-lumbar Injury Severity Scale and Score.