19th edition ...$100 $200 $300 $400 $500 $600 $700 investment recordkeeping administration total...
TRANSCRIPT
www.401ksource.com
19th Edition

www.401ksource.com 1
TABLE OF CONTENTS
About the 401k Averages Book . . . . . . . . . . . . . . . . . . . . . . . . . . . . . . . . . . . . . . 2
How the 401k Averages Book is Organized . . . . . . . . . . . . . . . . . . . . . . . . . . . . . 3
Licensing Options from the 401k Averages Book . . . . . . . . . . . . . . . . . . . . . . . . 4
How to Use the 401k Averages Book. . . . . . . . . . . . . . . . . . . . . . . . . . . . . . . . . . 5
Five Steps to Comparing Your 401(k) Plan. . . . . . . . . . . . . . . . . . . . . . . . . . . . . . 5
Frequently Asked Questions . . . . . . . . . . . . . . . . . . . . . . . . . . . . . . . . . . . . . . . . 6
$10,000 Average Account BalanceSection 1: 10 Participants and $100,000 in Assets. . . . . . . . . . . . . . . . . . . . 10
Section 2: 25 Participants and $250,000 in Assets. . . . . . . . . . . . . . . . . . . . 14
Section 3: 50 Participants and $500,000 in Assets. . . . . . . . . . . . . . . . . . . . 18
Section 4: 100 Participants and $1,000,000 in Assets . . . . . . . . . . . . . . . . . 22
Section 5: 200 Participants and $2,000,000 in Assets . . . . . . . . . . . . . . . . . 26
Section 6: 500 Participants and $5,000,000 in Assets . . . . . . . . . . . . . . . . . 30
Section 7: 1,000 Participants and $10,000,000 in Assets. . . . . . . . . . . . . . . 34
Section 8: 2,000 Participants and $20,000,000 in Assets. . . . . . . . . . . . . . . 38
$50,000 Average Account BalanceSection 9: 10 Participants and $500,000 in Assets. . . . . . . . . . . . . . . . . . . . 44
Section 10: 25 Participants and $1,250,000 in Assets . . . . . . . . . . . . . . . . . . 48
Section 11: 50 Participants and $2,500,000 in Assets . . . . . . . . . . . . . . . . . . 52
Section 12: 100 Participants and $5,000,000 in Assets . . . . . . . . . . . . . . . . . 56
Section 13: 200 Participants and $10,000,000 in Assets . . . . . . . . . . . . . . . . 60
Section 14: 500 Participants and $25,000,000 in Assets . . . . . . . . . . . . . . . . 64
Section 15: 1,000 Participants and $50,000,000 in Assets. . . . . . . . . . . . . . . 68
Section 16: 2,000 Participants and $100,000,000 in Assets. . . . . . . . . . . . . . 72
$100,000 Average Account BalanceSection 17: 10 Participants and $1,000,000 in Assets . . . . . . . . . . . . . . . . . . 78
Section 18: 25 Participants and $2,500,000 in Assets . . . . . . . . . . . . . . . . . . 82
Section 19: 50 Participants and $5,000,000 in Assets . . . . . . . . . . . . . . . . . . 86
Section 20: 100 Participants and $10,000,000 in Assets . . . . . . . . . . . . . . . . 90
Section 21: 200 Participants and $20,000,000 in Assets . . . . . . . . . . . . . . . . 94
Section 22: 500 Participants and $50,000,000 in Assets . . . . . . . . . . . . . . . . 98
Section 23: 1,000 Participants and $100,000,000 in Assets. . . . . . . . . . . . . 102
Section 24: 2,000 Participants and $200,000,000 in Assets. . . . . . . . . . . . . 106

www.401ksource.com 3
HOW THE AVERAGES BOOK IS ORGANIZEDThe 401k Averages Book is designed to help you quickly identify the appropriate cost average by organizing the book into sections based on the number of plan participants, average account balance and total plan assets.
Most 401(k) plans cost structures are determined by a combination of four important variables, 1) total plan assets, 2) number of plan participants, 3) average participant accountbalances and 4) asset allocation.
The Averages Book illustrates specific scenarios for plans with 10, 25, 50, 100, 200, 500, 1,000, and 2,000 participants and average participant account balances of $10,000, $50,000, and $100,000.
The asset allocation for each scenario is: 44% Large Equity, 10% Stable Value, 7% International Equity, 8% Fixed Income, 31% Balanced/Target Date. The Balanced/Target Date allocation represents the average of the Balanced and Target Date investment options.
The Averages Book is derived from our database of 200 product offerings from 71 providers. Each plan scenario’s universe is made up of a subset of the 200 products. Products are placedin the appropriate universe(s) based on their target market. Thedata presented for each plan scenario is calculated by averagingthe costs for each product in the universe. The number of
products in each universe is indicated at the bottom of the first page of each section.
The Frequently Asked Questions section provides answers to the reader’s most commonly asked questions. If the answer to your question is not found in the FAQ section then all other questions about the 401k Averages Book will be answered by e-mail and should be sent to [email protected].
Sections 1 through 8 offer average cost data on specific plan size scenarios for plans with $10,000 average account balances. Sections 9 through 16 offer average cost data on specific plan size scenarios for plans with $50,000 average account balances. Sections 17 through 24 offer average cost data on specific plan size scenarios for plans with $100,000 average account balances.
To save you time the sections are organized in a practical and easy to use format. First, at the beginning of each section you will find Comments highlighting key data points found in the section. Next, charts x.1–x.3 illustrate total plan and average per participant costs. Chart x.4, illustrates the median and cost quartiles for each universe, while Chart x.5 shows the range of per participant costs. Charts x.6–x.8 illustrate total plan and average per participant costs while splitting the investmentexpense into net investment and revenue sharing. Charts
x.9–x.10 illustrate average investment costs and their ranges.
Comments and Charts for Section 1–24:Comments
x.1 Average Plan Cost as a Percentage of Assets
x.2 Percentage Breakdown of Plan Costs
x.3 Average Plan Cost Per Participant
x.4 Investment and Total Bundled Cost Quartiles
x.5 Range of Per Participant Costs
x.6 Average Plan Cost as a Percentage ofAssets (Illustrating Net Investment and Revenue Sharing Split)
x.7 Percentage Breakdown of Plan Costs(Illustrating Net Investment and Revenue Sharing Split)
x.8 Average Plan Cost Per Participant(Illustrating Net Investment and Revenue Sharing Split)
x.9 Range of Investment Costs
x.10 Range of Investment Costs

www.401ksource.com56
SEC
TIO
N 1
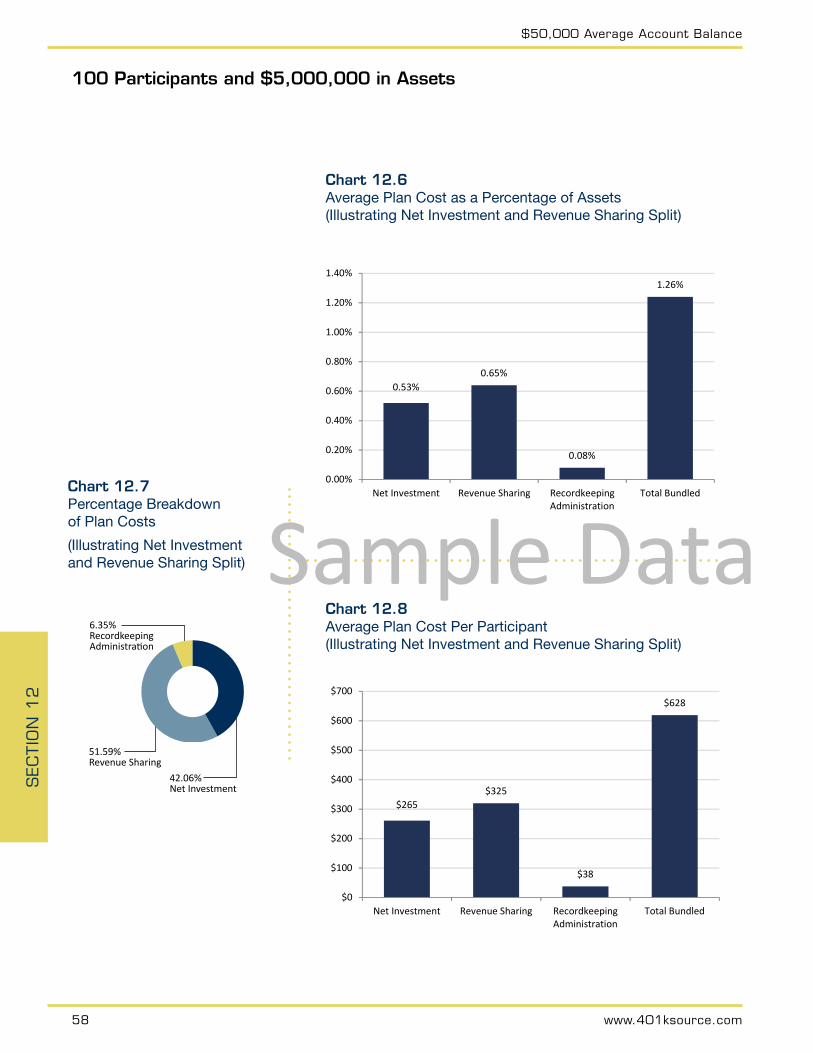
2$50,000 Average Account Balance
100 Participants and $5,000,000 in Assets
Chart 12.2Percentage Breakdown of Plan Costs
Universe consists of 67 different products.
6.35%Recordkeeping Administration
93.65%Investment
Chart 12.1Average Plan Cost as a Percentage of Assets
CommentsTotal Plan Cost per participant is $628.
Average Investment Expense is 1.18% of assets.
Average Total Bundled Expense is 1.26% of assets.
Investment Expense accounts for 93.65% of total plan costs.
Chart 12.3Average Plan Cost Per Participant
Avg Section 12 Chart 3Investment $581 50k 100 partRecordkeep $38Total Bund $619
$590
$38
$628
$0
$100
$200
$300
$400
$500
$600
$700
Investment RecordkeepingAdministration
Total Bundled
Avg Section 12 Chart 1Investment 1.16% 50k 100 partRecordkeep 0.08%Total Bund 1.24%
1.18%
0.08%
1.26%
0.00%
0.20%
0.40%
0.60%
0.80%
1.00%
1.20%
1.40%
Investment RecordkeepingAdministration
Total Bundled
Sample Data

www.401ksource.com 57
SEC
TIO
N 1
2$50,000 Average Account Balance
100 Participants and $5,000,000 in Assets
Chart 12.4Investment and Total Bundled Cost Quartiles
Chart 12.5Range of Per Participant Costs
Low Avg High Section 12 Chart 5Investment $124 $581 $804 50k 100 partRecordkeep $0 $38 $260Total Bundl $227 $619 $832
$126
$0
$227
$590
$38
$628
$806
$262
$834
$0
$100
$200
$300
$400
$500
$600
$700
$800
$900
Investment Recordkeeping Administration Total Bundled
Low
Avg
High
4th Quartile
3rd Quartile
2nd Quartile
1st Quartile
Low
Avg
High
19th Quartile Charts 1‐24
100 Participants and $5,000,000 in Assets
1.24% 1.27%
0.28%
0.49%
1.02% 1.07%
1.31%1.44%
1.60% 1.68%
0.00%
0.20%
0.40%
0.60%
0.80%
1.00%
1.20%
1.40%
1.60%
1.80%
Investment Total Bundled
4th Quartile
3rd Quartile
2nd Quartile
1st Quartile
Sec 12
Sample Data
www.401ksource.com58
SEC
TIO
N 1
2
Chart 12.7Percentage Breakdown of Plan Costs
(Illustrating Net Investment and Revenue Sharing Split)
$50,000 Average Account Balance
100 Participants and $5,000,000 in Assets
42.06%Net Investment
51.59%Revenue Sharing
6.35%Recordkeeping Administration
Chart 12.6Average Plan Cost as a Percentage of Assets(Illustrating Net Investment and Revenue Sharing Split)
Chart 12.8Average Plan Cost Per Participant (Illustrating Net Investment and Revenue Sharing Split)
Avg Section 12 Chart 6Net Investm 0.52% 50k 100 partRevenue Sh 0.64%Recordkeep 0.08%Total Bund 1.24%
0.53%0.65%
0.08%
1.26%
0.00%
0.20%
0.40%
0.60%
0.80%
1.00%
1.20%
1.40%
Net Investment Revenue Sharing RecordkeepingAdministration
Total Bundled
Avg Section 12 Chart 8Net Investm $261 50k 100 partRevenue Sh $320Recordkeep $38Total Bund $619
$265$325
$38
$628
$0
$100
$200
$300
$400
$500
$600
$700
Net Investment Revenue Sharing RecordkeepingAdministration
Total Bundled
Sample Data
www.401ksource.com 59
SEC
TIO
N 1
2
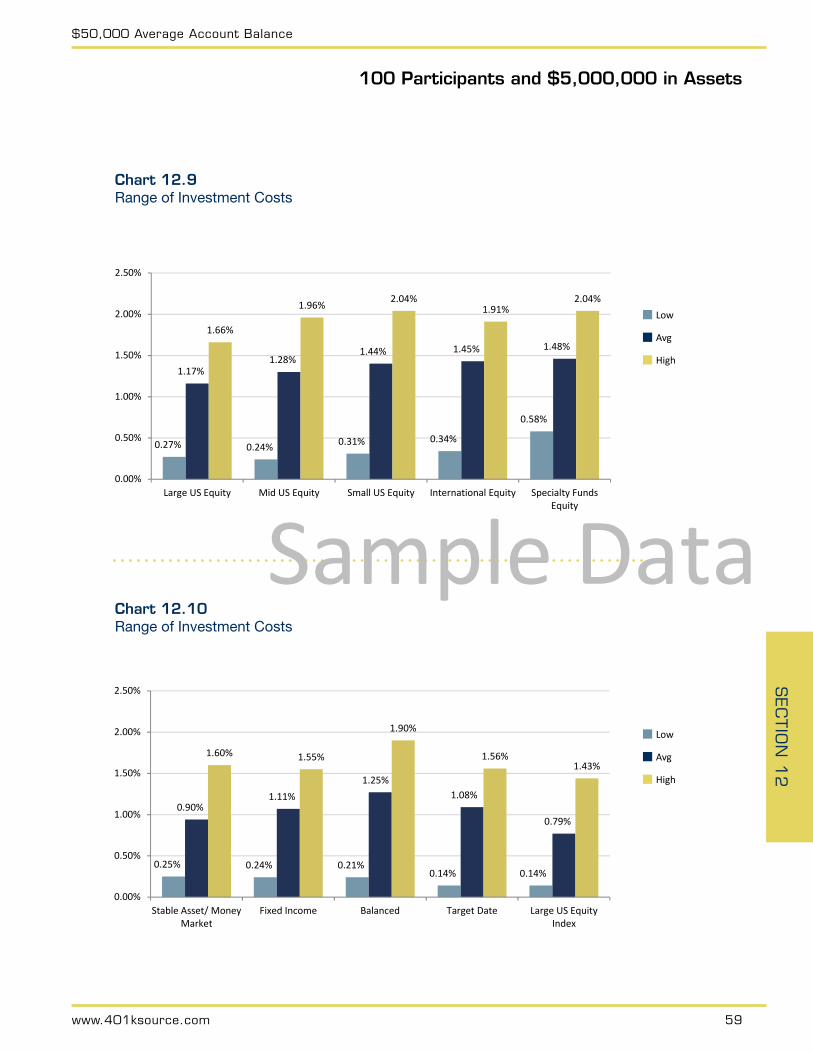
Chart 12.10Range of Investment Costs
Chart 12.9Range of Investment Costs
$50,000 Average Account Balance
100 Participants and $5,000,000 in Assets
Low Avg High Section 12 Chart 9Large US Eq 0.27% 1.16% 1.66% 50k 100 partMid US Equ 0.24% 1.30% 1.96%Small US Eq 0.31% 1.40% 2.04%Internation 0.34% 1.43% 1.91%Specialty Fu 0.58% 1.46% 2.04%
0.27% 0.24% 0.31% 0.34%
0.58%
1.17%1.28%
1.44% 1.45% 1.48%1.66%
1.96% 2.04%1.91%
2.04%
0.00%
0.50%
1.00%
1.50%
2.00%
2.50%
Large US Equity Mid US Equity Small US Equity International Equity Specialty FundsEquity
Low
Avg
High
Low
Avg
High
Low
Avg
High
Low Avg High Section 12 Chart 10Stable Asse 0.25% 0.94% 1.60% 50k 100 partFixed Incom 0.24% 1.07% 1.55%Balanced 0.24% 1.27% 1.90%Target Date 0.14% 1.09% 1.56%Large US Eq 0.14% 0.77% 1.44%
0.25% 0.24% 0.21%0.14% 0.14%
0.90%1.11%
1.25%1.08%
0.79%
1.60% 1.55%
1.90%
1.56%1.43%
0.00%
0.50%
1.00%
1.50%
2.00%
2.50%
Stable Asset/ MoneyMarket
Fixed Income Balanced Target Date Large US EquityIndex
Low
Avg
High
Sample Data