1993 user's guide to national wetlands inventory maps ... · user's guide to national...
TRANSCRIPT

USER'S GUIDE
to
NATIONAL WETLANDS INVENTORY MAPS (Region 3)
and to
"Classification of Wetlands
Deepwater Habitats of the United States"
prepared by
KIM M. SANTOS JOAN E. GAUSTER
U.S. Fish and Wildlife Service National Wetlands Inventory'
REGION 3 4101 E. 80th Street
Bloomington, Minnesota 55425
JUNE 1993
'" 1
TABLE OF CONTENTS
Region 3 Map
Introduction .
Classification Definition of Wetlands and Deepwater Habitats . Objectives The Hierarchical Structure •
Figure 1. Classification Hierarchical of Wetlands and Deepwater Habitats
Plants and Soils . Wetland Plants .. Hydric Soils .
National Wetlands Inventory Farmed Wetlands Map Preparation
Photointerpretation . Field Investigation . Review of Existing Information Quality Control of Photointerpretation . Draft Map Production • Interagency Review Final Map Production
How to Read National Wetlands Inventory Maps
Figure 2. Example of National Wetlands Inventory Map Symbology.
User Caution
Map Distribution
Table 1. Examples of Selected National Wetland Inventory Classifications
1
1 2 2
3
4 4 4
5 5 5 6 6 6 6 6 6 6
6
6
7
7
8
Table of Contents (Continued)
Digital Data .
Figure 3. Status Map of National Wetlands Inventory
Figure 4. Status Map of National Wetlands Inventory Digital Data
NWI Acreage Reports .
Wetland Trends.
Special Projects - Atlases
Wetland Values Database
Product Acquisition. Maps. Digital Data. Lists of Wetland Plant Species . Hydric Soil Information . Wetland Classification System. Wetland Classification Sliderrape Show Wetland Status and Trends Reports Chicago Metro Area Atlas Wetland Values Database Additional 'nformation .
Appendix A. Interpretation of National Wetland Inventory Maps
Figure 5. Interpretation of Wetland Line Work
Figure 6. Line Work
Figure 7. Line Work
Figure 8. National Wetlands Inventory Map
9
10
11
12
12
12
13
14 14 15 15 16 16 16 17 17 18 18
19
20
21
22
23
Appendix B. NWI Map Codes and the Wetland Classification System 24

Table of Contents (Continued)
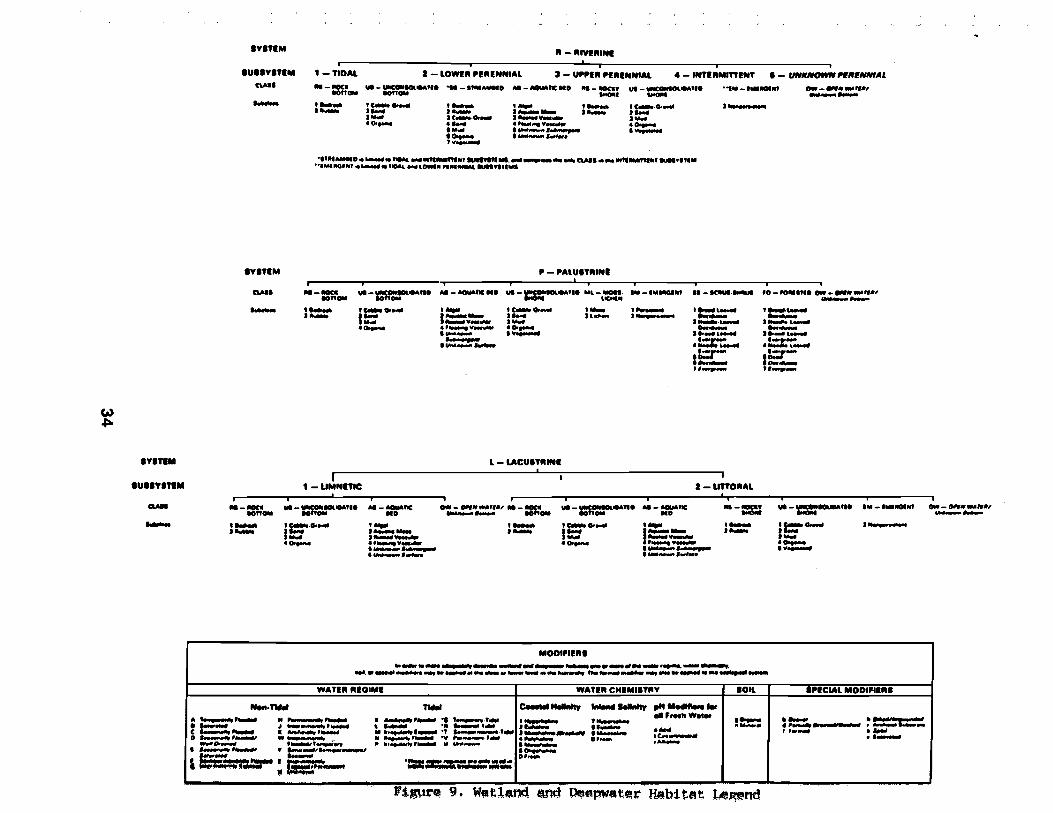
Figure 9. Wetland and Deepwater Habitat Legend 34
Appendix C. List of Regional Offices and Regional Wetlands Coordinators. 35 List of Regions and Map 36
References Cited 37
Other Sources Used 38
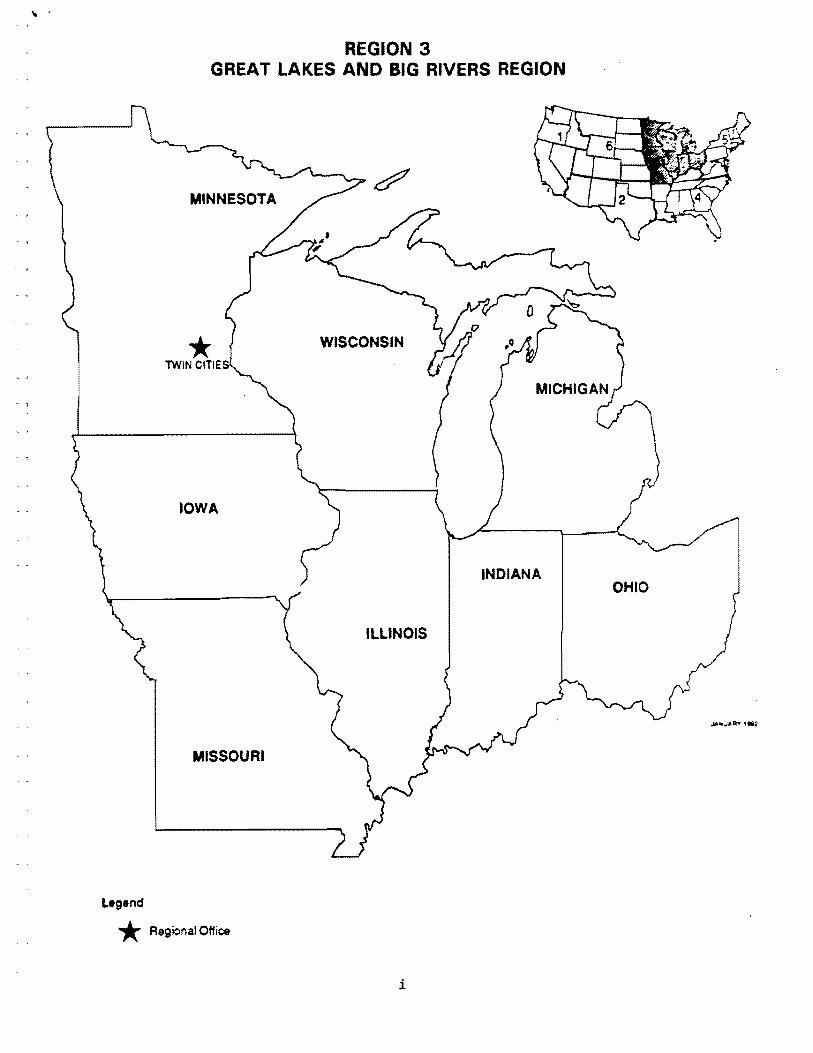
REGION 3 GREAT LAKES AND BIG RIVERS REGION
* WISCONSIN
IOWA
INDIANA
ILLINOIS
MISSOURI
Legend * Regional Office
i

INTRODUCTION
The U.S. Fish and Wildlife Service (Service) is conducting an inventory of the extent and characteristics of the wetlands of the United States and its territories. This National Wetlands Inventory (NWI) is establishing a wetland data base in map and digital form for the entire country. The inventory involves classifying the Nation's wetlands, Cowardin et aI., producing wetland maps, and developing statistics on the status of wetlands in the United States, and special reports.
The NWI has completed the inventory, or is in progress for the States of Illinois, Indiana, Minnesota, Michigan, Missouri, Iowa and Ohio. The State of Wisconsin has conducted their own wetlands inventory. A large portion of the Region has been entered into a computerized database using Geographic Information System (GIS) technology.
The purpose of this guide is to provide NWI users with information on how to use and interpret NWI maps and the Cowardin classification system, as well as to provide an overview of the NWI. The text is broken down into two major headings: (1) Classification; and (2) National Wetlands Inventory. Graphics and legends are incorporated, including appendices on interpretation of National Wetlands Inventory maps and detailed definitions of the Cowardin classification system.
CLASSIFICATION
DffiNITION OF WETLANDS AI\ID DEEPWATER HABITATS
"Wetlands If include a variety of wet habitats commonly called marshes, sloughs, mud flats, and swamps. They are lands where saturation with water or periodic flooding during the growing season determines the nature of soil development and types of plants and animals living there.
The Service publication, "Classification of Wetlands anad Deepwater Habitats of the United States," Cowardin et al. (1979)' defines wetlands as:
•. .Iands transitional between terrestrial and aquatic systems where the water table is usually at or near the surface or the land is covered by shallow water. For purposes of this classification, wetlands must have one or more of the following attributes: (1) at least periodically, the land supports hydrophytes; (2) the substrate is predominately undrained hydric soil; or (3) the substrate is nonsoil and is saturated with water or covered by shallow water at some time during the growing season of each year.
Areas of deep water, traditionally not considered wetlands, are included in the classification system as deepwater habitats. Deepwater habitats are:

- ,
.. -;
- j
- ,
... permanently flooded lands lying below the deepwater boundary of wetlands. Deepwater habitats include environments where surface water is permanent and often deep, so that water, rather than air, is the principal medium within which the dominant organisms live, whether or not they are attached to the substrate.
OBJECTIVES
The classification system was developed to meet four long-range objectives: (1) to describe ecological units that have certain homogeneous natural attributes; (2) to arrange these units in a system that will aid decisions about resource management; (3) to furnish units for inventory and mapping; and (4) to provide uniformity in concepts and terminology throughout the United States. The National Wetlands Inventory uses this classification system to classify and delineate wetlands and deepwater habitats.
THE HIERARCHICAL STRUCTURE
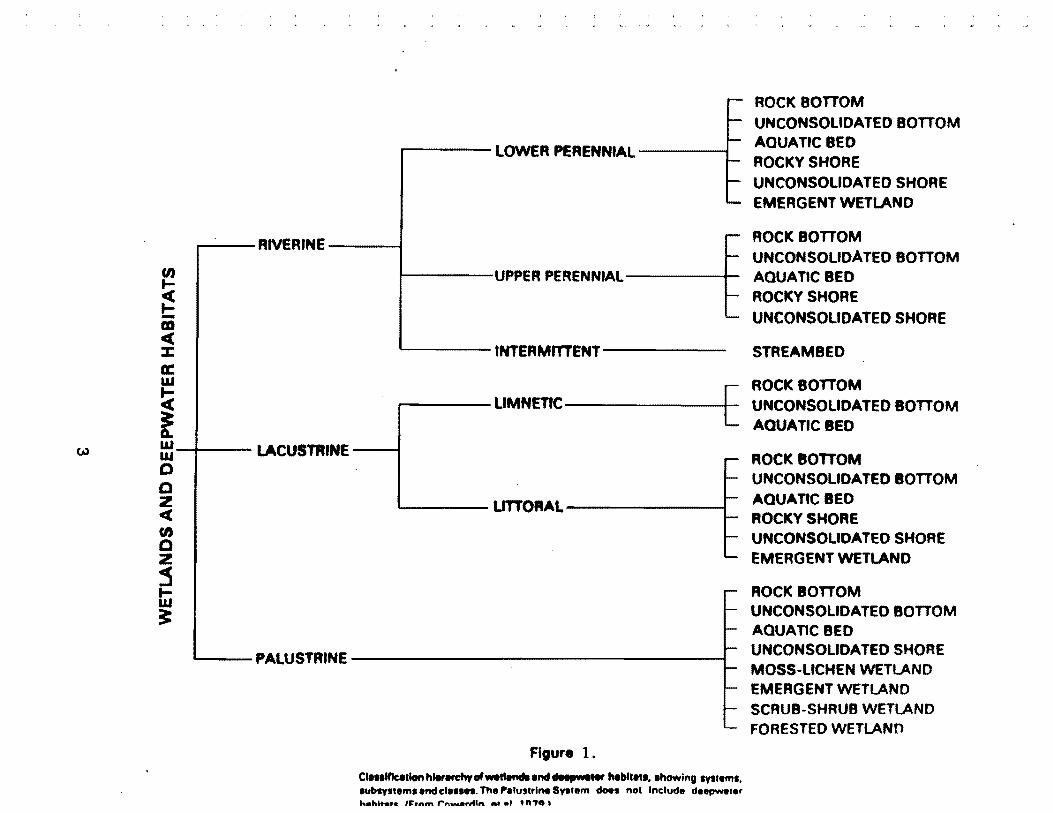
The classification system is hierarchical (Figure 1)' with wetlands and deepwater habitats divided among five major Systems at the broadest level:
Palustrine shallow ponds, marshes, swamps, sloughs),
Lacustrine (lakes and deep ponds),
Riverine (rivers, creeks, and streams),
Estuarine (salt marshes and brackish tidal water), and
Marine (open ocean and associated coastline).
Systems are subdivided into Subsystems which reflect hydrologic conditions (e.g. Lower Perennial, Upper Perennial, and Intermittent in the Riverine System). Below the Subsystem is the Class, which describes the general appearance of the wetland in terms of either the dominant life form of the vegetation (e.g. Forested, Aquatic Bed, etc.) or the composition of the substrate (e.g. Rock Bottom, Unconsolidated Shore, etc.). Each Class is further subdivided into Subclasses which are finer differences in vegetation life forms (e.g. Broad-leaved Deciduous, Needleleaved Evergreen, etc.) or in substrate material (e.g. Cobble-Gravel, sand, etc.). Dominance Types are determined on the basis of dominant plant and animal species. (This level is omitted in the NWI). The classification system also includes Modifiers to describe hydrology (water regime), soils, water chemistry (pH, salinity) and special modifiers relating to human or animal influences (e.g. diked, impounded, partly drained, beaver).
See Appendix B for the Systems that occur in Region 3 and for additional information.
2
RIVERINE
en I-
~ -ID c( :::w:: a: w
i w w LACUSTRINE w
C C Z c(
en C z ~ I-w ~
PALUSTRINE
r---- LOWER PEAENNIAl---~
t-----UPPER PERENNIAl-----+-
'-----INTERMITTENT-----
ROCK BOTTOM UNCONSOLIDATED BOTTOM AQUATIC BED ROCKY SHORE UNCONSOLIDATED SHORE EMERGENT WETLAND
ROCK BOTTOM UNCONSOLIDATED BOTTOM AQUATIC BED ROCKY SHORE UNCONSOLIDATED SHORE
STREAMBED
E ROCK BOTTOM
r-----LtMNETIC-------1-- UNCONSOLIDATED BOTTOM AQUATIC BED
'------LITTORAL-------~
Figure 1.
C .... lflcatlon hler.rehy of well ...... nd..,...., heblt.t., .howlng syst.ms, .ublJl'.m •• ndet ...... The ".Iustrl,.. SYlIlem doe. not Include deep_ler h.hl •• te 'I:.A .... rft-.a .. t4ln •• _t t "..,. ,
ROCK BOnOM UNCONSOLIDATED BOTTOM AQUATIC BED ROCKY SHORE UNCONSOLIDATED SHORE EMERGENT WETLAND
ROCK BOTTOM UNCONSOLIDATED BOTTOM AQUATIC BED UNCONSOLIDATED SHORE MOSS-LICHEN WETLAND EMERGENT WETLAND SCRUB-SHAUB WETLAND FORESTED WETLANO
- 1
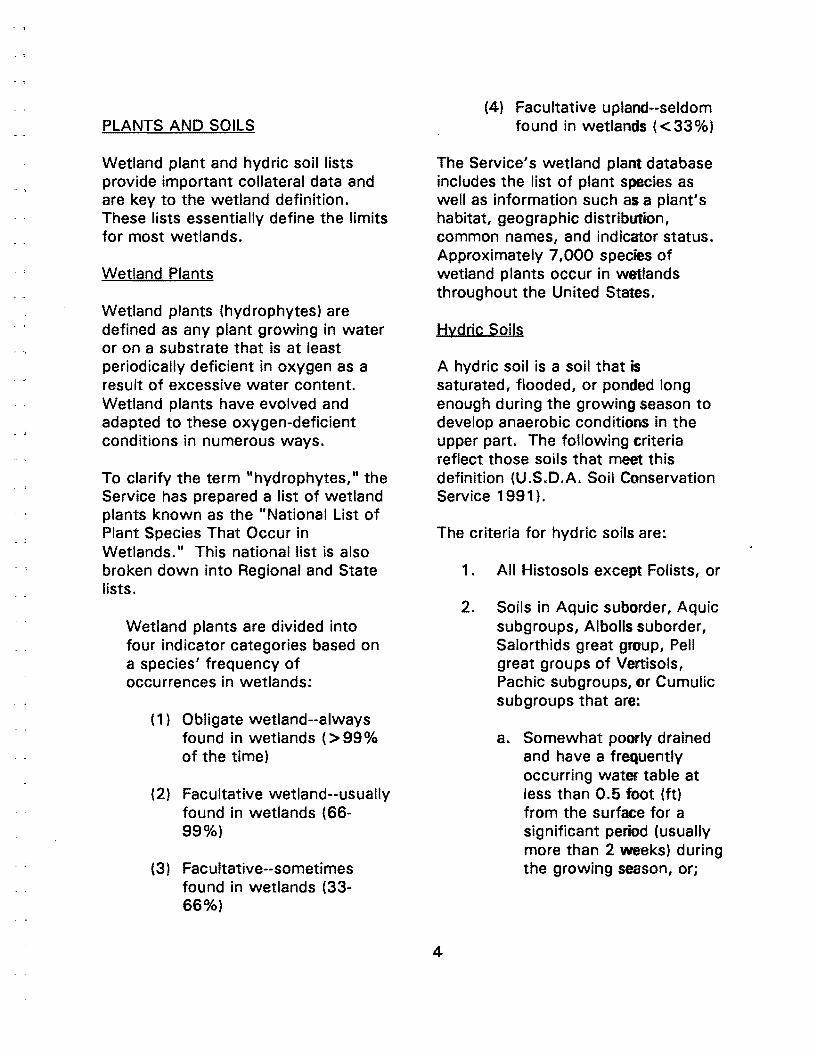
PLANTS AND SOILS
Wetland plant and hydric soil lists provide important collateral data and are key to the wetland definition. These lists essentially define the limits for most wetlands.
Wetland Plants
Wetland plants (hydrophytes) are defined as any plant growing in water or on a substrate that is at least periodically deficient in oxygen as a result of excessive water content. Wetland plants have evolved and adapted to these oxygen-deficient conditions in numerous ways.
To clarify the term "hydrophytes," the Service has prepared a list of wetland plants known as the "National List of Plant Species That Occur in Wetlands. It This national list is also broken down into Regional and State lists.
Wetland plants are divided into four indicator categories based on a species' frequency of occurrences in wetlands:
(1) Obligate wetland--always found in wetlands (> 99 % of the time)
(2) Facultative wetland--usually found in wetlands (66-99%)
(3) Facultative--sometimes found in wetlands (33-66%)
(4) Facultative upland--seldom found in wetlands «33%)
The Service's wetland plant database includes the list of plant species as well as information such as a plant's habitat, geographic distribution, common names, and indicator status. Approximately 7,000 species of wetland plants occur in wetlands throughout the United States.
Hydric Soils
A hydric soil is a soil that is saturated, flooded, or ponded long enough during the growing season to develop anaerobic conditions in the upper part. The following criteria reflect those soils that meet this definition (U.S.D.A. Soil Conservation Service 1991).
The criteria for hydric soils are:
4
1. All Histosols except Folists, or
2. Soils in Aquic suborder, Aquic subgroups, Albolls suborder, Salorthids great group, Pell great groups of Venisols, Pachic subgroups, or Cumulic subgroups that are:
a. Somewhat poorly drained and have a frequently occurring water table at less than 0.5 foot (ft) from the surface for a significant period (usually more than 2 weeks) during the growing season, or;

b. poorly drained or very poorly drained and have either:
(1) a frequently occurring water table at less than 0.5 ft from the surface for a significant period (usually more than 2 weeks) during the growing season if textures are coarse sand, sand, or fine sand in all layers within 20 inches (in), or for other soils;
(2) a frequently occurring water table at less than 1.0 ft from the surface for a significant period (usually more than 2 weeks) during the growing season if permeability is equal to or greater than 6.0 in/horizon (h) in all layers within 20 in, or;
(3) a frequently occurring water table at less than 1.5 ft from the surface for a significant period (usually more than 2 weeks) during the growing season if permeability is less than 6.0 in/h in any layer within 20 in, or;
3. Solis that are frequently ponded for long duration or very long duration during the growing season, or;
4. Soils that are frequently flooded for long duration or very long duration during the growing season.
To clarify the meaning of "hydric" soils, a list of the Nation's soils with actual or high potential for hydric conditions is being prepared by the Soil Conservation Service (SCS).
NATIONAL WETLANDS INVENTORY (NWI)
FARMED WETLANDS
It is the policy of the Service to not map farmed wetlands in the NWI (Region 3) unless the wetland is a pothole-like depression or cranberry bog. Therefore, NWI maps may have various amounts of wetlands which have been intentionally omitted from the inventory. These omitted wetlands are likely to be farmed at the time of the photography. Wetlands of this type commonly occur within floodplains.
MAP PREPARATION
Wetland classifications and delineations are produced by photointerpretation of high altitude aerial photography. The aerial photography used for the mapping in recent years has been color infrared, usually at a scale of 1 :58,000 and
5
1 :40,000. Black and white photography at a scale of 1 :80,000 was used previous to the availability of color infrared. Wetland boundaries and classification labels were interpreted stereoscopically from these aerial photographs after spot checks in the field.
A series of 1 :24,000 scale wetland maps were produced from the delineated aerial photographs. The NWI wetland maps are graphic representations, on U.S.Geographic Survey (USGS) 7.5' base maps, of location and configuration of wetlands and deepwater habitats found in the study area. There was no minimum size limit for mapping the wetlands.
The inventory proceeds by the following steps:
Photointerpretation. This effort is contracted out to universities, states, or private contractors.
Field Investigation. The Service investigates and field checks selected areas with a photointerpretation contractor.
Review of Existing Information. Collateral information such as soil surveys, USGS topographic maps, and field notes are used to help interpret wetlands from aerial photographs.
Quality Control of Photointerpretation. In each region, the Service quality controls and approves the aerial photo delineation. The photos are also quality controlled for national consistency in the national office in St. Petersburg, Florida.
Draft Map Production. Draft map review product.
Interagency Review. Draft maps are sent to reviewing agencies for comment and input. Spot checks are conducted by the Service.
Final Map Production. Final map product.
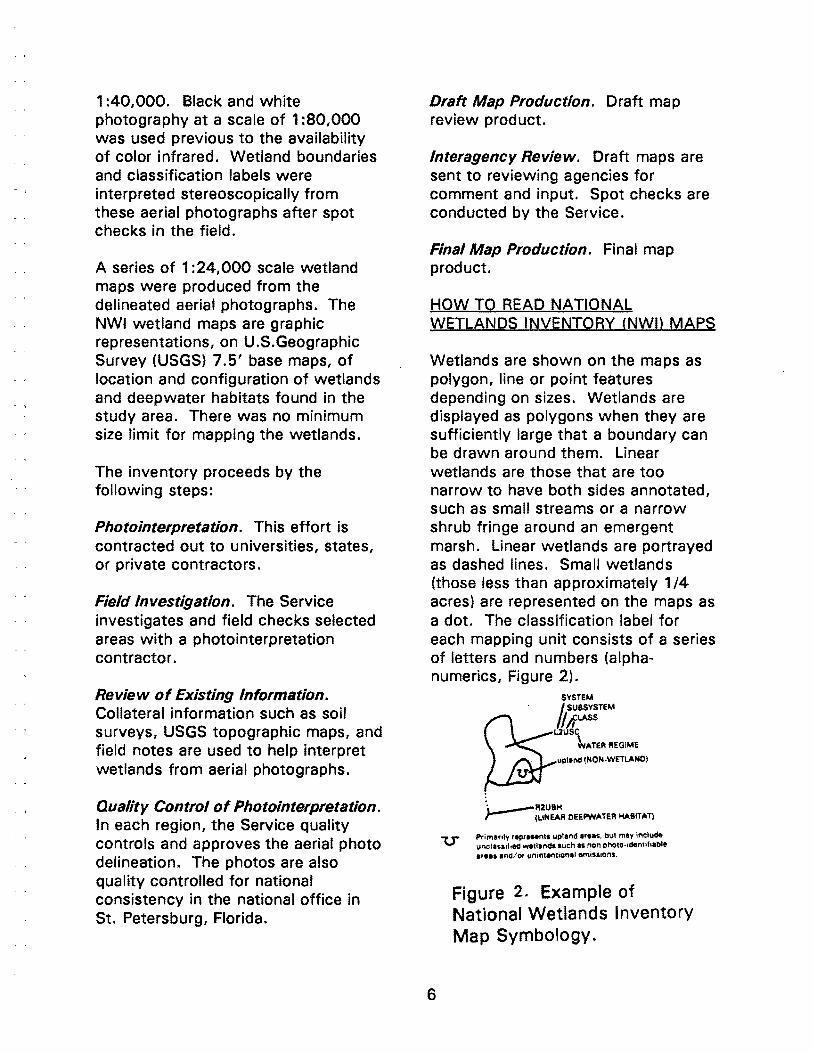
HOW TO READ NATIONAL WETLANDS INVENTORY (NWI) MAPS
Wetlands are shown on the maps as polygon, line or point features depending on sizes. Wetlands are displayed as polygons when they are sufficiently large that a boundary can be drawn around them. Linear wetlands are those that are too narrow to have both sides annotated, such as small streams or a narrow shrub fringe around an emergent marsh. Linear wetlands are portrayed as dashed lines. Small wetlands (those less than approximately 1/4 acres) are represented on the maps as a dot. The classification label for each mapping unit consists of a series of letters and numbers (alphanumerics, Figure 2).
6
SYSTEM
. LI;F~~TEM
~au~c
~ATER REGIME
. 11 upland (NON·WETLAND)
L---Ft2U8H ,-- (I.INEAR DEEPWATER HABITAT)
Primarily rotpreHnts upland areas. bU1 may include V unclauif,ed _"ends such II nlln photll·.,:lenlih.ble
ar •• , Ind/or .... nintention.1 omissions.
Figure 2. Example of National Wetlands Inventory Map Symbology.
The first letter represents the System and subsequent alpha-numerics represent, in sequential order, the subordinate levels of classification detail down to Special Modifiers (the Dominant plant level is omitted in the NWI). Where Classes and/or Subclasses have been mixed, they are separated by a diagonal line. Examples of NWI classifications are shown in Table 1. Figure 9 shows the complete NWI map legend used in Region 3.
See Appendix A for interpretation of NWI maps.
USER CAUTION
When using NWI maps, it is important to remember that the NWI is inventorying all wetlands without emphasis on any particular type or location nor is it restricted to wetlands regulated by Federal, State, or local regulatory agencies. Because of possible technical differences in concept and the requirement to consider the additional statutory criteria for determinations of jurisdiction, the following special note is contained on all NWI map products:
The map documents were prepared primarily by stereoscopic analysis of high altitude aerial photographs. Wetlands were identified on the photographs based on vegetation, visible hydrology, and geography. The aerial photographs typically reflected conditions during the specific year and season when they were taken. In addition, there is a margin of error inherent in the
use of aerial photographs. Thus a detailed on-the-ground and historical analysis of a single site may result in revisions of the wetland boundaries established through photographic interpretation. In addition, some small wetlands and those obscured by dense forest cover may not be included in the map document.
Federal, State, and local regulatory agencies with jurisdiction over wetlands may define and describe wetlands in a different manner than that used in this inventory. There is no attempt, in either the design or the products of this inventory, to define limits of proprietary jurisdiction of any Federal, State, or local government or to establish the geographical scope of regulatory programs of government agencies. Persons intending to engage in activities involving modifications within or adjacent to wetland areas should seek the advice of appropriate Federal, State, or local agencies concerning specific agency regulatory programs and proprietary jurisdiction that may affect such activities.
MAP DISTRIBUTION
The National Wetlands Inventory has distributed about 1.5 million maps nationally since they were first introduced. Common map users include individuals, private organizations, industry, consulting firms, developers, agencies from all levels of government (municipal, town, county, state, and federal), and
7

Table 1. EXAMPLES OF SELECTED NATIONAL WETLAND INVENTORY CLASSIFICATIONS
NWI CQDE SYSTEM, SUBSYSIEM WEILAND ~LA~IS * WATER REylME SPECIAL CLASS, SUBCLASS MODIFIER
r 1
PEMAd Palustrine (P) Xanthium .lQQ. - Temporary Partially Emergent (EM) cocklebur Flooded (A) drained (d)
Rumex .lQQ. - dock
PF01C Palustrine (P) ~ nlgrg - black Seasonally None Forested (FO) willow Flooded (C) Broad-leaved Acer negundo -Deciduous (1) boxelder
r 1
PSS1A Palustrine (P) Alnus rugosa- Temporary None - ; Scrub-Shrub (SS) speckled alder Flooded (A)
Broad-leaved Salix spp.-willow Deciduous (1)
L1UBHh Lacustrine (L) None Permanently diked or Limnetic (1) Flooded (H) impounded
(h) Unconsolidated Bottom (UB)
R2ABHx Riverine (R) Nuphar odorala- Permanently Excavated (x)
Lower Perennial (2) water lily Flooded (H) Aquatic Bed (AB)
*Not included in mapping
8

r ,
educational and research groups, such as universities and colleges.
NWI maps provide resource managers with information on wetland location and type, which is essential to effective habitat management and acquisition of important wetland areas needed to perpetuate waterfowl populations and other migratory bird populations. The SCS, under the Department of Agriculture, uses NWI maps as a major tool in the identification of wetlands to administer Swampbuster provisions of the 1985 and 1990 Farm Bills. Regulatory agencies, such as the U.S. Army Corps of Engineers, Environmental Protection Agency, and state governments, also use NWI maps to help in advanced wetland identification and to determine wetland values and mitigation requirements. Planners, both public and private, use NWI maps to aid in formulating alternative plans to meet regulatory requirements. Private consultants are becoming one of our largest user groups. Today's consultants that are tuned into environmental issues are purchasing the maps in the early planning stages of their projects to reduce wetland related problems.
Information on how to order NWI maps is included under Product Acquisition.
The status (November 1992) of NWI mapping is shown on Figure 3.
9
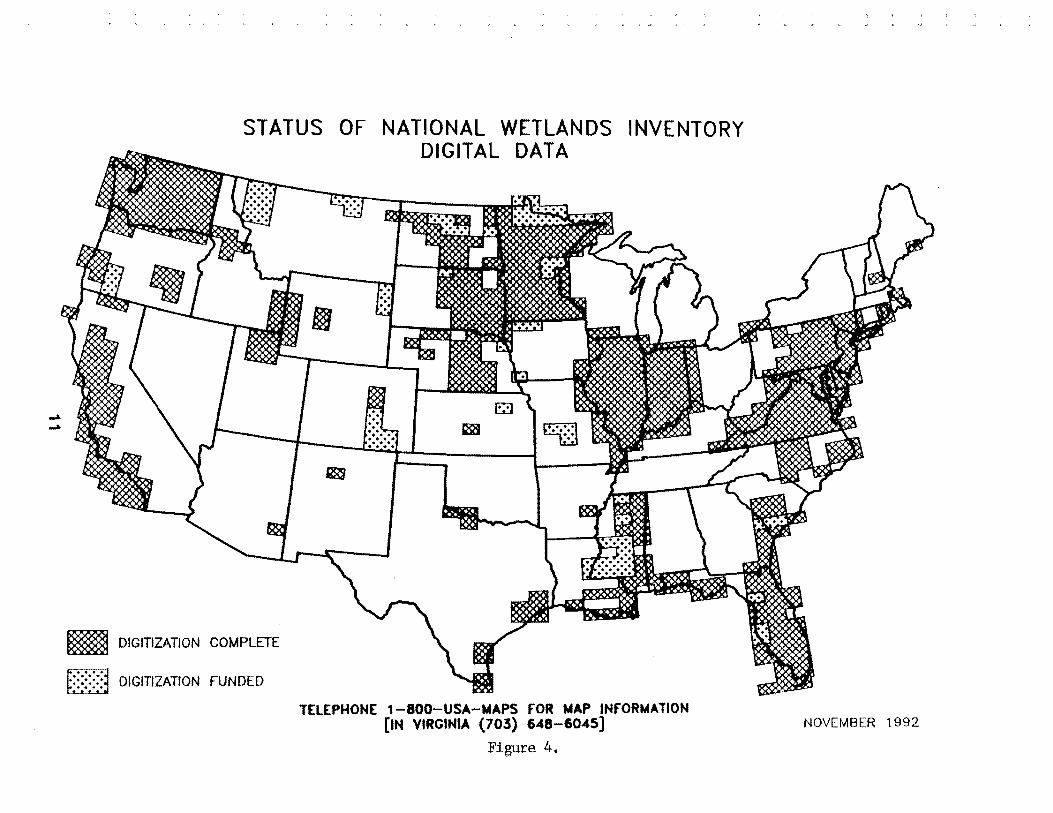
DIGITAL DATA
The National Wetlands Inventory is constructing a georeferenced wetland data base using GIS technologies. Three systems comprise the GIS: (1) The Wetlands Analytical Mapping System (WAMS) is a digitizing, editing, and data base management system; (2) the Map Overlay and Statistical System (MOSS) is a geographic analysis system, and (3) the Cartographic Output System (COS) is a cartographic display system.
The data is provided on magnetic tape and available in DLG3-0PTIONAL, MOSSEXPOR~orGRASSda~ formats, by 1 :24,000 scale maps in digital form. The data can be written to 9 track tape, 1/4 inch cartridge or 8 mm cartridge.
In this region, statewide databases are available for Illinois and Indiana. Minnesota will have a complete digital database by September 1993. Some portions of Iowa and Missouri are also available as digital data. Figure 4 shows the status (November 1992) of digital data.
States are currently the big users of the digital data. However, in some cases, like in Minnesota, the local units of government are beginning to use the digital data. These uses at the local level include the implementation of the state wetland laws, planning, and zoning. The digital data is also being used for such

""" o
~
.'
STATUS OF NATIONAL WETLANDS INVENTORY
~
tx' ~
~
~ .-=~ ¢<:
~
IQO ~
1\
• ~ · .. · ..
· . · . · · . · · . · · . · · . · · . ·
0<
~ VI
m ~
«
.-=~
--~
~
••• -I.e
~
::::::: ... . .
~
~
~,::
" ....
~x"--
An IIF ~ ~'
m ~
.'.~
v mm DISTRIBUTION MAPS AVAILABLE .... .. :. r .. ~ DRAFT MAPS AVAILABLE
WORK UNDER CONTRACT
TELEPHONE 1 -800-USA-MAPS FOR ~AP INFORMATION [IN VIRGINI" (703) 648-6045]
Figure 3.
m ;.x.
~
~
NOVEMBER 1992
--. --.
STATUS OF NATIONAL WETLANDS INVENTORY DIGITAL OAT A
~ DIGITIZATION COMPLETE
TELEPHONE 1-800-USA-NAPS FOR NAP INFORMATION [IN VIRGINIA (703) 648-6045]
Figure 4. NOVEMBER 1992
applications as resource management planning, impact assessment, wetland trend analysis, and information retrieval.
NWI Acreage Reports
Wetland acreage information available from the Service's NWI is provided in hardcopy printouts and included with every digital data request. Acreage totals are calculated for each 7.5 minute quadrangle digitized by NWI. These totals are included in reports that list each quad's wetland attributes, each attribute's frequency and acreage totals for polygon data, frequency and length totals for linear data, and frequency totals for point data. These quad-by-quad totals are provided to the user grouped by 1:100,000 map unit.
Information on how to order NWI digital data is included under Product Acquisition.
WETLAND TRENDS
Another important function of the NWI has been the wetland trend studies and special reports to Congress. These studies showed an annual national loss of 458,000 acres of wetlands between the mid-1950's to mid-1970's (Frayer et. al 1983) and 290,000 acres annually between the mid-1970's to mid-1980's (Dahl and Johnson 1991). The trend information has had a major role in the development of some Federal policies regarding wetland conservation. Updated wetland status and trends information is now
12
Congressionally mandated by enactment of the Emergency Wetland Resources Act.
Region 3's wetland losses have been disproportionately greater than in other Regions. Since the 1780's, Region 3 has lost an estimated 40.5 million (63.6 percent) acres of wetlands out of its 63.7 million original wetland acres. This compares with an average loss of 52.8 percent nationwide. We have an estimated 23.2 million acres of wetland remaining in the Region--the second wettest Region (excluding Alaska) (Dahl 1990). We do not have current trend data in the Region which would indicate how fast these remaining acres are being lost.
SPECIAL PROJECTS - ATLASES
The National Wetlands Inventory of the U.S. Fish and Wildlife Service and the Illinois Department of Conservation, have produced an atlas of National Wetlands Inventory maps in the Chicago Metro Area. The atlas represents six counties in the Chicago Metro Area, and contains standard NWI 1 :24,000 scale maps reduced to an 1 1" x 14" format, and wetland and deepwater habitat acreage data summaries. The accompanying narrative includes the definition of wetlands and deepwater habitats, the wetlands classification system, how to read NWI maps, and descriptions of wetland plants and hydric soils. Graphics are also incorporated, including a map locator guide showing the location of each NWI map within the counties.

r l
r ,
Information on how to order the Chicago Metro Area Atlas is included under Product Acquisition.
WETLAND VALUES DATABASE
The Wetland Values Database was created to provide bibliographic citations for literature pertinent to wetland values and functions. It is intended to support the Fish and Wildlife Services efforts to identify and delineate wetlands. Currently there are nearly 15,000 records in the database. Records contain annotations describing the wetland value information in the individual papers and articles.
Each record contains a number of fields which can be searched for relevant information. These include:
Author Year of Publication Hydrologic Unit Number (USGS/Water Resource Council geographic area descriptor)
Land-Surface Form Location State US Army Corps of Engineers District Codes
Wetland Classifications (Cowardin, et al. 1979)
Ecoregion Codes (Bailey and Cushwa, 1982)
Subject Keywords Citation Annotation
Information on how to request a search of the database is included under Product Acquisition.
13

PRODUCT ACQUISITION
MAPS: Standard NWI maps (1 :24,000) may be ordered by quad name from:
1 . Earth Science Information Center U.S. Geological Survey 507 National Center Reston, Virginia 22092 Telephone: 1-800-USA-MAPS
2. State Distribution Centers:
Illinois
Wetlands Map Sales Coordinator Center for Government Studies Northern Illinois University DeKalb, Illinois 60115 Telephone: (815) 753-0914
Indiana
Indiana Department of Natural Resources Map Sales Division, W160 402 West Washington Street Indianapolis, Indiana 46204-2742 Telephone: (317) 232-4180
Michigan
Distribution Center 10B Agriculture Hall Michigan State University East Lansing, Michigan 48824-1039 Telephone: (517) 353-6740
Minnesota
Minnesota's Bookstore 117 University Avenue St. Paul, Minnesota 55155 Telephone: (612) 297-3000
1-800-657-3757
14
_ J
DIGITAL DATA
Mr. Jim Givens Ohio Department of Natural Resources Division of Soil & Water Conservation Fountain Square, Building E2 Columbus, OH 43224 Telephone: (614) 265-6770
Iowa, Missouri
Mr. Dennis Swartwout Cartographic Information Services 102-D Hasbrouck Lab University of Massachusetts Amherst, MA 01003 Telephone: (413) 545-0359
Wisconsin
Wisconsin DNR has conducted their own wetland inventory, CONTACT: Wisconsin Geological and Natural History Survey
Map Sales, 3817 Mineral Point Road Madison, WI 53705 Telephone: (608) 263-7389
Earth Science Information Center U.S. Geological Survey 507 National Center Reston, VA 22092 Telephone: 1-800-USA-MAPS
LISTS of WE-rLAND PLANT SPECIES
1. National List of Plant Species That Occur In Wetlands: 1988 National Summary (Stock Number 024-010-00682-0)
Superintendent of Documents U.S. Government Printing Office Washington, D.C. 20402 Telephone: (202) 783-3238
15
." i
2. National List of Plant Species That Occur in Wetlands: North Central (Region 3) (Stock Number PB 89-1287906/AS)
and
3. State Lists (by States)
National Technical Information Service 5285 Port Royal Road Springfield, VA 22161 Telephone: (703) 487-4650
HYDRIC SOIL INFORMATION
U.S.D.A. Soil Conservation Service. 1991. Hydric Soils of the United States. Washington, D.C. Miscellaneous Publication No. 1491. Copies of this publication can be obtained by contacting Maurice J. Mausbach, NTCHS, SCS, Room 152, Federal Building, 100 Centennial Mall North, Lincoln, NE 68508-3866 (Telephone: (402) 437-5423).
or
Contact the Soil Conservation Service, U.S. Department of Agriculture in your state.
WETLAND CLASSIFICATION SYSTEM
"Classification of Wetlands and Deepwater Habitats of the United States" Cowardin, et.al. 1979. U.S. Fish and Wildlife Service (FWS/OBS-79/31), Washington, D.C. 131 pp. GPO Stock Number 024 010 006 65-0
U.S. Government Printing Office Superintendent of Documents P.O. Box 371954 Pittsburgh, PA 15250-7954 Telephone: (202) 783-3238
WETLAND CLASSIFICATION SLiDEITAPE SHOW (Stock Number: A08847) National Audio Visual Center Customer Service 8700 Edgeworth Drive Capitol Heights, MD 20743-3701 Telephone: (301) 763-1891 Cost: $60.00
16

WETLAND STATUS AND TRENDS REPORTS
"Status and Trends of Wetlands and Deepwater Habitats in the Conterminous United States, 1950's to 1970's." Frayer, W.E., T.J. Monahan, D.C. Bowden and F.A. Graybill. 1983. Copies obtained at: Department of Forest and Wood SCiences, Colorado State University, Fort Collins 80523; Cost: $5.00
"Status and Trends in the Conterminous United States Mid~ 1970' s to Mid-1980's." Dahl, T.E. and C. E. Johnson. 1991. U.S. Department of the Interior, Fish and Wildlife Service, Washington, D.C. 28 pp.
and
"Wetlands Losses in the United States 1780's to 1980's." Dahl, T.E. 1990. U.S. Department of the Interior, Fish and Wildlife Service, Washington, D.C. 21 pp.
U.S. Government Printing Office Superintendent of Documents P.O. Box 371954 Pittsburgh, PA 15250-7954 Telephone: (202) 783~3238
CHICAGO METRO AREA ATLAS
U.S. Fish and Wildlife Service Chicago Metro Wetlands Office 1000 Hart Road, Suite 180 Barrington,lIIinois 60010 Telephone: (708) 381-2253
and
Wetlands Program Illinois Department of Conservation 524 So. 2nd Street Springfield, Illinois 62701-1787 Telephone: (217) 782-3751
17

~
1
1
1
I I
WETLAND VALUES DATABASE
For further information or to request a search of the database contact:
Wetland Values Database Administrator USFWS/NWI 9720 Executive Center Drive, Suite 101 St. Petersburg, FL 33702-2440 Telephone: (813) 893-3865 Fax: (813) 893-3860
ADDITIONAL INFORMATION
Ron Erickson/Kim Santos National Wetlands Inventory U.S. Fish and Wildlife Service 4101 East 80th Street Bloomington, MN 55425-1600 Telephone: (612) 725-3417
18
- 1
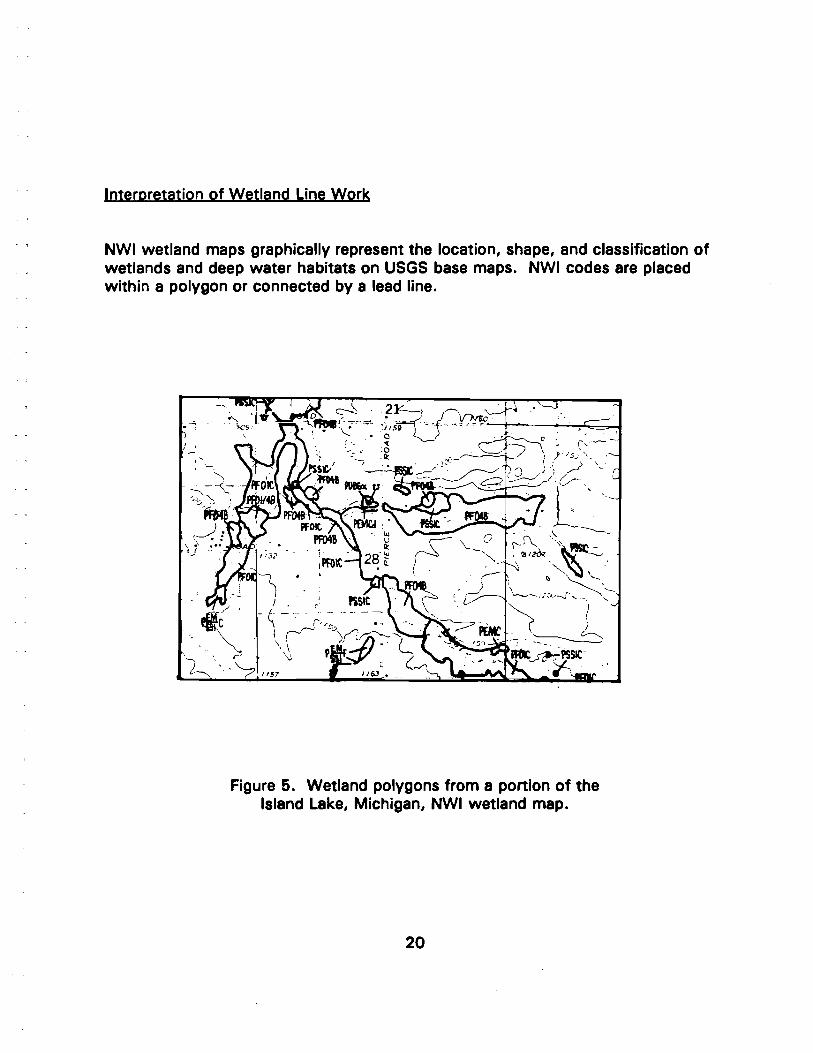
Interpretation of Wetland Line Work
NWI wetland maps graphically represent the location, shape, and classification of wetlands and deep water habitats on USGS base maps. NWI codes are placed within a polygon or connected by a lead line.
Figure 5. Wetland polygons from a portion of the Island Lake, Michigan, NWI wetland map.
20
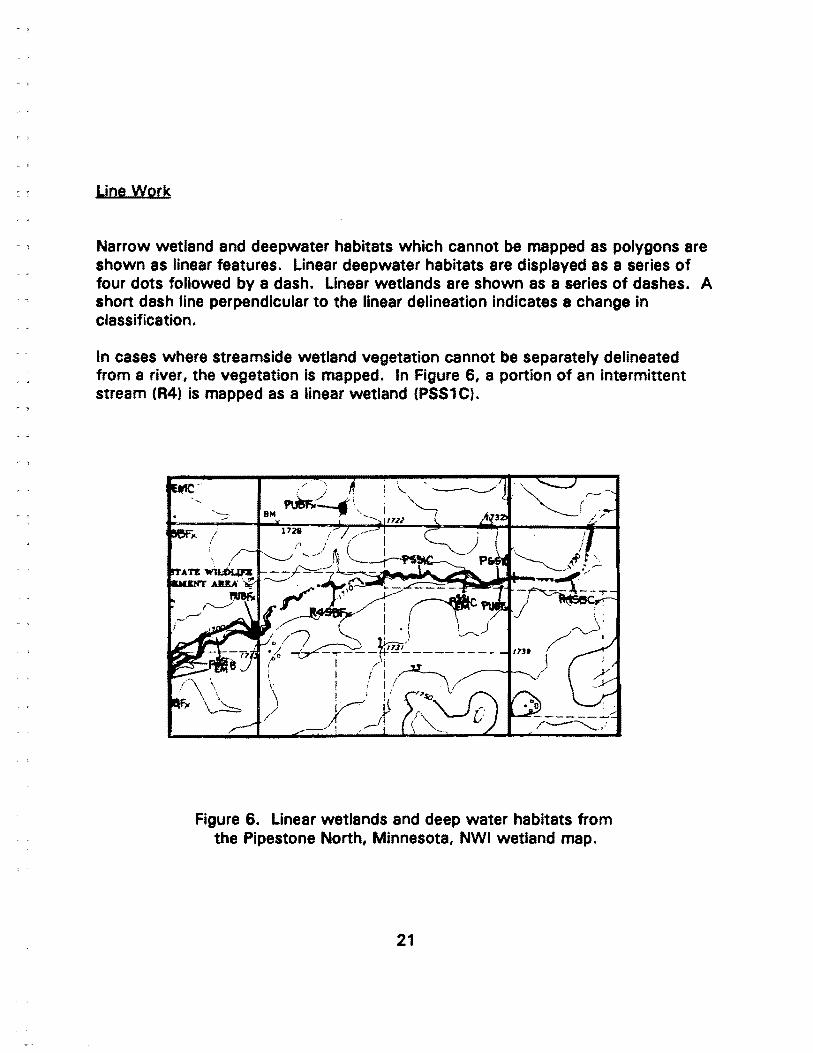
Line Work
Narrow wetland and deepwater habitats which cannot be mapped as polygons are shown as linear features. Linear deepwater habitats are displayed as a series of four dots followed by a dash. Linear wetlands are shown as a series of dashes. A short dash line perpendicular to the linear delineation indicates a change in classification.
In cases where streamside wetland vegetation cannot be separately delineated from a river, the vegetation is mapped. In Figure 6, a portion of an intermittent stream (R4) is mapped as a linear wetland (PSS1C).
Figure 6. Linear wetlands and deep water habitats from the Pipestone North, Minnesota, NWI wetland map.
21

Line Work
Linears may also form the boundary of wetlands and deepwater habitats. In Figure 7, a linear lower perennial river (R2) also serves as a boundary for adjacent wetland polygons.
.. . .' ""~'}
\,
- ~:!-.";- ~, - --.;--;;
Figure 7. A portion of the North Branch Volga River from the Maynard, Iowa, NWI wetland map.
22

NATIONAL WETLANDS INVENTORY . a.TIDlTATD _I~ Of TMI.-.-:III
... :.~~~';'~~~,:ili.~~~~~....l'\,= ....... k.~~~L...i-;;;":":,::"",--#~~""","~"",,,,,,~;;::-!, ...... _1IIIfJ .... -- ~."'"
Figure 8. A reduced standard (1: 24,0(0) NWI map of the Cyrus, .MN 7. 5 I quadrangle.
23
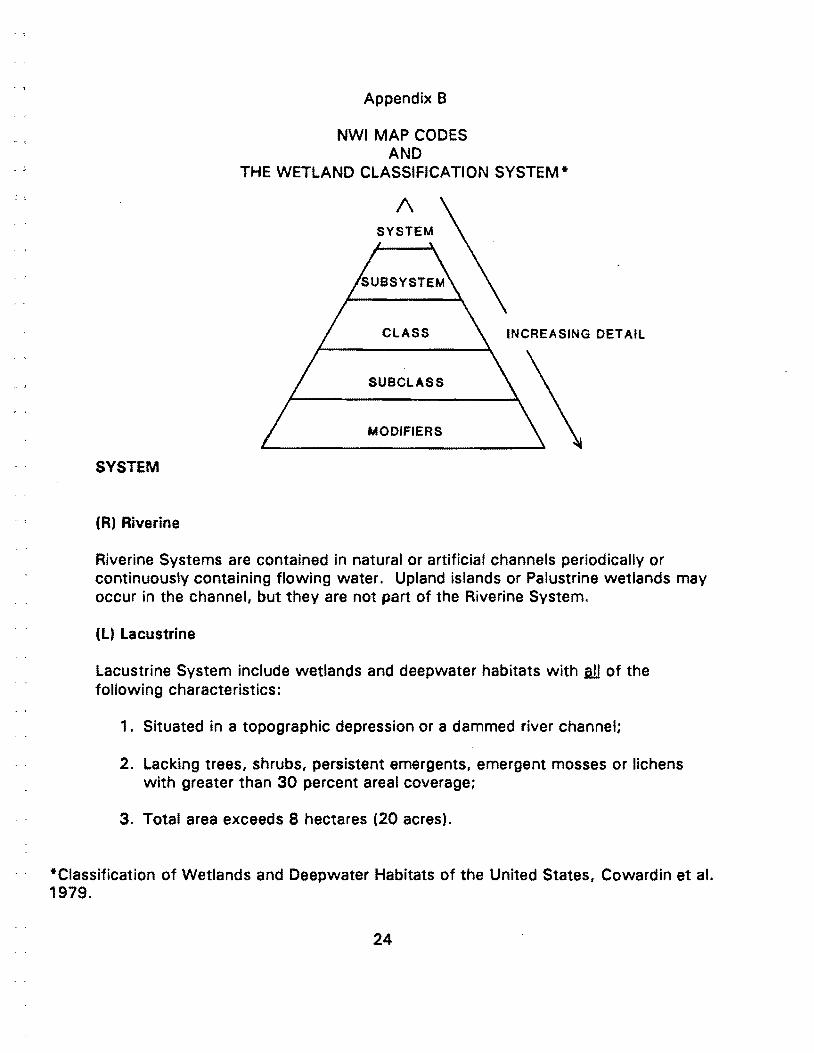
Appendix B
NWI MAP CODES AND
THE WETLAND CLASSIFICATION SYSTEM *
/\
CLASS INCREASING DEl AIL
SUBCLASS
MODIFIERS
SYSTEM
(R) Riverine
Riverine Systems are contained in natural or artificial channels periodically or continuously containing flowing water. Upland islands or Palustrine wetlands may occur in the channel, but they are not part of the Riverine System.
(l) lacustrine
lacustrine System include wetlands and deepwater habitats with .all of the following characteristics:
1. Situated in a topographic depression or a dammed river channel;
2. lacking trees, shrubs, persistent emergents, emergent mosses or lichens with greater than 30 percent areal coverage;
3. Total area exceeds 8 hectares (20 acres).
*Classification of Wetlands and Deepwater Habitats of the United States, Cowardin et al. 1979.
24
Basins or catchments less than 8 hectares in size are included if they have at least one of the following characteristics:
1. A wave formed or bedrock feature forms all or part of the shoreline boundary; or
2. Have at low water a depth greater than 2 meters in the deepest part of the basin.
(P) Palustrine
Palustrine Systems include all nontidal wetlands dominated by trees, shrubs, persistent emergents, emergent mosses or lichens, and all such wetlands that occur in tidal areas where salinity due to ocean-derived salts is below 0.5 ppt. Wetlands lacking such vegetation are also included if they exhibit all of the following characteristics:
1. Are less than 8 hectares (20 acres);
2. Do not have an active wave-formed or bedrock shoreline feature;
3. Have at low water a depth less than 2 meters (6 feet) in the deepest part of the basin;
4. Have a salinity due to ocean-derived salts of less than 0.5 ppt.
All water bodies that are less than 8 hectares (20 acres) in size are considered to be in the Palustrine System unless depth information is available, or unless an active wave-formed or bedrock shoreline feature is visible.
SUBSYSTEM
(R) Riverine
(1 J Lower Perennial--This Subsystem is characterized by a low gradient and slow water velocity. There is no tidal influence, and some water flows throughout the year. The substrate consists mainly of sand and mud. The floodplain is well developed. Oxygen deficits may sometimes occur.
(2) Upper Perennial--This Subsystem is characterized by a high gradient and fast water velocity. There is no tidal influence, and some water flows throughout the year. This substrate consists of rock, cobbles, or gravel
25
• J
with occasional patches of sand. There is very little floodplain development.
(3) Intermittent--This Subsystem includes channels that contain water only part of the year, but may contain isolated permanent pools when the flow stops.
(4) Unknown Perennial--This Subsystem designation was created specifically for use when the distinction between lower perennial, upper perennial, and tidal cannot be made from aerial photography and no collateral data is available.
(L) Lacustrine
(1) Limnetic--Extends outward from Littoral boundary and includes all deepwater habitats within the Lacustrine System .
(2) Littoral--Extends from shoreward boundary to 2 meters (6 feet) below annual low water or to the maximum extent of non-persistent emergents, if these grow at greater than 2 meters.
(P) Palustrine
Has no subsystems.
CLASS AND SUBCLASS
Class describes the general appearance of the habitat in terms of either the dominant life form of the vegetation or the physiography and composition of the sLlbstrate. Life forms (e.g., trees, shrubs, emergents) are used to define classes because they are easily recognizable, do not change distribution rapidly, and have traditionally been used to classify wetlands.
(RB) Rock Bottom--Includes all wetlands and deep water habitats with substrates having an areal cover of stones, boulders or bedrock 75 percent or greater and vegetative cover of less than 30 percent.
Subclasses:
(1) Bedrock (2) Rubble
26

, 1
(UB) Unconsolidated Bottom*--Includes all wetlands and deep water habitats with at least 25 percent cover of particles smaller than stones (less than 6-7 cm), alld a vegetative cover less than 30 percent.
Subclasses:
(1) Cobble-Gravel (2) Sand (3) Mud (4) Organic
(OW) Open Water* --Open water, no visible vegetation.
(AB) Aquatic Bed--Includes wetlands and deep water habitats dominated by plants that grow principally on or below the surface of the water for most of the growing season in most years. Earlier maps may contain 7 subclasses.
Subclasses:
(1) Algal (2) Aquatic Moss (3) Rooted Vascular (4) Floating Vascular (5) Unknown Submergent (6) Unknown Surface
(US) Unconsolidated Shore--Includes all wetland habitats having unconsolidated substrates with less than 75 percent areal cover of stones, boulders or bedrock and less than 30 percent areal cover of vegetation other than pioneering plants. Landforms such as beaches, bars, and flats are included in the Unconsolidated Shore Class.
Subclasses:
(1) Cobble-Gravel (2) Sand (3) Mud (4) Organic (5) Vegetated (pioneer plants)
*Earlier maps used the (OW) Open Water class, while present mapping conventions use the (UB) Unconsolidated Bottom class.
27

(SB) Streambed--Includes all wetland contained within the Intermittent Subsystem of the Riverine System and all channels of the Estuarine System or of the Tidal Subsystem of the Riverine System that are completely dewatered at low tide.
Subclasses:
(1) Bedrock (2) Rubble (3) Cobble-Gravel (4) Sand (5) Mud (6) Organic (7) Vegetated (Pioneer Plants)
(RS) Rocky Shore--High energy shoreline characterized by bedrock, stones or boulders which singly or in combination have an areal cover of 75 percent or more and an areal coverage by vegetation of less than 30 percent.
Subclasses:
(1) Bedrock (2) Rubble
(ML) Moss/Lichen--Areas where mosses or lichens cover substrates other than rock and where emergents, shrubs, or trees make up less than 30 percent of the areal cover.
Subclasses:
(1) Moss (2) Lichen
(EM) Emergent--Characterized by erect, rooted, herbaceous hydrophytes, excluding mosses and lichens. This vegetation is present for most of the growing season in most years.
Subclasses:
(1) Persistent--plants that normally remain standing at least until the beginning of the next growing season.
(2) Nonpersistent--plants which fall to the surface of the substrate or below the surface of the water at the end of the growing season.
28
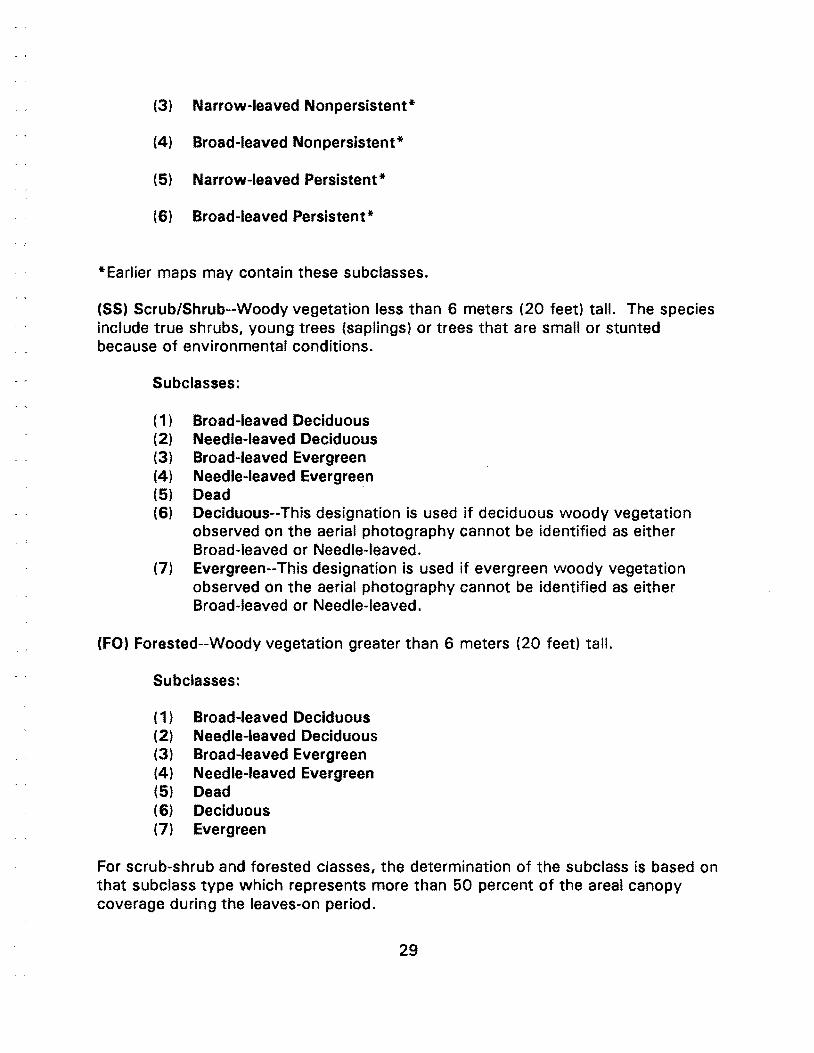
(3) Narrow-leaved Nonpersistent*
(4) Broad-leaved Nonpersistent*
(5) Narrow-leaved Persistent*
(6) Broad-leaved Persistent*
*Earlier maps may contain these subclasses.
(SS) Scrub/Shrub--Woody vegetation less than 6 meters (20 feet) tall. The species include true shrubs, young trees (saplings) or trees that are small or stunted because of environmental conditions.
Subclasses:
(1) Broad-leaved Deciduous (2) Needle-leaved Deciduous (3) Broad-leaved Evergreen (4) Needle-leaved Evergreen (5) Dead (6) Deciduous--This designation is used if deciduous woody vegetation
observed on the aerial photography cannot be identified as either Broad-leaved or Needle-leaved.
(7) Evergreen--This designation is used if evergreen woody vegetation observed on the aerial photography cannot be identified as either Broad-leaved or Needle-leaved.
(FO) Forested--Woody vegetation greater than 6 meters (20 feet) tall.
Subclasses:
( 1 ) Broad-leaved Deciduous (2) Needle-leaved Deciduous (3) Broad-leaved Evergreen (4) Needle-leaved Evergreen (5) Dead (6) Deciduous (7) Evergreen
For scrub-shrub and forested classes, the determination of the subclass is based on that subclass type which represents more than 50 percent of the areal canopy coverage during the leaves-on period.
29

Mixing of Classes
Mixed classes are used as sparingly as possible, under two main conditions: (1) The wetland contains two or more distinct cover types each encompassing at least 30 percent areal coverage of the highest life form, but is too small in size to allow separate delineation of each cover type; and (2) The wetland contains 2 or more classes or subclasses each comprising at least 30 percent areal coverage so evenly interspersed that separate delineation is not possible at the scale of photography NWI uses.
Mixed classes are limited to the following and their reciprocals (Earlier maps may contain additional combinations): EM/AB, EM/UB, EM/US, FO/EM, FO/SS, FO/UB, FO/US, SS/EM, SS/US, SS/UB, AB/UB, and US/UB.
The mixed classes are based on the percentage of a mapping unit falling into each class. If 70 percent (areal cover) or greater of a dominant species falls into one class, the whole unit will be mapped as a pure class.
Mixing of Subclasses
The same rules will be used for mixed subclasses. The mixed subclasses allowed are FO 1/2, FO 2/4, FO 6/7, FO 1/3, SS 1/4, and SS 1/3. If mixed classes are used, then mixed subclasses cannot be used in the same mapping unit. However, earlier maps may contain additional combinations of mixed Subclasses.
MODIFIERS
Water Regime Modifiers
Precise description of hydrologic characteristics requires knowledge of the duration and timing of surface inundation, both yearly and long-term, as well as an understanding of groundwater fluctuations. Because such information is seldom available, the water regimes that, in part, determine characteristic wetland and deepwater plant and animal communities are described in only general terms. Water regimes are grouped under two major headings, Tidal and Nontidal. The Tidal Water Regime does not occur in this Region.
Non-Tidal
(A) Temporarily Flooded--Surface water present for brief periods during growing season, but water table usually lies well below soil surface. Plants that grow both in uplands and wetlands may be characteristic of this water regime.
30

(8) Saturated--The substrate is saturated to surface for extended periods during the growing season, but surface water is seldom present.
(C) Seasonally Flooded--Surface water is present for extended periods especially early in the growing season, but is absent by the end of the growing season in most years. The water table after flooding ceases is very variable, extending from saturated to a water table well below the ground surface.
(0) Seasonal Well-drained·--Surface water is present for extended periods especially early in the growing season. The water table after flooding ceases falls well below the ground surface.
(E) Seasonal Saturated· --Surface water is present for extended periods especially early in the growing season, and remains saturated near the surface for most of the growing season.
(F) Semipermanently Flooded--Surface water persists throughout the growing season in most years. When surface water is absent, the water table is usually at or very near the land's surface.
(G) Intermittently Exposed--Surface water is present throughout the year except in years of extreme drought.
(H) Permanently Flooded--Water covers land surface throughout the year in all years.
(J) Intermittently Flooded--Substrate is usually exposed, but surface water present for variable periods without detectable seasonal periodicity. Weeks or months or even years may intervene between periods of inundation. The dominant plant communities under this regime may change as soil moisture conditions change.
(K) Artificially Flooded--The amount and duration of flooding is controlled by means of pumps or siphons in combination with dikes or dams. Water and waste-water treatment facilities are included under this modifier.
(Z) Intermittently Exposed/Permanent·--Exhibits features of both Intermittently Exposed and Permanent water regimes.
31

(W) Intermittently Flooded/Temporary*--Exhibits features of both Intermittently Flooded and Temporary water regimes.
(Y) Saturated/Semipermanent/Seasonals*--Exhibits features of the Saturated, Semipermanent and Seasonal water regimes.
(U) Unknown--The water regime is not known.
*Not used on all maps.
Water Chemistry Modifiers
These modifiers are applied only where detailed collateral data is available.
Inland Salinity
(7) Hypersaline (8) Eusaline (9) Mixosaline (0) Fresh
Ph Mod Hiers
The acid modifier (a) is sometimes used to indicate bog wetlands and the alkaline modifier (i) is sometimes used to indicate desert salt (alkali) flats, or alkaline fens, and (t) is sometimes used to indicate circumneutral.
Soil Modifiers
The organic soil modifier (g) is sometimes used to indicate peatlands, fens and bogs, and (n) is sometimes used to indicate mineral soils.
Special Modifiers
The special modifiers are used to indicate wetlands and deepwater habitats modified by man or beaver. There are no limitations on the number of special modifiers that can be used in a wetland label. Special modifiers include the following terms:
(b) Beaver--Created or modified by the action of a beaver.
32

(d) Partly Drained--The water level has been artificially lowered, but the area is still classified as wetland because soil moisture is sufficient to support hydrophytes.
(f) Farmed--The soil surface has been mechanically or physically altered for production of crops, but hydrophytes will become reestablished if farming is discontinued.
(h) Diked/lmpounded--Created or modified by a man-made barrier or dam which obstructs the inflow or outflow of water.
(r) Artificial--Substrates classified as Rock Bottom, Unconsolidated Bottom, Rocky Shore and Unconsolidated Shore that were emplaced by man using natural or synthetic materials. Jetties and breakwaters are examples of Artificial Rocky Shores.
(5) Spoil--Wetland or deepwater habitat where the substrate is a result of the deposition of spoil materials.
(xl Excavated--Lies within a basin or channel excavated by man. This includes all landcut canals, ditches, dugouts, stockponds, and farm ponds. Some of these categories may also be diked/impounded.
'U' Primarily represents upland areas, but may include unclassified wetlands such as non photo-identifiable areas and/or unintentional omissions.
33
w ~
IYITlIl
IU.IYITlIl --
IYITIM
.U.IYITIM aMI -
• YITIM
aMI -
.. -"M .. INI
, - TIDAL I - LOwe .. PI .. ENNIAL , - UPPE .. H .. INNIAL • - INTI .. MmINT 1- ",,11110_ HIf.IIIN1Al
.. -IIOCII eon_ 111-___ ' ••
eon_ ... -" .. -. "'-_he ... .. -IIOCIIY UI-___ " • ..... -... _ .. , ow-.", ... "., ---- --.- '_a._ ,- ,- ,- I~·a. .... 1-,.- I- I- 1_- I- I-1- I_·a._ 1 ___
1_ '0._ . - ................. .-. - . .,....".....,. ............. .-ICIo_ ........... ...,.. '''-
·.' ....... 04 ...... IIU&, ... ..,.-.m .. , ....,.,. ........... _ ... CUll ..... "'I-.m'" ... .,.., ... '·'M(IIIOI'" 4 ...... 'lOA&. .... "OWI ...................... ...
.. -_. eonooo ,I-
P - PALUITRINI
111- =r"oJDl-". ... - _he... UI-=--, .... --_=~ ... -... _-'" ._o.-I::::: .- '-I::=-... ........ v...._-'-. .,.. ............
._o.I-I-. o..-
L - lACUITRlN1
.-1 __ ,-1_- ..-_111·_ ,--... -1_·_--, ..... , ..... . :.:::.-:-.t:r.... -" ........
I • 1 - UMNITIC I - UTTO .. AL
fO-'O""'. __ .,., ... "., ---,---.............. ... -._--. :.:::.":"'-J-Il::._ ,' ........
, .. - =:"011 1II-=r"oJDl-·_· ... -:rhe -~~.' .. - =011 111-==-_ ...... -:rhe .. -= 111-=_.... .. -.... _'" -..;.:~.' ,_ .=-.a._ ,_ ,_ ,=-a._._ ._ .=-.a._ I_ .- 1- I:::::::" U._ 1_ 1=,,-:::'" 1- I_
• .".... ........ ".... ..".... ' ....... -... .01 ..... ............ ~ • .,..,......~ .y ....... . .,.......,....... . .......... ,."..
MOO"II"I ...... --................ --... ... ~-..-... --..... - ...... ---.., . .............................................................................................................. ..-WATI .... IOIME WAn .. CHIMIIT .. Y lOlL IPICIAL MOD"II"I
N_,",-, TNeI C-.lHeIIohy ........ .......,pH .............
"'-'- "_- I ......... ,,,,... 'I ' ........ , .... • F_1oW ... I~ .- ~t=..e=_ ,- ,-
~ 1:::::.-J __ .......... , ...... ............ ~, .... 11- 1._ ._- .,..-..,a .... ........... , ....... ..................... , ...... ...__.t .... .-_1- .- I ....... .-0"""""""", w __ ~ ~. ........... , ...... ." .............. , ... ........-.. 0 ......
.c-. ___ .. -_.- . ......,' ........ If ~, ......... ,...... u.,....,..._ I- . -I_'- .......... , ...... ........, .-F- ... --- .'-, _.IoW:=- • E::;- .=~.:,':"'".::.-:: II. _
1i'!I,g\U'CI 9. W.Uanc:l and ~epw.t,aJ;' HJ!bitat ~~11d

Appendix C Regional Offices
REGIONAL WETLANDS COORDINATORS NATIONAL WETLANDS INVENTORY
REGION 1 Eastside Federal Complex 911 NE 11th Avenue Portland, OR 97232-4181 PHONE: (503) 231-6154 FAX: (503) 231-6243
REGION 2 500 Gold Ave., SW, Room 4012 P.O. Box 1306 Albuquerque, NM 87102 PHONE: (505) 766-2914 FAX: (505) 766-8063
REGION 3 4101 E 80th Street Bloomington, MN 55425-1600 PHONE: (612) 725-3417 FAX: (612) 725-3609
REGION 4 R.B. Russell Federal Building 75 Spring Street SW Mail Stop 1276 Atlanta, GA 30303 PHONE: (404) 331-6346 FAX: (404) 331-6315
REGION 5 300 Westgate Center Drive Route 2 & 116 North Hadley, MA 01035 PHONE: (413) 253-8622 FAX: (413) 253-8482
REGION 6 Denver Federal Center P.O. Box 25486 Denver, CO 80225 PHONE: (303) 236-2985 FAX: (303 236-0027
REGION 7 101 1 East Tudor Road Anchorage, AK 99503 PHONE: (907) 786-3471 FAX: (907) 786-3350
RWC: Dennis Peters ASST: Howard Browers
RWC: Warren Hagenbuck ASST: Curtis Carley
RWC: Ron Erickson ASST: Kim Santos
RWC: John Hefner ASST: Charlie Storrs
RWC: Ralph Tiner ASST: Glenn Smith
RWC: Chuck Elliott ASST: Bill Pearson/Renee Whitehead
RWC: John Hall ASST: Sheila Ricardi
35
Other Sources Used
Erickson, R.E. and M.E. Hubbell. 1992. Atlas of the National Wetlands Inventory Maps in the Chicago Metro Area. U.S. Fish and Wildlife Service, National Wetlands Inventory (Twin Cities), MN. 20 pp. and Appendices.
Smith, G.S. 1991. NWI MAPS MADE EASY: A User's Guide to National Wetlands Inventory Maps of the Northeast Region. U.S. Fish and Wildlife Service. National Wetlands Inventory, Newton Corner, MA. 15 pp.
U.S. Fish and Wildlife Service. 1985. USER's GUIDE National Wetlands Inventory Information and Legend for Map Products. Portland, OR. 12 pp.
U.S. Fish and Wildlife Service. 1990. Photo Interpretation Conventions for the National Wetlands Inventory. St. Petersburg, FL. 45 pp. and Appendices.
U.S. Fish and Wildlife Service. 1991-1992. Unpublished National Wetlands Inventory Fact Sheets and Information.
U.S. Fish and Wildlife Service. 1993. NWI MAPS MADE EASY A User's Guide to· National Wetlands Inventory Maps of the Mountain-Prairie Region. Denver, CO. 16 pp. .
38