1989 new york beef cow-calf farm business...
TRANSCRIPT

September 1990 AS Mimeo 143 AE Ext 9 0 -24
bull
1989 New York Beef Cow-Calf Farm Business Summary
Caroline Nowak Rasmussen Stuart F Smith Danny G Fox
Department of Animal Science and
Department of Agricultural Economics New York State College of Agriculture and Life Sciences
A Statutory College of the State University Cornell University Ithaca New York 14853
1989 NEW YORK BEEF COW-CALF FARM BUSINESS SUMMARY
Table of Contents
Introduction 3
Economic Factors Affecting New York Beef Producers 4
Summary of the Farm Business - Selected Factors 9 Definitions of Selected Business Factors 9 Analysis of Selected Business Factors 10
Selected Performance Factors for the Same Seventeen Farms 12 Definitions of Selected Performance Measures Same Farms 12 Analysis of Selected Performance Measures Same Farms 14
Business Characteristics and Resources Used 15
Farm Income 17
Farm Expenses 18
Farm Profitability Measures 21
Farm Statement of Net Worth 22
Balance Sheet Analysis 23
Farm Inventory 25
Repayment Analysis 25
Capital and Labor Efficiency Analysis 26
Annual Cash Flow Statement 27
Beef Enterprise Analysis 28
Herd and Crop Management 30 1989 Crop Production 30 Herd and Crop Management Analysis 31
Beef Herd Analysis 33 Livestock Market Values 33 Value of Beef Inventory 33
34Conclusion
1
List of Tables and Fleures
Figure 1 Figure 2 Figure 3 Figure 4
Table 1 Table 2
Table 3 Table 4 Table S Table 6 Table 7
Table 8
Table 9
Table 10 Table 11 Table 12
Table 13
Table 14
Table 15 Table 16
Table 17
Table 18
US Cattle and Calf Inventory 6 Beef Prices Received by Farmers US 6 US Retail Prices for Beef Pork and Poultry 8 Returns to Cow-calf Producers US 8
Selected Business Factors 1988 and 1989 10 Selected Performance Factors 1988 and 1989 for the Same Seventeen Farms 13 Business Characteristics of Thirty-two New York Beef Farms 1989 15 Resources Used on New York Beef Farms 1988 and 1989 16 Farm Income Average of Thirty-two New York Beef Farms 1989 18 Farm Expenses Average of Thirty-two New York Beef Farms 1989 20 Measures of Farm Profitability Average of Thirty-two New York Beef Farms 1989 21 Farm Statement of Net Worth Average of Thirty-two New York Beef Farms 1989 23 Balance Sheet ~nalysis Average of Thirty-two New York Beef Farms 1989 24 Farm Inventory Average of Thirty-two New York Beef Farms 1989 25 Repayment Analysis Average of Thirty-two New York Beef Farms 1989 26 Capital amp Labor Efficiency Analysis Average of Thirty-two New York Beef Farms 1989 27 Annual Cash Flow Statement Average of Thirty-two New York Beef Farms 1989 28 Beef Enterprise Receipts and Expenses Average of Thirty-two New York Beef Farms 1989 29 1989 Crop Production Average of 23 New York Beef Farms 30 Herd and Crop Management AnalysisAverage and Range of Thirty-two New York Beef Farms 1989 32 Livestock Market Values and Stock Numbers Average of Thirty-two New York Beef Farms 1989 33 Value of Beef Inventory (Jan I 1989 and Dec 31 1989) Average of Thirty-two New York Beef Farms 33
2
Introduction
The Beef Farm Business Summary is a compilation and analysis of business records from participating cow-calf farms The farm summaries provide the basis for continued extension education programs data for applied research studies and for use in the classroom The primary objective however is to provide producers with information about their beef farm business that can be used to identify weak links that limit profitability To facilitate this evaluation analysis is provided with six critical success factor categories size of business rates of production cost control capital efficiency profitability and financial integrity Regardless of the use of the data confidentiality of individual farm data is maintained
The following farm business summary was compiled in 1989 by the Department of Animal Science in conjunction with the Department of Agricultural Economics using data submitted by thirty-two farmers All of the thirty-two farmers providing farm records are located in New York State across 19 different counties Summaries were collected from farms with a variety of resources and management objectives Data was collected for the calendar year 1989 All of the producers have a cow-calf component in their operation Some sell all calves at weaning others feed out some or all of their calves to a finished weight
These thirty-two farms are not a scientific sample and are not necessarily representative of New York beef farms The averages published in this report are not intended to represent the average of all beef farms and should not be interpreted as such The averages are calculated to provide the cooperators with a comparison when analyzing their own records The purpose of the Beef Farm Business Summary is to present the cooperators and other beef producers with a format for summarizing and analyzing their business and to offer some data which may be useful to potential beef producers and Cooperative Extension agents
The Beef Farm Business Summary was made possible by help from Cooperative Extension agents Michael Baker Carl Crispell Thomas Gallagher Lou Anne King Craig Trowbridge David Weaver Paul Westfall and Alan White Thank you also to the participating beef producers Without their kind cooperation the Beef Farm Business Summary would not be possible
Accrual procedures have been used to provide the most accurate accounting of farm receipts and farm expenses for measuring farm profits An explanation of these procedures is found on pages 17 and 18 Five measures of farm profits are calculated on pages 21 The balance sheet is on page 23 and the cash flow statement is featured on pages 27 and 28 Throughout the document key phrases are underlined to help the reader locate specific information in the text
3
Economic Factors Affecting New York Beef Producers
The beef industry is cyclic The time between price high points has historically been 10-12 years The primary reasons for the cattle cycle are lags inherent to individual decision making and the lag time between industry entry and production
As prices start to climb from a price trough producers are encouraged to expand production by using all available heifers for breeding stock Holding back heifers and cull cattle reduces the number of animals available for slaughter This decrease in beef production tends to push prices higher As prices increase herd building intensifies and beef production is constrained even more causing beef prices to climb still higher Eventually this process moves the cow herd and total cattle numbers to a point where the number of cattle produced for slaughter exceeds consumer demand Beef prices begin to decline As prices decline herd building turns into herd liquidation Heifers are no longer held and cows from the expanded herd are slaughtered Beef prices and cow numbers both decline
The cattle cycle is a result of the highly competitive structure of the beef industry Many small producers acting independently create the cycle The length of the cycle depends on both biologic and psychological factors It takes at least two ye~rs from the time a heifer is first bred until her calf is ready to slaughter creating a lag between when heifers are saved back until their calves reach slaughter
During all the phases of the cattle cycle there is a lag in the producers response to changes in the market At the bottom of the price cycle the producers may be somewhat wary of the past low prices and are reluctant to increase their herd Some time into the price recovery the inshyand-out individual may start into production After the cycle has peaked and prices are decreasing producers may continue to hold cow numbers up hoping for a price recovery until the price drops sufficiently for panic to cause widespread selling These response lags explain why the building phase of the cycle can last six to eight years and the liquidation phase can last three to four years
By watching the cattle cycle closely a producer can benefit from an increasing market and cut losses in a declining market While prices are high the producer can cull from the herd any marginal cows and heifers
During the down phase the producer can build cow numbers and have a efficient number of producing cows when the market turns up again
The beef cycle reflects the relationship between prices finished cattle supplies and the number of cows and heifers held for breeding Other factors affecting the price of beef include cattle slaughter characteristics (size and mix) consumer demand cost of productioh farm to retail margins world trade market psychology and weather
4
The USDAs Economic Research Service reported that 1989 was a pivot year in the cattle cycle The modest expansion of the cattle herd in 1989 signaled the end of the liquidation phase of the seventh cattle cycle since 19281 The cycle 1979-1989 was an unusual one in that the herd expansion phase lasted only 3 years and the herd expanded only 45 as compared with an average herd expansion of 22 percent over 6 to 8 years The 1979-1989 herd liquidation phase lasted seven years with a 16 percent decline in the nations cow herd This compares to a typical liquidation of ten percent over 3 to 4 years
Figure 1 shows the US Cattle and Calf Inventory in million head from 1930 to 1990 The beef cow inventory increased from the beginning to end of 1989 by 1 percent The beef heifer numbers were almost unchanged in 1989 New York however did not follow the national cow inventory trend The New York State Beef Cow inventorl at the end of 1989 was 75000 head five percent lower than the previous year
The unusually long liquidation phase of the 1979-1989 cattle cycle is due to several factors Capital acquisition has been difficult for some producers because of equity and bank problems in 1986 and 1987 Tax reform has discouraged some producers from expanding herds Drought conditions in many areas from 1986-1988 tended to keep the beef herd sizes down In 1989 the price received for feeder and finished cattle continued strong In 1989 Choice Omaha steers (1000-1100 lb) averaged $ 7252cwt an increase of $ 298 from 1988 averages Figure 2 shows national average beef prices received for beef calves steers and cows The New York State average price for all steers and heifers marketed in 1989 was $5700 per hundredweight This is a 7 incr~ase from 1988 Medium frame steers going to the New York Teleauction Graded Feeder Sale in October 1989 ranged in price from $ 87 to $ 9050 per hundredweight
The beef cycle is also affected by changes in the demand for beef The per capita consumption of beef has declined from 78 pounds in 1979 to an estimated 1989 consumption of 734 pounds The shift in consumer preference from beef to poultry is due to a variety of factors including diet and health concerns over fat and cholesterol and consumer demand for convenience foods However the impact on beef demand from changing tastes and preferences is minor when compared to the response to price differences between beef and poultry In 1970 the beef price was approximately twice that of broilers By 1988 the beef prices was three times the price of broilers (figure 3) Recent research indicates that if beef production costs were lowered the consumption response would expand the industry significantly Drovers Journal quoted University of Chicago economist D Gale Johnson If the beef industry can lower retail beef prices to 25 times the cost of poultry the consumption would increase 5 to 10 pounds (per capita)3
Livestock and Poultry Situation and Outlook Report United States Department of Agriculture Economic Research Service February 1990 LPS-40
Z Cattle New York Agricultural Statistics Service April 13 1990 No 976-1-90
3 Drovers Journal October 19 1989 Number 18
5
140 Million head
120
100
80
60
Source USDA ERS February 1989 Outlook 90 Charts 66th ~ual Agricultural Outlook Conference AGES 9001
1930 40 50 60 70 80 90
Figure 2 Beef Prices Received by Farmers US (Dollars per cwt)
DOlLARS PER CWT
100 r---------------------------------------------~
90
80
70
60
50
1989 1990
6
The price for beef is also affected by the world markets supply and demand In 1989 beef and veal exports reached a record 107 billion pounds up 46 percent from 1988 due largely to an increase in the Japanese market The United States imported about 21 billion pounds of beef and veal in 1989 This was a decline in the import level of about 8 percent from 1988
Recent studies indicate that demand for beef stabilized during 1989 The decrease in demand for beef has moderated in response to increasing disposable income promotion and research showing that nutritional objections to beef have been overstated Programs funded by beef check-off dollars have improved the price of fed cattle modestly ($1OO-230cwt)
Strong cattle prices and relatively low feed prices in 1989 resulted in the fourth year that budgeted cash returns for cow-calf producers were positive figure 4 However calculated cash returns per cow in 1989 were below 1985-1987 returns farms with beef cattle average number of cows p
In 1989 the USDA reported that there were This number was down 2 percent from 1988
er operation is 355 cows
949640 The
In Summary 1) Beef prices are cyclic in response to supply of beef available and the demand for beef by domestic and foreign consumers
2) 1989 was a turning point year in the cattle cycle with the beef herd inventory increasing for the first time since 1981
3) In 1989 fed cattle and feeder cattle prices increased slightly from 1988
4) Over the past ten years beef demand has decreased due to several factors including the price of beef relative to alternative meats Increased production efficiency leading to lower beef production costs will increase beefs market share and increase returns to the beef industry The demand for beef tends to be stabilizing
7
Figure 3 us Retail Price for Beef Pork and Poultry
Cent
-rr=========~--------------~----~
~~~~~~~~------------------~
~ 0 It bullbullbullbullbullbullbull bullbullbullbull bullbullbullbull It bullbullbullbullbull It bullbullbull It bullbull t bullbullbullbullbullbull tt
- AMail beef pttce AMalf port Clffeer----
2DO
~~~--~~~------------------------------~
0 111~ 111~72I~ntt1 imiddot7S t~1t t~7ft 71~71tmiddot11~i21~cu~~ ~11 t~t ~ ~
Source Drover Journal October 19 1989 number 18
Figure 4 Returns to Cow-calf Producers US $cow
$cow
72 76 80 84 88
Source USDA ERS February 1990 Outlook 90 Charts 66th Annual Agricultural Outlook Conference AGES 9001
8
150
100
50
o
-50
Summary of thsect Farm Business - Selected Factors
Selected farm business summary factors include the size of the farm business rates of production cost control capital efficiency profitability return on equity and financial summary The average and the range values for selected business factors are presented in Table 1 Average values for 1988 data and average and range values for 1989 data are shown All of the twenty-three farms participating in the 1988 summary and the thirty-two farms participating in the 1989 summary are included in the values in Table 1 This table gives a broad view of the business performance of all of the participating farms Table 2 Selected Performance Factors 1988 and 1989 for the Same Seventeen Farms demonstrates the changes from one year to the next in the annual performance of the seventeen farms who participated in both years
Definitions of Selectsectd Business Factors
The average number of cows is the mean number of open and bred cows held during the year ([open and bred cows as of January 1 plus open and bred cows as of December 31]2) The average number of heifers and average number of bulls is computed in the same way The calves weaned is calculated by dividing the total number of calves weaned by the sum of the total number of calves born plus calves purchased as a cow-calf pair less calves sold as a cow-calf pair The calves born is calculated by dividing the total number of calves born alive by the total of pregnant cows in the herd plus pregnant cows purchased less pregnant cows sold The average wean age is the average number of days between birth and weaning Cost control capital efficiency and profitability measures given on a per cow basis use the average number of cows (as defined above) as the denominator
Purchased feedcow is the sum of beef grain purchased and beef roughage purchased on an accrual basis per cow Hired labor and machinery cost per cow is calculated as the sum of accrued expenditures for hired labor machinery repair farm auto machinery hire and lease machinery depreciation and an interest charge of five percent on the average machinery investment The interest charge represents the opportunity cost of the dollars invested in machinery Hirsectd Labor machinery and crop- cost per cow is the sum of hired labor and machinery cost per cow (as defined above) accrued fertilizer amp lime and accrued seed spray and other crop expenses
All of the capital efficiency measures are averages of the beginning and end of the year Assets are valued on a market value basis for calculation of capital efficiency measures The profitability measures are shown in table 7 Details concerning profitability analysis are in the Profitability Measures text page 21 Farm net worth is the total market value of assets less liabilities as of December 31 The debt to asset ratio is the total number of dollars of debt per each dollar of assets Farm debt per cow is the December 31 total liability value divided by the total number of open and bred cows as of December 31
9
Table 1 Selected Business Factors 1988 and 1989 All Farms
1988 bullbull -------- 1989 ----------shyItem Average Average Range
Number of Farms Size of Business Average number of cows Average number of heifers Average number of bulls Total lbs weaned
23
339 75 25
13944
32
387 95 37
16823
50 1070 0 middot 435 0 - 31 5
1100 - 52200
Rates of Production Calves weaned Calves born Average weaning weightlbs Average wean age days
923 922
549 207
965 944
514 208
85 73
400 137
- 100 - 100 683
300
Cost Control Purchased feed costcow Hired Labor amp Mach costcow Hired Labormachamp crop costcow
$ 178 323 392
$ 99 312 361
$ 0 49 87
- 501 - 877 middot 902
Capital Efficiency (average for Machamp equip investmentcow Real estate investmentcow Total capital investmentcow
year) $ 1247
8356 11194
$ 1145 6667 9405
$ 243 o
1658
middot 4845 - 52500 - 57673
Profitability Net cash farm income Net farm income wo appro Net farm income w appro
$ 595 (4594)
4815
$ (2321) (541) 7037
$ (64615) (37569) (35114)
- 27762 - 58434 - 65656middot
Financial Summary Farm Net Worth (1231) Debt to asset ratio Farm debt per cow
$
$
226975 13
1085
$ 284347 08
$ 750
$ 27870 - 1417058 o - 32
$ o 3978
Analysis of Selected Business Factors
The selected business factors shown in Table 1 are a one page synopsis of the farm businesss size productivity and profitability Averages are shown for the 23 farms participating in the 1988 summary and averages and ranges shown for the 32 farms participating in the 1989 business summary Seventeen farms participated in both studies Be careful when comparing changes in business factors in Table 1 from one year to the next With the small number of farms involved most large changes between 1988 and 1989 are due to the economic profiles of the individual farms involved and not changes in the beef industry To compare specific year to year differences in the farms see Table 2 Selected Performance Factors 1988 and 1989 for the Same Seventeen Farms
10
In 1989 the average number of cows on the thirty-two farms was 387 with a range of 5 to 107 The reproductive efficiency of the farms tended to be very good with Percent Calves weaned and Percent calves born averaging 965 and 944 respectively Eighteen farms weaned~lOO of their calves born and fourteen farms had 100 live calf births
There was a large variation between the farms in the economic factors cost control capital efficiency and profitability This variation was evident in the cost control measures where purchased feed per cow varied from $ 0 to $ 501 per cow and hired labor and machinery cost varied from $49 to $902 per cow Hired labor and machinery cost tended to be related to farm size with the smaller farms having the highest machinery and labor cost per cow This reflects the fixed component of investment in machinery required for a farming operation
Capital efficiency is an important factor in the operation of a beef cow calf enterprise As cow calf businesses tend to be labor and capital extensive with a small profit margin over capitalization can be devastating to the health of the business The cow calf industry is however prone to this problem partially because many part time producers under a time constraint need reliable equipment The machinery and equipment investment per cow ranged from $243 to $4845
Four of the farms in the summary described beef as not their primary farm enterprise Twelve of the farms had some income from crop sales The average cash crop income for these farms was $ 7500 The farms who had a cash crop enterprise had a higher machinery investmentcow ($1442) than the twenty farms which did not sell any crops off of the farm ($996) Of the average total capital investment per cow of $9405 71 percent or $6667 was real estate investment The real estate investment per cow varied from $0 to $52500
Net cash farm income which is farm cash receipts less farm cash expenses and purchased breeding stock is the money available to make principle payments capital purchases and contribute toward family livin~ and savings Average net cash farm income for 1989 participating farms was negrttive $2331 Net farm income calculated on an accrual basis includes depreciation of buildings and machinery and changes in inventory Average net farm income for the thirty-two farms was negative $541 Net farm income with Appreciation is the total farm accrual receipts less total farm accrual expenses plus livestock machinery and real estate appreciation Appreciation represents the change in farm inventory values caused by changes in prices during the year Appreciation is included in Net Farm Income in order to reflect the entire change in farm net worth The average Net Farm Income including appreciation was $ 7037
Farm net worth is the market value of all farm assets less all farm debt The average farm net worth for the thirty-two beef farms was $ 284347 The debt to asset ratio indicates that on the average for every $100 of farm assets there is $ 08 of farm debt The average farm debt per cow on December 31 1989 was $750 The debt level of the beef farms participating in the beef farm business is relatively low for an agricultural business The debt to asset ratio and debt per cow for the 1989 New York State Dairy Farm Business Summary was 32 and the average farm debt per cow was $ 2048
11
Selected Performance Factors for the Same Seventeen Farms
Definitions of Selected Performance Measures Same Farms
The Selected Performance Measures shown in Table 2 are similar (and for some items the same) as the Business Measures listed in Table 1 The measures in Table 2 are selected to be used as a diagnostic tool to compare the performance of these farms from one year to the next Where possible measures are in a per unit basis ie per cow and per acre This allows comparison of different size farms The right hand column is left blank for you to fill in your farms values Listed under the Page column in Table 2 is the page number of your Individual Farm Business Summary that the value listed under Item appears
The values in table 2 are averages for the same seventeen farms that participated in both the 1988 and 1989 Beef Farm Business Summary Each of these measures is also included in other tables in this publication and described in greater detail in those areas
The size of business and investmentcow measures are described above (Analysis of Selected Business Measures) Capital Turnover is the average farm assets divided by the annual farm accrual receipts Capital Turnover shows the number of years of farm receipts required to equal or turnover the average capital investment
Total Accrual Receiptscow is the sum of cash farm receipts adjusted for changes in inventory and accounts payable divided by the sum of all open and bred cows The other per cow values are calculated in the same way Accrual Operating Expenses are all accrual farm business expenses except breeding stock purchases and depreciation Breeding stock purchases building and machinery depreciation are added together The Net Farm Income is total accrual receipts less total accrual expenses (including breeding stock purchases and depreciation) This value does not include appreciation See pages 17 and 18 for more detail about accrual receipts and expenses
Debt Payment as a Percent of Total Cash Receipts is calculated Total Debt Payment (interest plus principal) paid during the year divided by the total cash receipts received for the year Net Non-farm Contribution to Farm is the cash required by the farm from non-farm sources to meet farm cash requirements for operating expenses debt payments and capital purchases
Marketing indicators include the average feeder calf price received and average finished cattle price received in dollars per hundredweight Three crop production measures are included Tons hay crop dry matter per acre Direct crop expensescrop acre and Purchased feedcow Direct crop expenses included the accrual expense~ for fertilizer lime seed spray and other crop expenses divided by the total number of crop acres The Purchased feed costcow is purchased beef grain and roughage per cow on an accrual basis These three measures together indicate cropping system performance costs and the alternative cost of purchased feed
12
Table 2 Selected Performance Factors 1988 and 1989 for the Same Seventeen Farms
1988 1989 Your 1989 Item Page Average Average Value
Size of Business Average Number of Cows 1 381 380 Total 1bs Yeaned 1 15144 17891
Capital Efficiency Farm Capital Investmentcow 8 $ 11773 $ 10165 Real Estate Investmentcow 8 $ 9471 $ 7808 Machinery amp Equip Invcow 1 $ 960 $ 915
Capital Turnover years 8 123 125
Profitability Total Accrual Receiptscow 3 $ 726 $ 717 Total Accrual Oper Expcow 2 $ 727 $ 614 Breeding Stock amp
Depreciationcow 2 $ 134 $ 114 Net Farm Incomecow $ (135) $ (11)
Debt Payment amp Cashflow Total Debt Paymentcow 5 $ 185 $ 191 Debt Payments as a Percent 5 30 X 37 X
of Total Cash Receipts Net Nonfarm Contribution to Farm 6 $ 3134 $ 3698
Marketing Average Feeder Price Receivedcwt 7 $ 8618 $ 7433 Average Finish Cattle Pricecwt 7 $ 6493 $ 72 17
Crop Production amp Purchased Feed Costs Tons hay crop dry matteracre 7 19 19 Direct crop expensescrop acre 7 $ 2845 $ 1683 Purchased feed costcow 1 $ 85 $ 118
Page number of the Individual Beef Farm Business Summary where Performance Measure is located
Net Farm Incomecow - Total Accrual Receiptscow (page 3) bull Total Accrual Expensescow (page 2)
13
Analysis of Selected Performance Factors Same Farms
The performance of these seventeen farms has not changed dramatically from 1988 to 1989 The biggest changes were in Capital Investment and herd productivity measures Even though the nUmber of cows was practically the same in 1988 and 1989 (38 cows) the total quantity of weaned calves increased by 2747 pounds The average weaning weight per calf actually decreased in by 24 lbs from 563 lbs in 1988 to 539 in 1989 However the calf death loss was lower in 1989 Of the cow conceiving the percentage who gave birth to a live calf was 91 and 98 percent respectively in 1988 and 1989 Likewise of those calves born the percentage surviving to be weaned was 92 and 94 percent in 1988 and 1989
The average capital Investment per cow decreased $ 1608 or slightly more than 13 percent The real estate investment per cow was down more than seventeen percent However the time required to payback capital purchases from operating receipts (capital turnover) was slightly greater in 1989 than 1988 This is due to a decrease in receipts in 1989 Both accrual receipts and expenses were slightly lower in 1989 when compared to 1988 The net farm income per cow improved in 1989 For every cow the average farm spent $ 135 more in 1988 for operating expenses breeding stock purchases and depreciation than they received from operating receipts In 1989 the average of the seventeen farms was still operating at a net loss but the deficit was reduced to $ 11 per cow
Debt payments per cow increased marginally in 1989 from $ 185 to $ 191 Debt payment as a percent of total receipts also increased from 30 to 37 percent This increase was enlarged by the decease in 1989 receipts The average non-farm contribution to the farms cashflow increased in 1989 by $ 564
The average price received for feeder and finished cattle varied considerably from year to year In 1988 the average producer sold 10 feeder calves weighing 495 lbs for $ 86 per hundredweight and 11 finished cattle weighing 894 lbs for $ 65 per hundredweight In 1989 the average producer sold 17 feeder calves weighing 537 lbs for $74 per hundredweight and 7 finished cattle weighing 989 1bs for $ 72 per hundredweight
The hay production measured in tons of dry matter per acre was exactly the same for the two years 19 tons dmacre The hay crop production for participating beef producers tends to be low compared to New York State average yield of 229 tons per acre This is probably because the producers take only one cutting of hay and pasture the acreagefor the rest of the growing season In the 1988 season the seventeen farms summarized in this table grew hay and corn ona total of 103 acres In 1989 the same farms produced hay corn and oats on a total of 114 acres The direct crop expense per acre decreased in 1989 by $ 1162 A partial explaination may be due to the increase in crop acres worked The purchased feed costcow increased in 1989 by $ 33 per cow The summer of 1989 was unusually wet and resulted in poor hay yields and quality in many areas of New York State The total accrual forage purchased increased from $ $ 708 in 1988 to $ 836 in 1989 The grain purchased increased from $ 2385 in 1988 to 2868 in 1989
New York Agricultural Statistics 1988-1989 New York Department of Agricultureand Markets July 1989
14
Business Characteristics and Resources Used
Some major business characteristics are shown in Table 3 Eighteen of the farms are part time business and fourteen are full time The average farm tenure is over 13 years Sixteen of the thirty-two producers use artificial insemination for part or all of their herd breeding Twenty-eight of the producers indicated beef was the primary farm enterprise Most of the farm businesses use an manual account book for recordkeeping
Table 3 Business Characteristics of Thirty-two New York Beef Farms 1989
Number of Average Farms Years
Full Time Business 14 Farmer has operated farm 130 Part Time Business 18 Has owned beef herd 125
Beef Primary Enterprise 28 Beef Non Primary Ent 4
Business Type Single Proprietor 28 Partnership 3 Corporation 1
Record Keeping System Account Book 24 Check-Write System 4 On-farm Micro Computer 4
AI Used 16
Land labor and animal resources used in the farm business are listed in Table 4 Labor is measured in months In this analysis 200 hours is considered one month of labor Land use and herd size averages include only those farms reporting a value for the item The range is of all farms The total worker equivalent of 151 is the months of labor per year required to operate the average beef enterprise in the 1989 stUdy This value is equivalent to one full time person working 200 hours each month of the year and a second person working 200 hoursmonth for 3 months
15
Table 4 ResoU[s=ei YitUi QD Hew XQ[k ~eef [IUJDi I l288 Sm l289
Item Number of farms Land Used
Total Acres Owned Rented
Ave[Ss~ 1988 23
165 94
Av~[SS~ 1289 32
219 124
RsDS~ 1282
0 - 1166 0 - 683
Tillable Acres Owned Rented
Total Tillable
61 63
124
79 77
156
0 - 400 0 - 500 0 - 900
Pasture Acres Owned Rented
Total Pasture
60 26 86
70 37
107
0 - 800 0 - 450 0 - 800
Herd Size Average Number Cows Average Number of Cows
Bulls amp Heifers
339
439
387
S1 9
5
7
- 107
- 1695
Labor (months) Operator(s) Hired Labor Family Unpaid Total Worker
Equivalent
817 214 1 65
1211
993 204 275
1512
4 0 0
1 83
- 257 - 273 - 340
- 6109
16
Farm Income
Cash receipts change in inventory changes in accounts receivable accrual receipts and accrual receipts per cow are listed in Table 5 Cash receipts include the actual amount of cash received for farm products services and government payments Accrual Receipts represent the value of all farm production and services actually provided during the year Increases in livestock inventory caused by herd growth are included as accrual receipts under the changes in inventory column Decreases in inventory caused by herd reduction are deducted The change in inventory column does not reflect changes in inventory due to price changes (appreciation) A positive change in crop inventory is shown if there is an increase in grown feeds in inventory from the beginning to the end of the year The Farm Statement of Net Worth (page 23) and Value of Beef Inventory (page 33) present the details concerning changes in inventory
The changes in accounts receivable column adjusts accrual income to exclude cash received in this year for goods which changed ownership in a previous year and include income from the current years sales that has not been received An increase in accounts receivable will increase the accrual receipts accordingly A decrease in accounts receivable will decrease accrued receipts Accrual receipts per cow are calculated by dividing the sum of accrued receipts from all farms by the total number of cows on all farms
Non-farm receipts such as off-farm income are excluded from the farm income statement Gas lease payments and other payments attributed to the farm land base are included as miscellaneous receipts Ten of the farms sold only feeder calves seven farms sold feeder calves finished and breeding cattle Seven farms sold feeder calves and breeding stock six sold feeders and finished cattle one farm sold only finished cattle and one farm didnt have any cash cattle sales The accrual receipts are greater than the cash receipts because of the inventory adjustments reflecting increases in the cattle crop and other livestock inventories
17
Table 5 Farm Income Averaampe of Thirty-two New York Beef Farms 1989
Item Cash
Receipts Change Change in Accrual
in Inventory Accts Recbl Receipts Accrual per cow5
Feeder calf sales $ 7762 $ ll8 $ 34 $ 7914 $ 205 Finished cattle 4234 558 0 4792 124 Breeding stock 3831 3650 (63) 7418 192 Cull cattle 2236 0 2236 58 Other livestock 39 25 0 64 2 Crop Sales 2813 1306 28 4147 107 Custom work 589 0 589 15 Government payments Misc receipts
1768 1317
0 1768 __0 1 317
46 --1t
Total Cash Receipts $ 24589 TOTAL ACCRUAL RECEIPTS $ 5657 $ (1) $ 30245 $ 783
Farm Expenses
Cash Expenses are those farm expenses which were paid for in 1989 Accrual Expenses include the costs of inputs actually used in the years production The value of purchased feeds and supplies used out of the farm inventory are included as a cost Charges for items purchased but not paid for in 1989 shown as an increase in accounts payable are included in accrual expenses Conversely decreases in accounts payable items purchased in previous years and paid for in 1989 decrease accrual expenses Accrual expensescow are calculated by dividing the sum of accrued expenses from all farms by the total number of cows Farm business expenditures are grouped into seven major categories
Hired labor expenses include wages social security paid on labor workerS compensation insurance unemployment insurance and privileges purchased for hired labor
~ costs include beef grain and concentrate beef roughage and other livestock feed Beef grain and concentrate includes concentrates minerals protein and grain purchased for the beef herd Hay and silage purchased for the beef herd is entered as beef roughage purchased All feed purchased for non-beef livestock is included in other livestock feed
Machinery costs represent all the operating costs of using power machinery on the farm Ownership costs such as depreciation and interest on investment are excluded here but are included in the machinery cost measures in Selected Factors Table 1
5 Sum of total Accrual Receipts Sum open and bred cows on all farms
18
Livestock expenses include the cost of supplies and services directly associated with the care and maintenance of the beef herd Breeding expenses include purchased semen artificial breeding supplies and pregnancy exams Feeders and stockers purchased are the cost of cattle purchased that are purchased for resale not for breeding stock Marketing and other beef expenses include trucking marketing fees commissions advertising bull test fees 10 tags grading branding and stock supplies
Crop expenses include the costs of fertilizer lime seeds pesticides and other crop supplies
Real estate expenses are the direct costs associated with owning and maintaining farmland and buildings Taxes include all town county and school taxes paid on farm real estate Corporate taxes are itemized under miscellaneous and sales taxes are capitalized with the cost of the improvement Insurance is all fire and farm liability insurance paid on farm property and excludes life insurance and personal and employee health insurance
Other expenses include telephone electricity interest paid and other miscellaneous expenses Electricity and telephone expenses include only the farm share Interest is made up of all interest paid on farm liabilities including finance charges Other operating expenses are all other farm operating expenses not previously itemized which are for a farm enterprise other than the beef enterprise
Breedini stock purchased are only those animals purchased which are added to the breeding herd This expense is normally a capital purchase and not included in the operating expenses for this reason
Machinery and buildini depreciation charges are based on income tax figures Depreciation is an estimate of the value of capital assets used up during the years production Depreciation is part of total accrual expenses but not part of total cash expenses
The largest beef operating expense was beef grain purchased the next largest was hired labor followed by machinery repairs and real estate taxes Of all accrual expenses the greatest was machinery depreciation The total accrual income per cow was $ 783 The accrual operating expense per cow was $ 651 and total accrual farm expenses per cow were $ 799 (operating expenses plus breeding expenses and depreciation) The average net farm income was negative $ 16 per cow
19
Table 6 Farm Expenses Average of Thirty-two New York Beef Farms 1989
Cash Change inmiddot Change in Accrual Accrua16
Item Expenses Inventory Accts Payb1 Expenses Expcow Hired labor $ 2544 $ $ $ 2544 $ 66
Feed Beef grain purchased Beef roughage purchased Other livestock feed
2745 701
32
(133) 148
8
2612 849
40
68 22
1
Machinery Gasoline amp oil Machinery repairs Farm auto expense Machinery hire amp lease
1472 2510
449 624
(185) 1287 2510
449 624
33 65 12 16
Livestock Vet amp medicine Breeding expense Feeders purchased Stockers purchased Mktg amp other beef expo
836 259 320
1079 809
(29) 19
(12)
1 808 278 320
1079 797
21 7 8
28 21
Crops Fertilizer amp lime Seed spray amp oth crop
Real Estate Land bId amp fence rep Taxes (real estate) Rent amp lease
1037 817
1484 2028
944
(116) (164)
(303)
49
12
970 653
1181 2040
944
25 17
31 53 24
Other Insurance Telephone Electricity Interest Paid Misc beef expenses
1392 345 644
1880 735 (18)
1392 345 644
1880 717
36 9
17 49 19
Other operating expenses 111 111 3
Total Operating Exp Breeding Stock Purch Machinery Depreciation Building Depreciation
25797 1113
(785) 62 25074 1113 3090 1509
651 29 80 39
Total Cash Expenses Total Accrual Expenses
$ 26910 $ (785) $ 62 $ 30786 $ 799
6 Sum of total Accrual Expenses Sum open and bred cows on all farms
20
Farm Profitability Measures
Farm ownersoperators contribute labor management and capital to their businesses The best combination of these resources produces optimum profits Farm profits can be measured as the return to all contributed resources or as the return to one or more individual resources such as labor and management A series of farm profitability measures are summarized in Table 7
Net cash farm income is total farm cash receipts less total farm cash expenses Cash expenses include breeding stock purchased
Net farm income without appreciatiQn is total accrual receipts less total accrual expenses Physical changes in inventories are included in this value Appreciation of capital items (livestock machinery and real estate) is excluded
Net farm income including appreciation is total accrual income plus livestock machinery and real estate appreciation less total accrual expenses Livestock machinery and real estate appreciation from the beginning of the year to the end is estimated by each participating beef producer The changes in inventory and appreciation are detailed in Table 10 Farm Inventory and Table 18 Value of Bee~ Inventory
Table 7 Measures of Farm Profitability Average of Thirty-two New York Beef Farms 1989 Item Average --- shy
Total Farm Cash Receipts $ 24589 - Total Farm Cash Expenses 26910
Net Cash Farm Income (2321)
Total Accrual Receipts $ 30245 - Total Accrual Expenses 30786
Net Farm Income wo Appreciation (541)
Total Accrual Receipts $ 30245 + Livestock Appreciation + 2785 + Machinery Appreciation + 1316 + Real Estate Appreciation + 3477 - Accrual Expenses 30786
Net Farm Income wappreciation 7037
Net Farm Income wo Appreciation $ (541) - Family Labor Unpaid $ 650 month 1923 - Interest on $ 90907 average investment
in Non-Real Estate equity capital 5 4545 Return to Labor Management amp Real Estate Ownership (7010)
- Interest on $ 185063 average investment in Real Estate equity capital 5 9253
Return to Operator Labor amp Management (16263)
21
Return to Labor Manasement and Real Estate Ownership identifies the amount of net farm income contributed by the owner-operators labor management and real estate ownership This measure is calculated total accrual receipts less total accrual expenses less the value of unpaid family labor less the opportunity cost of using non-real estate equity The interest charge is 5 percent The interest charge reflects the long-term average rate of return that a farmer might expect to earn in a comparable risk investment This interest charge is charged on average equity in all farm assets except real estate
Return to Operator Labor and Manaampement is the share of the net farm income without appreciation returned to the operators labor and management To calculate Return to Operator Labor and Management deduct an interest charge of 5 percent on the average real estate equity from the Return to Labor Management and Real Estate Ownership value
The average net cash farm income of the thirty-two summary farms is negative $ 2321 Net farm income without appreciation is negative $ 541 Net farm income with appreciation is $ 7037 The difference between these two values $ 7578 is the appreciation in the value of farm assets These producers benefited especially from increases in real estate values and increases in the value and quantity of livestock held However the opportunity costs of these investments contributed to low returns to Labor Management and Real Estate Ownership and to Operator Labor and Management negative $ 7010 and negative $ 16253 respectively
Farm Statement of Net Worth
The first step in evaluating the financial status of the farm is to construct a Statement of Net Worth (balance sheet) which identifies all the assets and liabilities of the business The second step is to evaluate the relationship between the assets liabilities and net worth and changes that occurred during the year Farm assets are valued at market value The market value includes appreciation due to changes in price and changes in inventory quantities
Liabilities include only farm liabilities and the farm portion of liabilities such as mortgages and auto loans The farm net worth and equity position of the farms in the summary tended to be very strong with an average net worth at the end of the year of $ 284347 The average farm net worth increased from the beginning to the end of the year by $ 16754 Farm assets increased by $ 14643 and farm liabilities decreased $ 2111
22
Table 8 Farm Statement of Net Worth
Averaampe of Thirty-two New York Beef Farms 1989 ASSETS Jan 1 1989 Dec 31 1989 Change
Current Farm cashcheckingsavings $ 2139 $ 3179 $ 1040 Accounts receivable 506 444 (62) Stocks amp certificates 363 352 (11) Feed amp Supplies 10133 12240 2107
Intermediate Cows $ 27893 $ 32288 $ 4395 Heifers 5011 5942 931 Bulls 3156 4143 987 Finish Cattle 7224 8135 911 Other Livestock 481 350 (131) Machinery amp Equipment 33929 35609 1680 FLBPCA Stock 303 353 50
Long-term Land amp buildings $ 199431 $ 202177 $ 2746
Total Farm Assets $ 290569 $ 305212 $ 14643
LIABILITIES amp NET WORTH Current Accounts Payable $ 96 $ 157 $ 61 Short term debt 834 1075 241 Advance Government Receipts 0 45 45
Intermediate debt 5483 4014 (1469) FLBPCA stock 303 353 50 Long- term debt 16260 15221 (1039)
Total Farm Liabilities $ 22976 $ 20865 $ (2111)
Farm Net Worth $ 267593 $ 284347 $ 16754
Balance Sheet Analysis
The balance sheet analysis continues by exam1n1ng financial and debt ratios and factors measuring levels of debt Percent equity calculated by dividing net worth by assets is the percentage of all farm assets owned by the farmer at the end of the year Equity increases as the value of assets increase more than liabilities The debt to asset ratio is compiled by dividing liabilities by assets at the end of the year Low debt to asset ratios reflect strength in solvency and the potential capacity to borrow Debt levels per cow are the sum of the total farm debt divided by the sum of open and bred cows on all farms
23
Net worth is the amount farm assets exceed liabilities The change in net worth from the beginning to the end of the year is measured without and with appreciation Chance in net worth without appreciation measures how much more (or tess) the farm is worth not including changes due to price moves The average change in net worth for the thirty-two participating farms was $ 16754 with appreciation and $ 9439 without appreciation Increasing net
worth on many of these farms is due primarily to increases in real estate markets The majority of the debt on these farms is structured as long term debt such as mortgages Ten of the thirty-two farms reported no farm 1iabilities at the end of 1989
Table 9 Balance Sheet Analysis
Average of Thirty-two New York Beef Farms 1989 Item Average
Financial Ratios Percent equity 92 X Debt to asset ratio 008
Change in Net Worth Without appreciation $ 9439 With appreciation 16754
Debt Analysis Dec 31 1989 Ac~ounts payable as X of total liabilities 1 X Operating Deb~ as X of total liabilities 0 X Current amp intermediate liabilities
as X of total liabilities 39 X Long-term liabilities as a X of
total liabilities 60 X
Debt Levels Per Cow Dec 31 1989 Total farm debt $ 750 Long- term debt 537 Current amp intermediate debt 207 Operating debt amp accounts payable 6
24
Farm Inventory
The farm inventory details the changes in the value of major farm assets (real estate machinery amp equipment beef amp other livestock and feed amp supplies) from the beginning to the end of the year Beef inventory changes are detailed in Value of Beef Inventory table 18
Table 10 Farm Inventory Average of Thirty-two New York Beef Farms 1989
Real Machinery Beef amp Other Feed amp Estate amp Equipment Livestock Supplies
Beginning of Year + Purchases + Nonfarm Noncash
Transfers - Lost Capital - Sales - Depreciation
Net Investment + Appreciation
- End of Year
$ 199431 1316
o o
273 1509
198965 3211
202176
33763 3864
o
301 3090
34236 1 316
35552
43765
43634 7224
50858
10133
12240
Repayment Analysis
Repayment analysis shows th~ amount of principal interest and total payments made on debt of various terms This table can be helpful when making decisions about acquiring and structuring new debt Total debt payment per cow is the total interest and principal paid during the year divided by the average number of cows TCle percentage of debt payment to cash receipts is an indication of the amount of cash required to make debt payments The average debt payment made by participating beef producers in 1989 was $ 239 per cow On the average 37 percent of cash receipts is used to service debt However the range in debt as a percent of total receipts was 0 to 239 The average 37 percent is unusually large considering that about one third of the participating farmers have no farm debt at all The large average real estate investment and appreciation and the relatively high real estate debt burden per cow indicate a land base that is greater than che economic needs of che beef herd is being charged against the beef enterprise
25
Table ll Repayment Analysis Average of Thirty-two New York Beef Farms 1989
pebt Payments Principal Interest Total
Long term Intermediate term Short-term Operating (net reduction)
$ 1148 1770
665 16
$ 1427 509
90 11
$ 2575 2279
755 26
Total $ 3599 $ 2037 $ 5635
Total Debt Payment Per Cow $ 239 Percent of total cash receipts 37 X
Capital and Labor Efficiency Analysis
Capital efficiency factors measure how intensively the capital is being used in the farm business The labor analysis is a listing of the hours of work contributed to the farm as estimated by the business summary participant The estimated hours are used to determine the full-time equivalent months of labor used by the farm A value is given to the operator and farm familys unpaid labor
The capital turnover is a measure of capital efficiency as it shows the number of years of farm receipts required to equal or turnover capital investment It is computed by dividing the average farm assets by the years total farm accrual receipts The average capital turnover for the thirty-two farms is 119 years Capital turnover varied between 29 and 468 years
The value of the operators labor to the beef farm is estimated at $900 per month (one month of labor equals 200 hours) The value of the family unpaid labor is estimated at $ 650 per month The value of the unpaid family labor is the months of labor (hours of labor divided by 200) multiplied by $650 The average value of operator hired and family labor used per farm was $ 14403 or $ 476 per cow
26
Table 12 Capital amp Labor Efficiency Analysis
Average of thirty-two New York Beef Farms 1989
Capital Efficiency (Average for Year) Per Cow
Farm capital $ 9405 Real estate 6667 Machinery amp equip 1145
Capital Turnover years 119
Labor Force Houts Operator(s) 1987 Family paid 79 Family unpaid 550 Hired 408
Total 3024200 - 1512 Months Labor
Labor cost Total Per Cow Value of Operator(s)
Labor ($900month) $ 9936 $ 382 Family unpaid ($650month) 1923 55 Hired 2544 39
Total Labor $ 14403 $ 476
Machinery Cost $ 8412 $ 274 Total Labor amp Machinery Costs $ 22815 $ 749 Hired Labor amp Machinery Costs $ 10956 $ 312
Annual Cash Flow Statement
Completing an annual cash flow summary and analysis is necessary to determine how well the cash generated by the business met the annual cash needs of the business Understanding last years cash flow is the first step toward planning and managing cash flow for current and future years This cash flow statement includes only ~ cash inflow and outflow
The cash flow statement lists the farm cash inflows at the top of the page cash outflows next and the difference at the bottom of the page Cash inflows include all cash farm receipts receipts from the sale of farm assets additional funds borrowed as well as cash available in the beginning of the year Cash outflows include all cash farm expenses capital purchases principal payments and decreases in operating debt
For the thirty-two New York beef farms the average cash inflow in 1989 is $29377 and the average cash outflow is $ 35715 The farm families contributed an average of $ 6338 of non-farm income or savings to the farm Besides operating expenses the major farm cash outflows were principal payments on loans and machinery purchases
27
Table 13 Annual Cash Flow Statement
Averaae of Thirty-two New York Beef Farms 1989
Cash Inflows
Beginning farm cash checking amp savings $ 2139 Cash farm receipts 24586 Sale of assets Machinery 301
Real estate 515 Sale of Stocks and Certificates o Money borrowed (intermediate amp long-term) 930 Money borrowed (short-term) 906 Increase in operating debt o
TOTAL $ 29377
Cash Outflows
Cash farm operating expenses $ 25797 Capital purchases Breeding livestock 1113
Machinery 3864 Real estate 1316 Purchase of Stocks and Certificates 44
Principal payments (intermediate amp long-term) 2918 Principal payments (short-term) 665 Decrease in operating debt 0
TOTAL 35715
NET NONFARM CONTRIBUTION TO FARM 6338
Beef Enterprise Analysis
The beef enterprise receipts and expenses table 14 shows the average receipts and expenses attributed to just the beef enterprise The purpose of the beef enterprise table is to calculate the profitability of the beef enterprise and to determine to what extent the beef enterprise contributes to the profitability of the entire farm Non-beef income and expenses such as income from other livestock other livestock feed and other operating expenses are not included Other income or expenses which may be who1e1y or partially attributed to the beef enterprise are allocated by the participating beef producer on a percentage basis Because most of participating beef producers had only a beef enterprise the beef enterprise analysis is very similar to the farm income and expenses tables 5 and 6 The average beef enterprise net cash farm income is negative $ 2384 and the beef enterprise net farm income (accrual) is negative $ 1103
28
Table 14 Beef Enterprise Receipts and Expenses Avg[sectampg 2f Ih1[tx-tw2 ~ew Y2[k Bggf [a[msect 1982
Cash Change Change in Accrual Accrua17
Rf~fIEIS Rece1nt~ in Inv A~ctsect Rgcbl Receints Inccow Feeder calf sales $ 7762 $ 118 $ 34 $ 7914 $ 205 Finished cattle 4234 558 0 4792 124 Breeding stock 3831 3650 (63) 7418 192 Cull cattle 2236 0 2236 58 Crop Sales 1065 821 0 1886 49 Custom work 176 0 176 5 Government payments 1108 0 1108 29 Misc receipts Z87 0 787 20 Total Cash Receipts $ 21199 TOTAL ACCRUAL RECEIPTS $ 5147 $ (29) $ 26317 $ 682
Cash Change in Change in Accrual Accruals EXP~NSf~ f~nensectes Invgnto[X Ac~ti Psectpoundbl f~nensectesect E~nLcow
Hired labor $ 2395 $ $ $ 2395 $ 62 Feed
Beef grain purchased 2745 (133) 2612 68 Beef roughage purchased 701 148 849 22
Machinery Gasoline amp oil 1205 (50) 1155 30 Machinery repairs 2062 2062 53 Farm auto expense 421 421 11 Machinery hire amp lease 377 377 10
Livestock Vet amp medicine 836 (29) 807 21 Breeding expense 259 19 278 7 Feeders purchased 320 320 8 Stockers purchased 1079 1079 28 Mktg amp other beef expo 809 (12) 797 21
Crops Fertilizer amp lime 882 (43) 17 856 22 Seed spray amp oth crop 661 (65) 596 15
Real Estate Land b1d amp fence rep 1259 (140) 1119 29 Taxes (real estate) 1827 12 1839 48 Rent amp lease 800 800 21
Other Insurance 1052 1052 27 Telephone 308 308 8 Electricity 605 605 16 Interest Paid 1132 1132 29 Misc beef expenses Z35 (l~n 717 -12
Total Operating Exp 22470 (323) 29 22176 575 Breeding Stock Purch 1113 1113 29 Machinery Depreciation 2725 71 Building Depreciation 1406 2sect Total Cash Expenses $ 23583 TOTAL ACCRUAL EXPENSES $ (323) $ 29 $ 2742Q $ -ID Beef Enterprise Income $ (2384) $ (1103) $ (29)
7 Sum total accrual receiptssum open and bred cows on-all farms
8 Sum of total accrual expensessum open and bred cows on all farms
29
Herd and Crop Manaiement
This section reports production information for the cropping program and the beef herd Production efficiency is a key ingredient of a consistently profitable farm Crop yields calving percentages weaning weights and other productivity measures must be high to be successful in the competitive beef industry
1989 Crop Production
On many cow calf operations decisions concerning the cropping progtam could make a big difference in profitability A complete evaluation of available land resources how they are being used how well crops are producing and what it costs to produce the~ is required to evaluate alternative cropping and feed purchase choices
In table IS forage crop yields are reported as total tons dry matter produced and tons dry matter produced per acre Corn Silage production is shown on a wet and dry matter basis Corn grain and oats are measured in dry bushels The acreage devoted to pasture is also shown Crop acres and yields compiled for the average represent only the number of farms reporting each crop Thirty of the thirty-two farms produced dry hay or hay crop silage One farm did not produce any crops Nine farms produced corn silage and seven produced corn grain
Table 15 1989 CIO] fIogUt1 0 n AV~Ia~ Qf 32 Hew YOJk Be~f [aIIDsect
------ Production - --CIoP [arms AIesect Total Per A Ie
Hay crop - Total 30 100 176 18 tn OM Corn silage (wet) 9 34 408 109 tn Corn silage (dry) 147 39 tn OM Other forage 2 12 30 21 tn OM Total forage 30 112 224 21 tn OM Corn grain 7 11 697 616 bu Oats 5 32 412 21 7 dry bu Other crops 1 7 Tillable pasture 13 91 Crop residue pastured 6 52
30
Herd and Crop Manaiement Analysis
Table 16 contains summaries of productivity in various categories The average herd and crop management measures include only those farms reporting a given measure The range is the top and bottom value of all farms in the summary The herd productivity on the thirtymiddottwo farms tended to be very good Average conception rate percent born and percent weaned averages were all in the 90 percent range The conception rate is the percentage of cows and heifers exposed to the bull who are confirmed pregnant Average weaning weight is ind~cative of genetic capability of the herd as well as pasture management
On the average farm 19 calves were sold as feeders weighing 543 pounds at an average price of $7466 per hundredweight and 5 were sold as finished cattle weighing 936 pounds at an average price of $7485 per hundredweight As discussed in Economic Factors Affecting New York Beef Producers page 4 the demand for feeder calves was strong in 1989 However if cost of gain is competitive retaining ownership to finished weights can be an effective way to increase profits and decrease risk by selling more product per breeding cow maintained and spreading price risk over two phases of beef production
Forage production both hay crop and corn silage were below average New York State typical levels Average hay crop yield of 18 ton dry matter per acre and crop silage yields of 109 ton per acre were below state averages of 229 and 13 tons per acre9 When the forage production is at the low end of the range 8 ton dmacre it is probably more cost efficient to buy forage than produce it The direct crop expensescrop acre also varied widely Direct crop expenses include the accrual expenses for fertilizer lime seed spray and other crop expenses divided by the total number of crop acres
One of the key measures of efficiency is the number of days productive pasture is available Every day on pasture saves an average of 50 cents to one dollar in feed costs tO The average days on pasture was 185 which is typical of New York State However it is not known how productive the pasture was over the 185 days A decline in pasture quality and quantity in late summer and fall can reduce calf gains by 1 to 2 1bday1 An important measure which should be considered when measuring productivity is total feed costcow The cost of increasing land productivity must be weighted against reductions in feed costscow and the increased number of cows that can be kept However increasing the stocking rate can help dilute fixed overhead costs especially machinery costs
9 New York Agricultural Statistics 1988-1989 New York Department of Agriculture and Markets July 1989
10 Philip Teague Soil Conservations Service Economist Personal communication
11 Dan G Fox Fact Sheet 1300B Cornell Beef Production Manual Cornell University 1986
31
Table 16 Herd and Crop Management Analysis
Average and Range of Thirty-two New York Beef Farms 1989
Item Averaampe Ranampe Conception Rate X 935 500 - 100 Calves weaned X 945 733 - 100 Calves born X 965 846 - 100
Average weaning weight 514 400 - 683
Average calf weaning age days 208 137 - 300 Average cow weight at weaning lbs 1131 800 1450 Number of bulls used 22 0 10
Number of feeders sold 188 o - 116 Average weight feeder sold 543 350 - 800 Avg feeder price receivedcwt $ 7466 $ 3519 - 9028
Number of finished cattle sold 55 0 - 73 Average weight finished cattle sold 936 400 - 1160 Ave finished cattle price receivedcwt $ 7485 $ 3850 - 10000
Tons hay crop dry matter per acre 18 8 56 Tons forage dry matter per acre 21 8 - 49 Tons forage dry matter harvestedcow 73 20 - 248 Direct crop expenses crop acre $ 1739 $ o - 8840
Tillable acres cow 48 o - 180 Pasture acres cow 42 9 - 246 Days on pasture 185 150 - 225
32
~_~__va~~uC~ a~ ~ne oeglnnlng and end of the year is shown in table 17 The price of pregnant cows and heifers is calculated on a per head basis All other prices are in dollars per pound
Table 17 Livestock Market Values and Stock Numbers
Average of Thirty-two New York Beef Farms 1989
------ Jan 1 1989 ------ ------ Dec 31 1989 ---- Cattle Type II Hd Lbslhead Price II Hd Lbstbead Price
Bred cows amp heifers 352 1110 $ 765hd 391 1142 $ 800hd Open cows 14 1196 0621b 16 1165 069lb Replacement heifer 87 706 0801b 102 675 0S51b Service bulls 13 1681 0741b 21 1669 0701b Other bulls 20 885 0781b 19 867 OSOlb Feeder cattle 123 525 0751b 128 532 079lb Finish cattle 44 900 0741b 49 883 077lIb
Value of Beef Invento[y
The change in value of the beef inventory is shown on table 18 The first column indfcates the value of animals held at the beginning of the year at beginning of the year prices The second column Change in inventory without appreciation is the change from the beginning to the end of the year in livestock numbers valued at the beginning of the year prices The next column appreciation shows the increase (or decrease) in value due to price changes The last column shows the end of the year market value of the livestock inventory
The average farm showed a $ 4326 increase in the physical inventory of cattle and a $ 2898 increase in the value of the inventory held due to price changes This table may vary from table 9 due to changes in the inventory of non-beef livestock
Table 18 Value of Beef Inventory (Jan 1 1989 and Dec 31 1989)
Average of Thirty-two New York Beef Farms
Beg of year + Change in inv + Appreciation End of year value wlo appreciation value
Pregnant Cows amp Heifers $ 26673 $ 2599 $ 1884 $ 31156
Open Cows 1220 (189) 101 1132 Rep Heifers 5Oll 583 348 5942 Service Bulls 1616 921 187 2724 Other Bulls 1540 (264) 144 1420 Feeder Cattle 5026 118 209 5353 Finish Cattle 2199 558 25 2782
TOTAL $ 43285 $ 4326 $ 2898 $ 50509
33
~Qnclusion
In each of the four Northeast Beef Farm Business Summaries recently published (1986-1989) the conclu~ions have been essentially the same The participating beef producers have negative or break-even net farm incomes but have significant capital growth and positive returns when capital appreciation is considered This is not unusual In the CQst of PrQdycinamp US Livestock 1972-87 the USDA calculates that the average US beef cow-calf enterprise had higher cash expenses than cash receipts in 9 of the 16 years between 1972 and 198712
Consistently over the past four years many of the farms submitting records had high overhead and fixed expenses especially depreciation interest taxes and insurance compared to their operating income In many cases beef cow-calf herds are maintained on land that would be held by the owner even if there was no farm enterprise operated In these cases the land o~nership costs (building depreciation taxes insurance etc) would be incurred without the beef herd These costs being charge against the beef herd skews the true profitability of the beef enterprise The profitability of the enterprise therefore has to be considered in this context
The negative average cash flow and low cash farm income combined with the favorable equity position is due in part to appreciation indicating that many of the producers are using the beef farm as a forced savings account By purchasing farm machinery cattle and especially land they are making a long term investment This is not to suggest that all beef farmers are real estate speculators
Another constant result from each of the Beef Farm Business Summaries are the large ranges in cost control capital efficiency and profitability measures between individual farms Some of the cooperators in the 1989 Beef Farm Business Summary did increase their income Of the thirty-two participating farms
fifteen had a positive net cash farm income seventeen had a positive net farm income without appreciation twenty-three had a positive net farm income with appreciation ten had a positive return to operator labor management and real estate ownership and three has a positive return to ope-ator labor and management
12 Costs of Producinamp US Livestock 1972-87 Hosein Shapouri Russell Bowe Terry Crawford and Warren Jessee USDA ERS Agricultural Economic Report Number 632 April 1990
34
In 1989 as with the beef farm summaries conducted from 1986-1988 the average producer increased net worth but did not make a profit ltas measured by Accrual Net Farm Income) The reasons for this vary from farm to farm In general however the farms in the summary which had negative net farm incomes had too great a capital investment for themiddot size of their business and high operating costs per cow Increasing cow numbers and careful budgeting when making a capital purchase decision could increase the returns on these farms However the primary goal on these farms may not be profit maximization In which case increasing herd size may diminish the owners enjoyment and comfort level with the beef enterprise
Because of the low number of farms participating in each of the Beef Farm Business Summaries the authors cannot analyze why there is such a wide range in profitability and performance between beef farms With a large database we could start to define the factors which result in profitable beef enterprises Participation in the Farm Business Summary is~ If you or a neighbor or friend would like to participate in the Beef Farm Business Summary contact
Caroline Rasmussen Department of Animal Science 130 Morrison Hall Ithaca NY 14853 (607) 255-7712
35
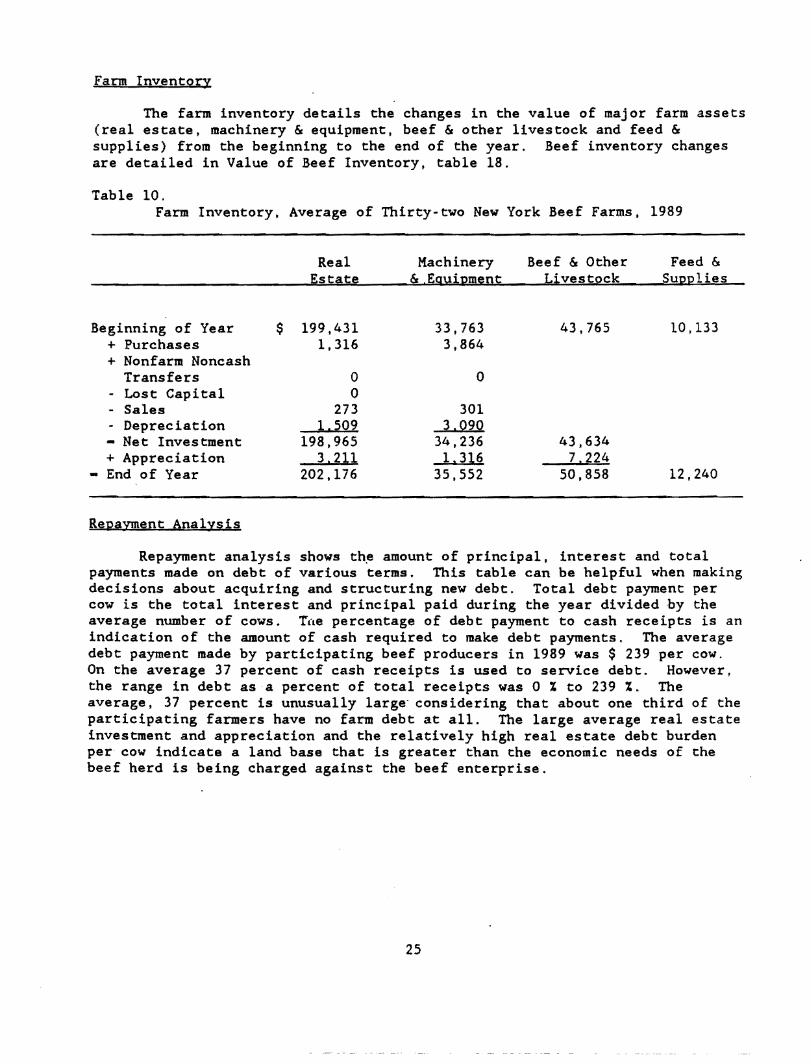
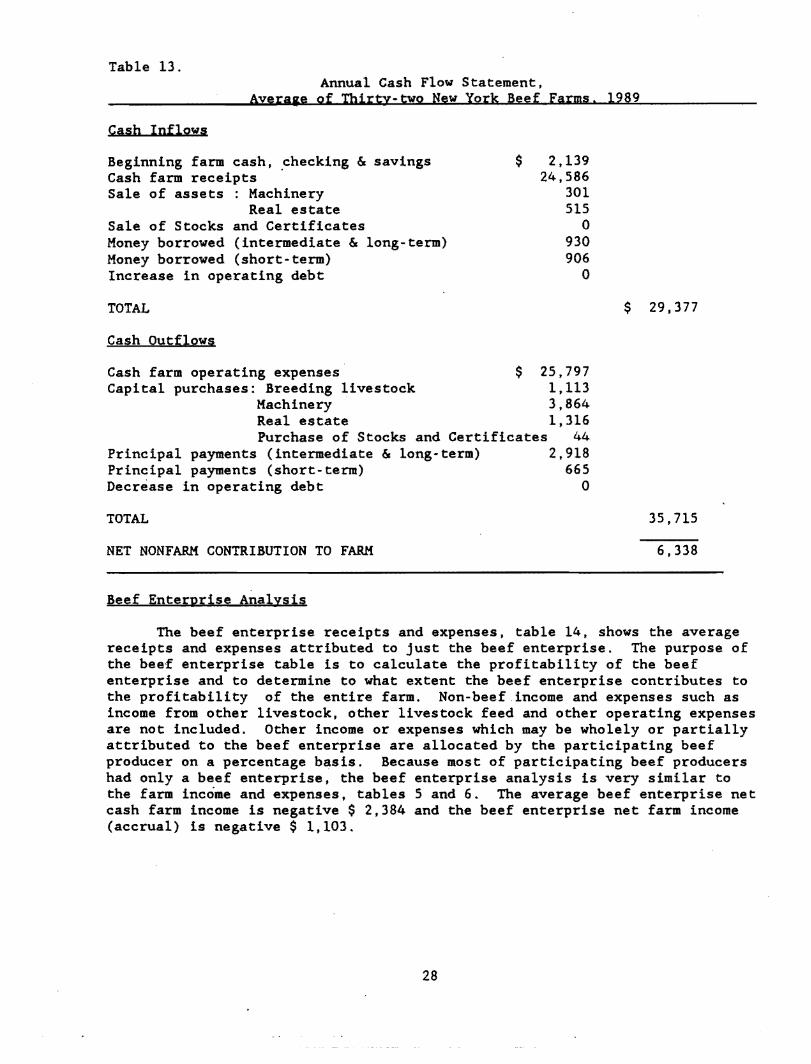