1985 frb minneapolis
TRANSCRIPT
Federal Reserve Bank of Minneapolis 1985 Annual Report
The Fed's Money Supply Ranges: Still Useful After All These Years
Digitized for FRASER http://fraser.stlouisfed.org/ Federal Reserve Bank of St. Louis
Contents
President's Messege 1
The Fed’s Money Supply Renges:Still Useful After All These Years 3
Statement of Condition 16
Earnings and Expenses 17
Directors 18
Officers 19
Digitized for FRASER http://fraser.stlouisfed.org/ Federal Reserve Bank of St. Louis
President's Message
The economic essay which comprises this year’s Annual Report addresses a subject that is, in my judgment, a critical issue in monetary policy determination. Specifically, it attempts to identify and to explain the valuable roles of growth ranges for the monetary aggregates and to contrast those roles with some popular misconceptions about the appropriate use of the aggregates in the policy process.
While the immediate provocation for this essay was the pronounced overrun in M l growth last year and some of the commentary that ensued, it seems to me that far broader concerns are raised by discussion and assessment of the 1985 experience. Thus, we argue here that in conducting policy, it is inappropriate to take the money supply measures as targets in the sense that policymakers ought to react to them irrespective of other developments in the economy and in financial markets. Such an approach is inefficient and, more importantly, runs the risk of interfering unnecessarily with attainment of the ultimate objectives of policy-high employment, sustainable economic growth, and stable prices.
Growth ranges for the monetary aggregates, although not in our judgment legitimate policy targets, are valuable to policymakers and the public in other ways. To my mind, the ranges, if appropriately established, effectively add discipline to policy determination and simultaneously provide a mechanism for Congress and the public, as well as Federal Reserve policymakers, to monitor and review performance. The ranges are also an effective means of communicating to a broad and diverse audience the stance of monetary policy on the assumption that the economy performs about as the policymakers expect. Finally, behavior of the monetary aggregates provides policymakers useful information about their ultimate objectives, a role played, of course, by a wide range of economic time series.
In most respects, the views we are presenting here are based on principles derived from economic theory. This does not say, however, that they are universally accepted within the economics profession or by policymakers generally. In this sense, they represent a personal perspective on the role of the aggregates in policymaking, and I need to emphasize that we are not speaking for others in the Federal Reserve on these issues.
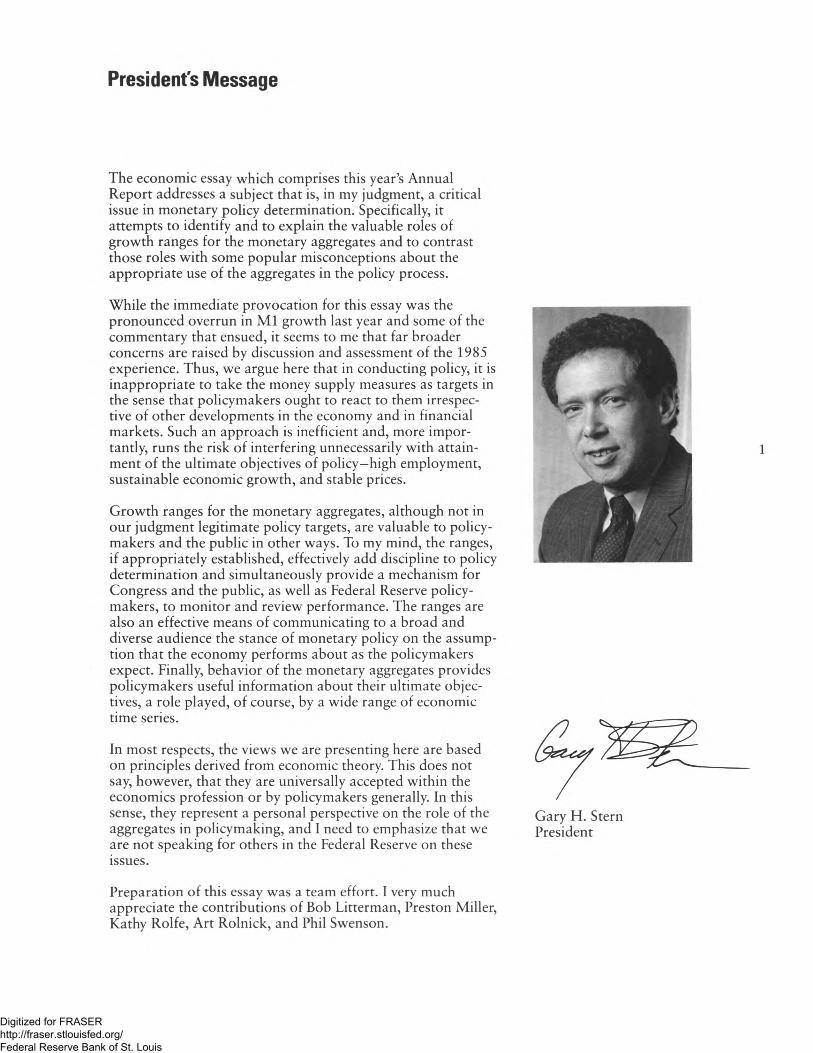
Gary H. Stern President
Preparation of this essay was a team effort. I very much appreciate the contributions of Bob Litterman, Preston Miller, Kathy Rolfe, Art Rolnick, and Phil Swenson.
Digitized for FRASER http://fraser.stlouisfed.org/ Federal Reserve Bank of St. Louis

Digitized for FRASER http://fraser.stlouisfed.org/ Federal Reserve Bank of St. Louis
Federal Reserve Bank of Minneapolis 1985 Annual Report
The Fed's Money Supply Ranges: Still Useful After All These Years
The past year was a difficult one for the Federal Reserve as a monetary policymaker. Although the U.S. economy continued to expand and inflation remained subdued, the Fed’s narrow measure of the money supply (M l) leaped far above its announced range. The Fed thus had to choose between trying to bring this measure back within its range, which could jeopardize the recovery, and ignoring the money measure’s faster-than- expected growth, which could lead to higher inflation. The Fed chose the latter course.
The Fed’s situation did not go unnoticed. Many seemed to blame the Fed for allowing the money supply to grow so fast; they criticized the Fed for a lack of commitment to its own strategy of targeting the money supply and thus to its own long-run goal of reducing inflation. Others seemed to blame the Fed for its choice of targets; they criticized the use of money measures and called for a look at other variables that might be more controllable.
While public scrutiny of monetary policy is, of course, appropriate, such criticisms are not. They seem to be based on a misunderstanding of the role that money ranges play for the Fed. It uses these ranges as economic theory says is best, and that is not as targets. That is, they are not meant to be goals which the Fed will aim to achieve regardless of what else is happening. The only things the Fed treats that way are things like the price level, employment, and output; information on anything else— including
money— is only useful for what it can tell the Fed about whether or not those goal variables are on target. What the money ranges are meant to be are indicators to the public of the general course of monetary policy if the economy performs as expected. The ranges give the public a simple, shorthand form of the complicated policy rule which the Fed implicitly uses to decide when and how to act given its goals, the economy’s interrelationships, and uncertainties. Any specific ranges tell the public just what the Fed’s actions will imply for the growth of money during that period if the usual economic patterns persist. The ranges also provide a simple, though not infallible, way for the public to monitor the Fed’s performance.
From this perspective, the experience of 1985 should look quite different to Fed- watchers. The exceptionally rapid growth in M l was good reason for the public to ask for an explanation, since it could have indicated a change in the Fed’s policy. But the M l growth surprised the Fed as much as anyone. It turned out to be due to a change not in Fed policy but in the economy, in particular, in the way the public was managing money. While this change increases the uncertainty about the relationships between money and the rest of the economy, it does not make the money ranges useless for their role as indicators of Fed policy. Instead, it simply suggests that M l ’s range for 1986, to reflect the increased uncertainty, should probably be somewhat wider than those for recent years.
Digitized for FRASER http://fraser.stlouisfed.org/ Federal Reserve Bank of St. Louis
The Best Way to Make Monetary Policy
The situation of a U.S. policymaker is not easy in any year. The Fed has a somewhat vague general objective of maximizing the current and future welfare of society, which all public policy institutions share. Congress has translated that into a few broad operating goals— stable prices, high employment, and economic growth, for example— but these are not necessarily compatible goals, the Fed has no direct control over them, and they are measured only infrequently. The Fed does have direct control over a few financial instruments— bank reserves and the discount rate, for example— which it can change as often as daily, but these are far removed from the goals; movements in the instruments can influence the goal variables only through a long chain of other variables. The Fed has data on these other variables— including various measures of the money supply— some of which are available more frequently than data on goal variables. But these it can’t control directly either. It can only influence them to varying degrees, with varying degrees of uncertainty, by adjusting its instruments.
What’s a policymaker to do? The Fed does what economic theory says is best for a decisionmaker in this situation: It uses all the information available at each point in time to move as close as possible to its broad goals. This means not targeting anything except those goals. (See the list at the end of this essay for suggested reading about the economic theory behind this optimal strategy.)
Targeting in this context means just what one might guess: aiming to hit particular values. Again, the Fed targets the variables that represent its broad goals (variables like a price index, the unemployment rate, and
the gross national product). For any period, the Fed aims at its targets by determining as best it can— using everything it knows about the past and current values of all variables and their relationships— paths for the goal variables which for that period represent the best possible outcome, the closest the goal variables can get to their targets from where they currently are. This involves ranking the various possible outcomes that the various settings of its instruments can achieve, since movement toward one target can unavoidably interfere with movement toward another. The Fed then sets its instruments as is consistent with the best (the highest-ranked) possible outcome. As new information becomes available, the Fed uses it to take aim again— to determine how far from the targets the goal variables now seem to be and how close they might be able to get— and adjusts its instruments accordingly.
In this strategy, the Fed’s money measures are not targeted. They are instead among the many variables the Fed uses to determine how next to aim at its goals by adjusting its instruments. (They are thus known as information variables.) At each point in time, the Fed predicts paths for information variables that seem historically consistent with the current best paths for its goal variables and, as new data arrive, compares them to the predictions. Since information variables are not targeted, not every deviation from their predicted paths will warrant a response or an attempt to fully offset the deviation. What matters to the Fed is not what these deviations mean for the information variables, but what they mean for the goal variables’ movements toward their targets. The Fed determines when and how to respond by studying the estimated historical relationships and uncertainties among all known variables and the Fed’s instruments. Given any new bit of information, a deviation of a variable from its predicted path, the Fed decides whether and how its
Digitized for FRASER http://fraser.stlouisfed.org/ Federal Reserve Bank of St. Louis
best possible outcome has changed and how it should adjust its instruments so they now lead to that outcome. In practice, this complicated policymaking process may be somewhat informal and unsystematic. Nevertheless, the process is best characterized as a policy feedback rule that describes the best setting for the Fed’s instruments given its goals, their rankings, and all the available information. (This rule is generally what is meant by the term Fed policy.)
This monetary policy strategy of using variables like the money measures as providers of information about targeted goal variables is better than targeting the information variables themselves. Unlike targeting, the information variable strategy uses all available information and is not likely to lead the Fed to act in ways inconsistent with its goals. If an information variable were targeted, the Fed’s efforts to keep it on target might make the Fed ignore information that other variables were offering about its real goals. Not targeting anything but those goals means every piece of available information is noticed. Similarly, if an information variable were targeted, the Fed’s actions to keep it on target might make it mistakenly lead the economy away from the real goals. Not targeting information variables means responding to their deviations only to the extent necessary to keep the economy moving as close as possible to those goals.
Note that this best way to conduct monetary policy is quite different from the view many people seem to have of the Fed’s strategy, at least with regard to its money supply measures. The Fed does not, in a strict sense, target these measures, as many seem to believe. Moreover, in the information variable strategy, predicted ranges for these measures have no particular purpose. Every movement in the money measures away from their predicted paths is noticed and valued for whatever significance it has for movements in goal variables.
Policy Indicators
This is not to say that money supply ranges are useless to the Fed. They are valuable as indicators to the public and Congress of the Fed’s policy intentions and performance.
■ Why Indicators?
Certainly telling the public something about monetary policy is appropriate. This policy affects people, individual decisionmakers, not just impersonal variables. They are the society whose welfare the Fed is aiming to maximize. And that welfare is affected by how much they know about what the Fed intends to do.
Of course, not every individual is made better off by any particular government policy. People in different circumstances can be affected quite differently. Borrowers and lenders, for example, are affected differently by a policy that results in lower interest rates, after adjusting for inflation (lower real interest rates, that is). Lower real rates would help borrowers because they would have to give up less real income to pay off their loans. But lenders would obviously be hurt by this policy since their investments (the loans) would earn them less real income. The choice of the policy that results in lower real interest rates, like any other, is a choice with individual gainers and losers.
Making such a choice in a democracy— weighting the interests of different groups of people— is generally considered a political task, one appropriately done by the public’s elected representatives. Monetary policy choices are not exceptions. However, Congress established the Federal Reserve as a fairly independent unit within the government, because some independence was considered important for implementing policy. The Fed contains no elected officials.
Digitized for FRASER http://fraser.stlouisfed.org/ Federal Reserve Bank of St. Louis
(Its governors are appointed by the President.) The Fed thus has a responsibility to announce its policy plans to the public, to provide an opportunity for Congress, their elected representatives, to evaluate and influence those plans.
But the choices of individual members of the public will be influenced by the Fed’s plans whether or not they are announced. People making economic decisions pay attention to all relevant information, and most recognize that Fed policy is relevant; it will no doubt have some effect on the value of their dollars, for example. If the Fed does not tell the public its policy, therefore, people will try to guess it, and that could make many people worse off. It means resources which might have been used productively will instead be used to reduce the uncertainty about policy. That means consumption and output will be less than they would have been otherwise. And since uncertainty about policy will not be eliminated, just reduced to varying degrees, people will not be able to make decisions which will make themselves as well off as they might be. Announcing monetary policy plans, in other words, helps individuals maximize their own welfare.
How the Fed announces its plans matters, too. It must be in some way the public can use to watch how the Fed actually performs so that the Fed knows it must explain if it seems to act differently. For if the Fed does not face such discipline, it may find a change from the best plans tempting. And if the public cannot easily monitor the Fed’s performance, they may act to make such a change inevitable.
The Fed’s announced plans, remember, should be those based on its (and Congress’) judgment of the best possible outcome for its goal variables. The achievement of that outcome usually depends on how committed the public believes the Fed is to its best
policy. If the Fed is viewed as committed, the best outcome will likely be achieved. But if there are no formal ways to guarantee Fed commitment, the public will have good reason to be skeptical about it. For like many other government policies, the best monetary policy is not time consistent; as time goes by, that is, the Fed may no longer want to follow it. Instead, the Fed may want to change policy in order to take advantage of decisions the public commit themselves to, to achieve outcomes it could not have achieved otherwise. Eventually, though, the public will come to expect the Fed to change its policy, and they will act to protect themselves when it does. Those actions will, then, ensure a policy change and an actual outcome worse than the best.
To make this more concrete, consider a simple hypothetical example involving inflation and wage contracts. Suppose first that the Fed must commit to implement what it sees as the best policy plan. As it makes that plan, it notices that the economy includes some wage contracts that were negotiated in previous periods; that is, the dollar amount of the wages of some workers is fixed for the current period. Then, in that period, the Fed’s best policy may be to inflate, or raise the price level, more than people who negotiated the contracts expected in order to reduce the real value of wages and so stimulate the economy. (If workers’ dollars buy less, the workers cost less; so higher inflation encourages firms to hire more.) In future periods, though, the Fed’s best policy may be to not inflate at all, because otherwise people would build the inflation into their wage contracts and the result would just be higher inflation with no higher employment. So, in sum, the Fed’s best policy is to inflate only in the current period. Since here the Fed must implement its plan, it does. People expect it to and act accordingly. And the result is no inflation after the first period.
Digitized for FRASER http://fraser.stlouisfed.org/ Federal Reserve Bank of St. Louis
Now suppose the Fed is not forced to commit to its best policy. The Fed will still observe fixed wage contracts, based on particular expectations for inflation. And the Fed will still initially decide to inflate in the current period and not to inflate in future periods. If people believe the Fed is committed to that policy, they will negotiate new contracts expecting no inflation in future periods. But as each new period arrives, the Fed will want to reconsider its policy. In each period, just as in the first, the Fed will observe wage contracts based on expectations of no inflation, so that it will decide to inflate in that period and never again. The policy (rule) it will actually be following, though, will be to inflate every period— a clear change. This policy cannot work for long, of course. People will quickly begin to expect the Fed to inflate more than before and will begin to build that expectation into their contracts. This will make the Fed want to at least match that expectation in order to prevent a drop in employment (due to a rise in the real cost of workers). The inflationary spiral will continue until the inflation/unemployment tradeoff is no longer attractive to the Fed. No formal commitment in this example, then, will lead to some inflation rather than no inflation, without any increase in employment.
In summary, the policy that is best when the Fed is committed— here, no inflation— is not time consistent when the Fed is not committed. And the policy that is time consistent when the Fed is not committed— here, some inflation— is worse than the best when the Fed is committed.
Announcing Fed policy in a way that the public can easily monitor can increase the Fed’s commitment to the best policy and the likelihood that the best outcome will be achieved. If the Fed knows the public can see its behavior and demand an explanation or enforce discipline if the Fed seems to be acting in a way inconsistent with its plan,
the Fed is less likely to act that way. And with such a monitoring system working, the public is less likely to expect such a change and act in ways that encourage it.
■ Why Money Ranges?
To completely communicate monetary policy to the public, the Fed might give them its feedback rule— how any particular new piece of information will result in an instrument change given the Fed’s goals, the economy’s interrelationships, and the inherent uncertainties. This rule, however, is mainly implicit in the Fed’s behavior; it is too informal, complex, and possibly unsystematic to describe explicitly. What the Fed tells the public thus must be simpler than this rule but clearly related to it.
Congress must have considered ranges of growth in the Fed’s various money supply measures adequate ways to indicate policy, because it enacted laws specifying their use. In regular monetary policy reports to Congress, the Fed is required to reveal planned annual growth ranges for these measures, along with planned annual values for its goal variables.
Congress’ choice of the money growth ranges is not unreasonable. The money measures are in the right position to stand in for the Fed’s feedback rule; they are influenced by the Fed’s instruments and have had quite stable relationships to its goal variables. Planned growth in these few measures is not hard to understand. And growth ranges are better than paths as policy indicators because they are more representative of the feedback rule. Ranges take into account the fact that the Fed doesn’t, in a strict sense, target money. Again, it responds to deviations from money’s predicted path only to the extent that the feedback rule says is appropriate to get the targeted goal variables back on track (moving as close as possible to their targets). Given what is
Digitized for FRASER http://fraser.stlouisfed.org/ Federal Reserve Bank of St. Louis
happening to the other variables and inherent unpredictability in economic relationships, the Fed’s response to money deviations will not generally keep money on track (on its predicted path) too. Thus, a range of money growth rates, not just a path, is consistent with any particular policy.
Besides to some degree representing the Fed’s feedback rule, announced money supply ranges give the public a fairly easy way to monitor the Fed’s performance and strengthen the Fed’s commitment to its announced (best) plan. By just comparing the actual growth in the money measures to the Fed’s announced ranges, the public can detect possible policy changes and call on the Fed to explain them.
The public should keep in mind, however, that this monitoring method is imperfect. The money growth ranges are, after all, not perfect representatives of the feedback rule. Discrepancies between predicted and actual growth may thus be due to changes in the public’s behavior rather than the Fed’s. If longstanding behavior patterns change, the relationships between the money measures and goal variables change, and the Fed’s announced ranges will no longer be appropriate for its (unchanged) best policy.
An Exemplary Year
The experience of 1985 illustrates the need for caution when using the Fed’s money growth ranges to monitor monetary policy.
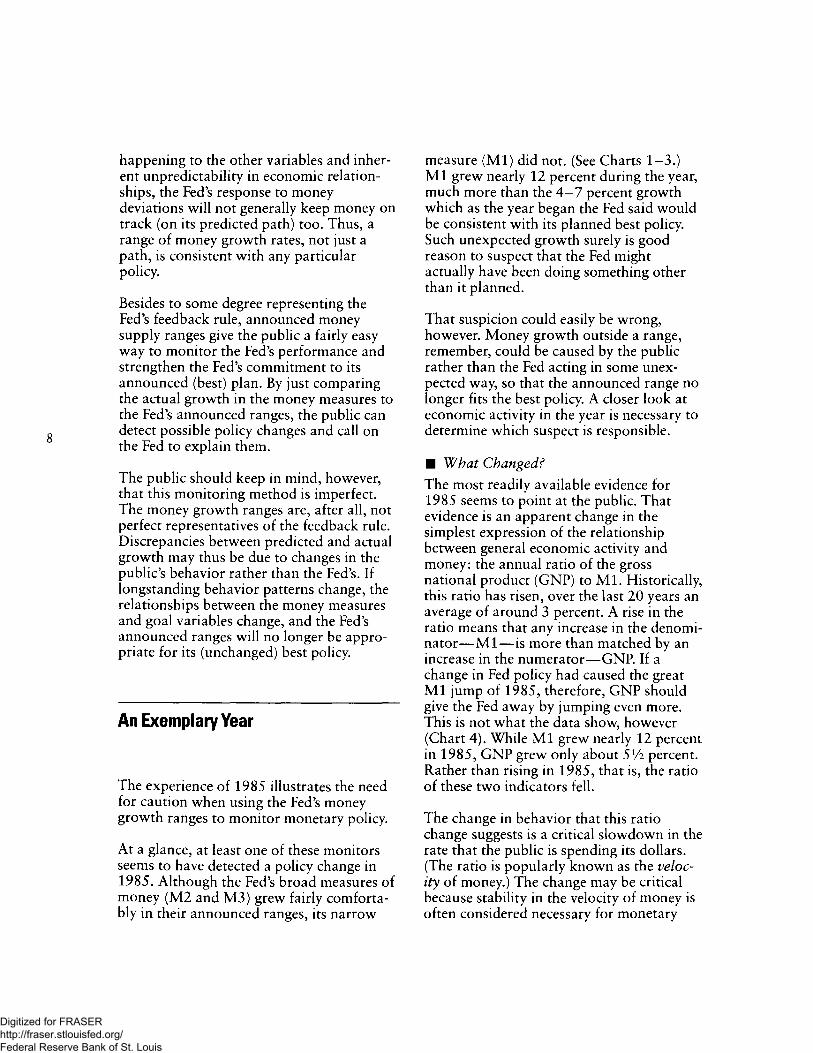
At a glance, at least one of these monitors seems to have detected a policy change in 1985. Although the Fed’s broad measures of money (M2 and M3) grew fairly comfortably in their announced ranges, its narrow
measure (M l) did not. (See Charts 1—3.)M l grew nearly 12 percent during the year, much more than the 4—7 percent growth which as the year began the Fed said would be consistent with its planned best policy. Such unexpected growth surely is good reason to suspect that the Fed might actually have been doing something other than it planned.
That suspicion could easily be wrong, however. Money growth outside a range, remember, could be caused by the public rather than the Fed acting in some unexpected way, so that the announced range no longer fits the best policy. A closer look at economic activity in the year is necessary to determine which suspect is responsible.
■ What Changedf
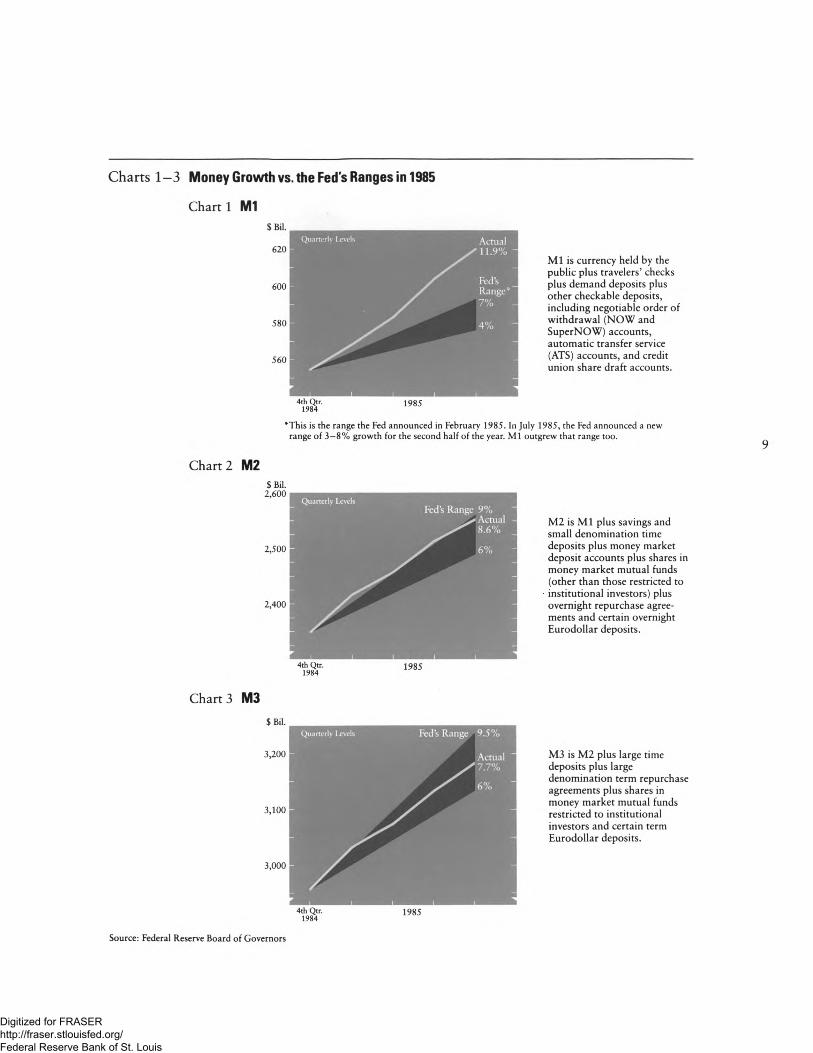
The most readily available evidence for 1985 seems to point at the public. That evidence is an apparent change in the simplest expression of the relationship between general economic activity and money: the annual ratio of the gross national product (GNP) to M l. Historically, this ratio has risen, over the last 20 years an average of around 3 percent. A rise in the ratio means that any increase in the denominator— M l— is more than matched by an increase in the numerator— GNP. If a change in Fed policy had caused the great M l jump of 1985, therefore, GNP should give the Fed away by jumping even more. This is not what the data show, however (Chart 4). While M l grew nearly 12 percent in 1985, GNP grew only about 5Vi percent. Rather than rising in 1985, that is, the ratio of these two indicators fell.
The change in behavior that this ratio change suggests is a critical slowdown in the rate that the public is spending its dollars. (The ratio is popularly known as the velocity of money.) The change may be critical because stability in the velocity of money is often considered necessary for monetary
Digitized for FRASER http://fraser.stlouisfed.org/ Federal Reserve Bank of St. Louis
Charts 1 -3 M oney Growth vs. the Fed's Ranges in 1985
M l is currency held by the
public plus travelers’ checks plus demand deposits plus
other checkable deposits,
including negotiable order of
withdrawal (NOW and
SuperNOW) accounts,
automatic transfer service
(ATS) accounts, and credit union share draft accounts.
4th Qtr. 19851984
"This is the range the Fed announced in February 1985. In July 1985, the Fed announced a new
range of 3-8% growth for the second half of the year. M l outgrew that range too.
Chart 2 M2$ Bil.2,600
2,500
2,400
M2 is M l plus savings and
small denomination time
deposits plus money market
deposit accounts plus shares in money market mutual funds
(other than those restricted to
institutional investors) plus
overnight repurchase agreements and certain overnight
Eurodollar deposits.
4th Qtr. 1984
1985
Chart 3 M3$ Bil.
3,200
3,100
3,000
M3 is M2 plus large time
deposits plus large denomination term repurchase
agreements plus shares in
money market mutual funds
restricted to institutional
investors and certain term Eurodollar deposits.
Source: Federal Reserve Board of Governors
Digitized for FRASER http://fraser.stlouisfed.org/ Federal Reserve Bank of St. Louis
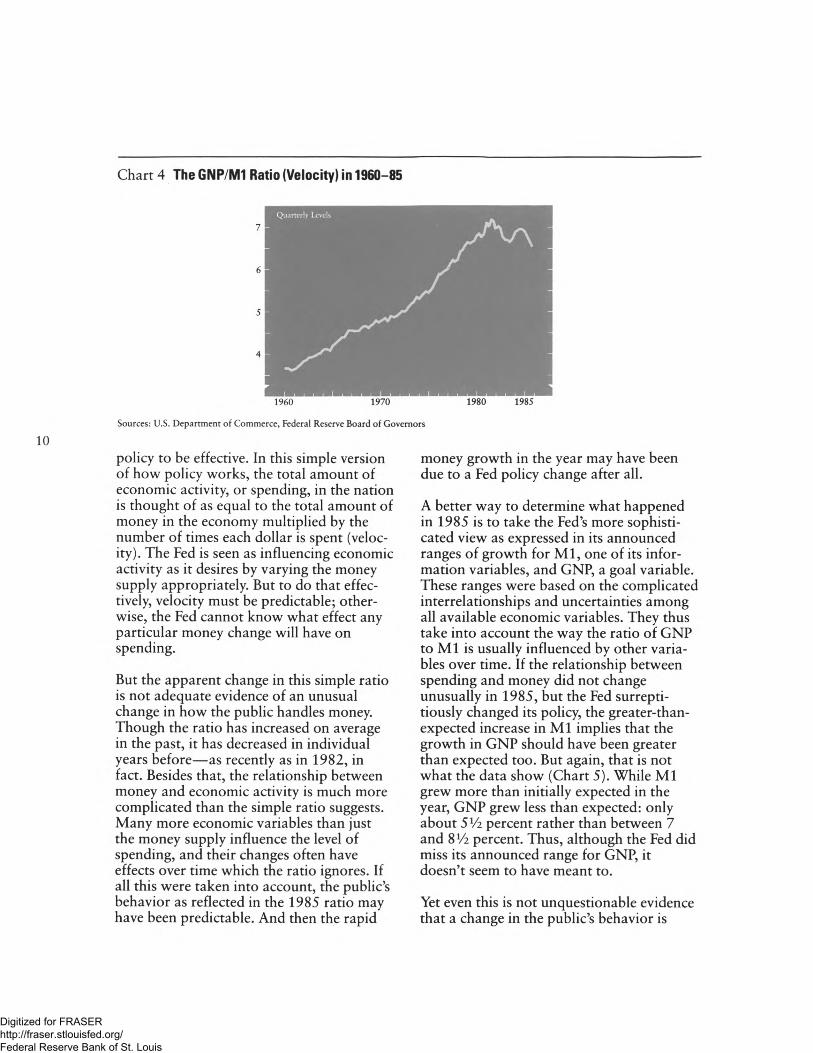
Chart 4 The GNP/M1 Ratio (Velocity) in 1960-85
I960 1970 1980 1985
Sources: U.S. Department of Commerce, Federal Reserve Board of Governors
policy to be effective. In this simple version of how policy works, the total amount of economic activity, or spending, in the nation is thought of as equal to the total amount of money in the economy multiplied by the number of times each dollar is spent (velocity). The Fed is seen as influencing economic activity as it desires by varying the money supply appropriately. But to do that effectively, velocity must be predictable; otherwise, the Fed cannot know what effect any particular money change will have on spending.
But the apparent change in this simple ratio is not adequate evidence of an unusual change in how the public handles money. Though the ratio has increased on average in the past, it has decreased in individual years before— as recently as in 1982, in fact. Besides that, the relationship between money and economic activity is much more complicated than the simple ratio suggests. Many more economic variables than just the money supply influence the level of spending, and their changes often have effects over time which the ratio ignores. If all this were taken into account, the public’s behavior as reflected in the 1985 ratio may have been predictable. And then the rapid
money growth in the year may have been due to a Fed policy change after all.
A better way to determine what happened in 1985 is to take the Fed’s more sophisticated view as expressed in its announced ranges of growth for M l, one of its information variables, and GNP, a goal variable. These ranges were based on the complicated interrelationships and uncertainties among all available economic variables. They thus take into account the way the ratio of GNP to M l is usually influenced by other variables over time. If the relationship between spending and money did not change unusually in 1985, but the Fed surreptitiously changed its policy, the greater-than- expected increase in M l implies that the growth in GNP should have been greater than expected too. But again, that is not what the data show (Chart 5). While M l grew more than initially expected in the year, GNP grew less than expected: only about 5Vi percent rather than between 7 and 8Vz percent. Thus, although the Fed did miss its announced range for GNP, it doesn’t seem to have meant to.
Yet even this is not unquestionable evidence that a change in the public’s behavior is
Digitized for FRASER http://fraser.stlouisfed.org/ Federal Reserve Bank of St. Louis
Chart 5 GNP Growth vs. the Fed's Range in 1985
$ Bil.
4,200
4,000
3,800
*This is the range the Fed announced in February 1985. In July 1985, the Fed announced a new range of
6.25—7.75% growth for the year. GNP did not reach that range either.
Sources: U.S. Department of Commerce, Federal Reserve Board of Governors
4th Q tr. 1 9 8 5
responsible for the rapid money growth in 1985. Just comparing the actual M l and GNP growth to the Fed’s ranges is not good enough because the Fed doesn’t tell us enough about those ranges. Presumably they correspond to some probability about where these variables will fall if historical relationships and uncertainties don’t change. How high the probability is determines whether or not the apparent change in the GNP/M1 relationship is statistically significant. If the ranges represent regions where GNP and M l can be expected to fall, say, 95 percent of the time, then, since GNP was below its range while M l was above its range in 1985, we can say with a high degree of confidence that the relationship changed in that year. But if the ranges represent only, say, 50 percent probability regions, then we cannot be very confident about what happened; the variables’ movements in 1985 could have been as likely due to chance as to anything else. The probabilities matter because the more confident we can be that the behavioral relationship changed, the more confident we can be that Fed policy did not change.
Researchers at the Minneapolis Federal Reserve Bank have built a statistical model of the U.S. economy that can objectively determine whether or not the unexpected movements in 1985 M l and GNP were significant. The model can, in effect, replicate the Fed’s policymaking process. Using only the statistical interrelationships among economic variables evident in any chosen historical period, the model can predict for any variable a path and various intervals around that path within which the data say— with any selected degree of confidence— that the variable will fall if the relationships don’t change. For the 1985 experience, a historical period of 1982-84 seems appropriate because the Fed’s operating procedures and the regulatory environment of financial firms were fairly consistent across those years. To find a significant change, a 70 percent confidence interval seems adequate. It means, again, that history says the variable can be expected to fall in the range 70 percent of the time if historical relationships remain the same; a variable will fall by chance above (or below) the range only 15 percent of the time. (Those are l-in-7 odds.)
Digitized for FRASER http://fraser.stlouisfed.org/ Federal Reserve Bank of St. Louis
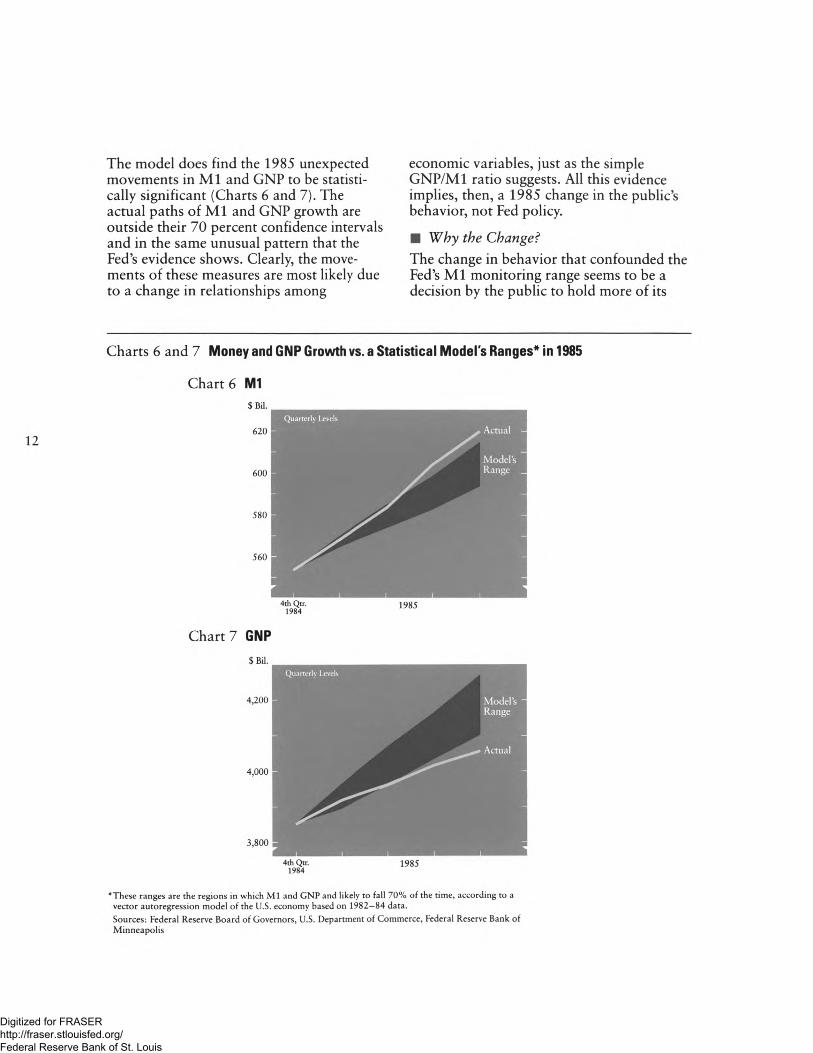
The model does find the 1985 unexpected movements in M l and GNP to be statistically significant (Charts 6 and 7). The actual paths of M l and GNP growth are outside their 70 percent confidence intervals and in the same unusual pattern that the Fed’s evidence shows. Clearly, the movements of these measures are most likely due to a change in relationships among
economic variables, just as the simple GNP/M1 ratio suggests. All this evidence implies, then, a 1985 change in the public’s behavior, not Fed policy.
■ Why the Change?
The change in behavior that confounded the Fed’s M l monitoring range seems to be a decision by the public to hold more of its
Charts 6 and 7 Money and GNP Growth vs. a Statistical Model's Ranges* in 1985
Chart 6 M1$ Bil.
620
600
580
560
4th Q tr. 1 9 8 5
Chart 7 GNP$ Bil.
4,200
4,000
3,800
*These ranges are the regions in which M l and GNP and likely to fall 70% of the time, according to a
vector autoregression model of the U.S. economy based on 1982-84 data.
Sources: Federal Reserve Board of Governors, U.S. Department of Commerce, Federal Reserve Bank of
Minneapolis
Digitized for FRASER http://fraser.stlouisfed.org/ Federal Reserve Bank of St. Louis
funds than usual in what the Fed has classified as M l types of accounts. This change seems to have been caused by a combination of institutional and interest rate changes.
M l is meant to be a measure of the funds readily available for spending. As such, it includes not only coins and currency in circulation, but also various types of checking accounts. Traditionally, financial firms were not allowed to pay interest on these accounts, so the public held in the accounts only what they thought they would need for transactions. This kept a clear separation between the nation’s spending and savings money.
Since 1981, however, that separation has been breaking down. The financial industry has been progressively deregulated since then, and the public has been offered the opportunity to earn interest on accounts with checkwriting privileges (NOWs and Super-NOWs, for example). Though initially restricted (with low interest rate ceilings and high minimum balances), these types of accounts have been very popular and increasingly so as their restrictions have been loosened. The Fed has counted many of these accounts as M l money because of their heavy use for transaction purposes.But because they bear interest, the accounts have undoubtedly held some funds which in previous years would have been held in savings accounts.
Until 1985 this element of savings in M l accounts may not have been large, because interest rates on the competing savings instruments were much higher. But in 1985 the continued deregulation of such accounts was joined by a drop in market interest rates to make M l accounts even more attractive for saving. With market rates close to rates on checking accounts, the public had less incentive than before to move funds from checking accounts to savings accounts. Thus, fewer did, and the
Fed’s M l money measure grew more than expected as a result.
■ What Now?
The experience of 1985 increases the uncertainty about the future relationships between money and other economic variables, especially interest rates and GNP. A significant rise in interest rates, for example, might now result in a flow of funds from checking accounts to savings instruments, a change which history would not have predicted. How much of a rise in rates would cause such an outflow? How large would the outflow be? And what effect would this have on the total level of spending? With very little evidence on the new relationships and interest rates still low, such questions are hard to answer.
The increased uncertainty, though, does not mean the Fed must abandon its money supply measures. Its feedback rule, after all, takes into account the uncertainties about the historical relationships among the Fed’s instruments, information variables, and goal variables. With one year of unusual data to go on, that rule will simply tell the Fed to respond less to any deviation of M l from its predicted path because a wider range of growth rates may now be consistent with its goals. To be a good representative of this rule (and a good communicator of Fed policy), then, future M l ranges must be wider than their predecessors to encompass that wider range of growth.
Just how wide the Fed’s announced M l range should be in any year, however, is hard to determine. The range for 1986, for example, shouldn’t necessarily match those any statistical model might produce, for they would be based on a particular historical data period and a particular level of confidence, both of which are to some extent arbitrary. But the announced range shouldn’t necessarily be the result of any such objective procedure. For in selecting a
Digitized for FRASER http://fraser.stlouisfed.org/ Federal Reserve Bank of St. Louis
range to announce, the Fed (and Congress) must moderate the need for the range to reflect increased uncertainty by a perhaps less quantifiable need for it to effectively monitor policy. The wider the range is, to take account of uncertainty, the less often it will detect policy changes, which may make such changes more likely. The narrower the range is, though, to make policy changes more obvious, the more often it will mistakenly detect such changes and the more often the Fed will have to waste resources explaining such mistakes. The choice of an appropriate width for the M l range, therefore, is at least partly a judgment call.
Conclusion
Despite the unusual experience of 1985, the Fed’s money supply measures will remain useful to the Fed— not as targets, but as providers of information about its goals, just like many other variables. The announced growth ranges for these measures will remain useful too, as communicators to the public of Fed policy intentions and deeds, even though M l ’s range will likely be somewhat wider than recently. Still, questions remain: Are the money measures the best variables to use to indicate policy? And are policy indicators best expressed as ranges? These are important questions, worth serious attention by researchers. The best answer to both today may be “We think so.” Congress directed the use of money ranges, and so far no clearly better options have been proposed.
Digitized for FRASER http://fraser.stlouisfed.org/ Federal Reserve Bank of St. Louis
Suggested Reading
On the Best Monetary Policy Strategy
Kareken, John H., and Preston J. Miller. The Policy Procedure of the FOMC: A Critique. A Prescription for Monetary Policy: Proceedings From a Seminar Series, 19-42. Minneapolis: Federal Reserve Bank of Minneapolis, 1976.
Kareken, John H., Thomas Muench, and Neil Wallace. Optimal Open Market Strategy: The Use of Information Variables. American Economic Review 63 (March 1973): 156-72.
On the Minneapolis Fed Researchers' Statistical Modeling Technique
Litterman, Robert B. Forecasting and Policy Analysis With Bayesian Vector Autoregression Models. Federal Reserve Bank of Minneapolis Quarterly Review 8 (Fall 1984): 30-41.
Todd, Richard M. Improving Economic Forecasting With Bayesian Vector Autoregression. Federal Reserve Bank of Minneapolis Quarterly Review 8 (Fall1984): 18-29.
On the Gainers and Losers of Monetary Policy
Miller, Preston J., and Neil Wallace. International Coordination of Macroeconomic Policies: A Welfare Analysis. Federal Reserve Bank of Minneapolis Quarterly Review 9 (Spring1985): 14-32.
Wallace, Neil. Some of the Choices forMonetary Policy. Federal Reserve Bank of Minneapolis Quarterly Review 8 (Winter 1984): 15-24.
On Commitment to the Best Monetary Policy Plan
Canzoneri, Matthew B. Monetary Policy Games and the Role of Private Information. American Economic Review 75 (December 1985): 1056-70.
Kydland, Finn E., and Edward C. Prescott. Rules Rather Than Discretion: The Inconsistency of Optimal Plans. Journal of Political Economy 85 (June 1977): 473-91.
Taylor, Herb. Time Inconsistency: A Potential Problem for Policymakers. Business Review (March/April 1985): 3-12. Federal Reserve Bank of Philadelphia.
Digitized for FRASER http://fraser.stlouisfed.org/ Federal Reserve Bank of St. Louis
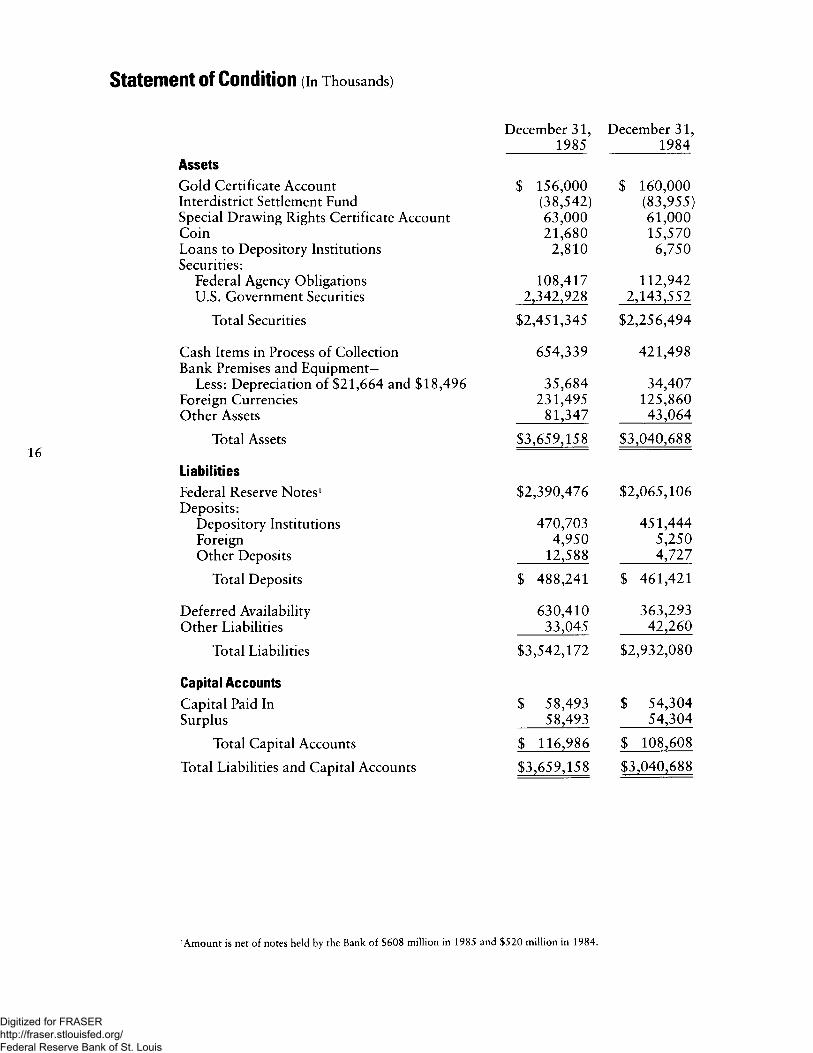
Statement of Condition (In Thousands)
December 31, December 31,
Assets1985 1984
Gold Certificate Account $ 156,000 $ 160,000Interdistrict Settlement Fund (38,542) (83,955)Special Drawing Rights Certificate Account 63,000 61,000Coin 21,680 15,570Loans to Depository Institutions Securities:
2,810 6,750
Federal Agency Obligations 108,417 112,942U.S. Government Securities 2,342,928 2,143,552
Total Securities $2,451,345 $2,256,494
Cash Items in Process of Collection Bank Premises and Equipment-
654,339 421,498
Less: Depreciation of $21,664 and $18,496 35,684 34,407Foreign Currencies 231,495 125,860Other Assets 81,347 43,064
Total Assets $3,659,158 $3,040,688
LiabilitiesFederal Reserve Notes1 Deposits:
$2,390,476 $2,065,106
Depository Institutions 470,703 451,444Foreign 4,950 5,250Other Deposits 12,588 4,727
Total Deposits $ 488,241 $ 461,421
Deferred Availability 630,410 363,293Other Liabilities 33,045 42,260
Total Liabilities $3,542,172 $2,932,080
Capital AccountsCapital Paid In $ 58,493 $ 54,304
Surplus 58,493 54,304
Total Capital Accounts $ 116,986 $ 108,608
Total Liabilities and Capital Accounts $3,65 9,158 $3,040,688
'Amount is net of notes held by the Bank of $608 million in 1985 and $520 million in 1984.
Digitized for FRASER http://fraser.stlouisfed.org/ Federal Reserve Bank of St. Louis
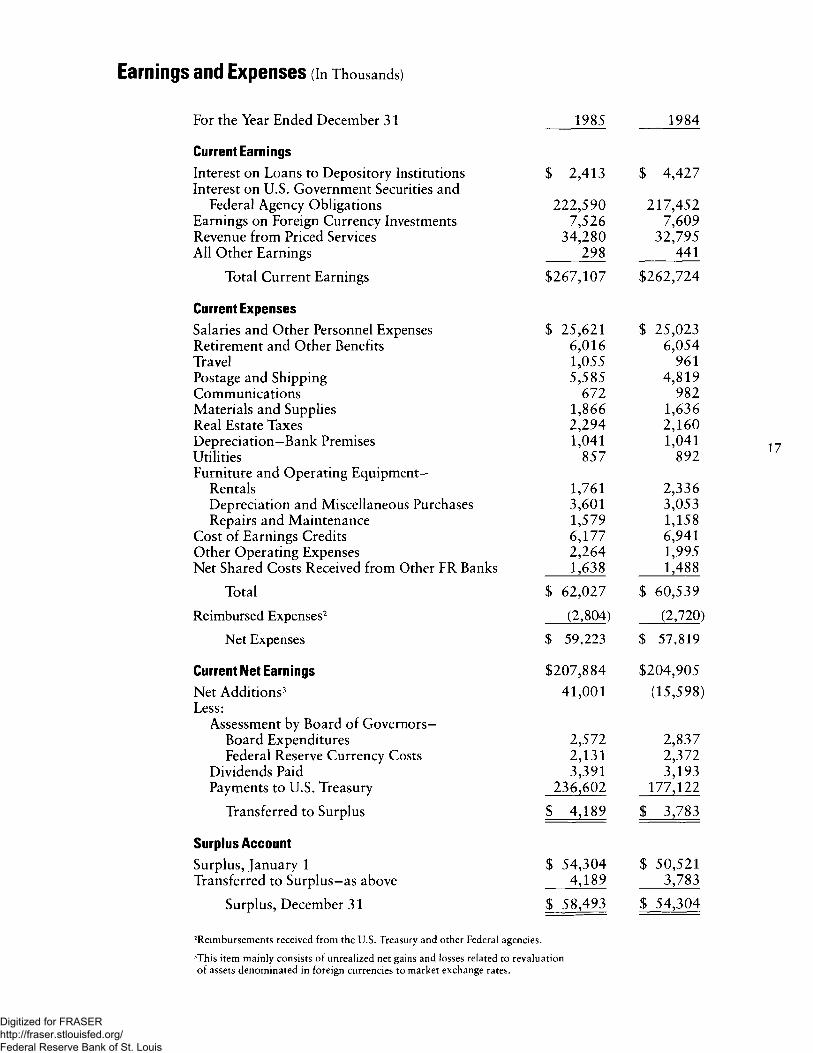
Earnings and Expenses (In Thousands)
For the Year Ended December 31 1985 1984
Current EarningsInterest on Loans to Depository Institutions $ 2,413 $ 4,427Interest on U.S. Government Securities and
Federal Agency Obligations 222,590 217,452Earnings on Foreign Currency Investments 7,526 7,609Revenue from Priced Services 34,280 32,795All Other Earnings 298 441
Total Current Earnings $267,107 $262,724
Current ExpensesSalaries and Other Personnel Expenses $ 25,621 $ 25,023Retirement and Other Benefits 6,016 6,054Travel 1,055 961Postage and Shipping 5,585 4,819Communications 672 982Materials and Supplies 1,866 1,636Real Estate Taxes 2,294 2,160Depreciation—Bank Premises 1,041 1,041Utilities 857 892Furniture and Operating Equipment—
Rentals 1,761 2,336Depreciation and Miscellaneous Purchases 3,601 3,053Repairs and Maintenance 1,579 1,158
Cost of Earnings Credits 6,177 6,941Other Operating Expenses 2,264 1,995Net Shared Costs Received from Other FR Banks 1,638 1,488
Total $ 62,027 $ 60,539
Reimbursed Expenses2 (2,804) (2,720)
Net Expenses $ 59,223 $ 57,819
Current Net Earnings $207,884 $204,905
Net Additions3 41,001 (15,598)Less:
Assessment by Board of Governors—Board Expenditures 2,572 2,837Federal Reserve Currency Costs 2,131 2,372
Dividends Paid 3,391 3,193Payments to U.S. Treasury 236,602 177,122
Transferred to Surplus $ 4,189 $ 3,783
Surplus AccountSurplus, January 1 $ 54,304 $ 50,521Transferred to Surplus—as above 4,189 3,783
Surplus, December 31 $ 58,493 $ 54,304
Reimbursements received from the U.S. Treasury and other Federal agencies.
This item mainly consists of unrealized net gains and losses related to revaluation
of assets denominated in foreign currencies to market exchange rates.
Digitized for FRASER http://fraser.stlouisfed.org/ Federal Reserve Bank of St. Louis
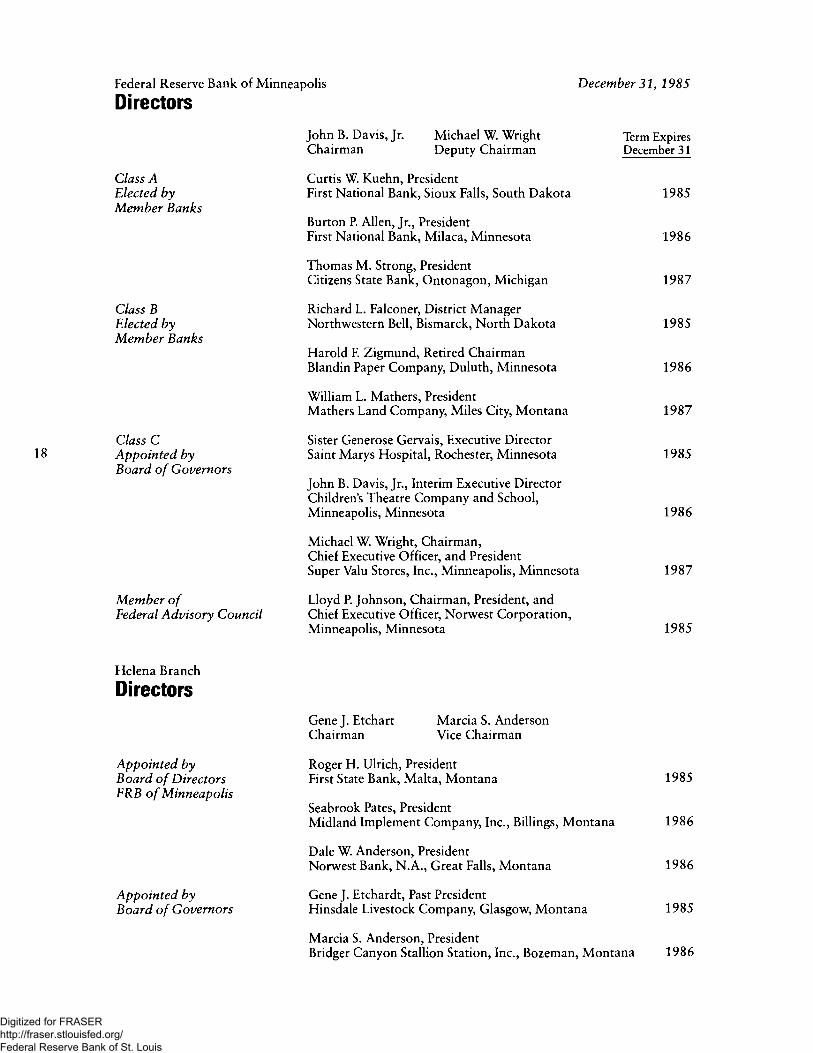
Federal Reserve Bank of Minneapolis December 31, 1985
Directors
Class A Elected by Member Banks
Class B Elected by Member Banks
Class C Appointed by Board of Governors
Member ofFederal Advisory Council
Helena Branch
Directors
Appointed by Board of Directors FRB of Minneapolis
Appointed by Board of Governors
John B. Davis, Jr. Michael W. Wright Chairman Deputy Chairman
Curtis W. Kuehn, PresidentFirst National Bank, Sioux Falls, South Dakota
Burton P. Allen, Jr., PresidentFirst National Bank, Milaca, Minnesota
Thomas M. Strong, PresidentCitizens State Bank, Ontonagon, Michigan
Richard L. Falconer, District Manager Northwestern Bell, Bismarck, North Dakota
Harold F. Zigmund, Retired Chairman Blandin Paper Company, Duluth, Minnesota
William L. Mathers, PresidentMathers Land Company, Miles City, Montana
Sister Generose Gervais, Executive Director Saint Marys Hospital, Rochester, Minnesota
John B. Davis, Jr., Interim Executive Director Children’s Theatre Company and School, Minneapolis, Minnesota
Michael W. Wright, Chairman,Chief Executive Officer, and PresidentSuper Valu Stores, Inc., Minneapolis, Minnesota
Lloyd P. Johnson, Chairman, President, and Chief Executive Officer, Norwest Corporation, Minneapolis, Minnesota
Gene J. Etchart Marcia S. Anderson Chairman Vice Chairman
Roger H. Ulrich, President First State Bank, Malta, Montana
Seabrook Pates, PresidentMidland Implement Company, Inc., Billings, Montana
Dale W. Anderson, PresidentNorwest Bank, N.A., Great Falls, Montana
Gene J. Etchardt, Past PresidentHinsdale Livestock Company, Glasgow, Montana
Term Expires December 31
1985
1986
1987
1985
1986
1987
1985
1986
1987
1985
1985
1986
1986
1985
Marcia S. Anderson, PresidentBridger Canyon Stallion Station, Inc., Bozeman, Montana 1986
Digitized for FRASER http://fraser.stlouisfed.org/ Federal Reserve Bank of St. Louis
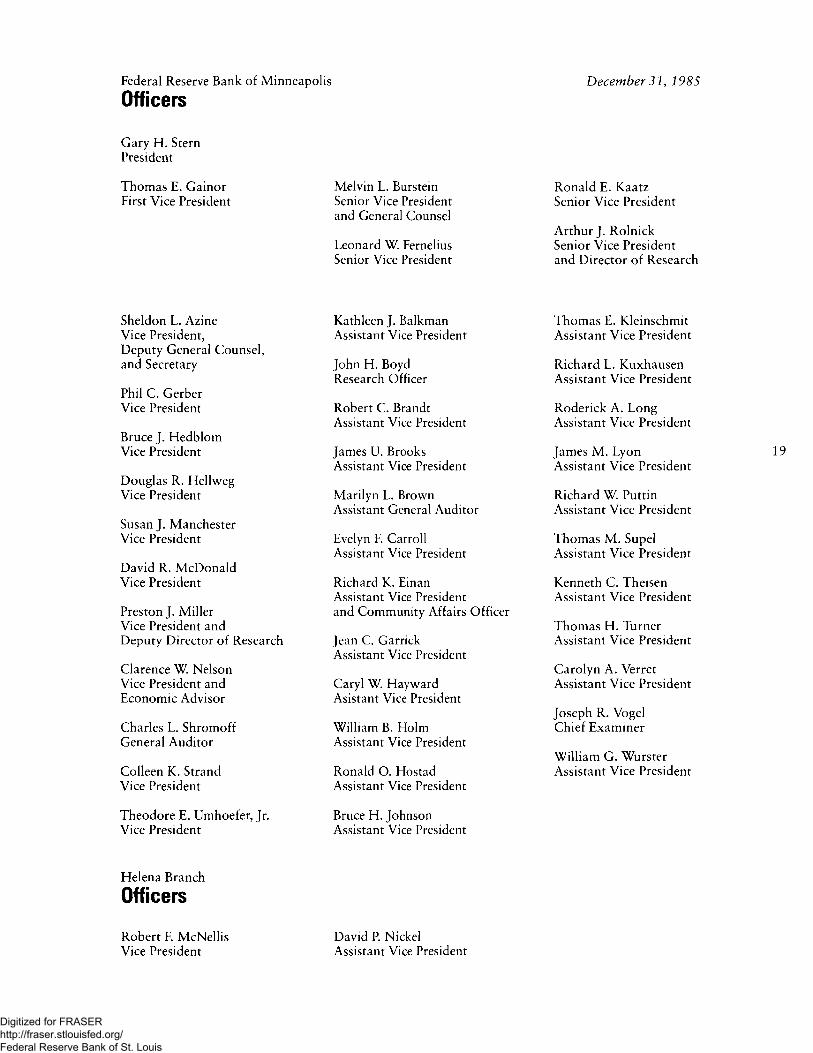
Federal Reserve Bank of Minneapolis
Officers
Gary H. Stern President
Melvin L. Burstein Senior Vice President and General Counsel
Leonard W. Fernelius Senior Vice President
Thomas E. Gainor First Vice President
Sheldon L. Azine Vice President,Deputy General Counsel, and Secretary
Phil C. Gerber Vice President
Bruce J. Hedblom Vice President
Douglas R. Hellweg Vice President
Susan J. Manchester Vice President
David R. McDonald Vice President
Preston J. MillerVice President andDeputy Director of Research
Clarence W. Nelson Vice President and Economic Advisor
Charles L. Shromoff General Auditor
Colleen K. Strand Vice President
Theodore E. Umhoefer, Jr. Vice President
Kathleen J. Balkman Assistant Vice President
John H. Boyd Research Officer
Robert C. Brandt Assistant Vice President
James U. Brooks Assistant Vice President
Marilyn L. Brown Assistant General Auditor
Evelyn F. Carroll Assistant Vice President
Richard K. EinanAssistant Vice Presidentand Community Affairs Officer
Jean C. Garrick Assistant Vice President
Caryl W. Hayward Asistant Vice President
William B. Holm Assistant Vice President
Ronald O. Hostad Assistant Vice President
Bruce H. Johnson Assistant Vice President
Helena Branch
Officers
December 31, 198S
Ronald E. Kaatz Senior Vice President
Arthur J. Rolnick Senior Vice President and Director of Research
Thomas E. Kleinschmit Assistant Vice President
Richard L. Kuxhausen Assistant Vice President
Roderick A. Long Assistant Vice President
James M. Lyon Assistant Vice President
Richard W. Puttin Assistant Vice President
Thomas M. Supel Assistant Vice President
Kenneth C. Theisen Assistant Vice President
Thomas H. Turner Assistant Vice President
Carolyn A. Verret Assistant Vice President
Joseph R. Vogel Chief Examiner
William G. Wurster Assistant Vice President
Robert F. McNellis Vice President
David P. Nickel Assistant Vice President
Digitized for FRASER http://fraser.stlouisfed.org/ Federal Reserve Bank of St. Louis