19 may 2018investor.manulifeusreit.sg/newsroom/20180518_120100_btou_iyrejx… · dbs bank ltd. was...
TRANSCRIPT

REITS Symposium Presentation 19 May 2018

Important Notice
DBS Bank Ltd. was the Sole Financial Adviser and Issue Manager for the initial public offering of Manulife US Real Estate
Investment Trust (“Offering”). DBS Bank Ltd., China International Capital Corporation (Singapore) Pte. Limited, Credit Suisse
(Singapore) Limited and Deutsche Bank AG, Singapore Branch were the Joint Bookrunners and Underwriters for the Offering.
This presentation is for information purposes only and does not constitute or form part of an offer, invitation or solicitation of any offer
to purchase or subscribe for any securities of Manulife US REIT in Singapore or any other jurisdiction nor should it or any part of it
form the basis of, or be relied upon in connection with, any contract or commitment whatsoever. The value of units in Manulife US
REIT (“Units”) and the income derived from them may fall as well as rise. The Units are not obligations of, deposits in, or guaranteed
by the Manager, DBS Trustee Limited (as trustee of Manulife US REIT) or any of their respective affiliates. The past performance of
Manulife US REIT is not necessarily indicative of the future performance of Manulife US REIT.
This presentation may contain forward-looking statements that involve risks and uncertainties. Actual future performance, outcomes
and results may differ materially from those expressed in forward-looking statements as a result of a number of risks, uncertainties
and assumptions. These forward-looking statements speak only as at the date of this presentation. No assurance can be given that
future events will occur, that projections will be achieved, or that assumptions are correct. Representative examples of these factors
include (without limitation) general industry and economic conditions, interest rate trends, cost of capital and capital availability,
competition from similar developments, shifts in expected levels of office rental revenue, changes in operating expenses, property
expenses, governmental and public policy changes and the continued availability of financing in the amounts and the terms
necessary to support future business.
Investors are cautioned not to place undue reliance on these forward-looking statements, which are based on current view of
management on future events.
Holders of Units (“Unitholders”) have no right to request that the Manager redeem or purchase their Units while the Units are listed.
It is intended that Unitholders may only deal in their Units through trading on Singapore Exchange Securities Trading Limited (the
“SGX-ST”). Listing of the Units on the SGX-ST does not guarantee a liquid market for the Units.
2

Contents
3
Overview and Highlights 1
Portfolio Performance 2
Moving Forward 3
Appendix 4

Overview and Highlights

Sponsor
5
Reputable Sponsor with Proven Track Record
Vertically-Integrated Real Estate Platform: Global Real Estate AUM of US$17.5b
Asia US$1.7B
AUM
Note: All AUM in fair value basis as at 31 Dec 2017
(1) Market capitalisation of Manulife Financial Corporation as at 25 Apr 2018. Source: Bloomberg
(2) As at 25 April 2018. Ranking compared to nine peers in North America (Great-West Life, Sun Life, Industrial Alliance, MetLife, Prudential, The Hartford, Principal Financial, Lincoln Financial and AIG). Source: Bloomberg
(3) Financial Strength Ratings, which are current as at 31 Mar 2018. The ratings apply to the following entities within the Manulife family of companies: The Manufacturers Life Insurance Company, John Hancock Life Insurance Company (U.S.A.), John
Hancock Life & Health Insurance Company and John Hancock Life Insurance Company of New York. Only the S&P rating also applies to Manulife (International) Limited while Manulife Life Insurance Company is rated A+ by S&P
Canada US$7.1B
AUM
U.S. US$8.7B
AUM
AUM of US$829.0bn with
market capitalisation1 of
US$37.6bn
4th largest life insurance
company in North America
by market capitalisation2
Listed in Toronto, New York,
Philippines, and Hong Kong
Financial strength ratings3:
S&P AA-
Fitch AA-
Moody’s A1
A.M. Best A+
71% of Real Estate in Office
Ground Rent 1%
Others 4% Retail
5%
Residential 9%
Industrial 10%
Office 71%
Manulife Asset
Management
Private Markets
AUM US$92.9bn
Global Real Estate
AUM US$17.5bn
>80 years in real estate
~600 real estate professionals in 24 offices
globally
Strong leasing network of >1,000 tenants

Key Milestones since IPO
6
2016 2017
FY 2016
Results
13 Feb 2017
DPU exceeded
forecast by
4.8%
1Q 2017
Results 2 May 2017
DPU exceeded
projection by
8.6%
2Q 2017
Results 8 Aug 2017
DPU exceeded
projection by
7.5%
3Q 2017
Results 3 Nov 2017
DPU exceeded
projection by
9.6%
2018
4Q 2017
Results 6 Feb 2018
DPU exceeded
projection by
7.6%
7 Nov 2016
DPU exceeded
forecast by
5.8%
3Q 2016
Results
1Q 2018
Results
Value Creation since IPO
Asset Under Management2
69.2%
Market Capitalisation3
89.6%
Total Shareholder Return4
44.3%
Unit Price4
30.1%
Source: Bloomberg. Data is from 20 May 2016 (IPO) till 30 Apr 2018
(1) 1Q 2018 DPU is lower largely due to lower income from Figueroa and Michelson resulting from lower occupancies in these properties and higher income taxes in 1Q 2018 compared to 1Q 2017. This was offset by
strong earnings from Plaza and Exchange properties acquired on 19 Jul 2017 and 31 Oct 2017, respectively, and therefore providing further diversification benefits to the portfolio
(2) Data as at 30 April 2018, excluding Penn and Phipps
(3) No of units issued: 20 May 2016 was 625,539,600 and 30 Apr 2018 was 1,036,072,644.
(4) Based on MUST opening price on 20 May 2016 (US$0.73) and 30 Apr 2018 (US$0.95) closing price. Unit prices were adjusted for the Rights Issue
1Q 2018 Performance
Acquisitions Proposed acquisition of Penn and Phipps
at total purchase price US$387.0 million
Financial Highlights
• Distributable Income: US$15.6 million
Y-o-y increased 50.1%
• DPU: 1.51 US cents Y-o-y decreased 0.7%1
Portfolio
• Occupancy Rate: 95.8%
• WALE: 5.7 years
30 Apr 2018
Y-o-y DPU
decreased by
0.7%1

7
Optimised Capital Structure and Increase Financial Flexibility
Established US$1.0 billion Multicurrency Debt Issuance Programme1
As at 31 Mar 2018
Gross Borrowings US$461.9 million
Gearing Ratio2 34.1%
Weighted Average
Interest Rate 2.83% p.a.
Debt Maturity
(weighted average) 3.2 years
Interest Coverage3 4.7 times
(1) Announced on 13 Apr 2018
(2) Based on gross borrowings as percentage of total assets
(3) Based on net income before finance expenses, taxes and net fair value change in investment properties, over finance expenses
108.5 Figueroa
0
50
100
150
200
2019 2020 2021 2022
US$ million
67.3
Peachtree
121.0
Michelson
165.1
40.0
Plaza
35.7% 26.2% 23.5% 14.6%
125.1
Exchange
Debt Maturity Profile

Portfolio Performance

Exposure to Largest Real Estate Market in the World
9
4.6 4.6
5.8
9.3 9.6 8.9
8.1
7.4
6.2
5.3 4.9
4.1
2006 2007 2008 2009 2010 2011 2012 2013 2014 2015 2016 2017
Natural Rate Band for Unemployment
4.5
5.0
U.S. Unemployment (%)2 U.S. GDP Growth (Y-o-Y %)1
2.7
1.8 -0.3
-2.8
2.5
1.6 2.2
1.7
2.6 2.9
1.5
2.3 2.3
(1) GDP Growth Rate Source: Source: U.S. Department of Commerce, Bureau of Economic Analysis (28 Mar 2018 and 27 Apr 2018)
(2) Unemployment Rate Source: U.S. Department of Labor, Bureau of Labor Statistics. 2017 rate is as at 5 Jan 2018
Steady
economic
growth
U.S. Office Employment (Y-o-Y %)1 U.S. Office Net Absorption & Occupancy Rate2
0.5
-3.9 -4.4
1.6
2.3 2.4 2.4 3.0 3.0
2.3 2.0
2007 2008 2009 2010 2011 2012 2013 2014 2015 2016 2017
10.7
22.4 22.7 20.7
9.5 12.8
10.0 11.4
15.4 12.6
15.4 14.7 18.8 19.5 18.4
5.1
89.1 89.3 89.4 89.6 89.7 89.8 89.8 89.5
Q1 2016 Q2 2016 Q3 2016 Q4 2016 Q1 2017 Q2 2017 Q3 2017 Q4 2017
Net Absorption (m sq ft) Completion Occupancy Rate (%)
Favourable
office
sector
outlook
(1) Office employment includes the professional and business services, financial activities and information services sectors; Source: U.S. Bureau of Labour Statistics
(2) Source: CoStar Market Analysis & Forecast Reports’
Robust U.S. Economic and Office Sector Dynamics
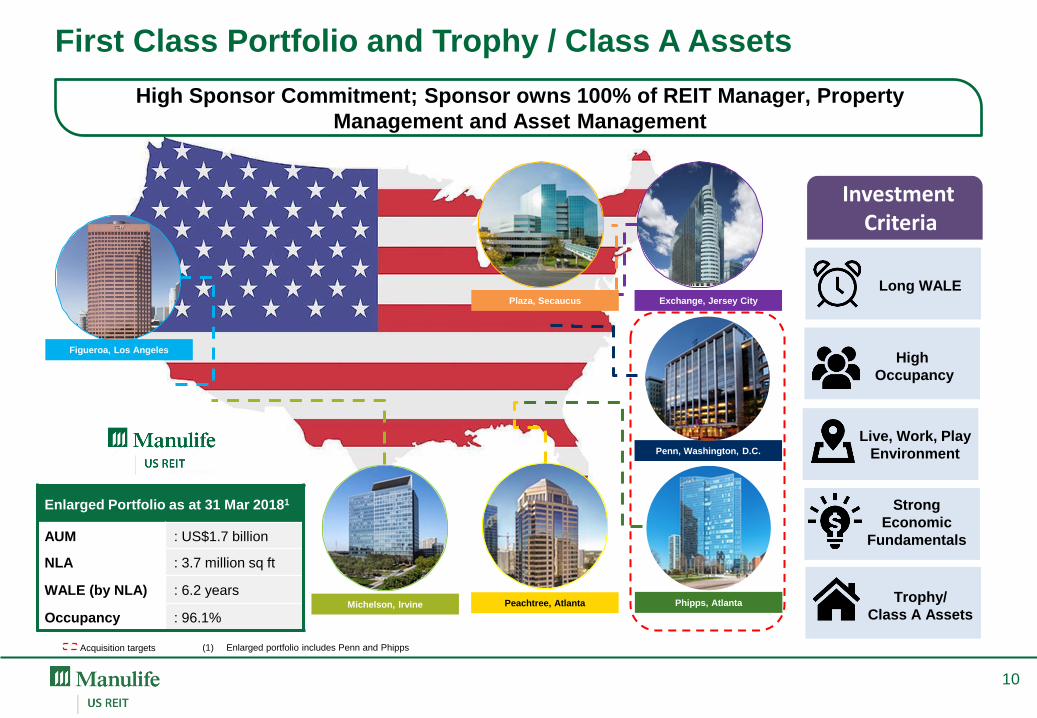
Figueroa, Los Angeles
Exchange, Jersey City
Penn, Washington, D.C.
Phipps, Atlanta Peachtree, Atlanta Michelson, Irvine
Plaza, Secaucus
First Class Portfolio and Trophy / Class A Assets
10
Acquisition targets (1) Enlarged portfolio includes Penn and Phipps
Enlarged Portfolio as at 31 Mar 20181
AUM : US$1.7 billion
NLA : 3.7 million sq ft
WALE (by NLA) : 6.2 years
Occupancy : 96.1%
Long WALE
High
Occupancy
Live, Work, Play
Environment
Strong
Economic
Fundamentals
Trophy/
Class A Assets
Investment Criteria
High Sponsor Commitment; Sponsor owns 100% of REIT Manager, Property
Management and Asset Management

1
11
NLA 277,243 sq ft
Purchase Price1 US$182.0 million
Occupancy Rate 97.2%
WALE (by NLA) 6.6 years
No. of Tenants 10
1750 Pennsylvania Ave,
Washington, D.C. (Penn)
Phipps Tower, Atlanta (Phipps) NLA 475,091 sq ft
Purchase Price1 US$205.0 million
Occupancy Rate 97.4%
WALE (by NLA) 9.8 years
No. of Tenants 9
Acquisition of Sponsor’s Assets - Total Purchase Price US$387.0 million
Latest Update – Proposed Acquisition from Sponsor
Data as at 31 Mar 2018
Announcement of proposed acquisition as at 13 Apr 2018
(1) Subject to closing and post-closing adjustments in the ordinary course of business

Portfolio Summary
12
As at 31 Mar
2018 Figueroa Michelson Peachtree Plaza Exchange Penn Phipps
Occupancy Rate 93.0% 96.5% 92.7% 98.9% 98.3% 97.2% 97.4%
WALE by NLA 4.7 years 4.2 years 5.6 years 8.1 years 6.5 years 6.6 years 9.8 years
Figueroa 19.2%
Michelson 20.1%
Peachtree 11.4% Plaza
6.9%
Exchange 19.7%
Penn 10.7%
Phipps 12.0%
US$1.7 billion1
Portfolio Valuation
Data includes Penn and Phipps
(1) Based on appraisals as at 31 Dec 2017 and after capitalisation of capital expenditures, tenant improvement allowances and leasing cost. Valuation of Penn and Phipps is based on purchase price
Figueroa 18.8%
Michelson 14.3%
Peachtree 18.7% Plaza
12.4%
Exchange 19.6%
Penn 7.4%
Phipps 12.7%
3.7 million sq ft
Total NLA

Legal Services 25.6%
Finance and Insurance 23.7%
Retail Trade 11.0%
Management and Consulting Services 5.9%
Arts and Entertainment 4.2%
Real Estate 3.8%
Administrative 3.8%
Healthcare 3.6%
Accounting, Tax and Payroll Services 2.8%
Manufacturing 2.8%
Information 2.5%
Advertising and Related Services 2.5%
Transportation and Warehousing 2.4%
Architectural and Related Services
1.7%
Public Administration 0.6%
Grant Giving 0.2%
Others 2.9%
Legal Services, 45.4% Finance and Insurance,
23.1%
Business Services, 11.9%
Real Estate, 8.3%
Personal Services, 5.1%
Engineers and Architects, 3.6%
Retail and Wholesale, 1.5%
Communication, 0.3%
Medical, 0.2%
Technology, 0.1%
Others, 0.5%
Current Portfolio2 Trade Sector by GRI IPO Portfolio1 Trade Sector by GRI
13
(1) Data as at 31 Dec 2015
(2) Data as at 31 Mar 2018, excluding Penn and Phipps
Fortifying Trade Sectors and Quality of Tenants Since IPO

1.9
10.0 9.5 6.8
17.9
53.9
2.5
7.1 9.2
7.1
17.8
56.3
2018 2019 2020 2021 2022 2023 andbeyond
Gross Rental Income Net Lettable Area
Resilient Portfolio with High Occupancy and Long WALE
14
Lease Expiry Profile as at 31 Mar 2018 (%)1
Occupancy of 95.8%1; WALE by NLA at 5.7 years1
IPO Portfolio Lease Expiries Profile (%)2
0.4
5.7
11.6
1.6
14.6 16.8
49.3
0.4
6.1 9.5
1.7
10.7
16.5
55.1
2015 2016 2017 2018 2019 2020 2021
Gross Rental Income Net Lettable Area
(1) Data as at 31 Mar 2018, excludes Penn and Phipps
(2) Data as at 31 Dec 2015

Limited Supply in Key Locations with Rental Growth
15
Market
Rentable
Building
Area1
(mil sq ft)
Vacancy1
(%)
Gross
Asking
Rent1
(US$)
Net
Absorption1
(‘000 sq ft)
12 Month
Rent
Growth2
(%)
New
Properties
Under
Construction
(‘000 sq ft)
Property
Name
Delivery
Year
Downtown Los
Angeles 40.1 14.3 43.10 (3.5) 3.5 0 N/A N/A
Irvine,
Orange County 14.4 17.2 35.75 21.8 3.4 0 N/A N/A
Midtown
Atlanta 16.9 10.1 36.92 (14.2) 6.4
277 NCR 2018
343 Ponce 2019
760 Coda 2019
352 Anthem 2020
Meadowlands3 3.5 14.44 29.39 0 (0.1) 0 N/A N/A
Hudson
Waterfront5 18.9 16.3 41.40 (195.5) (0.1) 0 N/A N/A
Source: CoStar Market Analysis & Forecast – As at 16 April 2018
(1) Class A inventory
(2) All building classes
(3) Secaucus is within the Meadowlands submarket
(4) Vacancy and availability include old and uncomparable buildings where else Plaza’s competitive set has vacancy rate of only 6%
(5) Jersey City is within the Hudson Waterfront submarket

Exchange, Jersey City
Moving Forward

Expanding Beyond - Fortifying the Portfolio
17
Figueroa, Michelson, Peachtree
AUM US$777.5m
Target to Double AUM from US$1.3b to US$2.6b in Two Years with Accretive Acquisitions
Plaza US$115.0m
Exchange US$315.1m
Penn US$182.0m
Phipps US$205.0m Jun 2017
Sep 2017
Apr 2018
May 2016
As at 31 Mar 2018
Current Portfolio Enlarged Portfolio
AUM US$1.3 billion US$1.7 billion
NLA 3.0 million sq ft 3.7 million sq ft
WALE 5.7 years 6.2 years
Occupancy 95.8% 96.1%

For enquiries, please contact: Ms Caroline Fong, Head of Investor Relations
Direct: (65) 6801 1066 / Email: [email protected]
MANULIFE US REAL ESTATE INVESTMENT TRUST
51 Bras Basah Road, #11-00 Manulife Centre, Singapore 189554
http://www.manulifeusreit.sg

Tax Structure1
No 30%2 withholding tax on interest and principal on
shareholder’s loan - US Portfolio Interest
Exemption Rule
Zero tax in Singapore - Foreign sourced income
not subject to tax
Distribution from US to Singapore through
combination of dividends, and/or interest
payments and principal repayments on
shareholder loans
No single investor to hold more than 9.8% (including
the sponsor) - ‘Widely Held3’ rule for REITs in US
Manager will actively manage to minimise or pay no
dividends from Parent U.S. REIT to Equity SPV
19
Singapore
Manulife
Sponsor Unitholders
(9.8% limit)
100%
100% Wholly-owned
U.S.
Equity SPV
Parent U.S.
REIT
Subs8
Dividends6
0% Tax
100%
Loans
Interest & Principal7
Properties Figueroa, Michelson, Peachtree, Plaza, Exchange
Shareholder Loan
SPVs4
Barbados Entities5
Barbados 100% Wholly-owned
(1) As at 1 January 2018. Please refer to the SGX announcement dated 2 January 2018 titled “Redemption of Preferred
Shares by U.S. REITs and Proposed Establishment of Wholly-Owned Entities” for details of the restructuring undertaken by
MUST
(2) For U.S. and non U.S. persons filing valid tax forms
(3) No less than 5 persons holding 50% of company
(4) There are three wholly-owned Shareholder Loan SPVs, each of which has made equity investments in two wholly-owned
Barbados entities which had formed a Barbados Limited Partnership
(5) The Barbados Limited Partnerships have extended loans to the Parent U.S. REIT and the interest income on the loans is
taxed in Barbados
(6) Subject to 30% withholding tax
(7) Principal repayments are not subject to U.S. withholding taxes. Interest payments are not subject to U.S. withholding taxes
assuming Unitholders qualify for portfolio interest exemption and provide appropriate tax certifications, including an
appropriate IRS Form W-8
(8) Each Sub holds an individual property

20
Portfolio Overview
Figueroa Michelson Peachtree Plaza Exchange
Location Los Angeles Irvine Atlanta Secaucus Jersey City
Property Type Class A Trophy Class A Class A Class A
Completion Date 1991 2007 1991 1985 1988
Last Refurbishment 2015 - 2015 2016 -
Property Value (US$ million) 326.3 342.1 194.2 118.0 334.8
Occupancy (%) 93.0 96.5 92.7 98.9 98.3
NLA (sq ft) 701,978 532,663 557,589 461,525 730,823
No. of Tenants 29 15 25 7 25
Avg Gross Rent (US$ psf p.a.) 39.53 49.98 32.05 30.09 39.45
WALE (by NLA) 4.7 years 4.2 years 5.6 years 8.1 years 6.5 years
Lease Expiry (by NLA): 2018 3.5% 2.2% 0% 0.0% 5.0%
2019 2.2% 29.8% 4.0% 0.0% 2.0%
2020 2.8% 10.0% 9.7% 22.1% 6.1%
2021 13.0% 0.8% 4.6% 0.0% 12.5%
2022 30.5% 25.1% 11.2% 2.7% 15.3%
2023 and beyond 48.0% 32.1% 70.5% 75.2% 59.1%
Data as at 31 Mar 2018
Please refer to the website for the video of properties

21
Additional Disclaimer
CoStarPS does not purport that the CoStarPS Materials herein are comprehensive, and, while they are believed to be accurate,
the CoStarPS Materials are not guaranteed to be free from error, omission or misstatement. CoStarPS has no obligation to
update any of the CoStarPS Materials included in this document, Any user of any such CoStarPS Materials accepts them “AS IS”
WITHOUT ANY WARRANTIES WHATSOEVER, EITHER EXPRESS OR IMPLIED, INCLUDING BUT NOT LIMITED TO THE
IMPLIED WARRANTIES OF MERCHANTABILITY, NON-INFRINGEMENT, TITLE AND FITNESS FOR ANY PARTICULAR
PURPOSE. UNDER NO CIRCUMSTANCES SHALL COSTARPS OR ANY OF ITS AFFILIATES, OR ANY OF THEIR
DIRECTORS, OFFICERS, EMPLOYEES OR AGENTS, BE LIABLE FOR ANY INDIRECT, INCIDENTAL OR CONSEQUENTIAL
DAMAGES WHATSOEVER ARISING OUT OF THE COSTARPS MATERIALS, EVEN IF COSTARPS OR ANY OF ITS
AFFILIATES HAS BEEN ADVISED AS TO THE POSSIBILITY OF SUCH DAMAGES.
The CoStarPS Materials do not purport to contain all the information that may be required to evaluate the business and prospects
of Manulife US REIT or any purchase or sale of Manulife US REIT units. Any potential investor should conduct his, her or its own
independent investigation and analysis of the merits and risks of an investment in Manulife US REIT. CoStarPS does not sponsor,
endorse, offer or promote an investment in Manulife US REIT. The user of any such CoStarPS Materials accepts full responsibility
for his, her or its own investment decisions and for the consequences of those decisions.