188.seismic behavior of reinforced concrete exterior wide beam-column joints
DESCRIPTION
beam column jointTRANSCRIPT

This document is downloaded from DR-NTU, Nanyang Technological
University Library, Singapore.
Title Seismic behaviour of reinforced concrete exterior widebeam-column joints.
Author(s) Li, Bing.; Kulkarni, Sudhakar A.
CitationLi, B., & Kulkarni, S. (2010). Seismic behaviour ofreinforced concrete exterior wide beam-column joints.Journal of Structural Engineering, 136(1), 26–36.
Date 2010
URL http://hdl.handle.net/10220/8375
Rights
© 2010 ASCE. This is the author created version of awork that has been peer reviewed and accepted forpublication by Journal of structural engineering, ASCE. Itincorporates referee’s comments but changes resultingfrom the publishing process, such as copyediting,structural formatting, may not be reflected in thisdocument. The published version is available at:http://dx.doi.org/10.1061/(ASCE)0733-9445(2010)136:1(26).

Seismic Behavior of Reinforced Concrete Exterior Wide
Beam-Column Joints
Bing Li1 and Sudhakar A. Kulkarni
2
1Associate Professor, School of Civil and Environmental Engineering, Nanyang
Technological Univ., Singapore 639798, Singapore (corresponding author). E-mail:
2Senior Engineer, Maunsell Consultants (Singapore), Pte. Ltd., Singapore 199555,
Singapore.
Abstract
An experimental and numerical investigation carried out on RC wide beam-column joints
when subjected to seismic loads is reported within this paper. The experimental study
was conducted by subjecting three full-scale wide exterior beam-column specimens to
simulated seismic loads at the Nanyang Technological University of Singapore.
Simulations of earthquake loadings were applied on to the specimens via quasistatic load
reversals. Seismic performance analysis of the joints were based on the results obtained
from the experiment in terms of their general behavior, hysteresis response, and the strain
profiles of the longitudinal reinforcement within the specimens. These experimental
results were then used to validate a three-dimensional (3D) nonlinear finite-element (FE)
model. The behavior of the joints under the influence of critical influencing factors like
column axial load, transverse beam, and beam bar anchorage ratio were also analyzed
through the parametric studies carried out.
CE Database subject headings: Beams; Reinforcement; Drift; Finite element method;
Axial loads; Columns; Joints.
Author Keywords: Wide-beam; Joint shear; Reinforcing detail; Drift ratio; Finite
element; Bond slip; Column axial load.

Introduction
Adopting a wide beam system for the design scheme provides many advantages. They
include reducing the amount of formwork required, providing simplicity for repetition
and thus decreases the story height. All of these would eventually result in a faster
construction at a reduced cost (LaFave and White 1997). Gravity load-resisting frames in
nonseismic regions commonly utilize RC wide beam frame buildings and composite
structural systems of wide beam framing with other members due to these advantages.
Currently, these advantages have brought about increased of wide beam systems even in
seismically active regions.
The potential advantages and applications of the wide beam system as a lateral load-
resisting structure is often ignored due to the lack of understanding in the performance of
these structures under seismic demand. The current design code (BS 8110, British
Standards 1997) strictly restricts the use of wide beam-column connections to resist
earthquake loads. Such geometric restrictions are often based on historical design
practices. In the United States, for example, beam width is restricted of bc+1.5hb, where
hb is the beam depth and bc is the column width. In New Zealand, the beam width
restriction is the lesser of bc+0.5hc and 2bc, where hc is the column depth. However, some
researchers (Stehle et al. 2001; Siah et al. 2003) indicated that no beam width limitations
are required for the design of wide beam flooring system in regions of high seismicity if a
special detailing regime is adopted. In another relevant research, a slight relaxation of the
current American Concrete Institute (ACI) 318 provisions on the connection between
exterior columns and wide beams was suggested as bb ≤ bc+2hc where bb=beam width
(Gentry and Wight 1994). It was also concluded that the wide beam connections can
perform well even when bb/bc is greater than 3.
Among the previous studies, the primary concern for wide beam-column connections is
the effectiveness of the longitudinal reinforcement that passes outside of the column core
because of the different load transfer mechanisms. Some researchers (Hatamoto et al.
1991) also indicated that the amount of beam reinforcement placed outside of the joint

core should be primarily limited to reduce torsional stress. In addition, sufficient
confinement should be provided to the beam portion outside of the column to improve the
torsional rigidity and to provide adequate anchorage for the beam rebars. Some parallel
researches on these topics were focused on lower stiffness due to the shallow beam
section, energy dissipating capacity of wide beam-column joints, slip of column bars
through the wide beam-column joints, and so on (LaFave and White 1999). Recently, a
series of research projects have been done to address the impact of these issues on the
behavior of wide beam-column joints. An experimental investigation on wide beam-
column joints (LaFave and White 1999) showed that the energy dissipating capacity of a
wide beam-column joint is almost as much as the conventional beam-column joint. It was
also concluded through an experimental study that the stiffness of wide beam-column
joint, was very close to a conventional beam-column joint.
Even now, due to the lack of test data, the advantages of a wide beam system could not
be safely taken into account during seismic design of structures. The investigation within
this paper, aimed to make further contribution to those research topics, is presented in
two sections. The first part of the paper includes the details of the experimental program
and its key findings. In the experimental program, a set of three exterior wide beam-
column specimens, which were designed in accordance to BS 8110 code provisions and
later modified with some seismic detailing, were tested. Due to the limited scope of tested
specimens, only selected critical parameters were varied. The second portion of this
research tackles this downfall by including first a nonlinear FE numerical study to
validate the model with the experimental results and subsequently perform critical
parametric studies.
Test program
Fig. 1 shows the details of the three exterior wide beam-column joint specimens
designated as Specimens EWB1, EWB2, and EWB3. The specimens were the prototypes
of building structural frame joints. These joints represented part of a frame and were
obtained by terminating the beam at its midspan and columns at their midheights. These

points coincide where the points of inflection of the bending moment diagram due to the
horizontal lateral loading occur. Fig. 1(a) shows the reinforcement details of EWB1 and
EWB3, while Fig. 1(b) presents the reinforcement details for Specimen EWB2. The beam
longitudinal bars within the exterior beam-column joint were bent into the joint core to a
specific length in order to prevent a bond slip due to the insufficient bar anchoring, as
represented in Fig. 1. For EWB-1 and EWB-3, 3T22 top and 3T20 bottom bars were
placed inside the column core, indicating their anchorage at 37.7 and 43.8% of the top
and bottom bars, respectively. All the columns were uniformly reinforced by using a total
of 14 T25 bars, amounting to a column reinforcing ratio of 2.54%. The longitudinal bars
of the transverse beam consisted of 5T20 top and 5T22 bottom bars.
Reinforcement Details and Material Properties
In Specimens EWB-1 and EWB-3, the column depth to beam bar diameter ratio ranged
from 41 to 56.3. Obviously, these values were much higher than the ACI 318-05
[American Concrete Institute (ACI) Committee 318 (2005)] design code recommendation
of 20, implying a satisfactory bond criterion. For Specimen EWB-2, due to its different
column orientation, these values were modified to 13.6 and 15 for T22 and T20 bars,
respectively, amounting to an inferior bond criterion as per ACI 318-05 design code
recommendation. In all wide beam-column joints, the beam depth to column bar diameter
ratio was 12, which was much lower than the ACI 318-05 design code requirement.
Longitudinal reinforcement for the beam, columns, and transverse beams consisted of
deformed bars characterized by its yield strength fy of 460 MPa. Bar diameters of
longitudinal reinforcement were varied from 25 to 16 mm. The bars are represented as
R10, T25, etc., in which R and T denote plain and deformed bars, respectively, with the
numerals representing the bar diameter in millimeters. The R10 mild steel bars
characterized by its yield strength fy of 250 MPa were used as transverse reinforcement
while the joint shear reinforcement consisted of T16 deformed bars. Compressive
strength of concrete targeted during the design phase was 70 MPa for EWB1 and EWB2,
and 40 MPa for Specimen EWB3. A lower grade of concrete in Specimen EWB3 was

selected to investigate the influence of concrete strength on the joint performance. The
average compressive strength of concrete obtained from the concrete cylinder samples,
was found to be 64.1, 65.9, and 47.8 MPa, for EWB1, EWB2, and EWB3, respectively.
Nominal Capacities
The design parameters of the specimens such as the horizontal lateral load, column to
beam moment ratio, joint shear force, etc., were estimated using the material properties
obtained from the tests, and following the recommendations of American Concrete
Institute (ACI)-ASCE Committee (1996). Table 1 summarizes the results of the expected
capacities. It can be seen that all specimens were designed following the “strong column-
weak beam” philosophy. The minimum column to beam moment ratio, which is 1.4 as
per ACI-ASCE Committee 352 requirement, was satisfied. The exterior wide beam-
column represented a small quantity of nominal joint shear force due to the less force
applied. Therefore, the joint shear factor γ of the specimens, which is recommended to be
20 or less as per ACI-ASCE Committee 352 provisions, was satisfied. The specimens
represented different overall capacities under the positive and negative bending moments,
due to the variations in the area of the top and bottom reinforcements.
Instrumentation and Test Setup
The test setup is shown in Fig. 2. Each of the test specimens were subjected to quasistatic
load reversals to simulate earthquake loadings. The bottom of the column was pinned to
the strong floor of the laboratory, while the beam ends were connected to the same floor
using the vertical links that restrained only vertical displacements at the beam ends. A
reversible horizontal load was applied to the top of the column using a double acting
1,000 kN capacity hydraulic actuator. The first two cycles were load controlled whereas
the remaining cycles was displacement controlled. Fig. 3 shows the loading history in
terms of applied cycles versus the story drift ratio (DR).

Experimental Results and Observations
Due to the unsymmetrical nature of the reinforcement used in the wide beam, the
specimens were generally designed to represent different lateral load-resisting capacities
in the positive and negative loading directions. The positive loading direction indicated
the beam subjected to sagging bending moment at the joint, and vice versa (see Fig. 2). In
the positive loading direction, where the wide beam was bending in the negative moment,
the expected theoretical capacities were 123.6 kN for Specimens EWB1 and EWB3, and
103 kN for Specimen EWB2. On the other hand, as the wide beam was bending in the
positive moment, the theoretical strength was 170 kN for Specimens EWB1 and EWB3,
and 144.4 kN for Specimen EWB2. The following sections describe the experimental
observations of the specimens in terms of hysteresis response and cracking patterns.
Specimens EWB1 and EWB3
Figs. 4 and 5 represent the shear force versus the horizontal displacement hysteresis loops
of Specimens EWB1 and EWB3, respectively. In the positive loading direction,
Specimen EWB1 did not reach its theoretical capacity, while it attained the maximum
capacity of 150.6 kN or approximately 88% of the theoretical strength, corresponding to
a DR of 1.0%. In the following loading cycles, the strength of the specimen gradually
decreased and this trend became more significant when the specimen reached a DR of
2.0%. Up to the final loading cycle, the residual load-carrying capacity in this direction
was 91 kN or approximately 53% of the theoretical capacity. In the negative loading
direction, the specimen attained its theoretical capacity at a DR of approximately 0.8%.
The maximum capacity obtained was 132.4 kN corresponding to a DR of 0.9%, which
exceeded the theoretical capacity based on the beam yield mechanism by around 7%.
This indicated that limited overstrength behavior occurred in the negative loading
direction. The specimens finally attained a DR of 4.0% in both loading directions.
In EWB1, flexural cracks appeared early, corresponding to a DR of 0.5% as presented
in Fig. 6. In the subsequent loading cycles, the flexural cracks in the positive and negative

loading directions propagated in a vertically upward or downward direction covering full
depth of the beam and spreading along the beam span. On outermost parts of the beam
near the column, inclined torsional cracks appeared and extended to the intersection
region of the column sides and beam. At a DR of approximately 2.0%, a minor inclined
crack appeared on the column. Up to the final loading stage, the inclined torsional cracks
had propagated rapidly covering the beam regions near the joint core. However, there
was no shear crack observed on the beam portion excluding the column.
For EWB1, all the top reinforcement of the beam eventually yielded at a higher DR of
around 3.5%. On the other hand, the beam bottom bars yielded early, corresponding to a
DR of 1.5%, indicating that the beam carried a higher positive bending moment than a
negative moment. The longitudinal reinforcement of the beam experienced the maximum
strain at a location near the beam-column intersection, where the maximum bending
moment was also observed. The column bars within the joint core and at the positions
furthest from the beam-column intersections exhibited quite low strains, indicating bond
slippage of the reinforcement.
During the entire loading operation, no yielding of the column longitudinal
reinforcement was observed in EWB1, indicating essentially its elastic behavior
throughout the test. When the specimen was subjected to a positive loading, the steel bars
in the upper column attained the maximum strain corresponding to a DR of 3.5%, while
the strain value observed was only 10% of the theoretical yield strain. In the reverse
loading direction, the reinforcement in the lower column suffered extremely high strain
levels, yet no yield strain occurred. During the last loading cycle, the column longitudinal
reinforcement in the compression region of the beam did not show any tensile strain,
indicating the fact that the column anchorage bars remained intact throughout the test.
Fig. 5 shows the measured load versus the horizontal displacement hysteresis loops for
EWB3. The specimen attained its calculated strength corresponding to a DR of 1.0%
when the beam was in negative bending. In the following loading cycle, corresponding to
a DR of 1.5%, the specimen attained its maximum story shear capacity in the positive

loading direction, which was approximately 111% of its calculated strength. During the
subsequent loading cycles, the specimen continued to exhibit its load-resisting capacity
with no significant degradation in its strength. In the negative loading direction, the
specimen showed strength enhancement with an increase in load, until it reached a DR of
2%. The specimen reached its calculated strength at a DR of 1.5%, whereas it
demonstrated an overstrength factor of 1.08, during the last loading cycle.
Specimen EWB3 represented a cracking pattern analogous to Specimen EWB1. The
specimen showed early flexural cracks corresponding to a DR of 0.5%. The flexural
cracks due to the positive and negative loadings extended vertically in the upward or
downward direction, and have spread over a certain length of the beam. Meanwhile, no
shear cracks were detected, indicating low levels of shear strain in the beam. The
columns generated cracks at a DR of 2.0% and a minor extension of these cracks
occurred during the subsequent cycles. All the beam reinforcement, whether placed
outside or inside the joint core, yielded corresponding to a DR of 1.5% or greater. The
yielding positions of these bars were found to be at the sections close to where the
maximum bending moments encountered during the test. No strain lag was observed
among these bars.
Specimen EWB2
Fig. 7 presents the story shear force versus the horizontal dis-placement hysteresis loops
of EWB2. In both the loading directions, the specimen attained its calculated strength at a
DR of approximately 1.5%. In the loading run corresponding to a DR of 2.0%, the
specimen attained its maximum story shear capacity in the positive loading direction. The
maximum strength reached was approximately 20% higher than its theoretical capacity.
In the subsequent positive loading cycles, the strength of the specimen decreased. During
the last loading run corresponding to a DR of 3.2%, the specimen carried around 80% of
the maximum strength, and the test was terminated. However, in the reverse loading, the
specimen attained a greater strength in its horizontal loading capacity, until the last
loading run.

The cracking pattern of EWB2 is shown in Fig. 8. The specimen indicated early
flexural cracks beginning at a DR of 0.5%. In the subsequent loading runs, corresponding
to a DR of 1.5% and higher, the flexural cracks appeared on the columns faces adjacent
to the joint core region. At this stage, a diagonal crack was visible close to the line
joining the upper right corner and its opposite corner of the joint. When loading reached a
DR of 3%, the flexural cracks in the beam propagated rapidly covering nearly the entire
length of the beam span. At this stage, no additional cracks had occurred on the column
faces. In the meanwhile, the diagonal cracks further extended into the columns. The
yielding of the reinforcement in the beam top layer occurred corresponding to a DR of
2.0%, while the reinforcement in the bottom beam layers experienced early yielding
corresponding to a DR of 1.0%. At higher loads, the reinforcement in the joint core
experienced a low level of strain distribution, indicating bond slippage of the
reinforcement within the joint core.
Discussions on Experimental Observations
Loading Capacity and Hysteresis Responses
The story shear force versus horizontal displacement relationships obtained through the
experimental investigation clearly showed that Specimens EWB-1 and EWB-3 did not
reach their theoretical capacities in the positive loading direction, but attained these
capacities in the negative loading direction. However, an obvious strength enhancement
was found in EWB-2, while a limited over-strength was observed in Specimens EWB-1
and EWB3. Although EWB3 had a lower concrete grade than Specimen EWB1, its
performance was only marginally inferior compared to EWB1 (see Figs. 4 and 5),
indicating a minor influence of concrete grades in the joint performance. A further
investigation in this area would help to reveal more details.
It was noticed that the specimens reached their nominal capacities at a relatively high
level of DRs which was around 1.5% or higher. This was mainly due to the flexibility of

the specimens, which could be attributed to the lower stiffness of the shallow wide beam.
The early bond slippage in the beam longitudinal bars made the specimens more flexible.
Column Behavior
ACI-ASCE recommends a column to beam flexural strength ratio of 1:4, EWB2 meets
this criterion and thus satisfies the strong column-weak beam philosophy. In contrast, the
column to beam flexural strength ratio of EWB1 and EWB3 is comparatively higher.
This ratio for Specimens EWB1 and EWB3 is approximately 4.3 and 5.9 in the positive
and negative loading directions and is summarized in Table 1. This led to these
specimens having low strain levels in their reinforcement and an elastic response of the
columns during the test. It was evident that the bars within the column did not attain its
yield stress during the experiment when the strain profiles were studied. The requirement
of “strong column and weak beam” is aimed at preventing the formation of hinge
mechanisms in the columns during earthquakes. However, too large a flexural ratio
would result in an uneconomical design solution.
During the test, signs of bond deterioration were detected in column bars of all the three
specimens. To limit the bond stress within the joint, a bond index (BI) (Kitayama et al.
1991) was introduced
(1)
where =maximum bond stress of column reinforcement over the beam depth;
db=beam bar diameter; hc=column depth; fy=yield strength of beam bars; and =concrete
compressive strength. BI for column bars can also be computed using Eq. (1). It may be
observed from the test program that all the three specimens had the same depth for the
beam and the same diameters for the column bars. Therefore, an uniform column BI of
2.35 MPa was obtained for all the specimens. This value was relatively higher than the

Japanese recommend limit of 1.4 MPa. The computed BI was based on the measured
maximum bond stress in the columns within the joint.
The column reinforcement in the top and bottom of the joint region experienced tensile
strain, indicating the fact that the transition from tension to compression could not take
place over the column depth. This trend was observed in all the three specimens.
Beam Behavior
During the test, it was observed that the bars in the outside beam portion did not reach the
yield strain with the maximum strain being generated at the location near the center depth
of the column. This indicated that a lag in yielding occurred in the bars passing through
the column as well as those in the outside beam portion, such that an anchorage problem
could be expected in the beam bars within the outside beam portions. In EWB1 and
EWB3, all the top reinforcement yielded eventually. However, the yielding was first
observed on the bottom layer, indicating a large-scale tensile force at the bottom
reinforcement of the beam. The lack of plastic hinge generation in an exterior wide beam-
column joint was probably due to the cracking and torsional flexibility of the transverse
beams.
In general, the wide beam reinforcement had more favorable bond conditions than
column bars, as measured by the hb/db ratio and the BI. Besides, the overall bond
response of the wide beam bars was better than that of the column bars. The strain data
recorded during the tests showed that bond deterioration of bars passing outside the
column core was faster than the bars passing through it. The reason for this is that within
the beam portion and outside the column, there were no extra hooks used to provide
confinement to the concrete. Therefore, the longitudinal beam reinforcement was not in a
good anchorage condition. Also, the bond of bars in the bottom layer was better than that
of bars in the top layer.

The wide beam generally carried a lower amount of shear stress as compared with the
normal width beam-column specimen. This was attributed due to the larger cross
sectional area present in the wide beam specimen. Strains measured on the beam
transverse reinforcement in all specimens were lower than one-third of the yield strain.
The wide beams of the specimens never exhibited any inclined cracks, a fact which can
be attributed due to the high shear strength of the beam. Therefore, the shear
reinforcement within the beam were not heavily strained.
Joint Shear Behavior
The design philosophy embodied in ACI-ASCE Committee 352 recommendation implies
that joint shear is resisted mainly by the concrete strut mechanism rather than the truss
mechanism, unless a good bond condition is provided within the joint. The shear strength
calculated based on the recommendations by ACI-ASCE Committee 352 made with an
assumption that the joint area is equivalent to the column section is shown in Table 1.
The shear levels associated with the measured shear deformations were relatively low
when compared with the limits provided by ACI-ASCE Committee 352. This confirms
the suggestion indicated by the previous investigators (Durrani and Zerbe 1987; Ehsani
and White 1985; Bonacci and Pantazopoulou 1993) that joint shear requirement within
the joints of wide beam-column frames can be relaxed.
The observations of the experimental test results indicated that the joint shear strength
of the specimens was sufficient to withstand the imposed displacement history. No signs
of shear distress were noticeable from the load versus displacement histories during the
test. In the early stage of loading cycles, there were no joint shear distortions and
expansions. Beyond a DR of ±0.5%, however, a rapid increase in the joint shear
distortion coupled with diagonal tension cracks was observed. The joint deformation of
the specimens continued to increase until a DR 2.5%, where the maximum joint
expansion of 0.8 mm and the maximum shear distortion of 0.55% were attained.

As mentioned earlier, the joint core of each specimen was confined by using the joint
transverse reinforcement. Generally, the links located approximately at the middle level
of the joint showed the largest strain response. Most of the joint shear was carried by the
concrete strut mechanism during the early stages. After the joint shear cracking occurred,
the concrete struts were in compression and could not carry the shear by themselves.
They always need steel ties in tension. However, until the final loading stage, none of the
joint links reached its yield strain regardless of the nature of force (tension or
compression) in them. This may be attributed due to the large section of joint shear area
and the confinement of concrete from the column longitudinal reinforce¬ment and the
transverse beam.
FE analysis
General
In order to further enhance the understanding of complex behavior of the wide beam-
column joints, the following sections present the nonlinear FE numerical investigation
carried out. In the numerical study, a three-dimensional (3D) FE analysis is preferred due
its advantages over the two-dimensional (2D) FE analysis, since it does not make
simplifying assumptions related to the effective slab width, column rigidity, etc.
Furthermore, a 3D modeling permits studying of the complex state of stresses at various
key sections such as around the columns, inside the joint and on the top of the wide
beams.
Material modeling
In material modeling, the model of concrete was based on nonlinear fracture theory to
account for cracking, while plasticity models were used for the concrete in compression
and reinforcing steel. The analysis used a constant stress cut-off criterion for cracking of
the concrete. According to this model, a crack is assumed to have initiated perpendicular
to the major principal stress if its value exceeds the tensile strength, independent of other

principal stresses. Further details about the crack formation, orientation, angle limitation
between primary secondary cracks, etc., may be referred (Hajime and Kohichi 1991). The
fracture energy GF and the tensile strength ft were used to calculate the value of ultimate
crack opening wu. The details of concrete material modeling in elastic-plastic state,
cracked concrete options in tension and compression can be found in the reference
(Kulkarni et al. 2008). The von Mises yield criterion with isotropic strain hardening and
an associated flow rule were used to describe the constitutive behavior of the
reinforcement. The bars were modeled with the DIANA (DIANA user’s manual—
Version 7 2000) options of either embedded reinforcements or according to the
recommendations of separate truss elements. The bond-slip phenomenon was accounted
for in the FE analysis by including contact elements along the truss elements. The stress-
strain relationship (elasto-plastic curve) of reinforcing steel can be referred in the
literature (Kulkarni et al. 2008).
Bond Slip Theory and Element Description
The pinching of hysteresis loops was caused by the closing and opening of cracks or
debonding of reinforcing steel. Fig. 9 shows the arrangement of truss and bond elements
embedded in the concrete elements. In the formulation, the concrete is treated as a 2D or
3D continuum element, while the truss and bond elements are assumed to be of constant
strain and constant slip, respectively. For bond element, a degree of freedom s is
introduced to represent the bond slip. At ith node of the element boundary, si is the
difference between concrete and bar displacements. The nodal displacement for the truss
element at ith node can be calculated as
(2)
If Lk is the length of truss element k and E is the Young’s modulus of the truss element,
the stress in truss element k with nodes i and i+1 can be evaluated as

(3)
In order to ascertain a satisfactory bond between concrete and reinforcement bar, the
equilibrium condition is given by
(4)
where =maximum bond stress that can be transmitted across the interface for slip,
which is analogous to friction law. p and A are the perimeter and cross-sectional area of
the reinforcement bar, respectively. A bond slip is assumed to occur, if the equilibrium
condition in Eq. (4) is unsatisfied. Discretizing Eq. (4) and use of constant strain
condition of the truss element, it is modified to
(5)
A set of nonlinear simultaneous equations is formed extending Eq. (5) to all nodes of the
bond elements. The nonlinear nature of the equations is due to the material nonlinearity
accounted in the problem. These equations are solved using an iterative procedure and the
bond slip si at all nodes is estimated. Substituting the bond slip values in Eq. (2) element
stresses can be calculated. Owing to the constant strain type of truss element chosen,
these stresses at the adjacent elements of a node may differ. To overcome this problem,
the cohesion stress τc surrounding the truss element is calculated using the weighted
nodal stresses
(6)
in which the weighted nodal stress at ith node of an element is estimated as given
below
(7)

Bond Slip Law
The bond law used in the analysis is based on CEB-FIP Model Code-1990 [Federation
International de la Precontrainte (CEBFIP) 1993], as shown by Fig. 10. Equations of
bond stress for
(8)
The bond law model parameters depend on the properties of the bar surface, and can be
referred from the CEB-FIP Model Code.
Geometry Modeling
The DIANA software was used for the FE analysis. The concrete was modeled using 20-
node 3D quadratic solid elements while the reinforcing bars were modeled as truss
elements. The FE discretization of Specimens EWB1 and EWB2 with boundary
conditions is shown in Fig. 11.
Verification of Finite-Element Analysis Results
The results from the FE analysis were compared to those obtained from the experiment
for verification. The results presented are only for EWB1 and EWB2 because of the
geometrical similarities between EWB1 and EWB3. Fig. 4 illustrates the comparison of
hysteresis behavior between the FE numerical and the experimental results of EWB-1.
The results indicates a good agreement in the overall global behavior of between the
experimental and numerical specimens. In the analysis, the theoretical capacity was
reached corresponding to a DR of 0.8% in the negative loading direction, whereas in the
positive loading direction, it did not reach the theoretical capacity. This phenomenon was
quite similar to that observed during the experimental investigation. In addition, in either
of the loading directions, the numerical results gained the maximum capacities of 152 and
158 kN, respectively, in the negative and positive loading directions. This indicated that
during early stages, the stiffness of the numerical specimen was higher compared with
those of its experimental counterpart by around 15 and 5% in the positive and negative
loading directions, respectively. After reaching the maximum capacity, the strength and
stiffness degradations were obviously seen in the positive loading direction. The
hysteresis loops of the numerical model could not properly capture the pinching behavior,
which had been observed during the experimental test. Fig. 7 indicates the comparison of
hysteresis loops between the numerical and the experimental models of EWB-2.
Throughout the test, the story shear strength attained by the numerical model slightly was
lower than the experimental observation. The maximum story shear capacities predicted
by the FE analysis corresponding to a DR of 2.5% were 169 and 125 kN, in the positive
and negative directions, respectively. However, these values were lower compared to the
experimental results by around 5 and 11% in the positive and negative directions,
respectively.
The comparison made between the experimentally obtained strains and those obtained
from the FE analysis showed good correlation. The FE analysis predicted the maximum
strain to be present at the intersection of the beam and columns. The outermost beam bars
could not transfer the tensile forces into the column via torsion moments within the
transverse beam due to the poor anchorage condition between the bars and surrounding
concrete. This was reflected in both the numerical and the experimental results. The
strains predicted in the beam longitudinal reinforcement were slightly higher than the
measured values with yield penetration being observed at the joint core. In addition, the
comparison of shear forces between the FE analysis and the experimental test results also
showed good agreement. The aforementioned facts indicated that based on the well-
established models, the FE analysis is capable of producing fairly accurate predictions of
joint performance.

Parametric Studies
After calibration of the FE models against the experimental results, this section presents a
parametric investigation in order to elucidate more information about the complex
behavior of the wide beam-column joints. The structural response of the joints was
studied by varying some key parameters such as column axial loading, transverse beam
effect, and beam longitudinal bar anchorage ratio.
Influence of Column Axial Load
The investigations into the effect of column axial load on the performance of beam-
column joints began in the late 1980s (Paulay et al. 1978; Paulay and Park 1984) and
thereafter, this area has attained enormous interest with extensive research studies.
However, at what column axial load level do the joint shear strength and bond condition
significantly influence the joint behavior is an argued issue among different researchers.
For example, according to NZS3101 (Concrete Structures Standard 1995), the
contribution of the main strut mechanism is ignored unless a significant amount of
column axial load (i.e., greater than 0.1 ) exists. Kitayama et al. (1991) have
indicated that column axial load smaller than 0.3 does not exhibit a beneficial effect
on the bond resistance along the beam bars within a joint, and that anything smaller than
0.5 does not influence the joint shear strength. Shiohara (1998) has shown that the
column axial load does not influence the shear strength of ductile joints.
In this study, the influence of column axial load on the seismic behavior of the wide
beam-column joints were investigated using the FE analysis. The same loading histories
as those used in the experimental tests of the specimens were applied, and the
corresponding story shears versus horizontal displacements under different axial loading
levels are plot in Figs. 12 and 13. The applied column axial load varied in magnitude
ranging from 0 to 0.5
. As observed on Fig. 12, the story shears of Specimen
EWB1 increased by around 5 and 8%, as the axial load was enhanced to 0.2 and
0.25 , respectively. However, any increase in the axial load further reduced the story
shears. An analogous observation can also be made in Specimen EWB2, whose story

shears experienced an increase by around 4 and 6% for axial load levels of 0.2 and
0.25 , respectively (see Fig. 13). However, further enhancement of axial load led to
the reduction in story shears and the degradation of stiffness. The aforementioned
discussion clearly indicated that when the axial load level was 0.25 , the exterior
wide beam-column joints experienced an optimum enhancement in strength with
Specimens EWB1 and EWB2 showing an increase of around 8 and 6%, respectively. A
further increase in axial load, that is, beyond 0.25 led to the decrease in strength and
stiffness.
Influence of Transverse Beam
In the past, the effect of transverse beam has been studied to understand its influence on
the story shears and its ability to transfer flexural forces to the column. Investigation by
Hatamoto et al. (1991) has shown that there is no enhancement in the total story shear
force with the increase in transverse beam reinforcement. However, they highlighted its
contribution in alleviating some amount of low displacement pinching. Through an
experimental research, Gentry (1992) demonstrated that if the transverse beam cracked
significantly in torsion, the specimen loses its stiffness and the wide beam is not able to
fully develop its plastic hinge. It was also mentioned that the exterior beam-column joint
is characterized by the ability of its transverse beam to transfer the wide beam flexural
forces to the column.
In order to investigate the influence of transverse beams on the performance of exterior
wide beam-column joints, four additional numerical specimens consisting of different
configurations of the transverse beam were modeled (see Fig. 14). In Model A, there was
no transverse beam cast into the joint, while Model B contained a transverse beam
section of 300 mmX400 mm with 10% reinforcement in excess of nominal bars area
[Figs. 14(a and b)]. Model C, as shown by Fig. 14(c), was built using a conventional type
of transverse beam with a cross sectional area of 400 mmX200 mm and provided with
slightly higher reinforcement than that in Model B. The transverse beam of Model D had
the same thickness as that of Model B, but a portion of its width was extended (by 200

mm), as shown in Fig. 14(d). The reinforcement in the longitudinal direction was similar
to the main beam while an additional reinforcement, equivalent to 1.0% of the cross
sectional area in the top and bottom layers, were placed in the transverse direction. The
FE analysis showed that since there was no transverse beam in Model A, the longitudinal
reinforcement in the outermost part of the beam could not effectively contribute to
transferring the shear forces and bending moments to the joint core. On the other hand,
Model B showed a moderate improvement in its joint shear performance, due to the
presence of a small quantity of transverse beam reinforcement. Model C had a higher
torsional inertia than that of Model B and therefore, it resisted higher magnitude of joint
shear forces and story shears. Model C experienced an enhancement of approximately 1.5%
in story shear compared to Model B. Model D had the largest size transverse beam and
hence, the story shears carried by this model was highest among the four models. The
specimen showed an increase of approximately 3.0% in story shear. Therefore, it can be
concluded that a well-reinforced transverse beam with a large section will contribute to a
more superior performance in terms of joint shear enhancement and effective transfer of
beam bending moments.
Beam Longitudinal Bar Anchorage Ratio
The anchorage ratio is the ratio of the amount of wide beam longitudinal reinforcement
which is anchored inside the joint core to the total longitudinal steel. Previous
investigations have suggested that beside other factors, the beam longitudinal bar
anchorage ratio also play a key role in effectively transferring shear forces and bending
moments. Through a set of experimental studies, Hatamoto et al. (1991) observed an
excessive pinching of the wide beam-column joints with a smaller anchorage ratio.
Therefore, it was suggested that the amount of beam longitudinal reinforcement placed in
the outermost part of the beam should be limited. In a different study, Paulay et al. (1978)
also recommended that at least three-fourths of the beam longitudinal bars should pass
through the column core.
To study the influence of beam anchorage ratio, Specimens EWB1 and EWB2 were
investigated by varying these ratios. The FE analysis was performed by choosing

different bar diameters while maintaining the same reinforcement area. The results
indicated that the overall behavior in terms of horizontal displacement versus story shear
forces were almost identical. Fig. 15 illustrates the influence of the beam longitudinal bar
anchorage ratio on the joint shear behavior. The maximum joint shear stress increased by
approximately 17% when the bar anchorage ratio was enhanced to 50%.
Conclusions
Based on the experimental and the FE numerical results of the exterior wide beam-
column specimens, the following conclusions can be drawn:
1. Wide beam-column joints, when designed with suitable parameters, perform quite
well in carrying the horizontal lateral loads as they can generally attain their strength
and deformation capacity.
2. Concrete grades did not provide much influence the performance of the specimens.
3. Due to shear lag, longitudinal bars at the edge of the wide beam yield at higher loads
than the bars that intersect the column. This leads to a delay in the formation of full
width hinges. Based on the current investigation and the previous experimental tests
by Hatamoto et al. (1991), it was observed that the effective beam width is smaller
than the actual beam width when the beam to column width ratio is greater than 3.
4. The torsional behavior of transverse beams dominate the seismic performance of
wide beam-column joint specimens. The results from the experimental and the FE
numerical studies suggested that the specimens reached their strength when the
transverse beam lost its torsional capacity. Therefore, the design and detailing of the
transverse beam is a critical issue which needs to be carefully addressed.
5. Due to the larger section of the wide beam, the shear stresses in the beam transverse
reinforcement were very low and therefore, the requirement of beam shear
reinforcement can be relaxed.
6. FE numerical investigation showed that the column axial load significantly influenced
the seismic behavior of the wide beam-column joints with an improvement in their
performance of up to 0.25 . When the column axial load level was 0.25 , the
exterior wide beam-column joints exhibited an enhancement in strength of around 8

and 6%, respectively, for Specimens EWB1 and EWB2, while further increase in
axial load beyond 0.25 proved to be detrimental, and decreased its strength and
stiffness.
7. The FE investigation was effective in successfully predicting the local behavior of
wide beam-column joints. The numerical study clearly suggests an improvement in
joint shear stress by increasing the longitudinal bar anchorage ratio. The maximum
joint shear stress experienced an enhancement of approximately 17% as the bar
anchorage ratio was increased from 20 to 70%.
Acknowledgements
The financial assistance provided by the Protective Technology Research Centre in the
School of Civil and Structural Engineering at Nanyang Technological University,
Singapore is gratefully acknowledged.
Notations
The following symbols are used in this paper:
area of a truss element;
gross area of section;
beam width;
column width;
ratio of beam width to column width;
beam width;
diameter of bar;
Young’s modulus of a truss element;
yielding strength of joint shear reinforcement;
yielding strength of main bars;
concrete compressive strength;
beam depth;

column depth;
ratio of beam depth to column bar diameter;
ratio of column depth to beam bar diameter;
theoretical initial stiffness;
length of kth truss element;
perimeter of a truss element;
theoretical lateral load;
bond slip;
bond slip at ith node of an element;
displacement of an element at ith node;
joint shear factor;
theoretical initial yield displacement;
normal stress in kth truss element;
weighted normal stress at kth node;
bond stress;
maximum bond stress; and
cohesion stress.

References
American Concrete Institute (ACI)-ASCE Committee. (1996). “Part 1: ACI manual of
concrete practice—Recommendations for design of beam-column joints in monolithic
reinforced concrete structures.” ACI352R-91, Detroit.
American Concrete Institute (ACI) Committee. (2005). “Building code requirements for
structural concrete (ACI 318-05) and commentary.” ACI 318R-05, Detroit.
Bonacci, J., and Pantazopoulou, S. (1993). “Parametric investigation of joint mechanism.”
ACI Struct. J., 90(1), 61–71.
British Standards. (1997). “Part 1: Code of practice for design and construction—
Structural use of concrete BS 8110.” BS 8110, U.K.
Concrete Structures Standard. (1995). “Part 1—The design of concrete structures
standards.” NZS3101, New Zealand.
DIANA user’s manual—Version 7. (2000). “Finite element analysis user’s manual—
Nonlinear analysis,” TNO Building and Construction Research, Delft, The
Netherlands.
Durrani, A. J., and Zerbe, H. (1987). “Seismic resistance of reinforced concrete exterior
connections with floor slab.” J. Struct. Eng., 113(8), 1850–1864.
Ehsani, M. R., and White, J. K. (1985). “Effect of transverse beams, and slab on
behaviour of reinforced concrete beam-column connections.” ACI Struct. J., 82(2),
188–195.
Federation International de la Precontrainte (CEB-FIP). (1993). CEB-FIP model code
1990: Design code, Thomas Telford, Lausanne, Switzerland.
Gentry, T. R. (1992). “Reinforced concrete wide beam-column connections under
earthquake-type loading.” Ph.D. thesis, Univ. of Michi-gan, Ann Arbor, Mich.
Gentry, T. R., and Wight, J. K. (1994). “Wide beam-column connections under
earthquake-type loading.” Earthquake Spectra, 10(4), 675–703.
Hajime, O., and Kohichi, M. (1991). Nonlinear analysis and constitutive models of
reinforced concrete, Gihodo, Tokyo.

Hatamoto, H., Bessho, S., and Matsuzaki, Y. (1991). “Reinforced concrete wide-beam-
to-column sub-assemblages subjected to lateral load.” Design of beam-column joints
for seismic resistance, SP-123, J. O. Jirsa, ed., ACI, Detroit, Mich., 291–316.
Kitayama, K., Otani, S., and Aoyama, H. (1991). “Development of design criteria for RC
interior beam-column joints.” Design of beam-column joints for seismic resistance,
SP-123, J. O. Jirsa, ed., ACI, Detroit, Mich., 97–123.
Kulkarni, S. A., Li, B., and Yip, W. K. (2008). “Finite element analysis of precast hybrid-
steel concrete connections under cyclic loading.” J. Constr. Steel Res., 64, 190–201.
LaFave, J. M., and White, J. K. (1997). “Behaviour of reinforced concrete exterior wide
beam-column-slab connection subjected to lateral earthquake loading.” Rep. No.
UNCEE 97-01, Dept. of Civil and Env. Eng., The Univ. Michigan, Ann Arbor, Mich
LaFave, J. M., and White, J. K. (1999). “Reinforced concrete exterior wide-beam-
column-slab connections subjected to lateral earthquake loads.” ACI Struct. J., 96(4),
577–585.
Paulay, T., and Park, R. (1984). “Joints in reinforced concrete frames designed for
earthquake resistance.” Research Rep. No. 84-9, Dept. of Civil Eng., Univ. Canterbury,
Christchurch, New Zealand.
Paulay, T., Park, R., and Priestley, M. J. N. (1978). “Reinforced concrete beam-column
joints under seismic actions.” ACI Struct. J., 75(11), 585–593.Ann Arbor, Mich.
Shiohara, H. (1998). “A new model for joint shear failure of reinforced concrete interior
beam.” J. the School Eng. Univ. of Tokyo, XLV, 16–40.
Siah, W. L., Stehle, J. S., Mendis, P., and Goldsworthy, H. (2003). “Interior beam column
connections subjected lateral earthquake loading.” Eng. Struct., 25, 281–291.
Stehle, J. S., Goldsworthy, H., and Mendis, P. (2001). “Reinforced Concrete interior
wide-band beam-column connections subjected to lateral earthquake loading.” ACI
Struct. J., 98(3), 270–279.

List of Tables
Table 1 Design Parameters of the Specimens

List of Figures
Fig. 1 Wide beam-column joint specimens with reinforcing details
Fig. 2 Test setup showing Specimen EWB1
Fig. 3 Cyclic horizontal loading history
Fig. 4 Comparison of hysteresis behavior between the FE analysis and the
experimental results EWB-1
Fig. 5 Hysteresis loops showing shear force versus horizontal displacement
EWB3
Fig. 6 Cracking pattern of Specimen EWB1
Fig. 7 Comparison of hysteresis behavior between the FE analysis and the
experimental results EWB-2
Fig. 8 Cracking pattern of Specimen EWB2
Fig. 9 Description of bond element
Fig. 10 Bond slip law by CEB-FIP Code 1990
Fig. 11 FE modeling of the specimens
Fig. 12 Influence of the axial load by the FE analysis for EWB1
Fig. 13 Influence of the axial load by the FE analysis for Specimen EWB2

Fig. 14 FE modeling for investigating the effect of transverse beam
Fig. 15 Influence of beam longitudinal bars anchorage on joint shear stress

Table 1

Fig. 1

Fig. 2

Fig. 3

Fig. 4

Fig. 5

Fig. 6

Fig. 7

Fig. 8

Fig. 9

Fig. 10

Fig. 11

Fig. 12

Fig. 13
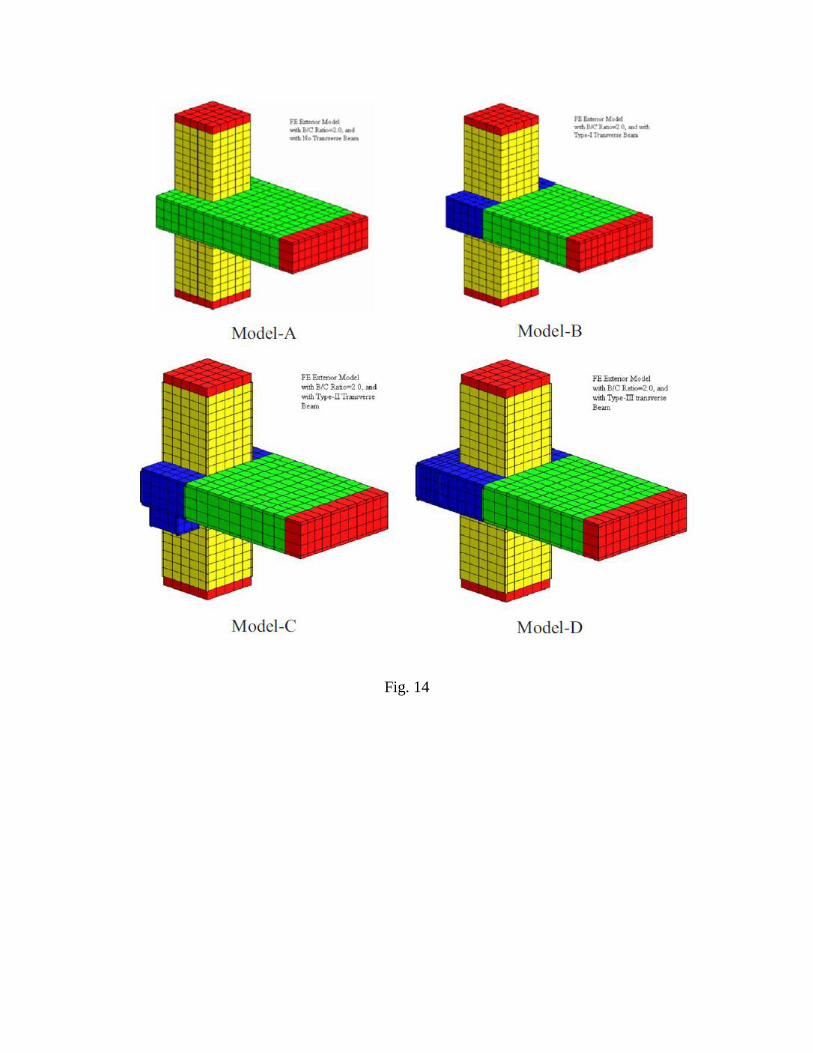
Fig. 14

Fig. 15