1888-01 ttip impact in ireland 26feb2015 · ttip impact in ireland preface the irish department of...
TRANSCRIPT

TTIP impact in Ireland
This report is prepared for the Department of Jobs, Enterprise and Innovation, Ireland February 2015

TTIP impact in Ireland
Authors: Martin H. Thelle (project manager) Dr. Tine Jeppesen Dr. Jori Veng Pinje Anders Kjøller-Hansen Prof. Dr. Ronald B. Davies, University College Dublin, Ireland Prof. Dr. Joseph F. Francois, World Trade Institute, Switzerland

TTIP impact in Ireland
Preface The Irish Department of Jobs, Enterprise and Innovation has commissioned Copenha-gen Economics to prepare this report with the aim of identifying and quantifying, for Ireland, the economic opportunities and impacts, including sectoral effects, of a poten-tial Transatlantic Trade and Investment Partnership (TTIP) agreement. We have been asked to consider the impact on primary, manufacturing and services sec-tors and to include spillover effects on Ireland’s trade and investment position with key third-country economies and regions. The analysis is also requested to cover the impact on broad economic variables in as-sessing the overall impact on the economy arising from the TTIP. Finally, we have been asked to identify areas of the Irish economy where policy options might be needed to maximise and/or address the economic, employment, regulatory and sector advantages/issues arising from the TTIP. The report is prepared by Copenhagen Economics in collaboration with Professor Ronald B. Davies and Professor Joseph F. Francois. Editing of the report ended in November 2014. About Copenhagen Economics
Copenhagen Economics is an economics consultancy with offices in Copenhagen and Stockholm. The com-
pany employs around 40 expert economists across a range of fields.
Copenhagen Economics’ practice on international trade has performed numerous studies and assignments on
the economic impacts of trade liberalisation. The firm has advised the Chief Economist team at DG Trade over
the past ten years on economic impact assessments of trade and investment policies, including free trade
agreements with the US, Korea, Canada, Japan and Mercosur.1 The firm have also advised several ministers
for trade and investment as well as both exporters and user-industries in antidumping cases.
Professor Ronald B. Davies
Professor Ronald B. Davies is at School of Economics at University College Dublin. His research interests in-
clude International Trade, Foreign Direct Investment, Taxation of Multinational Corporations and Tax Com-
petition.
Professor Joseph F. Francois
Professor Joseph Francois is one of the most experienced experts when it comes to CGE modelling of free
trade agreements and is behind a number of the simulations undertaken for the European Commission, in-
cluding the latest CEPR study on the TTIP.
1 See Copenhagen Economics’ website www.copenhageneconomics.com for further information.
TTIP impact in Ireland
Table of contents
1 Introduction and background 7
Purpose of the study 7
The TTIP agreement and state of play 7
EU-wide study on the economic impacts of the TTIP 10
Approach and method 11
2 Main impacts on the Irish economy 13
Ireland’s trade and investment with the US 13
Current trade barriers 16
TTIP and SMEs 20
Main Scenario 21
Overview of macro results 22
Impact on GDP and national income 23
Impact on output in Ireland by main sectors 24
Impacts on trade flows 25
Impacts on wages and employment 27
Main sectors of opportunities for Ireland 28
Main sectors where Ireland should prepare for adjustments 28
3 Pharmaceuticals and chemicals 29
Introduction to the sector in Ireland 29
The current trade patterns 29
Reduction in barriers to transatlantic trade in the sector 31
Expected impact in the sector 32
Expiration of Patents in Pharmaceutical Sector 33
Expected impacts for foreign direct investment 33
4 Electronic equipment 35
TTIP impact in Ireland
Introduction to the sector in Ireland 35
The current trade patterns 35
Reduction of barriers to transatlantic trade in the sector 37
Expected impacts for the sector 38
Link to ICT services 39
Expected impacts of FDI in the sector 39
5 Services 41
Introduction to the sector in Ireland 41
Current trade patterns 42
Reduction in barriers to transatlantic trade in the sector 46
Expected impact in the sector 49
Expected impact on FDI in the sector 51
6 Agriculture and food sector 53
Introduction to the sector in Ireland 53
Overview of results in agriculture 54
Dairy 55
Beef 58
Other agri-food 64
7 Impact on FDI and SMEs in Ireland 67
Current US FDI in Ireland 67
Results broken down by foreign vs domestic-owned firms 69
Trade liberalisation and changes in FDI in Ireland 74
Impact of investment liberalisation in TTIP 75
Glossary 78
References 79
TTIP impact in Ireland
4
Executive summary The Transatlantic Trade and Investment Partnership (TTIP) will be the biggest trade deal in the world, and it has the potential to bring significant benefits to both sides of the At-lantic. An economic impact study on TTIP prepared for the European Commission by the Centre for Economic Policy Research (CEPR) in 2013 concluded that a comprehensive agreement targeting both tariffs and non-tariff barriers (NTBs) could result in annual gains of up to €119 billion for the EU as a whole and up to €95 billion for the US. This is equivalent to an additional annual income of €545 and €655 per family of four in the EU and the US, respectively. Ireland’s trade and investment relations with the US are especially important. In 2013, Ireland exported €18 billion worth of goods to the US, equivalent to 21% of total Irish ex-ports of goods, making the US the single largest market for Irish exports of goods. Ireland is by far the EU Member State with the greatest dependence on the US export market. When comparing the share accounted for by US export market in total extra-EU export of goods, Ireland is a clear number one with 49% of its extra-EU exports destined for the US, while the average for EU28 is 16%. One quarter of foreign direct investment (FDI) in Ire-land comes from the US and Ireland is the third largest recipient of US FDI. In this study, Copenhagen Economics has assessed the economic impacts of TTIP on the Irish economy. Our assessment relies in part on detailed model simulations for the Irish economy using the same model and liberalisation scenarios as used in the CEPR study on the EU-wide impacts of the TTIP as described above. We use the model to quantify the macroeconomic and sectoral impacts of the TTIP on the Irish economy. In addition, Co-penhagen Economics has conducted a series of stakeholder meeting to gain further details in selected industries of key importance and look into the cross-cutting areas of im-portance, i.e. the implications for foreign investment into Ireland.
Large and positive impact on the Irish economy
Taking all these complex interactions into account, we find that TTIP will have an overall very positive impact on the Irish economy. We predict that TTIP would have increased Ireland’s GDP by 1.1% had it been implemented today. Using Ireland’s GDP at current market prices for 2013 of €175 billion as the base, the increase corresponds to an uplift of €2.0 billion to Ireland’s GDP. Real national income is a different measure than GDP and is a measure of the actual pur-chasing power available for final consumption, given changes in both output and prices. Real national income better captures shifts in the economy toward a more efficient basket of goods and services, as well as changes in final consumption prices. Usually these two measures track each other closely. According to our simulations, real national income in Ireland is predicted to increase by €2.4 billion as a result of TTIP.
TTIP impact in Ireland
5
Tariffs and regulatory differences give rise to unnecessary burdens on exporters, which causes distortions in the exchange of goods and services. Reducing these barriers will pro-vide consumer gains and enhance trade and growth. Although tariffs are generally low, Irish exporters still pay in excess of $300 million per year in tariffs to the US Treasury. And there are significant tariff peaks on both sides. TTIP is expected to provide substantial reductions in tariff barriers, and this will increase trade in both directions. Overall, our results show that TTIP will increase exports from Ireland to the world by around 4% compared what it would otherwise be, and likewise for imports where the increase is estimated at slightly above 4%. But because Ireland’s trade balance with the US is already very favourable, TTIP will in fact improve Ireland’s trade balance by €2.4 billion. Finally, investment in Ireland is predicted to increase to a level 1.5% above what it would have been without the agreement. However, TTIP will take time to implement and by the time of its full effect, the world will have changed in a number of ways. To reflect the time horizon, we have performed addi-tional simulations relying on projections of the global economy. Our projections of the impacts of TTIP in Ireland indicate that structural changes in the global economy (i.e. changes in sector composition and trade patterns) will work to Ireland’s advantage and TTIP will have even greater impact in the future than in the current situation. Projecting the world economy to a likely 2030-baseline, and re-applying the same scenario of trans-atlantic trade liberalisation, we predict even greater impacts on Ireland’s economy. Natu-rally these estimates are subject to uncertainty, but the direction of the results are reas-suring, as it underlines that the structural change that can be foreseen will further en-hance the expected benefits on all macro indicators.
Main impacts are found in Irelands manufacturing sector
Measured in terms of output (gross value added) in Ireland, we predict that the impact will be found overwhelmingly in the manufacturing sector, and that there will be limited impacts in the agriculture and food sector and for the output of the services sectors. There are however nuances underlying this overall picture. As the subsequent chapters will show, much of the output change in manufacturing is driven by the electronics indus-try in Ireland and the pharmaceutical and chemicals industry. Within the services sector we find an expansion of insurance services and a contraction in other parts of the services industry.
Labour market impacts
It is generally perceived by economists that free trade agreements do not influence the level of employment in the economy in the long-term. Long-term employment is deter-mined by structural factors, predominantly by labour supply. Free trade agreements, though, have an effect on real wages, which can increase if the most productive industries grow and if consumer prices decline. The best way to examine labour market effects from free trade agreements is to assess the impact on real wages for different groups of workers in the economy. Our simulations show that real wages will improve for all skill groups (on average by 1.5%) and that the

TTIP impact in Ireland
6
improvement will be slightly more pronounced for low skilled labour (+1.9%) than for high skilled (+1.2%). Based on our simulations showing an increase in Ireland’s exports of 4%, we estimate this increase to correspond to somewhere between 5,000 to 10,000 addi-tional export-related jobs in Ireland. The result is based on the assumption of a fixed labour supply and does not include the impact of possible mitigating policy actions. If the Irish labour supply can be increased in parallel with TTIP (e.g. through migration) some of the potential contractions in certain sectors resulting from TTIP can be avoided or significantly reduced.
Impact for SMEs
Looking at the impact of TTIP across firm sizes, we find that TTIP may well have a more positive effect on SMEs. The regulatory complexities following from regulatory divergence is particularly burdensome to smaller firms. Large firms are able to cover the high fixed costs of dealing with regulatory complexities by exporting large volumes. For smaller firms, known as SMEs, however, exporting can be made more accessible by TTIP assum-ing that the agreement lowers fixed exporting costs. As such, their behaviour will change both on the extensive (the decision of whether or not to export at all) and intensive mar-gins (exporting more). Because of this, there is reason to believe that TTIP presents a particularly attractive op-portunity for SMEs. In a recent survey of German firms, it was found that whereas less than 20 percent of large firms anticipated benefitting from a reduction in non-tariff barri-ers via TTIP, more than 40 per cent of small and medium-sized enterprises (SMEs) hoped to gain.
Main sectors of opportunities for Ireland
Although the TTIP will present opportunities for sectors and all types of export-oriented firms, the main sectors where Ireland should pursue gains from TTIP are:
• Pharmaceuticals and chemicals • Electrical machinery • Other machinery • Agri-food (notably dairy and processed food) • Insurance
Main sectors where Ireland should prepare for adjustments
TTIP will require adjustments and timely preparation in all sectors and for all types of firms being exposed to international competition and to take advantage of new export, trade and investment opportunities. Depending on the actual outcome of the TTIP negotiations with respect to relaxation of quotas for US beef into the European market, and depending on the degree of change to other regulatory barriers in the beef sector, Ireland’s beef producers should prepare for increased competition from cost efficient US beef producers in the European market.

TTIP impact in Ireland
7
Chapter 1
Introduction and background
In this chapter we provide the background to the study and its purpose. We also summa-rise the results of the EU-wide assessment of TTIP impacts and we introduce the method and approach we use in the study.
Purpose of the study The purpose of this study is to:
• quantify the sectoral and overall macro-economic impacts of the TTIP on the Irish Economy
• identify key sectors that could be significantly impacted both positively and nega-tively
Our assessments of the impacts that a possible TTIP will have on the Irish economy can help policymakers to formulate appropriate strategies to be deployed to maximise the po-tential arising from the TTIP, and can guide the assessment of the longer-term implica-tions for enterprise policy.
The TTIP agreement and state of play The Transatlantic Trade and Investment Partnership (TTIP), hailed as the biggest trade
deal in the world2, has the potential to bring significant benefits to both sides of the At-lantic. The TTIP aims to link the world’s two biggest economies, covering:
● 22% of global GDP ● 25% of global exports ● 33% of global imports ● more than 50% of global R&D spending
The US is the most important trade partner for the EU as measured by exports. In 2013, over 16% of total EU merchandise exports were destined for the US market, and the latest statistics for trade in services shows that the US is the number one destination for service export with close to 25% of EU’s total service export (2012 data). The EU was the second most important destination for US exports (after Canada). It is also the second most im-portant import partner (after China). The US is also the most important partner for foreign direct investment (FDI). The stock of US investment in the EU made up €1.536 billion in 2012 out of a total extra-EU invest-ment of €3.947 billion (i.e. almost 40%), and the stock of EU investment in the US made up €1.655 billion in 2012 out of a total outward investment stock of €5.207 billion (i.e. over 30%).
2 European Commission (2013).

TTIP impact in Ireland
8
An agreement with the proposed coverage and depth of the TTIP will have considerable economic consequences extending beyond the two economies involved. Although the idea of a transatlantic trade agreement is not new, the circumstances are new. How we pro-duce and trade has changed significantly since the idea was first launched. Today, about 16%-18% of EU and US trade3 is with each other and most of the trade is in intermediate products within very integrated global supply chains. Global supply chains mean more trade in parts and components, and now almost 80% of world trade is trade in parts, components and semi-finished goods. The production of goods spans multiple reg-ulatory regimes and companies globalise their sourcing of inputs. This development has given rise to a demand for progress in areas ahead of solutions from the World Trade Organisation (WTO) to address behind-the-border measures and regulatory differences and to deal with the increased importance of Non-Tariff Barriers (NTBs) and trade-related Intellectual Property Rights (IPR) issues. Finding solutions to these obstacles to trade has clear impacts on productivity and wages in both the US and Europe as well as in third countries. Furthermore, genuine progress requires finding solutions that can be multi-lateralised which avoid a regulatory race to the bottom while at the same time prevent disguised regulatory protection. None of that will be easy. Likely changes in bilateral exports from the EU to the US are most pronounced in sectors such as processed foods, chemicals, other machinery, motor vehicles and financial and business services. Some of these sectors are also of key importance to Ireland in terms of exports, employment and value added. High-Level Working Group on Jobs and Growth (HLWG)
Against this background and in the early aftermath of the financial crisis, US and EU leaders decided, at the EU-US Summit in November 2011, to establish a High-Level Working Group on Jobs and Growth, led by US Trade Representative Ron Kirk and EU Trade Commissioner Karel De Gucht, in order to further enhance EU-US economic rela-tions. The Group was expected to identify and assess all options to strengthen the EU-US trade and investment relationship, especially in those areas with the highest potential to support jobs and growth. The HLWG concluded that a comprehensive agreement ad-dressing a broad range of bilateral trade and investment issues, including regulatory is-sues, and contributing to the development of global rules would provide the most signifi-cant mutual benefit for both the EU and United States’ economies. In March 2013, both the EU and the US started internal procedures that would lead to the actual launch of negotiations at the earliest opportunity. The draft negotiating mandate from the European Commission was approved by the College of Commissioners and transmitted to the Council on 12 March 2013. On 20 March 2013, the US Administration
3 Based on data from DG Trade for the year 2013 for goods and services combined. 16% of EU’s import of goods and services
from non-EU countries is from the US whereas 18% of the extra-EU exports of goods and services combined goes to the US. For goods alone, 12% of extra-EU imports comes from the US while 17% of extra-EU export goes to the US. For services, the transatlantic dependency is greater with 29% of extra-EU service imports coming from the US and 23% of extra-EU service exports going to the US.
TTIP impact in Ireland
9
formally notified Congress of its plan to negotiate a trade and investment agreement with the EU. This notification triggered a 90-day consultation period before negotiations could begin.
Foreign Affairs Council (Trade)
On 14 June 2013, the Foreign Affairs Council (Trade) under the Irish Presidency and chaired by the Minister for Jobs, Enterprise and Innovation, Mr. Richard Bruton, T.D., formally approved a negotiating mandate for the EU Commission to enter into trade and investment negotiations with the United States leading to the completion of a Transatlan-tic Trade and Investment Partnership. The objective is to quickly progress the completion of an ambitious, historic, deep and comprehensive agreement that will include significant issues around regulatory convergence as well as the usual topics on tariffs, trade in ser-vices and investment.4 Across the spectrum of stakeholders on both sides of the Atlantic, the prospect of a TTIP has been warmly welcomed and endorsed. Business, trade union and political leaders of diverse backgrounds and interests generally recognise the importance of such a move and the transformation of the transatlantic economy that it could bring about. The momen-tum to lower barriers to transatlantic trade and investment has been given particular po-litical endorsement by political leaders in the European Parliament, in the United States Congress and across the political leadership of Member States. As a result, TTIP talks started in July 2013 and seven rounds of negotiations have been completed, the latest having been held in October 2014. The eighth round is scheduled to take place in February 2015. EU governments have chosen to make the TTIP negotiating mandate public, and this transparency allows everyone to see how the EU wants TTIP to work.5 Status after the 7th round of negotiation
On 3rd October 2014, EU and US officials ended the 7th round of negotiations in Washing-ton, D.C. (US). Negotiations are now moving into the textual phase, where discussions are based on specific textual proposals. Nine consolidated text proposals have been prepared. These are on National Treatment and Market Access for Goods (NTMA), Competition, Public Procurement, Trade Dispute Settlement, Technical Barriers to Trade (TBT), Small and Medium Enterprises (SMEs), State Owned Enterprises (SOEs), Customs and Trade Facilitation (CTF) and Electronic Communications/Telecommunications Text. The following summary of the state-of-play is based on the statement by the EU’s Chief TTIP Negotiator, Ignacio Garcia Bercero, issued at the end of the round.6 According to the statement, much of the focus in the 7th round has been on the regulatory pillar of the agreement. All the regulatory elements of TTIP were discussed, both in terms of horizontal disciplines (regulatory coherence, sanitary and phyto-sanitary measures or
4 See EU Commission website: http://europa.eu/rapid/press-release_IP-13-548_en.htm. 5 The EU TTIP mandate was made public on 9 October 2014. See EU Commission website: http://trade.ec.europa.eu/do-
clib/press/index.cfm?id=1162 6 See the statement “EU-US trade – 7th round of talks on transatlantic trade pact ends in the US” published on EU Commis-
sion website: http://trade.ec.europa.eu/doclib/press/index.cfm?id=1158.
TTIP impact in Ireland
10
technical barriers to trade) as well as on specific sectors identified in previous rounds such as pharmaceuticals, cars, chemicals or engineering. Regarding horizontal disciplines, negotiators are now engaged in discussions based on textual proposals. The key objective will be to establish a strong framework for coopera-tion that allows EU and US regulators to tackle new regulatory challenges based on high levels of protection. Regarding sectors, technical work is reported as making progress in identifying concrete outcomes that save unnecessary duplications while respecting the mandates of regulators. In his statement, the EU chief negotiator is pointing out that this work is guided by the regulators, who have participated actively. Regarding strategic dimension the EU Chief Negotiator mentioned enhanced regulatory cooperation as being essential if the EU and US wish to play a leading role in developing international regulations and standards based on the highest levels of protection. Regarding enhanced regulatory compatibility, negotiators decided during the 7th round to focus their discussions and exchanges on four areas:
• energy and raw materials • customs and trade facilitation • intellectual property rights (IPR), and • small- and medium-sized enterprises (SMEs). First offers on market access in goods and services were exchanged in 2014. The EU’s of-fer on services excludes any commitments on public services such as publically funded ed-ucation, publically funded health care, social services and water.7
EU-wide study on the economic impacts of the TTIP Prior to the start of the negotiations, the European Commission released several studies and impact assessments. The most recent report on TTIP prepared for the European Commission by the Centre for Economic Policy Research (CEPR) in 2013 concluded that a comprehensive agreement targeting both tariffs and non-tariff barriers (NTBs) could re-sult in annual gains of up to €119 billion for the EU as a whole and up to €95 billion for the US. This is equivalent to an additional annual income of €545 and €655 per family of four in the EU and the US, respectively.8 The fact that an ambitious and comprehensive transatlantic trade and investment agree-ment could bring significant economic gains as a whole to the EU (€119 billion a year) and US (€95 billion a year) in the longer term is of considerable significance when both economies are striving to recover from the economic crisis, grow their economies and re-store their capacity for job creation. Consequently, the increased level of economic activity
7 See http://trade.ec.europa.eu/doclib/press/index.cfm?id=1115 8 See CEPR (2013) authored by Francois, J., M. Manchin, H. Norberg, O. Pindyu, and P. Tomberger.

TTIP impact in Ireland
11
and productivity gains created by the agreement will benefit the EU and US labour mar-kets. This and the identified impact in terms of overall wages and new job opportunities for high and low-skilled workers are of considerable importance. As one of the largest export economies in the world, the additional leverage that a TTIP would give to EU trade is very important. It is expected from the impact analysis that EU exports to the US would go up by 28%, equivalent to an additional €187 billion worth of exports of EU goods and services. Overall, total exports would increase 6% in the EU and 8% in the US. The lowering of non-tariff barriers to goods is shown to be the most im-portant factor in increasing exports. This underlines the significance of changes in regula-tions and the convergence/mutual recognition in business sectors of economic im-portance.9
Approach and method In this study of the economic impacts of the TTIP on the Irish economy, we have deployed an approach in two parts which has included a process of stakeholder involvement along the way. The first part relies on the same large-scale model of global trade which was used to analyse the EU-wide impacts of the TTIP as described above. We use the model to quantify the macroeconomic and sectoral impacts of the TTIP on the Irish economy. In the second part we rely on qualitative methods to provide further details in selected in-dustries of key importance and look into the cross-cutting areas of importance, such as the implications for foreign investment into Ireland and for SMEs.
The Computable General Equilibrium (CGE) model used
We applied a tailor-made version of the large-scale model developed for the CEPR (2013) study for the EU Commission. The model includes specificities of the Irish economy, and the sectors and scenarios are adapted to reflect the Irish economy and the specific circum-stances of the Irish economy. The model is described in the technical annex to this re-port. The model we applied is a state-of-the-art global general equilibrium model of world trade. The simulations are based on data for the Irish economy and take into account all the trade-related linkages with the rest of the world and the effects of an EU-wide agree-ment with the US. The model incorporates both monopolistic competition and Arming-ton-based trade with constant returns to scale and long-run closures with endogenous capital stocks.10 For the purpose of this study, we use baseline data for both 2011 and a projected baseline situation. For the best comparison to the EC's assessment we use 2030 as the projected baseline.11
9 It is assumed that the TTIP’s ambitious architecture will include the elimination of 25% of NTB-related costs and 100% of
tariffs. It is assumed that NTBs linked to procurement are reduced by 50% as part of the ambitious approach to the negotia-tions.
10 See Francois, van Meijl and van Tongeren (2005); Francois, Manchin, and Martin (2013); Hertel (2013). 11 Our projected macroeconomic baseline database is based on a fitting of macroeconomic projections along a timeline (in
five-year increments) of the medium or SSP2 (Shared Socioeconomic Pathway) from the most recent SSPs and related Inte-grated Assessment scenarios developed for integrated climate policy assessment exercises from NCAR, OECD and IIASA. See O'Neil et al. (2012) and IIASA (2012).

TTIP impact in Ireland
12
Working from the projected baseline, we have then examined the impact of the TTIP on the Irish economy. This involves a scenario with the removal of tariffs and a reduction in the NTBs for goods and services. We applied the same scenario definitions as were used in the recent EU-wide assessment, cf. CEPR (2013). The results of the CGE experiments include both short and long-run changes to Irish GDP, production, trade, real wages, welfare and trade across the economy as whole. For the various sectors in the model, we report changes in output, trade flows and employ-ment.
The model is global and takes into account both spillovers and trade diversion effects such as changes in market access to the EU and the US for third countries and the impact that TTIP will have on Irish trade with third countries.
Sector details in the model
The model has been adapted to reflect the main Irish sectors of interest and the model sectors used in the simulations for the Irish economy are shown below.

TTIP impact in Ireland
13
Chapter 2
Main impacts on the Irish economy
In this chapter we present the main findings from our assessment and we present the key sectors of attention with respect to maximising the impact of TTIP for Ireland. The chap-ter starts with a brief overview of the Ireland-US trade and investment situation.
Ireland’s trade and investment with the US For Ireland, trade and investment linkages to the US are especially important. In 2013, Ireland exported €18 billion worth of goods to the US, equivalent to 21% of total Irish ex-ports of goods, making the US the single largest market for Irish exports of goods.12 One quarter of foreign direct investment (FDI) in Ireland comes from the US and Ireland is the third largest recipient of US FDI (Quinlan, 2013). Irish exports to the US increased dramatically between 1996 and 2002 with annual growth rates in exports above 25% on average. Between 2003 and 2011, Irish exports to the US found a slower pace and grew at 3% per year on average. Ireland’s exports to the US dropped significantly in 2012 and only recovered slightly in 2013, cf. Figure 2.1.
Figure 2.1 Ireland’s trade in goods with U.S.
Note: Accessible data from CSO includes trade with both US and Canada. In 2013, Irish export to the US
was €18.4 billion and export to Canada was €0.8 billion and import from the US was €5.2 billion while
Canada only constitutes €0.3 billion.
Source: Copenhagen Economics based on data from Irish CSO.
12 Central Statistical Office (2013a).
Value of Imports
Value of Exports
0
5
10
15
20
25
1983 1985 1987 1989 1991 1993 1995 1997 1999 2001 2003 2005 2007 2009 2011 2013

TTIP impact in Ireland
14
In terms of value of exports chemicals and other products13 (including medicinal and pharmaceutical products), alone accounts nearly 70% of the total exports of goods to the US, cf. Figure 2.214 The impact of the TTIP on this sector will therefore be of crucial im-portance to Ireland.15
Figure 2.2 Irish exports to the US by main commodities, 2013
Note: Based on value of exports in euro.
Source: Copenhagen Economics based on data from Irish CSO.
Ireland is by far the EU Member State with the greatest dependence on the US as export market. When comparing the share accounted for by US export market in total extra-EU export of goods, Ireland is a clear number one with 49% of its extra-EU exports destined for the US. The average for EU28 is 16%, cf. Figure 2.3.
Figure 2.3 High dependency for Ireland on the US market, 2013 Share of extra-EU export destined for the US market
Note: Based on value of exports for total goods exports. Share of exports to the US relative to total extra-
EU export.
Source: Copenhagen Economics based on data from Eurostat.
13 Product classifications are based on ’The Standard International Trade Classification’. A description of this classification is
available at: http://unstats.un.org/unsd/cr/registry/regcst.asp?Cl=14 14 Eurostat. 2013. [EU27 trade since 1988 by SITC]. 15 In comparison, this sector accounts for roughly 23% of total EU27 exports to the US.
Chemicals,
pharma and
related products
Miscellaneous
manufactured
articles
Machinery
and transport
equipment
Beverages
and tobaccoOther goods
49%
16%
0%
10%
20%
30%
40%
50%
60%
IRE
UK
GER
DEN
BEL
AU
T
EU
28
FRA
ITA
SW
E
NL
PO
R
FIN
LU
X
CZE
HU
N
SLV
MLT
EST
SPA
PO
L
CYP
LIT
GR
E
RO
M
SLO
BU
L
LAT

TTIP impact in Ireland
15
The US is also a very important market for Irish service exports, accounting for just under €8 billion in 2012, equivalent to 9% of total Irish service exports, making it the third larg-est market, surpassed only by the UK (€17 billion) and Germany (€8 billion).16
Figure 2.4 Composition of Ireland’s bilateral exports to the US
Note: 2011 base year. Due to rounding of decimals, individual shares do not add to 100% exactly.
Source: Copenhagen Economics based on GTAP9 data
A key feature of the Irish economy is the role that multinational enterprises (MNEs) play. According to the Industrial Development Agency (IDA’s) annual report from 2012, IDA cli-ent companies account for a total employment of 152,000, increasing to almost 270,000 if
16 Central Statistical Office (2013b).
0,0%
0,0%
0,3%
0,4%
0,9%
1,0%
1,7%
2,8%
4,6%
30%
0,1%
0,1%
0,1%
0,2%
0,2%
0,2%
0,3%
0,3%
1,0%
1,6%
3,4%
10%
41%
Construction
Sea transport
Communication
Personal service
Other transport
Other services
Air transport
Finance
Business and ICT services
Insurance
Vehicles
Energy
Beef
Agri-food
Metals
Wood and paper
Other special goods
Dairy
Other man. goods
Processed food
Electric machinery
Other machinery
Pharma chemicals
% of total goods + services exports
Goods exports
Services exports

TTIP impact in Ireland
16
indirect employment generated by these companies is included (IDA, 2013). The US is the single most important source of foreign direct investments, whether measured in terms of employment or in terms of the total number of IDA enterprises. Companies from the US, alone accounted for 73% of total employment generated by IDA clients in 2012. MNE’s are also very important in terms of Irish exports. In 2012, IDA clients exported a total of €122 billion.17 Compared to total Irish exports of goods and services of €182 billion in the same year, this amounts to just over 67%.
Current trade barriers Tariffs and regulatory differences give rise to unnecessary burdens on exporters, which causes distortions in the exchange of goods and services. Reducing these barriers will pro-vide consumer gains and enhance trade and growth. Current barriers on EU-US trade are comprised of both tariffs and non-tariff barriers on goods and of barriers to service trade. We describe these in turn in the following. Tariffs
Import tariffs on manufactured goods are generally low in both the EU and the US. Tariff duties on imports from across the Atlantic average 2.2% in the US and 3.3% in the EU, cf. Box 2.1.
Box 2.1 Average tariffs on EU-US trade
Note: Ad valorem equivalents in percent, 2010.
Source: Cepii (2013).
Although tariffs are generally low, Irish exporters still pay in excess of $300 million per year in tariffs to the US Treasury. And there are significant tariff peaks on both sides.
17 IDA Ireland (2013).

TTIP impact in Ireland
17
On the US side, average tariff protection amounts to 1.7% for manufactured products, and 6.6% for agricultural products. Dairy products are seen as some of the most sensitive products in the US, and according to CEPII estimates, European dairy products face a 22% average tariff duty in the US (including 40% on yogurts and 33% for certain types of cheese). And dairy is a sector where European, and in particular Irish exporters, are often competitive. US tariff protection is also significant for a number of products such as ap-parel, knitted fabrics, and shoes, with sector averages close to or above 10%. Specific steel items are also significantly protected by tariffs in the US.18 Looking more specifically at the average tariffs based on the Irish composition of exports to the US we find a somewhat lower trade weighted average of 6.4% on dairy products, 1.9% on pharmaceuticals and chemicals on average, and 2.8% for manufactured metal products.19 On the EU side tariff protection is focused mainly on agricultural products with an aver-age 12.8% duty on US products, compared to 2.3% for manufactured products. The meat sector is the most sensitive, with average protection of 45% according to CEPII esti-mates.20 Again, protection is high on the European side in a sector where American pro-ducers are very competitive and accounted for nearly 20% of world exports. The bovine meat sector is particularly affected, with a 146% ad valorem equivalent duty on frozen edi-ble bovine offal, 97% on frozen boneless meat and 75% on fresh boneless meat according to CEPII (2013). In addition there are non-tariff issues (e.g. hormones) also affecting US export possibilities for meat.
Non-tariff barriers on goods (NTBs)
Non-tariff barriers (NTBs) arise because of differences in the regulation in the US and in the EU and its individual member states. In its purest form, NTBs come in the form of im-port bans, but this is exceptional. More frequently, NTBs arise because of regulatory dif-ferences which give rise to additional costs for exporters compared to domestic producers. Regulation in itself is not an NTB, and regulation of, for example, product safety stand-ards does not in itself hinder trade. Regulation usually serves legitimate purposes such as ensuring consumer information, improving health, product safety and preserving the environment amongst others. But differences in regulation may increase the cost of selling in foreign markets because of ad-ditional costs for exporters such as familiarisation costs, conformity assessment costs, certification costs and adaptation costs. Occasionally, regulation can imply the complete blocking of a specific product such that a product which is allowed on the domestic mar-ket is not allowed in the export market. The regulatory differences that gives rise to these additional costs for exporters stem from a number of sources including certification requirements, labelling and packaging re-quirements, product standards and traceability requirements. For goods these barriers
18 See CEPII (2013). 19 Based on GTAP 9 data for the year 2011. 20 See CEPII (2013).

TTIP impact in Ireland
18
are usually grouped as either Sanitary and Phyto-Sanitary (SPS) measures21 or Technical Barriers to Trade (TBTs).22 For the purpose of quantifying the impacts of NTB reductions following from TTIP we have to rely on quantitative estimates of the trade cost impact of such regulatory differ-ences. The Ecorys (2009) study was a concerted effort to quantify the likely cost impact of NTBs in the EU and the US and the cost estimates were obtained by triangulating:
● Firm surveys – including overall rankings and detailed barriers ● Industry, legal, regulatory experts ● Econometric models of trade flows
The study on transatlantic NTBs found that the impact of NTBs can be measured as a tar-iff equivalent (i.e. a cost impact of the observed regulatory differences), but also that the impacts differ widely from sector to sector and that the effect of NTBs differ from that of a tariff – NTBs are heavier burden than tariffs. On average, manufacturing goods from the EU meet US NTBs with a tariff equivalent impact of 22%, whereas US exports to the EU meet NTBs with a corresponding impact of 25%, cf. Box 2.2.
Box 2.2 Estimated cost impacts of NTBs in the EU and the US
Note: Averages are based on sector-by-sector results. NTB estimates are identical to those used in the EU-
wide study for the EU Commission as reported in CEPR (2013).
Source: Copenhagen Economics based on Ecorys (2009).
21 Sanitary and Phyto-Sanitary measures (SPS) include all relevant laws, decrees, regulations, requirements and proce-
dures. SPS measures can be applied to protect human, animal or plant life or health within the territory of a country from risks arising from plant pests (insects, bacteria, virus), additives, residues (of pesticides or veterinary drugs), contaminants (heavy metals), toxins or disease-causing organisms in foods, beverages or feedstuffs, and diseases carried by animals. The 'Sanitary and Phytosanitary Agreement' of the World Trade Organisation sets out the rules that WTO members are obliged to follow when they set SPS measures governing food and feed safety, animal health and plant health. The SPS Agreement applies to all SPS measures which may, directly or indirectly, affect international trade. Every WTO Member has the right to take SPS measures to protect the life and health of its human population, fauna and flora. What WTO rules require is that these measures are transparent, based on international standards and science-based, in proportion to the potential risk involved and are equally applied to national and imported products (no domestic and international discrimination).
22 Technical barriers to trade (TBT) refers to mandatory technical regulations and voluntary standards that define spe-cific characteristics that a product should have, such as its size, shape, design, labelling / marking / packaging, functionality or performance. The specific procedures used to check whether a product is in compliance with these requirements are also covered by the definition of TBT. These so-called "conformity assessment procedures" can include, for example, product testing, inspection and certification activities. The objective of the World Trade Organisation's Agreement on Technical Bar-riers to Trade as a preventive instrument is to ensure that such measures do not result in discrimination or arbitrary re-strictions on international trade. The Agreement does not in any way undermine the right of governments to take measures to pursue legitimate public policy objectives, such as the ones mentioned above; it simply aims to ensure that such measures are prepared, adopted and applied according to some basic principles, in order to minimise the negative impact on trade.

TTIP impact in Ireland
19
The cost impacts of NTBs vary sector by sector, and NTBs in the US are substantial on some of Ireland’s key export sectors. For the US food and beverage sector, the CEPR (2013) study estimated a 73% tariff equivalent. The US pharma-chemicals sector was esti-mated to have a 19% impact of NTBs while the electrical machinery sector in the US was found to have NTB impact of 15%, cf. Box 2.3.
Box 2.3 Cost impacts of NTBs for selected sectors in the US
Note: Averages are based on sector-by-sector results. NTB estimates are identical to those used in the EU-
wide study for the EU Commission as reported in CEPR (2013).
Source: Copenhagen Economics based on Ecorys (2009).
Not all NTBs on goods can actually be negotiated and reduced. For example, US electrical appliances run on 110 volts whereas European ones run on 220 volts, and no one expects TTIP to change that. However, there are other differences related to such products where solutions could be found to reduce the costs of exporting without jeopardising the legiti-mate objectives of the regulation in place. This concept is called actionability, and the ob-jective of TTIP in the area of NTBs is to achieve greater regulatory compatibility, without compromising the existing levels of protection. Current differences in regulation and the actionability define scope for the NTB negotiations. On average, it is assumed that a quar-ter of the cost impact of NTBs can be reduced through TTIP.
Barriers on cross-border trade in services
Services do not face tariffs, but still, cross border service trade is being held back by non-tariff barriers in the services sectors. Much like the NTBs on goods it is regulatory differ-ences that give rise to hindrances to trade. The impact of these regulatory differences on cross border flows of services has also been estimated in the Ecorys (2009) study. Again the concept of a “tariff equivalent” impact is used to quantify the likely impact of service barriers. Service barriers ranges from 2% in air transport to 32% in financial services in the US, cf. Box 2.4.

TTIP impact in Ireland
20
Box 2.4 Service barrier estimates in the EU and US
Note: Expressed in tariff equivalents. Estimates are based on econometric modelling of current account
flows for services. This study applies the same barrier estimates as were used in CEPR (2013).
Source: Copenhagen Economics based on Ecorys (2009).
Again, not all service barriers can actually be negotiated away, and some friction to inter-national trade in services will remain across the Atlantic even after a successful imple-mentation of TTIP. Like for goods, the objective is to find solutions to reduce the costs of exporting services between the two economies without jeopardising the legitimate objec-tives of the regulation in place, and TTIP aims to reduce the frictions to trade in services, without compromising the existing levels of regulation. We note in particular, that US ser-vice trade barriers are high in insurance services – a sector where Ireland has large ser-vice exports to the US.
TTIP and SMEs The European Commission propose having a dedicated Chapter to small and medium sized-enterprises (SMEs) in the TTIP.23 According to the Commission’s own definition “the category of micro, small and medium-sized enterprises (SMEs) is made up of enter-prises which employ fewer than 250 persons and which have an annual turnover not ex-ceeding EUR 50 million, and/or an annual balance sheet total not exceeding EUR 43 mil-lion”.24 NTBs imply both upfront fixed costs of selling in a foreign market and on-going variable costs of exporting to that market. Because of the fixed cost element (e.g. related to con-formity assessment of an export product) NTBs generally place a heavier burden on small and medium sized enterprises (SMEs) than on large multinational enterprises (MNEs). This in turn affects firms’ probability to export, the value it exports and its export prices. An implication of this is that changes to exporting behaviour may well differ across firm sizes. Because large firms are able to cover the high pre-TTIP fixed costs by exporting large volumes, their response will be on the intensive margin - that is on export volumes. For smaller firms, known as SMEs, however, exporting only becomes viable post–TTIP, assuming that the agreement lowers fixed exporting costs. As such, their behaviour will 23 EU Commission, Directorate-General for Trade, News Archive 14 March, 2014
http://trade.ec.europa.eu/doclib/press/index.cfm?id=1041 24 Commission recommendation 6 May 2003.
http://eur-lex.europa.eu/LexUriServ/LexUriServ.do?uri=OJ:L:2003:124:0036:0041:EN:PDF

TTIP impact in Ireland
21
change both on the extensive (the decision of whether or not to export at all) and inten-sive margins. Because of this, there is reason to believe that TTIP presents a particularly attractive op-portunity for SMEs. In a recent survey of German firms, Felbermayr and Larch (2013) found that whereas less than 20 percent of large firms anticipated benefitting from a re-duction in non-tariff barriers via TTIP, more than 40 per cent of SMEs hoped to gain. Similar views have been expressed by other firms on both sides of the Atlantic and a re-cent publication by the European Commission from 2014 illustrates some examples.25 Furthermore, this anecdotal evidence is buttressed by the results of Fontagné, Orefice, Piermartini, and Rocha (2013) who examined the impact of SPS regulations on French agricultural exports, finding that SME export levels are much more sensitive to such trade barriers than are those by larger firms – as much as 50 times more sensitive. Thus, there are legitimate reasons to expect that SMEs will capture a large share of TTIP’s benefits both as they begin exporting and as they increase their trade volumes. Recognizing this is important because SMEs represent a considerable share of the economy. The European Commission (2014) reports that SMEs accounted for 85% of European job growth during 2002-2010. In addition, exporting has significant effects on productivity growth. McCann (2009) finds that when Irish firms begin exporting, this results in a sig-nificant increase in their productivity. Girma, Görg, and Hanley (2008) find that export-ing leads to increased research and development by Irish firms, a fact that may help to ex-plain McCann’s results. Therefore, because TTIP may well have particularly important impacts on SMEs, a trans-atlantic agreement has the potential for significant effects on employment and growth in the Irish context. Section 7.1 offers further analyses of the impact of TTIP on different firm types, including foreign-owned, indigenous Irish firms as well as different firm sizes.
Main Scenario Based on the current levels of trade barriers on both sides of the Atlantic, as described above, we analyse the impact of TTIP in a scenario of trade liberalisation emulating the expected outcome of the TTIP negotiations. However, it should be noted that it is very difficult to predict the outcome of such complex negotiations - both when it comes to the specific details of liberalisation of quotas in sen-sitive agriculture sectors, reductions of the so-called non-tariff barriers on goods and for barriers to trade in services. To ensure consistency with previous studies and comparabil-ity with the EU-wide study, we apply the same trade liberalisation scenario as in CEPR (2013) as described in Box 2.5.
25 See the publication by the European Commission from 2014 entitled “Transatlantic Trade and Investment Partnership -
The opportunities for small and medium-sized enterprises”. Available on DG Trade’s website: http://trade.ec.europa.eu/do-clib/html/152266.htm

TTIP impact in Ireland
22
Box 2.5 Main scenario: Liberalisation of transatlantic trade The main scenario includes
• Tariffs reduced to zero
- Except for agriculture and food products where only a 50% tariff cut is assumed • NTBs for goods reduced as in CEPR (2013)
- Half of actionable NTBs, i.e. 25% of the total friction caused by NTBs is re-moved
• Service barriers reduced as in CEPR (2013)
- Half of actionable NTBs, i.e. 25% of the total friction caused by NTBs is re-moved
• Spillovers of NTBs as in CEPR (2013)
- Direct spillovers are modeled at 10 to 20% of direct NTB reductions. - Indirect spillovers are modeled as half of the direct spillover reductions, and this
gives European exporters better market access to other markets outside the EU and US as well.
Note: See CEPR (2013) for further details on the scenario. ‘Spillovers’ (direct) refer to the fact that a part of
the NTB reductions are assumed to spill over to third countries (i.e. trading partners outside the EU
and the US) such that third country exporters will also experience better market access to both the EU
and US as a result of TTIP, since the changes brought about by TTIP will also lower the costs of access
for third country exporters. ‘Indirect spillovers’ capture the idea that third countries to a certain de-
gree are expected to converge parts of their regulatory processes to the emerging transatlantic regu-
lation.
Source: Copenhagen Economics.
Variants of the main scenario are analysed for key agriculture sectors. We have simulated a range of experiments which are variants of the main scenario with different degrees of quota liberalisation for beef.
Overview of macro results When assessing the economic implications of TTIP for Ireland, it must first be noted that TTIP will not only boost US-Ireland trade, but also trade between the US and all other EU members as well as third countries. TTIP will boost the transatlantic economy by €90 billion and €120 billion in US and EU respectively (CEPR, 2013). TTIP will realise an untapped potential for more trade across the Atlantic and as found in the EU-wide study, TTIP will have limited trade diversion ef-fects and trade with third countries is estimated to go up as result of TTIP. So TTIP will change how Irish firms trade with the US, but TTIP will also impact on Ire-land’s trade with rest of EU and its trade with the rest of the world. Taking all these complex interactions into account, we find that TTIP will have an overall very positive impact on the Irish economy if it had been implemented today. However, TTIP will take time to implement and by the time of its full effect, the world will have changed in a number of ways. Our projections of the impacts of TTIP in Ireland indicate that structural changes in the global economy (i.e. changes in sector composition and

TTIP impact in Ireland
23
trade patterns) will work to Ireland’s advantage and TTIP will have even greater impact in the future than in the current situation. Using the current situation as the baseline, we predict Irish GDP to increase by 1.1% com-pared to what it would have been in the absence of TTIP. Overall exports from Ireland to the world is predicted at a level of around 3.8% above what it would otherwise be, and likewise for imports where the increase is estimated at 4.3%. Real wages will improve for all skill groups and on average the real wage for the Irish workers will improve by 1.5% relative to the situation without TTIP. Finally, investment in Ireland is predicted to in-crease to a level 1.5% above what it would have been without the agreement, cf. Figure 2.5. Projecting the world economy to a likely 2030-baseline, and re-applying the same sce-nario of transatlantic trade liberalisation, we predict even greater impacts on Ireland’s economy. Naturally these estimates are subject to uncertainty, but the direction of the re-sults are reassuring, as it underlines that the structural change that can be foreseen will further enhance the expected benefits on all macro indicators.
Figure 2.5 Macro-results in main scenario Percentage change from baseline
Note: Results from experiment 1 based on 2011-baseline and projected 2030-baseline.
Source: Copenhagen Economics based on CGE-simulations by prof. J. F. Francois 2014
Impact on GDP and national income We predict that TTIP would have increased Ireland’s GDP by 1.1% had it been imple-mented today. Using Ireland’s GDP at current market prices for 2013 of €175 billion as the base, the increase corresponds to an uplift of €2 billion to Ireland’s GDP.
1,1%
3,8%
4,3%
1,5% 1,5%1,5%
5,0%
5,4%
1,9% 1,9%
0,0%
1,0%
2,0%
3,0%
4,0%
5,0%
6,0%
GDP Exports Imports Real wages Investment
Current baseline Projected baseline

TTIP impact in Ireland
24
Tariff reductions and NTB reductions for goods are the main sources of the GDP gain of 1.1%, cf. Figure 2.6. GDP is referred to here because it is a concept that will be more famil-iar to the reader. GDP is the value of a fixed basket of final goods and services produced by the economy.
Figure 2.6 GDP change decomposed by source of gain
Note: The graph shows that tariff liberalisation is accountable for 0.4 percentage-points and the reduction of
NTBs for goods accounts for 0.5 percentage-points of the 1.1% estimated increase. NTBs reductions in
services and the assumed spillover liberalisation to third countries is predicted to deliver the remaining
part of the total change in GDP of 1.1%.
Source: Copenhagen Economics based on CGE-simulations by prof. J. F. Francois 2014
Real national income is a different measure than GDP and is a measure of the actual pur-chasing power available for final consumption, given changes in both output and prices. Real national income better captures shifts in the economy toward a more efficient basket of goods and services, as well as changes in final consumption prices. Usually these two measures track each other closely. According to our simulations, real national income in Ireland is predicted to increase by €2.4 billion as a result of TTIP.26
Impact on output in Ireland by main sectors Measured in terms of output (gross value added) in Ireland, we predict that the impact will be found overwhelmingly in the manufacturing sector, and that there will be limited impacts in the agriculture and food sector and for the output of the services sectors.
26 The estimate is converted from 2011-baseline in USD using an average exchange rate USD/EUR of 1.40.
0.45%
0.48%
0.12%0.07%
GDP change
Spill-
overs
NTBsservices
NTBs
goods
Tariffs
Total GDP change
1.1%

TTIP impact in Ireland
25
Figure 2.7 Change in output by main sector in Ireland
Note: Estimate based on Ireland’s gross value added in 2013 of €158 billion according to CSO (factor cost).
Source: Copenhagen Economics based on CGE-simulations by prof. J. F. Francois 2014.
There are however nuances underlying this overall picture. As the subsequent chapters will show, much of the output change in manufacturing is driven by the electronics indus-try in Ireland and the pharma-chemical industry. Within the services sector we find an ex-pansion of insurance services and a contraction in other parts of the services industry. The result is based on the assumptions made in the model about fixed labour supply and does not include the impact of possible mitigating policy actions. If the Irish labour mar-ket flexibility continues to be high or even increase and/or if migration will continue to increase labour supply, then there will be fewer constraints on the labour supply side, and some of the potential contractions in certain sectors resulting from TTIP can be avoided or significantly reduced. Constraints on labour supply have historically not been evident in the Irish economy and some of the constraints on the labour market can be reduced as the Irish Authorities responds efficiently to changes in demand for skills and labour.
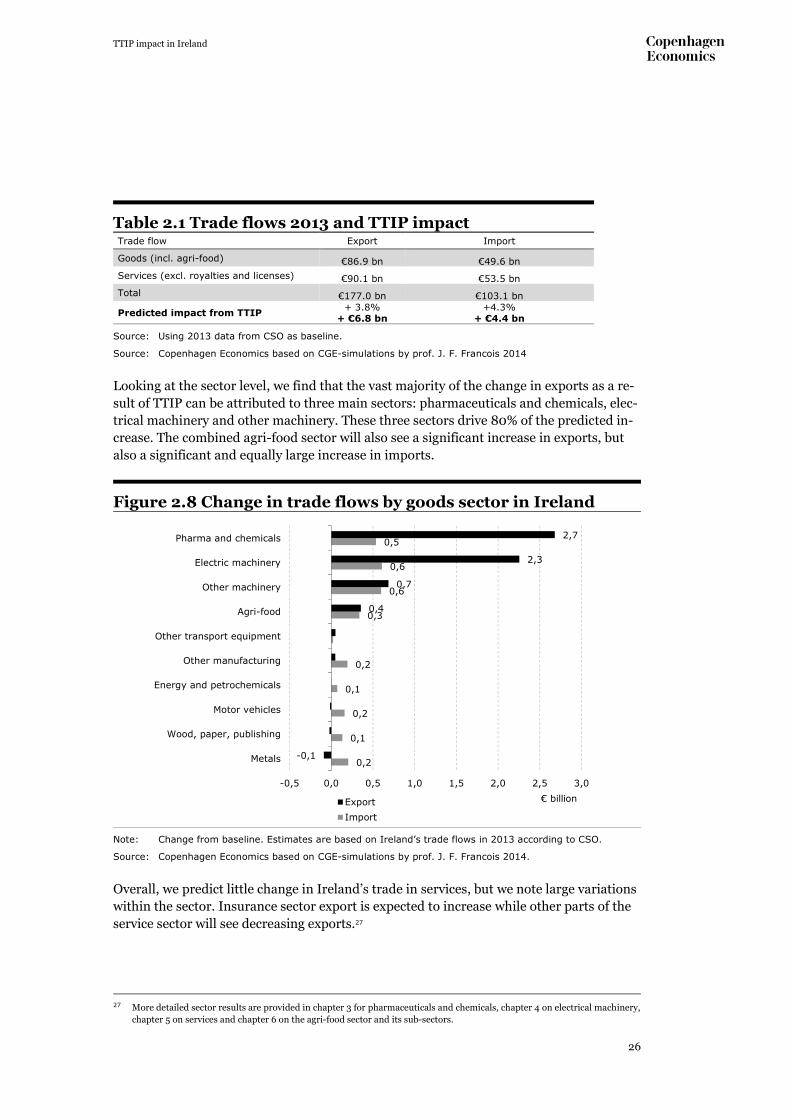
Impacts on trade flows We predict that TTIP will increase the value of Ireland’s total exports by 3.8% and that Ireland’s total imports will increase by 4.3% above what it would be without TTIP in place. Translating those estimates to the current situation (2013), the increase in the value of ex-ports corresponds to an additional €6.8 billion and an increase in imports of €4.4 billion, cf. Table 2.1, and thus an improvement of the trade surplus of €2.4 billion.
-23
1.376
-105 -400
100
600
1.100
1.600
Agriculture and food Manufacturing Service
Change in output€ millions
TTIP impact in Ireland
26
Table 2.1 Trade flows 2013 and TTIP impact Trade flow Export Import
Goods (incl. agri-food) €86.9 bn €49.6 bn
Services (excl. royalties and licenses) €90.1 bn €53.5 bn
Total €177.0 bn €103.1 bn
Predicted impact from TTIP + 3.8%
+ €6.8 bn +4.3%
+ €4.4 bn
Source: Using 2013 data from CSO as baseline.
Source: Copenhagen Economics based on CGE-simulations by prof. J. F. Francois 2014
Looking at the sector level, we find that the vast majority of the change in exports as a re-sult of TTIP can be attributed to three main sectors: pharmaceuticals and chemicals, elec-trical machinery and other machinery. These three sectors drive 80% of the predicted in-crease. The combined agri-food sector will also see a significant increase in exports, but also a significant and equally large increase in imports.
Figure 2.8 Change in trade flows by goods sector in Ireland
Note: Change from baseline. Estimates are based on Ireland’s trade flows in 2013 according to CSO.
Source: Copenhagen Economics based on CGE-simulations by prof. J. F. Francois 2014.
Overall, we predict little change in Ireland’s trade in services, but we note large variations within the sector. Insurance sector export is expected to increase while other parts of the service sector will see decreasing exports.27
27 More detailed sector results are provided in chapter 3 for pharmaceuticals and chemicals, chapter 4 on electrical machinery,
chapter 5 on services and chapter 6 on the agri-food sector and its sub-sectors.
0,2
0,1
0,2
0,1
0,2
0,3
0,6
0,6
0,5
-0,1
0,4
0,7
2,3
2,7
-0,5 0,0 0,5 1,0 1,5 2,0 2,5 3,0
Metals
Wood, paper, publishing
Motor vehicles
Energy and petrochemicals
Other manufacturing
Other transport equipment
Agri-food
Other machinery
Electric machinery
Pharma and chemicals
€ billionExport
Import

TTIP impact in Ireland
27
Impacts on wages and employment It is generally perceived by economists that free trade agreements do not influence the level of employment in the economy in the long term, which is determined by structural factors. Free trade agreements though have an effect on real wages because the most pro-ductive industries grow and because consumer prices decline. At the sector level employment effects occur due to the reallocation of labour away from contracting sectors towards expanding sectors. The change in labour demand across sec-tors will give rise to initial wage differences, which will incentivise workers to reallocate across sectors, until an equilibrium is reached where wages are again equalized across sectors. At the aggregate level we instead assume a fixed long-run labour supply. Under this as-sumption, any changes in aggregate labour demand will be captured through wage changes instead of changes to employment levels, which only occur at the sector-level due to reallocation effects. Similarly, as wages will equalize across sectors in equilibrium, wage effects only occur at the aggregate level in the model. Immediately below, we discuss the latter effects and present employment effects at the sector-level in subsequent chap-ters.
Real wage will improve across all skill groups
Our simulations show that real wages will improve for all skill groups in the economy and that the improvement will be slightly more pronounced for low skilled labour (+1.9%) than for high skilled (1.2%), cf. Table 2.2.
Table 2.2 Predicted changes in real wages Skill group Pct.-change in real wage from baseline
Low skill and agricultural 1,9%
Medium skill 1,3%
High skill 1,2%
Source: Copenhagen Economics based on CGE-simulations by prof. J. F. Francois 2014
More export-related jobs in Ireland
Our simulations show how trade and output in the Irish economy can be expected to ad-just to the new market situation following the TTIP. If we instead assume constant wages, the related effect on aggregate employment levels can be assessed. Such an effect should only be interpreted as a short-term effect and considered as the increase in jobs related to exports. In order to estimate the expected increase in export related jobs we examine the relation-ship between exports and employment. The European Commission (2012) calculated the number of jobs in each EU member state, which is supported by exports of goods and ser-vices to markets outside the EU based on data from 2000-2007. The estimate includes jobs that are directly related to firms export activities as well as jobs that are indirectly re-lated to exports activities (i.e. jobs at the suppliers to the exporters and services to export-ing companies).
TTIP impact in Ireland
28
The calculations show that for each one million euro worth of exports going to markets outside the EU around five jobs are supported in Ireland. Using this estimate and adjust-ing for price and productivity development as well as the fact that most of the growth in exports is expected in sectors with a relatively low level of labour intensity we calculate the employment effects. Based on our simulations we predict an increase in total exports of 3.8%. Given exports from Ireland totalling €176 billion in 2013 an increase in exports of 3.8% would corre-spond to somewhere between 5,000 to 10,000 additional export-related jobs in Ireland.
Main sectors of opportunities for Ireland Although the TTIP will present opportunities for sectors and all types of export-oriented firms, the main sectors where Ireland should pursue gains from TTIP are:
• Pharmaceuticals and chemicals • Electrical machinery • Other machinery • Agri-food (notably dairy and processed food) • Insurance
Main sectors where Ireland should prepare for
adjustments TTIP will require adjustments and timely preparation in all sectors and for all types of firms being exposed to international competition and to take advantage of new export, trade and investment opportunities. Depending on the actual outcome of the TTIP negotiations with respect to relaxation of quotas for US beef into the European market, and depending on the degree of change to other regulatory barriers in the beef sector, Ireland’s beef producers should prepare for increased competition from cost efficient US beef producers in the European market.
TTIP impact in Ireland
29
Chapter 3
Pharmaceuticals and chemicals
Introduction to the sector in Ireland The industry comprises both the pharmaceutical and the chemical industries, with the pharmaceutical industry being much larger than the chemical industry in terms of both employment (91% of total) and value added (86% of total).28 The sector produces 11.7% of the output in the Irish economy measured by gross value added. The sector employs roughly 32,900 people – i.e. about 1.8% of total employment in Ireland - demonstrating that the sector is highly productive in terms of output per worker.29 The historic development of the sector in Ireland is based on foreign direct investment (FDI), and the sector is still dominated by foreign direct investment, with foreign compa-nies employing 71% of total workers and accounting for 96% of exports. Moreover, 14 of the 15 largest pharmaceutical companies in the world have facilities in Ireland. The facilities are concentrated in manufacturing but also include some research and development, especially later-stage process R&D.30 Early-stage development is mostly undertaken outside Ireland. In recent years, the pharmaceutical sector in Ireland has grown in launch activities and the sector is seeing growth in R&D expenditure, suggesting that the Irish pharmaceutical sector continues to move further up the value chain. Due to the sector’s reliance on FDI and the large share of foreign-owned firms, a signifi-cant part of the value created in the sector is not captured in Ireland. Payments of royal-ties and licence fees and payments for business services combined with substantial divi-dend payments to parent companies abroad mean that not all the value that appears to be created in Ireland is captured here. Decomposing the value added in exports into labour and capital shares show that 86% of value added is due to capital. This reflects the im-portance of licenses, royalties and other payments to parent companies in the sector.31 Ac-cordingly, changes caused by TTIP in this sector will only partially accrue to the Irish-owned part of the economy.
The current trade patterns The pharmaceutical and chemical sector is the largest export sector in Ireland with ex-ports of goods worth €50 billion in 2013. This amounted to 30% of total exports from Ire-land.
28 Copenhagen Economics bases on CSO data 29 Based on data from 2012 30 Van Egeraat and Barry (2009) – The Irish Pharmaceutical Industry over the Boom Period and Beyond 31 Copenhagen Economics based on data from Professor J.F. Francois 2014.

TTIP impact in Ireland
30
Exports from the Irish pharmaceutical and chemical industries doubled between 2000 and 2011, but since 2011 exports have dropped by about 10%, cf. Figure 3.1. One reason for the decline is the expiration of patents on drugs. Of the ten blockbuster drugs (drugs with annual sales above $1 billion) being produced in Ireland, six ran out of patent be-tween 2011 and 2013. The so-called ‘patent cliff’ poses challenges to the pharmaceutical industry because of the patent expirations in these years. This is discussed further in sec-tion 3.5.
Figure 3.1 Irish pharma-chemicals exports 2000-2013
Source: Copenhagen Economics based on CSO data
The EU market is Ireland’s largest market for pharmaceuticals and chemicals, receiving 55% of the sector’s total exports and being the origin of 54% of imports. The US is the sec-ond largest market for pharma-chem with 29% of pharma-chem exports going to the US; the remaining 16% was exported to the rest of the world in 2013, cf. Figure 3.2.
Pharmaceutical and
chemical products
Share of total
exports
30%
40%
50%
60%
70%
20
30
40
50
60
2000 2001 2002 2003 2004 2005 2006 2007 2008 2009 2010 2011 2012 2013
Share of total
exportsBillion euro

TTIP impact in Ireland
31
Figure 3.2 Main trade partners in pharmaceuticals and chemi-
cals
Note: The figure is based on the sectoral distribution from the GTAP data for 2011 applied to the total exports
of goods from Ireland in 2013.
Source: Copenhagen Economics based on CSO data and GTAP data.
A large share of the exports comes from the largest companies in the sector. Exports from the 15 largest pharmaceutical companies in Ireland account for approximately 44% of pharmaceutical and chemical product exports (based on 2008 data).32 Naturally, changes to the export volume of these foreign-owned companies will have an impact on the sector.
Reduction in barriers to transatlantic trade in the sector As estimated by Ecorys (2009), the non-tariff barriers (NTBs) in the pharmaceutical and chemical industries correspond to additional trade costs of 19% for exports from the EU to the US and 14% for exports from the US to the EU. In comparison, average US tariffs for Irish imports to the US in the sector are a mere 1.9%. As tariffs in the pharmaceutical and chemical industry are low, the impact of the TTIP on the sector is largely dependent on the reduction in non-tariff barriers.
For pharmaceuticals the main non-tariff barriers are related to:
1. Authorisation of drugs 2. Recognition of good manufacturing practices inspections.
According to the EU position paper on pharmaceutical products, reducing non-tariff bar-riers for pharmaceuticals would involve allowing exchange of confidential information be-tween EU member states/EU institutions and the US Food and Drug Administration, har-monising requirements for the authorisation of biosimilars, collaborating on generics au-
32 Copenhagen Economics analysis of data from CSO and Irish Exporters Association (2011).
EU
EU
Rest of world
Rest of world
United States
United States
0
5
10
15
20
25
30
35
40
45
50
Exports Imports
€ billions

TTIP impact in Ireland
32
thorisation systems, revising requirements for paediatrics authorisation, harmonising ter-minology for pharmaceutical products and further bilateral cooperation on joint assess-ment approaches. Working towards mutual recognition of good manufacturing practice inspections would further reduce non-tariff barriers by allowing for better use of inspection resources, as the overlap of inspections in the EU, the US and third countries could be reduced. Current collaboration on good manufacturing practice inspections is based on bilateral ties be-tween national regulators in EU member states and the United States. And while Ireland, due to the significant presence of US companies in Ireland, already has ties with the FDA, improving the collaboration could bring significant cost savings to the industry. For chemicals, the main trade barriers are also non-tariff barriers. Improvements to current procedures and legislation which would reduce these barriers include improved co-operation on prioritising chemicals for assessment and assessment methodologies, promoting increased alignment in the classification and labelling of chemicals, further co-operation on new and emerging issues and enhanced information sharing and protection of confidential business information. 33
A reduction in these barriers will mainly arise from increased collaboration between regu-latory agencies. Taking the necessary steps to improve collaboration and reduce non-tariff barriers is a long-term process, including inter alia: • working towards mutual recognition of inspections of Good Manufacturing Practices • harmonising requirements for the authorisation of biosimilars • revising requirements for paediatrics authorisation • harmonising terminology for pharmaceutical products • ensuring the right level of resources at regulatory agencies on each side of the Atlantic
Expected impact in the sector The estimated impact of the TTIP on the Irish pharmaceutical and chemical industry is a rise in exports of 3.7% corresponding to an increase in exports from the sector of €1.8 bil-lion based on 2013 numbers. Meanwhile imports are expected to increase approximately €400 million. The increase in output is estimated at 2.1%. Almost half of the total increase in output in Ireland is due to the increased output in the pharmaceutical and chemical industry. The increase in the sector’s exports is driven by a large increase in exports to the US, which is estimated to increase by 36%, while our simulations predicting a decline in ex-ports to the rest of the EU (of -4.8%) and to the rest of the world. 90% of the gains can be attributed to the reduction in non-tariff barriers, with the value of the isolated effect of reducing non-tariff barriers on goods estimated to be €1.8 billion.
33 Based on EU position papers on pharmaceutical and chemical products.

TTIP impact in Ireland
33
As the sector expands, employment in the sector is expected to increase due reallocation effects (cf. Section 2.9 for a discussion of sectoral employment effects). Our simulations predict increases in employment across all skill groups in the industry following TTIP. The largest effect is expected for highly skilled workers with an increase in employment of 1.2%, cf. Table 3.1.
Table 3.1 Impacts in pharmaceutical and chemical industry Output Exports Imports
Output and trade effects +2.1% +3.7% +4.4%
Low skill Middle skill High skill
Employment effects +0.4% +1.1% +1.2%
Source: Copenhagen Economics based on CGE-simulations by Prof. J. F. Francois 2014
There are many factors affecting firms operating in the pharmaceutical and chemical in-dustry, which the TTIP does not influence. One of these is the so-called patent cliff.34 We discuss the patent cliff in more detail in the following section.
Expiration of Patents in Pharmaceutical Sector In the period 2011-2016, the pharmaceutical sector is facing the challenge of patent expi-rations of blockbuster drugs (drugs with annual sales above $1 billion). This naturally af-fects the sales and profitability of pharmaceutical companies. With Ireland’s importance as a location for development and manufacturing, the patent expirations will also affect the sales and exports of the pharmaceutical industry in Ireland. In fact, Irish manufactur-ing plants are involved in the production of at least six blockbuster drugs that came off patent in 2011 and 2012 and, as Figure 3.1 shows, this has already impacted exports, which declined around 10% between 2011 and 2013. Meanwhile, patent lapses are affecting pharmaceutical companies globally and pharma-ceutical companies are facing the challenge of developing new drugs in order to keep prof-itability high.
TTIP has no effect on the so-called patent cliff in itself, and the isolated impact of the TTIP is expected to be positive for the pharmaceutical industry in Ireland. Based on the long-term projections of the world economy in 2030 simulation suggests an increase in output and exports of 1.3% and 3.0% respectively.
Expected impacts for foreign direct investment Foreign direct investment (FDI) has historically been the main driver of development in the pharmaceutical industry in Ireland and continues to be a main factor as the industry
34 The term “Patent Cliff” is the popular reference to the fact that many of the largest blockbuster drugs face patent expiration
in the period between 2011 and 2016.

TTIP impact in Ireland
34
in Ireland moves up the value chain. The largest companies in the industry are multina-tionals who have located facilities in Ireland, with by far the largest share of FDI in the sector coming from the United States. As the CGE model does not consider location effects, such as why foreign investors chose Ireland, the simulated impact of the TTIP may be an overestimate if a reduction in non-tariff barriers reduces the attractiveness of Ireland as a destination for FDI in the phar-maceuticals and chemicals sector. With almost 33,000 people employed in the sector in Ireland, a highly skilled workforce and a strong infrastructure for developing high skilled workers from universities, foreign companies can tap into a vast talent pool, which makes Ireland seem an attractive destination for FDI also following TTIP. A slight risk to the attractiveness of Ireland as a destination for FDI is related to the cen-tralisation of approval procedures. An elimination of the fast track for approval of bio-similars and medical devices could lead to a decline in the incentive for companies to do an early launch in Europe and use Ireland as the launch pad. While the effect is uncertain, there is a slight risk that further harmonisation of approval procedures may obstruct this way of operating for US pharmaceutical (and medical device) companies and reduce the incentives to invest in Ireland. This may pose a threat to some advantages currently in place for the Irish pharmaceuticals and chemicals industries as a regulatory advantage is lessened and could when looked at in isolation pull in the direction of less FDI. Looking at the exports of US firms shows that most trade is intra-firm trade related to the supply chain. This is true for both US firms in Ireland exporting to Europe and US firms exporting back to the US. In fact, for US firms exporting back to the US almost 90% is in-tra-firm trade. 35 Generally, most evidence suggests that easier linkages from parent to subsidiary make both more profitable. This, combined with strong competencies in the form of skilled workers, which are not easily moveable, would suggest that the risk of relo-cation is low. Overall, the pharmaceutical and chemical industries in Ireland hold strong competencies in manufacturing and developing drugs with a lot of value tied to skilled workers that are not easily moveable. Moreover, the TTIP is likely to strengthen the ties between parent companies abroad and subsidiaries in Ireland, so while there may exist some risk factors for reduced FDI, we consider it unlikely that future FDI in the pharmaceutical sector will be lower than otherwise following TTIP.
35 American Chamber of Commerce (2013) – The Irish-US Economic Relationship (2013),

TTIP impact in Ireland
35
Chapter 4
Electronic equipment
Introduction to the sector in Ireland The development of the electronics industry in Ireland has been fuelled by large invest-ment from foreign companies mostly from the United States. Most of the large US multi-nationals in the sector have located manufacturing as well as R&D facilities in Ireland.36 The sector is exporting a wide range of mostly high-technology products (for example computers and laptops, mobile phones, tablets and other such devices) and supplies ap-proximately 20% of Western Europe’s demand for electronics equipment.37 The sector employs roughly 26,000 people or about 1.4% of the total workers employed in Ireland. Approximately 83% of these are employed in foreign owned companies demon-strating the importance of foreign direct investment to the sector (see chapter 7). The Irish economy has become increasingly globalised and the electronics sector is heav-ily reliant on imported inputs and imported intermediate inputs makes up a large share of total cost. Therefore, trade liberalisation has a double-effect on the electronics sector in Ireland, providing benefits both through better access to the export markets, and cheaper inputs for further processing and assembly in Ireland. Foreign value added accounts for 54% of total value added in the sector’s exports compared to 40% in the EU. 38 In consequence, gross export values do not only reflect the value generated in Ireland, but also the value generated during the production of intermediate inputs in other countries, but recorded in Ireland’s gross export values of electronics that are characterised by an international value chain. This indicates that a significant share of the value of electronics exports from Ireland is captured outside Ireland.
The current trade patterns The electronics sector in Ireland as represented in our simulations consists of a range of similar products, which can be categorised as the electronics sector. In the Irish trade sta-tistics these products are represented in various product groups including office machines and automatic data processing machines, telecommunications, electrical machinery as well as professional, scientific and controlling apparatus.39 In 2013 Irish exports from the electronics sector were approximately €13 billion. The EU is the largest export market for Irish produced electronics equipment receiving 65% of total exports with the UK receiving 18% of exports alone. The US receives only 6%
36 American Chamber of Commerce (2013) – The Irish-US Economic Relationship (2013). 37 Enterprise Ireland fact sheet on electronics - http://www.enterprise-ireland.com/en/Source-a-Product-or-Service-from-
Ireland/Sector-and-Company-Directories/Electronics-Sector-Profile.pdf. 38 Copenhagen Economics based on data provided by Professor J. F. Francois 2014. 39 The SITC codes of these product groups include 75, 76, 77, 87, 88 and 89.

TTIP impact in Ireland
36
of exports with the remaining 30% being exported to the rest of the world in 2013.40 In comparison imports of electronics to Ireland were approximately €8 billion in 2013. While exports are mostly sent to the EU, imports are for a large part sourced from coun-tries outside the EU, with imports from outside the TTIP area accounting for approxi-mately 50% of total imports, cf. Figure 4.1.
Figure 4.1 Trade partners in electronics
Note: The figure is based on the sectoral distribution from the GTAP data for 2011 applied to the total ex-
ports of goods from Ireland in 2013.
Source: Copenhagen Economics based on data from CSO and GTAP data.
In recent years exports from the electronics sector has been challenged by increasing at-tractiveness of outsourcing of production to third countries. This is seen in the develop-ment of Irish exports which has declined significantly since around 2000, cf. Figure 4.2. The electronics companies, though, are increasingly exporting services as a facilitator of ICT and business process technology exports.41 The links between electronics and ICT services will be discussed further in section 4.5 below.
40 Copenhagen Economics based on data provided by Professor J. F. Francois 2014. Due to rounding of decimals, percentages
do not sum to 100% exactly. 41 Irish Exporters Association (2011), Trends in ICT exports are discussed in more detail in chapter 5.
EU (excl. UK)
EU (excl. UK)
United Kingdom
United Kingdom
United States
United States
Rest of World
Rest of World
0%
10%
20%
30%
40%
50%
60%
70%
80%
90%
100%
Exports Imports

TTIP impact in Ireland
37
Figure 4.2 Development in electronics exports from Ireland
Note: The table includes SITC codes 75, 76 and 77 and hence does not include all product groups in the
GTAP data.
Source: Copenhagen Economics based on data from CSO, table TSA06.
Reduction of barriers to transatlantic trade in the sector Non-tariff barriers exist in the electronics equipment industry. The total trade costs re-lated to NTBs is estimated at 14.7% according to the CEPR and arise due to differences in technical standards of products, safety provisions, differing rules on recycling and envi-ronmental protection, US-state and EU member state safety and power supply certifica-tions, as well as third party testing requirements and differences in IPR systems. Meanwhile tariff barriers in the sector are low, since most of the products in the sector are already duty free as a result of the Information Technology Agreement (ITA) from 1996.42 Average trade weighted US tariffs against Ireland are 0.14% while average trade weighted tariffs against the US are slightly higher at 0.56%. This suggests that the elimination of tariff barriers in this sector alone are not expected to drive a large impact on trade flows of electronic equipment.43 The electronics sector in Ireland sources a large amount of intermediate inputs from out-side Ireland and uses intermediate goods from other sectors in order to manufacture fin-ished electronics goods. In this way reductions of tariffs in other sectors may have a rela-tively large impact on trade in electronics, because lower tariffs on inputs enables elec-tronics companies in Ireland to source intermediate goods at lower prices.
42 The Ministerial Declaration on Trade in Information Technology Products (ITA) was concluded by 29 participants at the
Singapore Ministerial Conference in December 1996. The number of participants has grown to 70, representing about 97% of world trade in information technology products. The ITA provides for participants to completely eliminate duties on IT products covered by the Agreement. See more information on the WTO website.
43 Currently the ITA II is being negotiated in order to include information technology goods created since the ITA I was imple-mented. Trade barrier reductions achieved through the ITA II cannot also be achieved through TTIP and the implementa-tion of ITA II would further limit the scope for reduction of barriers to trade that can be achieved through TTIP.
0
100
200
300
400
500
600
1993=100

TTIP impact in Ireland
38
Expected impacts for the sector Our simulations of the TTIP’s impact in Ireland predict that the electronics industry is the sector, which will experience the largest percentage increase in exports following the im-plementation of TTIP. The increase in output and exports is estimated to be 22% each, while imports are ex-pected to rise by 8%, cf. Table 4.1. The simulations suggest an increase in exports from the sector of approximately €3 billion based on 2013 data, while imports are estimated to in-crease €600 million. The increase in output corresponds to a rise in output from the elec-tronics sector of €900 million. In tandem, our simulations show that employment in the sector can be expected to increase by approximately 20% for all three worker skill groups (cf. Section 2.9 for a discussion of sectoral employment effects).
Table 4.1 Simulated impact in electronic equipment Output Exports Imports
Output and trade effects +22.1% +22.2% +8.0%
Low skill Middle skill High skill
Employment effects +19.0% +19.8% +19.9%
Source: Copenhagen Economics based on CGE-simulations by prof. J. F. Francois 2014.
The electronic equipment industry is the industry experiencing the largest trade effects following TTIP. One reason is the expected impacts on intra firm trade especially for US companies. While current trade with the United States is at a relatively low level com-pared to the EU and UK a geographical split of the expected trade effects show that the largest impact is expected in trade with the United States. The model predicts that exports to the US are expected to increase 73%, with the corresponding figures for the EU, UK and rest of the world at 22%, 20% and 22% respectively. Meanwhile imports are also ex-pected to increase significantly from the US (69%) and South East Asia (28%) while im-ports from the EU and UK are expected to decline by 4%. This suggest that following TTIP electronics companies in Ireland will increasingly be able to utilise the global supply chains of electronics production in order to expand production and increase exports to all regions in the world. The large estimated impact of TTIP is driven by a reduction of tariffs as well as non-tariff barriers. As the tariffs on electronics products are relatively low though (0.14% on average for Irish exports to the US) the large effect of the tariff reductions should mainly be seen as the electronics sector receiving cheaper access to intermediate goods and service inputs that are used in the production of electronics equipment. The TTIP’s positive impact for the electronics industry in Ireland is different from the EU-wide sector, which is expected to contract following TTIP.44 Our simulations predict that
44 CEPR (2013) p. 60.

TTIP impact in Ireland
39
the production and export of large electronics companies in Ireland will actually benefit and expand following TTIP. Meanwhile the competition for location of production inside the EU, works in the oppo-site direction and towards declining production in Ireland. Depending on the attractive-ness of outsourcing production to eastern European locations in the coming years, due to generally lower costs of production, the effect of the TTIP on the Irish electronics industry may be lower than our simulations, based on current production patterns.
Link to ICT services Many of the large companies in the electronics industry manufacture hardware electron-ics equipment, but also provide ICT services and support on the software. A tendency that has been seen in the electronics sector in Ireland in recent years is in-creased ICT support from Ireland. Increased used of cloud computing services has in-creased demand for service support functions supplied by the large electronics compa-nies, which creates jobs in large electronics companies in Ireland. This tendency represents a shift towards an electronics sector moving up the value chain with hardware exports representing a declining share production in the large electronics companies who are increasingly providing ICT services as global demand for these ser-vices are rapidly growing.
Expected impacts of FDI in the sector The foundation of the electronics industry in Ireland is foreign direct investment espe-cially from the United States, and with 83% of workers in the industry being employed in foreign owned companies the expected impacts on FDI following a free trade agreement with the United States is naturally interesting. With increased competition for production locations in Europe especially from Eastern European countries where costs are generally lower the future of Ireland as a manufactur-ing hub for electronics equipment and favoured destination for US FDI may be chal-lenged. Our simulations though suggest increasingly strong ties between Ireland and United States in electronics trade with both imports from and exports to the United States grow-ing approximately 70% corresponding to a rise in imports and exports of €800 million and €900 million respectively. This suggests a further value chain integration between subsidiaries in Ireland and parent companies in the United States making both more profitable. The TTIPs effect of strengthening value chain integration between companies in the US and in Ireland will most likely strengthen the case for further FDI in Ireland. In fact our simulations suggest that contrary to the EU-wide effects estimated by CEPR (2013) the electronics industry is projected to expand in Ireland. But whether the market forces of

TTIP impact in Ireland
40
outsourcing to lower cost countries will drive FDI away from Ireland is hard to predict and the FDI flows to Ireland in the electronics industry are not expected to be lower than they otherwise would have been following the TTIP.

TTIP impact in Ireland
41
Chapter 5
Services
Introduction to the sector in Ireland Ireland has increasingly become a service export economy, specialised in the export of ICT services and business services.45 Ireland has also developed other service activities, such as insurance and financial services, which together with ICTs have contributed to the strong growth of service exports. Despite a substantial drop in employment caused by the financial crisis, which badly hit the construction sector as well as ICT manufacturing, Ireland has experienced job growth in ICT services. In fact, the Irish economy has specialised in production of services to the extent that, in 2011, nearly half of all persons and enterprises in the business sector were engaged in service provision.46 The strong growth in the export of ICT services has been achieved partly by attracting for-eign investment. For example, nine of the top ten US ICT companies operate in Ireland47 and there are over 200 IDA-supported ICT companies, directly employing approximately 36,000 people. Likewise, a number of major international insurance and reinsurance and commercial banking groups have established affiliates in Ireland using the ‘hub-and-spoke’ approach in order to provide insurance and financial services to the EU. Several large insurance groups have located the IT systems development in Ireland, and several have grouped their risk and compliance expertise in Ireland giving rise to a large insurance industry in Ireland servicing mother firms and affiliates in the rest of Europe and in the US. In fact, more than half of the world’s top 20 insurance companies have a base in Ireland, providing life and non-life insurance, reinsurance as well as insurance-related services such as data analytics, actuarial modelling and software development.48 Of course, not all, or even most, of service providers are large multinational companies. In services excl. financial and insurance, more than 73% of persons were engaged in SMEs (i.e. max. employees 250). Moreover, the number of SME service providers is continu-ously growing; between 2006 and 2010 these accounted 52% of all enterprise ‘births’ but only 43% of ‘deaths’.
45 Business and ICT services include computer programming, consultancy, information and service activities, real estate activ-
ities, professional, scientific and technical activities, administrative and support service activities and support activities to agriculture.
46 Cf. CSO (2011). 41.1% persons were engaged in ‘services’ and 7.7% in ‘financial and insurance’, which, for the purposes of this report, is also classified as services. 47.6% of active enterprises belonged to ‘services’ and 2.9% belonged in ‘financial and insurance’. Persons engaged include employees, proprietors and family members.
47 Cf. IEA (2011). 48 PWC (2014): Allianz, Aegon, AIG, Aviva, Axa, Berkshire Hathaway, CNP, Generali, Legal & General, MetLife, Prudential
(UK), Prudential Financial (US), Zurich.

TTIP impact in Ireland
42
Nonetheless, a substantial share of economic activity in the business sector is generated by foreign-owned affiliates. Although foreign-owned affiliates in 2011 accounted for only 1,632 enterprises (2%) out of 85,278 in services (excl. financial services), they engaged 17% of total persons and generated 43% of total value added, the majority of which de-rived from non-EU multinationals. In large part, this is why, in 2010, the value added per person in all sectors was €70,900 for all enterprises (the largest value in EU27), but only €39,600 in enterprises excluding foreign-owned enterprises. 49
Current trade patterns Total service exports are dominated by insurance and financial services, business services and ICT services and the major components of imports are business services and, to a lesser extent, insurance and financial services, cf. Table 5.1.
Table 5.1 Current account by service sector, 2013 Current Account Credit Current Account Debit
(€ billion) (€ billion)
‘Export’ ‘Import’
Transport 4.4 1.6
Tourism and travel 3.3 4.6
Communications 0.7 1.1
Insurance 8.4 5.4
Financial services 7.5 4.7
ICT services 38.7 0.4
Business services 27.1 35.7
Trade related 7.9 12.8
Operational leasing 7.6 1.5
Other 11.6 21.4
Services 90.1 53.5
Royalties/licences 4.0 34.9
Total 94.6 88.6
Note: Royalties and licenses are sometimes classified as services. However, for the purposes of this report,
these are viewed as income flows which are not affected by TTIP.
Source: Copenhagen Economics based on CSO Ireland statistics
Clearly, royalties and licenses play a major role in the Irish economy and figure promi-nently on the debit-side of the current account. The main type of royalties and licences is payments on intellectual property, mainly in industrial processes (such as pharmaceuti-cals), techniques, formulas, copyrights, trademarks and patents as well as fees collected for the right to distribute, use and reproduce computer software. In many cases, the pay-ments are intra-firm transactions between international subsidiaries and are therefore counted as imports in the current account.50
49 CSO (2011) – this data has not been published since 2011. 50 Quinlan (2013).

TTIP impact in Ireland
43
Although royalties and licenses are sometimes classified as ‘trade’, in the impact analysis of this report they are classified as income flows and are not included in the trade balance for services. The implication of this for this impact analysis is discussed in Section 5.4. Services play a major role in the trade between Ireland and the US. Part of the reason that Ireland has experienced a strong development in insurance and financial services is that US companies establish affiliates in Ireland for the sole purpose of providing analytical, administrative and supporting services to the parent company. As such, Irish service pro-viders play a substantial role in the global value chain of US multinationals in serving both the US and European markets. Ireland’s service exports to the US alone constitute around 6% of total exports. Compared to all trade partners, exports of insurance services constitute a larger proportion, around 22% compared to 10% for total export of services, whereas exports of ICT services consti-tute a much smaller proportion, 3% compared to 41% for the total export of services, cf. Figure 5.1. More than half of total exports of ICT services go to EU26.
Figure 5.1 The distribution of service exports, 2011-2012
Note: For 2012, some data is suppressed for confidentiality reasons, e.g. ICT services and royalties/licenses.
In these cases, 2011 figures are used. The figure shows the distribution of service exports in total or
to the US. The bars measure the share of a service out of total exports either to all partner countries
or to the US alone.
Source: Copenhagen Economics based on CSO statistics
Imports from the US, compared to all partner countries, constitutes a much larger share of total imports, in that around 31% of total imports derive from the US, compared to 6% for US exports relative to all trade partners. The difference in trade patterns for the US
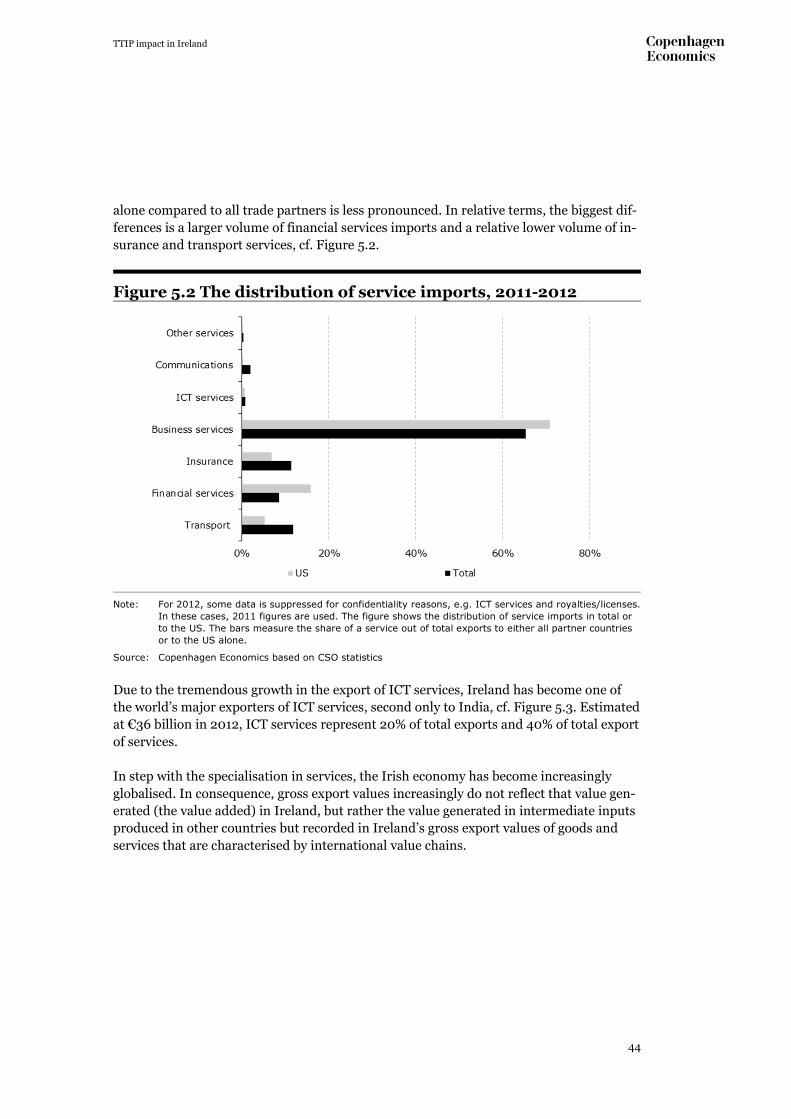
TTIP impact in Ireland
44
alone compared to all trade partners is less pronounced. In relative terms, the biggest dif-ferences is a larger volume of financial services imports and a relative lower volume of in-surance and transport services, cf. Figure 5.2.
Figure 5.2 The distribution of service imports, 2011-2012
Note: For 2012, some data is suppressed for confidentiality reasons, e.g. ICT services and royalties/licenses.
In these cases, 2011 figures are used. The figure shows the distribution of service imports in total or
to the US. The bars measure the share of a service out of total exports to either all partner countries
or to the US alone.
Source: Copenhagen Economics based on CSO statistics
Due to the tremendous growth in the export of ICT services, Ireland has become one of the world’s major exporters of ICT services, second only to India, cf. Figure 5.3. Estimated at €36 billion in 2012, ICT services represent 20% of total exports and 40% of total export of services. In step with the specialisation in services, the Irish economy has become increasingly globalised. In consequence, gross export values increasingly do not reflect that value gen-erated (the value added) in Ireland, but rather the value generated in intermediate inputs produced in other countries but recorded in Ireland’s gross export values of goods and services that are characterised by international value chains.

TTIP impact in Ireland
45
Figure 5.3 Major exporters of ICT services, 2012 and 2000
Source: Copenhagen Economics based on UNCTAD data
As a case in point, in 2009, foreign value added in 2009 constituted around half of the service content in total gross exports, cf. Figure 5.4. For example, the service content can be significant in exports of manufactured goods, e.g. pharmaceuticals and chemicals, part of which is recorded as royalties and licenses.
Figure 5.4 Value added in exports of services, 2009
Source: Copenhagen Economics based on OECD-WTO, Trade in Value Added (TiVA) Database
In total, 62% of the value-added exports derived from services, up from 38% in 1995. This is substantially higher than the OECD average which, combined with the substantial growth in 1995-2009, reflects the high and growing specialisation in services of the Irish export economy.

TTIP impact in Ireland
46
In fact, measured on the share of total service exports that are comprised of the top three export sectors, Ireland is the most specialised country in the exports of services, cf. Figure 5.5. In contrast to many other countries, Ireland’s activity in ICT and communications, business, financial and insurance services far outpaces activity in travel services, as well as construction, maintenance and manufacturing services.
Figure 5.5 Top three exporting services, 2009
Note: The countries that are displayed are those for which the share of services in goods and service ex-
ports is above the world average (about 19.1%). Construction services and maintenance and manu-
facturing services are removed for visibility as they constitute a very small proportion (only Turkey
3%).
Source: Copenhagen Economics based on OECD Science, Technology and Industry Scoreboard 2013
Reduction in barriers to transatlantic trade in the sector Services are not subject to tariffs and, as such, are easier to trade. However, some services are exposed to substantial NTBs. For the international trade in legal, accounting, architecture and engineering services, the TTIP would imply that these NTBs would be reduced: for example, regulations with re-spect to licensing, qualification requirements and duplication of professional credentials. For ICT services in particular, it has been suggested, the TTIP would likely mean, for ex-ample, harmonisation of e-commerce protocols.51 Although the inclusion of these services in TTIP is controversial, TTIP could, for finance and insurance services, include harmoni-sation of ‘national treatment’ and ‘market access’ rules52 and, for air and sea transport ser-vices, it could reduce restrictions on cabotage.53
51 Quinlan (2013) 52 Respectively, that no service provider should be treated less favourably than a national provider and elimination of re-
strictions on the number or value of market participants, transactions or foreign capital. 53 For example, the US Jones Act, which requires that all ships engaged in domestic sea commerce are built in America and
crewed by US mariners.
0
10
20
30
40
50
60
70
80
90
100
Financial and insurance services Business Services ICT and communications Travel

TTIP impact in Ireland
47
Tariff equivalents of Non-Tariff Barriers between the EU and US
To quantify the impact of the NTBs in services, we rely on the estimates of the barriers’ impact on service trade from the EU-wide study by CEPR (2013), cf. Table 5.2. The table shows the tariff equivalent of the NTB, i.e. a measure of a counterfactual tariff that would constitute an equivalent barrier to trade. As discussed above, among the sectors that are affected by the TTIP, the current trade pattern is characterised by large exports and imports of business services. Importantly, exports of ICT services to the US is much smaller than exports to all partner countries whereas insurance and financial services are much larger to the US compared to exports to all partner countries. Therefore, a key feature in Table 5.2 is the pattern of NTBs to business and ICT services54, the largest component of both total imports and exports and to insurance services, and the largest component of exports to the US. In particular, the estimated NTBs to insur-ance services exported from the EU to the US are almost double those to insurance ser-vices exported from the US to the EU. Conversely, the NTBs to business and ICT services are around three times smaller for services that are exported from the EU to the US than for services exported from the US to the EU. Of course, although the trade pattern in business and ICT services and insurance and fi-nancial services is affected by the barriers to trade, it is not generated by them. Nonethe-less, changes in NTBs as a consequence of TTIP will likely affect preferences for trade on the margin, which is the intuitive explanation of the impacts reported in section 5.4. It should be noted that there is assumed no change in the market access for public services.
Table 5.2 NTBs implemented in the simulations EU → US US → EU
Air transport 2% 2%
Sea transport 8% 8%
Financial 32% 11%
Insurance 19% 11%
Business & ICT 4% 15%
Communication 2% 12%
Construction 3% 5%
Personal 3% 4%
Other services (incl. public service) 0% 0%
Average 9% 9%
Note: The tariff equivalents are estimated based on questionnaires to business about the extent to which
they feel trade is inhibited by NTBs.
Source: CEPR (2013) and Ecorys (2009).
54 Note that, although business services and ICT services are reported separately in Section 5.2, these sectors are not currently
separated in the GTAP database that is used in the simulations. Therefore, the estimated impacts of the TTIP on these sec-tors cannot be analysed separately.
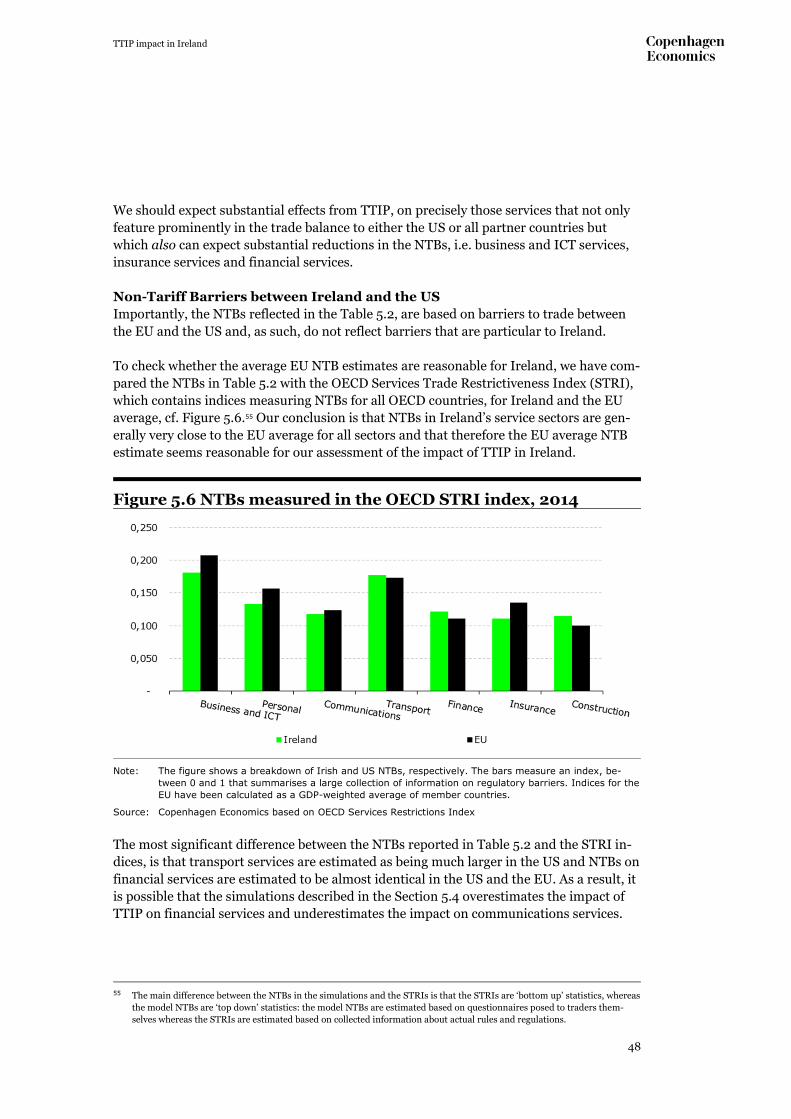
TTIP impact in Ireland
48
We should expect substantial effects from TTIP, on precisely those services that not only feature prominently in the trade balance to either the US or all partner countries but which also can expect substantial reductions in the NTBs, i.e. business and ICT services, insurance services and financial services.
Non-Tariff Barriers between Ireland and the US
Importantly, the NTBs reflected in the Table 5.2, are based on barriers to trade between the EU and the US and, as such, do not reflect barriers that are particular to Ireland. To check whether the average EU NTB estimates are reasonable for Ireland, we have com-pared the NTBs in Table 5.2 with the OECD Services Trade Restrictiveness Index (STRI), which contains indices measuring NTBs for all OECD countries, for Ireland and the EU average, cf. Figure 5.6.55 Our conclusion is that NTBs in Ireland’s service sectors are gen-erally very close to the EU average for all sectors and that therefore the EU average NTB estimate seems reasonable for our assessment of the impact of TTIP in Ireland.
Figure 5.6 NTBs measured in the OECD STRI index, 2014
Note: The figure shows a breakdown of Irish and US NTBs, respectively. The bars measure an index, be-
tween 0 and 1 that summarises a large collection of information on regulatory barriers. Indices for the
EU have been calculated as a GDP-weighted average of member countries.
Source: Copenhagen Economics based on OECD Services Restrictions Index
The most significant difference between the NTBs reported in Table 5.2 and the STRI in-dices, is that transport services are estimated as being much larger in the US and NTBs on financial services are estimated to be almost identical in the US and the EU. As a result, it is possible that the simulations described in the Section 5.4 overestimates the impact of TTIP on financial services and underestimates the impact on communications services.
55 The main difference between the NTBs in the simulations and the STRIs is that the STRIs are ‘bottom up’ statistics, whereas
the model NTBs are ‘top down’ statistics: the model NTBs are estimated based on questionnaires posed to traders them-selves whereas the STRIs are estimated based on collected information about actual rules and regulations.

TTIP impact in Ireland
49
Expected impact in the sector Based on the simulations, we find that exports of services from Ireland will only see a small decrease of about €0.4 billion, whereas service imports to Ireland will increase by about €2 billion (compared to total service imports in 2013 of €88 billion). Still, the out-put from the service sector in Ireland will remain more or less unchanged as a result of TTIP, mainly due to general demand effects. As discussed in the previous section, all things being equal, we should expect the major TTIP impact to be reflected either in sectors that are the major components of Irish trade or in components for which NTBs are substantially reduced, i.e. in particular business and ICT services and insurance services. Ireland has a large export of computer services of around €40 billion in 2013 according to the CSO balance of payments, of which around 70 percent is to the rest of the EU and only 4 percent is destined to the US (rest of the world makes up 26 percent of Ireland’s exports of computer services). Although we expect a small decrease in total exports of services, the impacts in different sectors are very different. Exports of business and ICT services (including the large export of consumer services) drop substantially as the decrease in NTBs on these services in the EU implies that Irish business and ICT service providers are subject to competitive pres-sure on the domestic and EU markets, cf. Figure 5.7. In the short term, this leads to a con-traction in Irish production of these services.
Figure 5.7 Impact of TTIP, million €.
Note: Results for trade value change from baseline in experiment 1. Based on CSO service exports of €81
bn. and service imports of €83 bn. Note that, as GTAP data records royalties and licenses as an in-
come transfer, rather than trade, the impact factors estimated by the CGE model are, for services,
applied on exports/imports net of royalties and licenses, i.e. €78 bn. and €54 bn., respectively.
Source: Copenhagen Economics based on CGE simulations by Prof. J. F. Francois, 2014
TTIP impact in Ireland
50
Conversely, exports of insurance services increase substantially due to the reduction of NTBs on these services in the US, all the more so as exports of insurance services already plays a prominent role in the Ireland-US trade relationship. In the case of business and ICT services, it is expected that TTIP will reduce the high NTBs. As a consequence, Irish imports of business services will increase, but since virtu-ally no ICT services are imported, cf. Figure 5.2, we do not expect any major import changes in this segment. In the case of insurance services, TTIP is expected to reduce the high NTBs on the US side. As a consequence, the already large proportion of insurance services exported to the US will increase. However, TTIP is also expected to imply a decrease in the not insubstan-tial NTBs on insurance going into the EU, leading to a concomitant increase in imports of insurance services, from both the US and other countries. Public procurement, which is expected to be a major part of the TTIP negotiations is here included in the ‘other’ services category (also including public administration, education and health services). The simulations do not include any assumptions of reductions of NTBs in this sector and the sector is only indirectly affected by TTIP – i.e. the changes are solely due to general demand effects stemming from tariffs and NTB reductions on other services and goods. The long-term impact of TTIP is similar to the short-term impact. The impact on import and export of insurance services is identical but the impact on business services and ‘other’ services is slightly more pronounced: general demand effects that have limited sig-nificance in the short term accumulate in the long term. As Irish trade adjusts to TTIP, the Irish trade economy will shift slightly from the production of business services toward insurance services but also toward the production of pharmaceutical and electrical ma-chinery. Lastly, royalties and licenses are not recorded on the trade balance of the model’s under-lying data-set. Rather, royalties and licenses are recorded as income flows instead of trade flows. In consequence, royalties and license fees is not a ‘sector’ in the model and is ig-nored, except for foreign income transfers. In the short term, this makes sense as we do not expect that income flows are inhibited by any type of trade restriction. In other words, if royalties and licenses were included in the impact analysis, the immediate impact of NTB-reductions would not affect these flows. However, in the long term, this would not necessarily be so, as general demand effects propagate throughout the economy, and interactions occur between trade in services and goods. In the long term, it is possible that the ‘import’ of royalties and licenses would in-crease: similarly to business and professional services, royalties and licenses are an inte-gral part of industrial processes and would likely change in proportion to the production of such goods.

TTIP impact in Ireland
51
Expected impact on FDI in the sector As mentioned above, Ireland in large part functions as an export platform for service pro-viders: for example for multinational insurance companies using the hub-and-spoke ap-proach to access European markets. As described in Section 5.4, TTIP is expected to have a substantial effect on the Irish ex-port of insurance services. Moreover, we have established that much of the insurance ser-vice exports from Ireland to the US consist of insurance-related services exchanged by parent companies and Irish affiliates. To the extent that US affiliates are subject to the NTBs on trade in insurance services, we expect that much of the large increase in the exports of insurance services would happen through FDI in Ireland by other multinational insurance companies. Just as Ecorys (2009) estimated tariff equivalents of NTBs using surveys of company rep-resentatives, similar survey questions were posed in relation to the NTBs on FDI from the US to the EU. Table 5.3 summarises these indices on the reported categories of services, based on questions, where the respondents were asked to rank the restrictiveness of a particular market on a scale from 0 to 100, where index 100 indicates a completely closed market, and index 0 indicates a fully open market.
Table 5.3 NTBs on FDI, index 0-100 EU->US US->EU
Travel 13.6 20.3
Transport 7.4 12.3
Financial 11.7 12.5
ICT 15.0 13.7
Insurance 6.5 21.8
Communications 22.5 15.0
Construction 8.3 12.0
Business services 10.9 17.5
Personal 6.5 21.3
Note: Note that although these NTBs on FDI were estimated jointly with NTBs on trade, these were mod-
elled in the simulations that form the basis of the analysis in this report.
Source: Ecorys (2009)
As argued in the previous section, we should look for services that not only play a signifi-cant role in the US-Ireland trade in services but which may also experience a large drop in NTBs as a consequence of the TTIP. As insurance services are clearly one such service, we can be confident that an expansion of the insurance services sector in Ireland will be asso-ciated with FDI, especially from the US. In contrast, Table 5.3 shows little reason to expect that the TTIP will affect barriers to FDI in the ICT sector. Moreover, as we argued in Section 5.4, the expected impact on business and ICT services will occur in business services rather than ICT services.

TTIP impact in Ireland
52
Therefore, we do not expect that the demonstrated preference for US FDI in the ICT sec-tor will be affected by the TTIP. As reported in Quinlan (2013), Ireland was in 2012 the country with the second-most US FDI-stock ($24,815 m.) in the information sector (broadly, ICT and communications), exceeded only by the UK ($30,052) and with three times the stock of the Netherlands ($7,959), the third runner-up.

TTIP impact in Ireland
53
Chapter 6
Agriculture and food sector
Introduction to the sector in Ireland The agriculture and food sector is composed of primary production (including primary agriculture, fisheries and forestry), beef and dairy production as well as processed foods. In total, the sector comprises one of the largest indigenous sectors in Ireland, accounting for 7.1% of gross value added at factor costs and 8.8% of total Irish employment, equiva-lent to 167,000 persons56. Of the total sector employment 66% (110,500 persons) is at-tributed to agriculture, forestry and fishing, while food and drink manufacturing account for 31% (51,400) and wood processing for the final 3% (Dept. Agriculture, 2014a). Farming is spread across all regions of the country (cf. Table 6.1), with beef production concentrated in especially the Border and Western regions, while dairy farming has a large presence in especially the Southern region of the country.
Table 6.1 Regional distribution of farms Region Total number of farms Dairy farms Beef farms Other farms
Border 28,831 1,694 16,411 10,726
Midland 12,834 993 8,724 3,117
West 32,216 828 20,660 10,728
Mid-East and Dublin 10,339 819 4,444 5,076
Mid-West 16,346 2,606 10,781 2,959
South-East 16,660 3,155 6,798 6,707
South-West 22,634 5,559 9,920 7,155
Total 139,860 15,654 77,738 46,468
Note: Counties included in each region are as follows: Border region (Cavan, Donegal, Monaghan, Sligo, Lei-
trim, Louth), Midland (Laois, Longford, Offaly, Westmeath), West (Galway, Mayo, Roscommon), Mid-
East and Dublin (Dublin, Kildare, Wicklow, Meath), Mid-West (Clare, Limerick, North Tipperary),
South-East (Carlow, Kilkenny, South Tipperary, Waterford, Wexford), South-West (Cork, Kerry).
Source: Copenhagen Economics using data from CSO (2012).
Overall, the agri-food sector is characterised by a low share of foreign ownership and strong backward linkages to the domestic economy. Both the beef and dairy sectors are entirely Irish-owned, while the processed food and primary production sectors include a degree of foreign ownership, with 20% of employment in the processed food industry and 6% of employment in primary production being attributed to foreign-owned enterprises. Especially in the processed food industry these, mostly multinational firms, are highly ex-port intensive accounting for 70% of sector exports compared to 8% in primary produc-tion (cf. Chapter 7).
56 The figure relating to gross value added refers to 2012, while employment is based on data for the first quarter of 2014. Both
figures are obtained (Dept. Agriculture, 2014a).

TTIP impact in Ireland
54
According to the Department of Agriculture (2013) the agri-food sector source 74% of raw materials and services from Irish suppliers, compared to 40% for manufacturing. The combination of a low import dependency and low profit repatriation means that the im-pact of export earnings on GNP is significantly larger for this sector than for others (Dept. of Agriculture, 2013). The Dept. of Agriculture (2013) thus notes that every €100 worth of exports from the agri-food sector (agriculture, forestry, fisheries, food and drink indus-tries) contributes €52 to GNP compared to approximately €19 for the non-agri-food sec-tor.
Combined with the rural importance of the sector, the low import dependency and foreign ownership in the sector means that impacts of the TTIP on this sector will be felt mainly by domestic enterprises and would especially impact rural areas in Ireland providing em-ployment opportunities in expanding sectors, including dairy and processed food.
Overview of results in agriculture The TTIP is expected to increase Irish agriculture exports by 2% to 3% or €230-€270 mil-lion relative to 2013. Both dairy and processed foods are likely to see net exports increase as a consequence of the TTIP.57 Total Irish exports of dairy are thus expected to increase by approximately €162 million relative to exports in 2013, while imports are only expected to increase by €73 million. Changes in trade flows are expected to increase gross value added in the dairy sector by approximately €40 million relative to 2013. For the processed food sector, exports are expected to increase by approximately €94 mil-lion, while imports are likely to increase by €84 million. Overall we expect gross value added in the processed food sector to increase by around €10 million relative to 2013. In the beef sector and to a smaller degree in the primary production sector, higher US competition on the domestic and the EU market will most likely emerge. These are, as a consequence, expected to be among the contracting sectors. In the case of beef, we expect output to contract by between 1% and 3%. Relative to 2013, this is equivalent to a contrac-tion of between €25 million to €45 million. Output in primary production is expected to contract by approximately 1.5%, equivalent to €49 million relative to 2013. Depending on the actual outcome of the TTIP negotiations with respect to relaxation of quotas for US beef into the European market, and depending on the degree of change to other regulatory barriers in the beef sector, Ireland’s beef producers should prepare for increased competition from cost efficient US beef producers in the European market. The results for each of the individual sectors are discussed below. It should be noted that the estimated impacts of TTIP presented in this chapter, as in the rest of report, is based on simulations using the same computable general equilibrium model (CGE-model) as was used in the EU-wide study performed by CEPR in 2013. However, as described in Chapter 1, we have adopted the model to the Irish economy using specific Irish data, and
57 All Euro values are computed using 2013 data from the CSO.

TTIP impact in Ireland
55
we have adapted the sector composition of the model to the best possible fit to key sectors in Ireland. Notably, we have separated dairy and beef from the other agriculture sectors to better match key sectors in Ireland being impacted by TTIP. While the data being used for the simulations captures the underlying differences in the composition of the Irish beef exports (e.g. high-value cuts versus other cuts), we cannot assess the specific impacts on the different segments within each agricultural sector.
Dairy The Irish dairy sector58 is highly export oriented with 85% of all output being exported.59 In 2013 total exports of Irish dairy products equalled €1.6 billion, while imports equalled €547 million.60
The main export destination is the EU26, which receives 44% of total Irish exports, fol-lowed by the UK, receiving 34%. In comparison, the US is a relatively small export market for Irish dairy producers, accounting for only 4% worth of total Irish dairy exports in 2013, cf. Figure 6.1.
Figure 6.1 Main trade partners in dairy, 2013
Note: ROW is the Rest of the World. The figure is based on the sectoral distribution from the GTAP data for
2011 applied to the total exports of goods from Ireland in 2013.
Source: Copenhagen Economics based on2013 CSO data and GTAP data.
In the same year, the UK was the origin of 68% of Irish dairy imports. A further 30% of dairy imports in that year originated in the EU26, while only 0.2% originated in the US and the remaining 1.8% in the rest of the world.
58 In the model simulations, the dairy sector includes both the manufacturing of dairy products and the raising of dairy cattle. 59 Enterprise Irelands webpage. http://www.enterprise-ireland.com/en/Start-a-Business-in-Ireland/Food-Investment-from-
Outside-Ireland/Key-Sectors/Dairy-and-Ingredients/ Accessed July, 2014. 60 Export and import figures are based on CSO data for 2013.
0
200
400
600
800
1000
1200
1400
1600
1800
Exports Imports
Million Euro
EU26 UK US ROW

TTIP impact in Ireland
56
Reduction of barriers to transatlantic trade in the sector
The average weighted ad valorem tariff applied by the US against Irish exports of dairy products is 6.44%. However, it should be noted that this is weighted by Irish exports to the US of individual dairy products. Within some groups of dairy US tariffs are signifi-cantly higher with 40% on yogurts and 33% on unripened cheese (Fontagné et al. 2013). In addition Ecorys (2009) estimates that the average costs of non-tariff barriers in the food and beverage sector correspond to additional trade costs of 73%.
In comparison, average weighted tariffs on the EU market against US exports of dairy is 55.22%, while the average costs of non-tariff barriers is estimated to be equivalent to 56.8% in the food and beverage sector.
Impacts from the TTIP will depend on both tariff reductions and the removal of NTBs. However, given the relatively large size of the estimated NTBs on the US market, impacts on Irish exports will depend especially on the reduction in these costs. As in CEPR (2013) it is assumed that costs arising from non-tariff barriers will be reduced by 25% on both markets, while tariffs are assumed to be reduced by 50%.
Non-tariff barriers on the US market include:
1. Sanitary and Phytosanitary (SPS) measures61 2. Management of import licenses 3. A mandatory import assessment
SPS measures The main SPS measure affecting EU exports of dairy products to the US is the so-called Grade “A” Pasteurized Milk ordinance. This affects milk and milk based products includ-ing fluid milk, cream, cottage cheese and yoghurt, as well as dry milk products (e.g. milk and whey powders), cf. Eucolait (2013).62
According to US legislation, firms engaged in interstate trade in ‘Grade A’ products must conform to the rules and inspection requirements contained in the ‘Grade A dairy safety document’ produced jointly by the Food and Drug Administration (FDA) and the National Conference on Interstate Milk Shipments (NCIMS). In order to export these products into the US producers in theory have the following three options:
1. Signing a contract with a US State, which accepts to treat the firm as if it was within the State jurisdiction and conduct the required inspections.
2. The region/country of the exporting firm adopts and complies with US Rules. 3. The Food and Drug Administration (FDA) recognises regulations in the exporting
country as equivalent to the US Grade A.63
61 Sanitary and Phytosanitary measures include standards for food safety and animal and plant health. 62 While the Grade A ordinance does not apply to exports of packed butter, bulk butter falls under the ordinance. 63 European Commission, DG Trade, market access database. Accessed July, 2014.
TTIP impact in Ireland
57
According to the European Commission, the first two options are in practice not possible as no Federal state is actually willing to accept an application from a foreign firm and be-cause full compliance with the pasteurized Milk Ordinance is almost impossible for an EU firm (EC, market access database). US recognition of the EU system as equivalent to the US grade A is therefore in reality required in order for EU producers to gain US market access for these products.
Dairy import assessment
The dairy import assessment programme stipulates that importers of certain dairy prod-ucts must pay a fee of 7.5 cent per hundred pounds in weight of US milk or the equivalent thereof.64 The programme is part of the US national Promotion and Research Order and the levy imposed is used to promote domestic consumption of dairy. EU producers see this levy as being unfair as a lot of the funding is used to promote milk, which is not im-ported. Further, many dairy products exported from the EU end up in processed foods which, in turn, are not marketed as dairy products (Eucolait, 2013). Reducing or exempt-ing imports of all or certain types of dairy imports would increase the competitiveness of Irish products on the US market.
Import licence management
For certain dairy products (butter and cheese included) tariff-rate quotas are in place on the US market, allowing the volume of products within the quota to be imported at a re-duced tariff rate, while the imports exceeding the specified quota are subject to full tariffs. In order to import dairy products subject to a tariff-rate quota at the reduced tariff rate, an import licence is required. This authorizes the licensee to import a specified quantity and type of product from a specified country of origin.65
The US currently allocates three different types of licences, including historical, non-his-torical and designated licenses. Historical licenses originated in the 1950s and are reis-sued to the holders each year, conditional on the fulfilment of all requirements. Non-his-torical licenses are lottery licenses and are available to all applicants, but under this scheme there is no guarantee that an importer will receive the same license each year or indeed any license. Finally, licenses may be issued to importers designated by a foreign government or the US Department of Agriculture (USDA).66
The US system for allocation of licenses is criticized by EU producers as it fails to ensure that all import licenses are being fully utilized. Eucolait (2013) notes that a ‘significant’ portion of EU dairy products are therefore currently being imported at the full tariff rate, while import licenses entitling these same products to be imported at zero or a reduced tariff rate, remain unutilized (Eucolait, 2013). Changing the allocation of licenses, espe-cially away from historical licenses, would be very beneficial to Irish exports of especially butter and cheese to the US market.
64 US Department of Agriculture’s webpage http://www.ams.usda.gov/AMSv1.0/dairyimportassessment Accessed July 2014. 65 Federal Register https://www.federalregister.gov/articles/2013/02/06/2013-02530/dairy-tariff-rate-import-quota-licens-
ing-program , accessed July 2014 66 Federal Register https://www.federalregister.gov/articles/2013/02/06/2013-02530/dairy-tariff-rate-import-quota-licens-
ing-program , accessed July 2014

TTIP impact in Ireland
58
Expected changes
The estimated impact of the TTIP on the Irish dairy industry is a rise in total exports of 10%, equivalent to €162 million based on 2013 data. Imports are estimated to increase by 13%, equivalent to €73 million. Overall, this is expected to result in a change in output of 2.5%, cf. Table 6.2.
Table 6.2 Simulated impact in dairy (percent changes) Output Exports Imports
Output and trade effects 2.5% 10.0% 13.4%
Low skill Middle skill High skill
Employment effects 1.9% 2.3% 2.4%
Note: Changes in output are quantity based, while changes in imports and exports value based.
Source: Copenhagen economics based on CGE simulations by professor J.F. Francois, 2014
Increases in exports are mainly driven by an increase in exports to the US estimated at over 400%. In comparison, exports to the UK and to the EU26 are expected to decrease by roughly 7% in each case, while exports to the rest of the world will also decrease slightly in most regions due to a diversion of exports towards to the US.67 Close to 95% of the total increase in exports is attributed to the reduction of non-tariff barriers on the US market, with reduction in non-tariff barriers on goods accounting alone for an increase in total dairy exports of 9%. As a consequence of increased production, employment is expected to increase in the sec-tor for all skill groups, with the low skilled employment experiencing a slightly smaller percentage increase than middle and high skill (cf. Section 2.9 for a discussion of sectoral employment effects).
Beef The Irish beef sector is also highly export oriented. According to Teagasc, 90% of Irish produced beef was exported in 2011, making Ireland the largest exporter of beef in the EU.68
In 2013 total exports of Irish beef equalled €1.9 billion, while Irish imports of beef equalled €105 million.69 The single most important export market for Irish beef is the UK, which in 2013 received 53% of the volume of Irish beef exports. Of the remaining share, the majority was exported to the rest of the EU, which accounted for 45% of the total vol-ume. In particular France, Italy, the Netherlands and Scandinavia are large markets for
67 The model does not factor the removal of the EU milk quota in 2015 into the analysis, but analyses the isolated impact of
the changes related to TTIP alone. Removal of the EU milk quota will allow farmers to expand production without purchas-ing milk quotas. In the Irish Department of Agriculture’s 2020 strategy, the target is to expand milk production by 50% following the removal of milk quotas.
68 Teagasc webpage http://www.teagasc.ie/agrifood/ accessed July 2014. 69 The total import figure is based on CSO data (excluding cattle).

TTIP impact in Ireland
59
Irish beef.70 Thus, in total the EU market is the destination for 98% of Irish beef exports. The remaining 2% is exported to the rest of world. As the US was effectively closed to im-ports of EU beef products on the grounds of BSE until 2014, no Irish beef was exported there in 2013.
Model simulation sector The model, which we use to simulate the impact of the TTIP, is based on a global database (GTAP), in which beef is part of the bovine meat and cattle sector.71 Due to the way the da-tabase is constructed, it is not possible to match the sector exactly to correspond to beef only. However, comparisons with data from the CSO and Eurostat indicate that the export of bovine meat and cattle is almost exclusively beef. However, due to the scope of the model sector, which also includes sheep, goats, horses, asses, mules, and hinnies, the US accounts for a minor share of Irish exports (2%) in 2013, despite being closed to EU im-port of beef. With respect to imports, other products than beef make up a significant part and the total value of imports of bovine meat and cattle thus estimated at €365 million.
Figure 6.2 Main trade partners in bovine meat and cattle, 2013
Note: ROW is the Rest of the World. The figure is based on the sectoral distribution from the GTAP data for
2011 applied to the total exports of goods from Ireland in 2013. For this reason, the model sector is
slightly underestimating the beef export, since the global data set used has 2011 as base-year.
Source: Copenhagen Economics based on 2013 CSO data and GTAP data.
Reduction of barriers to transatlantic trade in this sector
The trade weighted ad valorem tariff applied by the US on Irish imports of beef is 2.77%. To capture the costs of non-tariff barriers, we use the estimated average cost across the
70 See the “2025 Agri-food Strategy: Background Paper Meat”, http://www.agriculture.gov.ie/2025strategy/. 71 In the model the following products are included in the GTAP sector Bovine meat products (CMT) and the GTAP sector
Bovine cattle, sheep and goats, horses (CTL): Live bovine cattle, sheep and goats, horses, asses, mules, and hinnies, bovine semen, fresh or chilled meat of bovine animals, frozen meat of bovine animals, fresh or chilled meat of sheep, frozen meat of sheep, chilled, fresh or frozen meat of goats, fresh, chilled or frozen meat of horses, asses, mules or hinnies, fresh, chilled or frozen edible offal of bovine animals, swine, sheep, goats, horses, asses, mules or hinnies, raw or rendered fats of bovine animals, sheep, goats, pigs and poultry and wool grease. The concordance between GTAP sectors and standard classifica-tions are available at: https://www.gtap.agecon.purdue.edu/databases/contribute/concordinfo.asp.
0
200
400
600
800
1000
1200
1400
1600
1800
Exports imports
Million Euro
EU26 UK US ROW
TTIP impact in Ireland
60
food and beverage sector, estimated by Ecorys (2009) to be equivalent to an ad valorem tariff of 73%.
The main barrier on the US market has until this year been the ban on imports of EU beef. This was imposed in 1998 on the grounds of BSE72 and included even deboned beef, which is deemed safe by international standards proposed by the World Organisation for Animal Health73, cf. European Commission (2013). The recent change in US legislation early this year thus brings BSE import regulations in line with international standards and opens the market for EU producers.74
However even with this change in legislation and indeed further reductions of trade barri-ers, the industry does not foresee a significant increase in Irish beef exports to the US due primarily to significantly lower costs of production in the US, with which Ireland simply cannot compete. As US beef is produced at lower costs than EU produced beef, the largest impact of the TTIP is likely to arise from a lowering of trade barriers on the EU market, which we therefore focus on in the remaining part of this section.75 Trade barriers applied on the EU market towards imports of US beef include an average trade weighted tariff of 25.4% and additional trade costs corresponding to a tariff of 56.8%, arising from non-tariff barriers.76 The main non-tariff barrier on the EU market is the ban on the use of growth hormones in beef production. This is a common practice in the US and is believed to be used on two thirds of all cattle and 90% of cattle in feedlots (Johnson and Hanrahan, 2010). The TTIP is however not expected to affect EU legislation on this matter.77
The EU ban has been the cause of a longstanding WTO dispute between the EU and the US, during which the US (and Canada) imposed a series of retaliatory tariffs on imports of certain EU agricultural products (Johnson and Hanrahan, 2010). The dispute was settled in 2009, when the US and the European Commission signed a Memorandum of Under-standing (MoU), which upheld the EU ban on hormones but granted the US a 45,000 Metric ton duty free tariff rate quota for high-quality non-hormone beef. This was given in exchange for the removal of US retaliatory measures (MoU, 2009). The tariff quota af-forded to the US was installed in two phases, with a quota of 20,000 Metric tons intro-duced in August 200978 followed by an expansion of 25,000 Metric tons in 2012.79,80
72 BSE is short for Bovine spongiform encephalopathy, more commonly known as mad cow disease. 73 The World Organization for Animal Health (OIE) is the WTO reference organization for standards relating to animal health
and zoonoses (http://www.oie.int). According to the European Commission (2013), the OIE deem deboned skeletal muscle meat safe from BSI.
74 USDAs webpage http://www.usda.gov/wps/portal/usda/usdahome?contentidonly=true&contentid=2013/11/0207.xml accessed July 2014.
75 See Deblitz and Dhutyvetter (2013) for a detailed discussion on EU and US costs of beef production. 76 This is the estimated average cost of NTBs across the food and beverage sector as estimated in Ecorys (2009). 77 The European Commissioner for Trade Karel De Gucht has on several occasions stated that the hormone ban will not be
removed as part of the TTIP. Latest in Berlin at the CDU Wirtschaftsrat Economic Conference on the 3. July 2014, De Gucht gave a speech in which he clearly stated that ‘The EU will not be changing its law on genetically modified food. And
we will not be changing our laws on beef hormones’ European Commission Press release Database: http://eu-ropa.eu/rapid/press-release_SPEECH-14-529_en.htm accessed July 2014.
78 European Commission Regulation (EU) No. 617/2009 79 European Commission Regulation (EU) No 464/2012 80 In settlement of the same dispute, Canada was awarded a tariff rate quota of 3,200 metric tons.

TTIP impact in Ireland
61
US access to the EU market further improved in early 2013, following the EUs decision to allow the use of lactic acid to reduce surface contamination of bovine carcases and meat.81 According to the United States Department of Agriculture, one implication of this is that it will allow U.S. beef exporters to better take advantage of EU beef quotas.82
As the TTIP is still under negotiation, the degree to which market access will be further liberalized is still unknown. However, as beef is a so-called ‘sensitive’ sector, it is highly unlikely that an agreement would result in complete duty free access to the EU market for US producers. Most likely the current tariff rate quotas will be expanded as in the recently agreed FTA with Canada (CETA).83 As the volume of expansion is not yet known, we em-ploy two scenarios, under which the US is granted an additional quota of 50,000 metric tons of beef in the first scenario and an additional 75,000 metric tons in the second. Un-der both scenarios is it expected that the US will fully fill the additional quota.84 As noted above, the US already receives an annual hormone-free duty free quota of 45,000 metric tons. However, the US only currently fill 22,000 ton of this, which may at first hand seem incompatible with the assumption of additional US quotas being fully filled. However, as quotas are expanded the EU market may seem relatively more attrac-tive to US producers as the fixed costs of complying with the Hormone ban can be spread across a larger volume reducing the unit costs. Under the current legislation US beef in-tended for the EU must be produced according to the Non-Hormone Treatment Cattle (NHTC) programme requiring that all cattle must be grown in approved farms/feedlots and must be fully segregated from non-EU beef at the slaughterhouse. According to the American Meat Institute (2013), the costs and time required in order to become NHTC approved can be significant for especially smaller producers. Further, it should be remem-bered that current quotas were only expanded from 20,000 to 45,000 metric tons in 2012, and the fill rates may therefore still improve as more ranches become NHTC ap-proved. Finally, it should be noted that the analysis focus exclusively on the TTIP agreement, and does therefore not take account of the expansion in tariff rate quotas granted to Canada under CETA or any concessions resulting from the ongoing Mercosur negotiations.
Expected impacts
Before commenting on the results, a few caveats should be noted. Firstly, it should be mentioned that the output of the European beef sector is not homoge-nous, and the impacts in the sector will be dependent on the detailed outcomes of the ne-gotiations, notably with respect to the treatment of high-value cuts versus other segments of the sector. As the modelling approach used here, does not assume any changes in the 81 European Commission Regulation (EU) No 101/2013. 82 As noted by the American Meat Institute (2013), most US facilities use an anti-microbial wash of some kind to reduce mi-
crobial counts and pathogen numbers on carcases. The EU ban, when imposed, thus meant that certain units within a slaughterhouse facility had to be turned off for production of carcases and offal items for the EU market and then turned back on for production aimed at the US market.
83 Canada was granted a tariff rate quota of 50,000 MT as part of CETA. 84 As for other sensitive products, tariffs are further assumed to be reduced by 50%. However, as the tariff rate quotas are as-
sumed to be binding, the expanded quota is what matters. A cut in tariffs for beef is thus irrelevant for the domestic indus-try, as the binding constraint is the quota itself. Indeed, given the low trade volumes, this also has basically no impact on quota rents either.

TTIP impact in Ireland
62
composition within the beef sector as a result of TTIP, the results may be under or overes-timated, depending on whether the expansion of quotas will change the composition of products, for example between high value cuts and low value cuts. We have no prior infor-mation about how the quotas will be composed. Secondly, a recent study by the European Parliament85 points to the possibility of under-estimating the import elasticity in the sector due to e.g. the joint production with dairy products, which may result in an underestimation of the import elasticity. The study from the European Parliament discusses the risk of underestimating the impact of trade liber-alization because of using a too low import elasticity (i.e. how much imports responds to price), which was estimated to be around -5 by simulations according to estimates from DG Agriculture (i.e. a tariff cut of 20 % leading to an increase of imports by 100 %, see McAleese et al., 2006). We agree that this concern is relevant in general, but in the simu-lations reported here we use an import elasticity of -7, and we are thus erring on the high side when predicting the import increases following from TTIP compared to the estimate from DG Agriculture of -5. Another concern arises because meat supply from dairy herds (which is predominant in most of continental Europe) is relatively inelastic, whereas meat from the suckler-cows which only produces meat (as is predominant in Ireland,) is more elastic (i.e. quantities responds more to price changes). The concern is that suckler cows could bear more of the adjustment costs (European Parliament, 2014). With these caveats in mind, the results are shown in Table 6.3. Our simulations looks at the current composition of the Irish beef sector and we provide an overall estimate of the average impact of TTIP on the sector. Without detailed infor-mation on the exact specification of the outcome of an eventual relaxation of the quotas for the EU’s imports of beef from the US, the most appropriate scenario is an average ef-fect based on the current composition of production and exports to the specific markets.
Table 6.3 Simulated impacts in bovine meat and cattle (percent
changes) Output and trade effects Output value Export value Import value
Scenario 1 -1.7% 2.2% 21.4%
Scenario 2 -3.2% -0.8% 34.3%
Employment effects Low skill Middle skill High skill
Scenario 1 -2.3% -2.0% -1.9%
Scenario 2 -3.8% -3.5% -3.4%
Source: Copenhagen Economics based on CGE-simulations by Prof. J.F. Francois 2014.
Under Scenario 1, where we assume an increase of 50.000 metric tons in US quotas on the EU market, the value of exports are expected to increase by 2%, equivalent to €35 mil-lion based on 2013 data. The value of imports are expected to increase by just over 20%,
85 European Parliament study (2014): Risks and opportunities for the EU agri-food sector in a possible EU-US trade agree-
ment.

TTIP impact in Ireland
63
equivalent to €78 million based on 2013 data. As a result, the value of output of Irish bo-vine meat and cattle is expected to decrease slightly by 1.7%. The 2% increase in the value of total exports are composed of a reduction in exports to the EU, equivalent to 4% of the total value or €61 million based on 2013 data, and an increase in exports to the US and other countries, equivalent to 6% of the total value or €96 mil-lion based on 2013 data. The first of these effects arise as Irish bovine meat and cattle ex-porters are faced with increased competition from US exporters on the EU market. The latter is a combination of reduced trade barriers on the US market and a diversion of ex-ports towards third markets in response to increased competition on the EU market.86 It is worth noting, that in terms of volume effects, we actually see an increase of 2% in the output of Irishbovine meat and cattle, cf. Table 6.4. However combined with a reduction of 0.1% in prices, the value of total output is expected to decline by the aforementioned 1.7%. In terms of changes to exports, when measured in terms of volume, the pattern is much the same as above, albeit with a slightly higher increase in exports to the US and third countries.
Table 6.4 Changes in Irish bovine and cattle exports by destina-
tion (%)
VALUE VOLUME
Scenario 1 Scenario 2 Scenario 1 Scenario 2
Irish exports, % change 2.2% -0.8% 2.3% -0.8%
EU portion of total -3.7% -6.9% -3.7% -7.0%
RoW share of total 5.9% 6.1% 6.0% 6.2%
Irish output, % change -1.7% -3.2% 2.3% -0.8%
Source: Copenhagen Economics based on CGE-simulations by Prof. J.F. Francois 2014.
Under Scenario 2, where we assume an increase of 75.000 metric tons in US quotas on the EU market, the increased US competition on the EU market intensifies and outweighs the increase in exports to the US and third markets. The overall result is thus a slight de-crease in the value of total exports of 0.8% (cf. Table 6.3), equivalent to €14 million based on 2013 data. The reduction in the value of exports to the EU market is equivalent to 7% of the value or €112 million based on 2013 data, while the combined increase in exports to the US and third markets is equivalent to 6% of the total value or €98 million based on 2013 data. The value of imports under this scenario is expected to increase by 34% (cf. Table 6.3), equivalent to €125 million. Combined with the fall in exports, this is expected to result in a 3% reduction in the value of output. This is in turn composed of a decrease of 0.8% in the volume of output and a reduction in prices of 0.1%.
86 We do not model different prices to different destinations. The Irish export price is modelled as a price to the world.

TTIP impact in Ireland
64
The reduction in the output will, under both scenarios, lead to a reduction of employment for all skill groups as shown in Table 6.3 (cf. Section 2.9 for a discussion of sectoral em-ployment effects). Again, it should be noted that we do not take into consideration, the segmentation of the beef market into high- and low-value cuts. If US beef exports to the EU market are cen-tred predominantly around high-value cuts, the results presented here may underesti-mate the import competition that Irish beef exporters will face on the EU market and could thus underestimate the contraction in output, depending on the extent to which in-creases in exports of high-value cuts to the US would compensate.
Other agri-food In 2013 Ireland exported approximately €1.8 billion and €4.3 billion worth of primary ag-ricultural products87 and processed foods88 respectively. The corresponding figures for im-ports are €1.7 billion and €2.8 billion of primary agricultural products and processed foods respectively. Most trade in primary agricultural products and processed food is with the EU and the UK. For primary agricultural products more than 75% of both imports and exports origi-nate in or are sold to the EU, with the UK being responsible for approximately half of this. For processed foods the picture is slightly different with the EU26, the UK and the rest of the world (excl. the US) each receiving approximately 30% of Irish exports in this sector, while 8% is destined to the US, cf. Figure 6.3. In monetary terms, exports of primary agricultural products to the US equalled approxi-mately €30 million in 2013, while exports of processed foods to the US approximated €350 million in the same year.
87 The primary agriculture sector (also called ‘agriculture, forestry and fisheries’) in the model includes the following: Paddy
rice; Wheat; Cereal grains nec; Vegetables, fruit, nuts; Oil seeds; Sugar cane, sugar beet; Plant-based fibers; Crops nec; Ani-mal products nec; Wool, silk-worm cocoons; Forestry; Fishing; Meat products nec; Processed rice.
88 In the model simulations, the processed foods sector include the following: Manufacture of vegetable and animal oils and fats; Manufacture of sugar; (remainder) Manufacture of food products; Manufacture of beverages; Manufacture of tobacco products. This sector does not include beef or dairy products since these products are included in dairy and beef sectors respectively. This also means that milk is not part of this sector.

TTIP impact in Ireland
65
Figure 6.3 Trade in primary agricultural products and pro-
cessed food
Note: ROW is the Rest of the World. The figure is based on the sectoral distribution from the GTAP data for
2011 applied to the total exports of goods from Ireland in 2013.
Source: Copenhagen Economics based on 2013 CSO data and GTAP data.
Reduction of trade barriers to transatlantic trade
NTBs arise because of regulatory differences, which give rise to additional costs for ex-porters compared to domestic producers. The regulatory differences that gives rise to these additional costs for exporters stem from a number of sources including certification requirements, labelling and packaging requirements, product standards and traceability requirements. In the primary agricultural production and processed foods sectors NTBs are generally high. According to the estimates of CEPR (2013) the NTBs for EU exports to the United States in the food and beverages sector is 73%. The corresponding figures for US exports to the EU are 56.8%.89 Tariffs are also generally high in this sector, which are subject to tariff peaks. Therefore trade weighted tariff estimates may underestimate the true tariff barriers in the sector since barriers on some products are so high that trade in some product groups in this sec-tor is almost non-existing. Due to relatively high tariffs as well as non-tariff barriers there is a significant potential for reduction of barriers to trade. Yet it is too early to say what measures will be included in the TTIP in relation to Tariffs and NTBs affecting the primary agriculture production and processed foods sectors.
Expected changes
The TTIP is expected to increase Irish exports of processed foods by approximately 2%. Relative to total exports of processed foods in 2013, this is equivalent to an increase of
89 The CEPR study uses same NTB estimate for primary food and processed foods, and we are bound to use the same assump-
tions to ensure consistency with the EU-wide assumptions.
EU EUEU EU
UK
UK
UK
UK
USA
USA
USA
USAROW
ROWROW
ROW
0%
10%
20%
30%
40%
50%
60%
70%
80%
90%
100%
Exports Imports Exports Imports
Primary Processed

TTIP impact in Ireland
66
around €94 million. In comparison, Irish imports of processed foods are expected to in-crease by around 3%, equivalent to €84 million using 2013 data. While this sector is ex-pected to increase slightly in terms of output, the expectation is that employment will de-crease slightly as a result of increased productivity. In the primary sector we expect a small decrease in exports just over 1%, while imports are expected to increase by approximately 3-4%, most of which will come from the US. Relative to trade levels in this sector in 2013, the reduction in exports is equivalent to €20 million, while the increase in imports is equivalent to €64 million. Overall, output in the primary production sector is expected to contract somewhat reducing employment by ap-proximately 2% across skill groups (cf. Section 2.9 for a discussion of sectoral employ-ment effects).
Table 6.5 Expected changes in primary production and pro-
cessed foods Output and trade effects Output Exports Imports
Processed +0.3% +2.1% +3.0%
Primary -1.6% -1.2% +3.7%
Employment effects Low skill Middle skill High skill
Processed -0.7% -0.1% -0.0%
Primary -2.1% -1.9% -1.9%
Source: Copenhagen Economics based on CGE-simulations by Prof. J.F. Francois 2014.

TTIP impact in Ireland
67
Chapter 7
Impact on FDI and SMEs in Ireland
One feature of the Irish economy is that, relative to other EU members, foreign direct in-vestment (FDI) plays a large role. In the context of TTIP, this plays an important role for two reasons. First, multinationals tend to export more often and in greater volumes than non-multinationals. Second, the distribution of multinationals is not even across sectors. Thus, to estimate the impact of TTIP on Irish-owned firms, one must account for the dif-ferences in ownership across sectors as well as the differential TTIP sector effects.
Current US FDI in Ireland As the results in Chapter 2 indicate, TTIP is expected to have a larger effect on Ireland rel-ative to other EU members due to the remarkably international focus of the Irish econ-omy. In addition to being very open to trade, the global economy features large in Ireland through foreign direct investment (FDI). Although Ireland’s outbound FDI (investment in other countries by Irish firms) is growing (see Brennan and Verma, 2013, for discussion), it is vastly outstripped by Ireland’s inbound FDI. According to the CIA Factbook (CIA, 2014), in 2013 Ireland was the eleventh largest host of FDI with just over $777 billion of total inbound investment. When measured relative to population, Ireland rises to the top of the rankings, second only to Hong Kong. Therefore it is important to understand the potential of TTIP in relation to the distribution of activity between Irish and foreign-owned firms and possible changes in the level of FDI. Since roughly one quarter of FDI in Ireland comes from the US, this is particularly true for TTIP which directly affects trade between the US and the EU. Drawn by Ireland’s skilled work force, ease of doing business, proximity to the European market, and attrac-tive tax regime (particularly in conjunction with the US tax system), Ireland is the third largest recipient of US FDI (Quinlan, 2013). In particular, US firms in the IT, pharmaceu-ticals, and financial and business sectors have found Ireland an attractive location for in-vestment. As noted above, American FDI dominates investment in Ireland. In a recent overview of companies in Ireland based on firms’ statutory filings, of the ten top earning foreign affili-ates in Ireland, eight were American.90 In the aggregate, US multinationals accounted for 74% of Irish inbound FDI in 2012 (American Chamber of Commerce, 2014). Furthermore, this investment employed an estimated 115,000 workers and was responsible for over a quarter of Irish GDP. Thus, there is no overstating the importance of US FDI for the Irish economy.
90 Based on data from statutory filings for the top 1000 firms in Ireland collected and analysed by the Irish Times. For more
information on the methodology see http://www.top1000.ie/content/methodology.

TTIP impact in Ireland
68
When describing the reasons behind this phenomenal level of investment, tax policy gets the most discussion. The 12.5% Irish corporate tax rate is undeniably an attractive fea-ture, particularly in conjunction with US tax regulations such as deferral which provide US firms with effective tax planning strategies. This focus on taxation issues, however, ignores the many other attractive features of the Irish economy. Indeed, as there are other locations with even more attractive tax regimes than Ireland’s, these other benefits of locating in Ireland must play a major role in the lo-cation decision; otherwise firms would choose to locate in countries such as Bermuda where the corporate tax rate is zero. As additional evidence of this, in a survey carried out by the World Bank (World Bank, 2002), local taxes were ranked as ‘very influential’ in the location decision by only 24% of firms. In contrast, three oft-cited attractions of Ireland were more often ranked as very influential: the ability to hire skilled workers (32%), the ease of doing business (54%), and access to customers (77%). Beginning with the first of these, Ireland has a young, highly-skilled, English-speaking workforce, all of which are drivers of international investment patterns. According to the OECD (OECD, 2013), Ireland ranks third (behind South Korea and Japan) in terms of the percentage of 25-34 year olds with a tertiary degree. This provides a workforce with the talent needed in the high-tech industries US multinationals invest in. Further, the com-mon language shared by the US and Ireland makes coordinating these skilled workers particularly easy for US firms. Finally, there is no denying the ease of doing business cre-ated by the strong cultural ties between the two nations which resulted from centuries of Irish migration. This ease of doing business is an overarching aspect of investment in Ireland. In the most recent World Bank Doing Business report (World Bank, 2013), Ireland was ranked as the fifteenth easiest country in which to operate. This strong ranking was due to the ease of setting up a new business, its simple tax code, and the strong investor protection in Ire-land. Given that the majority of firms surveyed by the World Bank (2002) indicated that the ease of doing business was a very important factor when choosing a location, Ireland’s success in attracting investment from both the US and the rest of the world becomes clear. Finally, a particular attraction for US firms is Ireland’s ability to serve as an export plat-form; that is, to use the Irish affiliate to export from Ireland to the rest of the EU and back to the US. The exports by US subsidiaries in Ireland totalled over $100 billion in 2012 (American Chamber of Commerce, 2014), a figure which accounted for roughly 75% of their total sales. This was enough to make Ireland the top-exporting host of US FDI in 2010 (Quinlan, 2013). In particular, this is due in no small part to the role of service ex-ports by US affiliates in Ireland. Indeed, services play an unusually large role in the Irish-US trade relationship where, in contrast to what is typically found, services trade domi-nates goods trade. In 2011, Quinlan (2013) found that US service exports to Ireland to-talled $28.3 billion, a figure four times the size of US goods exports to Ireland. Given the focus of US multinationals in Ireland on service sectors such as IT and business services, this is not surprising.

TTIP impact in Ireland
69
The primary destination for these exports, be they goods or services, are the rest of the EU and the United States. In particular, for the exports back to the US, nearly 90% are classi-fied as ‘related trade, that is, exports from the affiliate back to its US parent. In contrast, only one-third of US exports to Ireland are classified as such (Quinlan, 2013). This indi-cates the role that Ireland plays as an input into the global production chain of US multi-nationals. Combining all of the features, it therefore seems only natural that Ireland is a major desti-nation for US investment. What makes this relationship truly remarkable, however, is not just the volume of investment but its resiliency. During 2008-2012 when the economic crisis was at its height, US firms still invested in Ireland. In fact, the nearly $130 billion in investment during those five years was more than in the previous 58 years combined (Quinlan, 2013). During 2013, this investment slowed somewhat, growing by only 1%. Nevertheless, this slight growth occurred during a period when US investment in the EU as a whole shrank by 17.5%, a contrast that clearly highlights the stability of the US-Irish investment relationship. Thus, there is no denying that foreign investment, and that from the US in particular, fig-ures large in the Irish economy, both in terms of sales, employment and trade. As such, it is important to interpret the predicted effects of TTIP for employment and exports.
Results broken down by foreign vs domestic-owned
firms As discussed in earlier chapters, the elimination of trade barriers as a result of TTIP is ex-pected to have significant effects on trade patterns. In particular, sectors such as electrical machinery and pharmaceuticals are anticipated to expand output and exports whereas others, particularly agri-food, are expected to contract. This, combined with the ability to more easily source inputs from the US, will shift employment across sectors in the Irish economy. Although this is expected to increase the size of the overall Irish economy, be-cause a large part of economic activity is owned by foreign nationals via FDI, it is im-portant to understand the extent to which these changes are enjoyed by indigenous, Irish-owned firms relative to foreign-owned ones. As a first step in this direction, Table 7.1 shows the 2011 shares of employment and ex-ports for Irish-owned and foreign-owned firms (unfortunately, data broken down by own-ership of FDI was not available).91 As can be seen, some sectors are essentially entirely
91 The shares in were constructed from two sources. The bulk of the data came from the Irish Census of Industrial Production
(CIP), an annual census of manufacturing, mining, utilities and some services, which is carried out by the Central Statistics Office. These data cover plants and firms with three or more employees and thus cover the vast majority of economic activ-ity. Within this data, primarily in the service industries, there was censoring due to confidentiality issues. In addition, due to the need to maintain confidentiality, the only data made available to us was for firms with at least 20 employees and were aggregated across some of the sectors used in our analysis. Thus, for most of the service sectors, we turned to the data pro-vided by Forfás, a policy advisory body for firms in Ireland. Specifically, this was done for Air transport, Water transport, other transport, Finance, Insurance, Business ICT, Communications, Construction, and Personal services. This data was not subject to such censoring but only included client firms of various Irish development agencies, a group in which large and foreign-owned firms are more likely to appear. Thus, in particular for Finance, Insurance, and Business ICT, the infor-mation in Table 1 must be interpreted subject to the caveats imposed by the data available to us. Finally, note that neither source provided export data for Water Transport. The data used from both sources was for 2011 to match that in the CGE analysis.
TTIP impact in Ireland
70
Irish-owned (beef and dairy for instance) meaning that changes at the sector level will ac-crue entirely to Irish firms. As hinted at above, however, other sectors such as pharma-ceuticals, electrical machinery and business services are heavily foreign-owned. As such, the anticipated changes TTIP would cause in these sectors will only partially accrue to the Irish-owned part of the economy. In addition to the differences in employment in foreign owned companies across sectors, Table 7.1 illustrates that, as has been well documented, multinational firms are more likely to export than domestically owned firms even after controlling for sector and other firm characteristics.92 This can be seen in Table 7.1 by the fact that, in nearly every case, the share of exports attributable to foreign firms exceeds their employment share. This difference is particularly noticeable in Processed Foods, where multinationals employ 20 % of workers but account for nearly 70% of exports. Wood, Paper and Publishing, Busi-ness, Professional, and ICT services, Insurance, and Pharmaceuticals show a similar con-centration of exports in foreign-owned multinationals. On the other hand, although for-eign firms in the Finance industry account for the majority of that sector’s exports, they export less per worker than their Irish counterparts. With this in mind, the changes caused by TTIP will only partly accrue to Irish firms. For example, if TTIP leads to an additional 100 workers employed in the Electrical Machinery sector, holding the shares of Table 7.1 the same, we would expect that 17 of them would find employment in an Irish firm whereas 83 would be employed by a foreign-owned firm. Likewise, for every €100 of additional exports in this sector, we would expect €4 to be done by an Irish firm and €96 of those to be done by a foreign-owned firm. In contrast, in Beef, all of the additional hiring and exporting would be done by Irish firms.
92 See McCann (2011) for an example of this using Irish manufacturing data.

TTIP impact in Ireland
71
Table 7.1 Employment and export shares by ownership Sector name Employment share Export share
Irish Foreign Irish Foreign
Primary production 94.4 5.6 91.7 8.3
Beef 100 0 100 0
Dairy 100 0 100 0
Processed Food 80.1 19.9 30.3 69.7
Energy and Petrochemicals 97.8 2.2 100 0
Pharmaceuticals, chems 29.2 70.8 3.5 96.5
Electrical Machinery 17.1 82.9 4.1 95.9
Other machinery 56.2 43.8 41.8 58.2
Motor Vehicles 44.5 55.5 17.1 82.9
Other transport equipment 53.4 46.6 100 0
Metals 87.7 12.3 57.9 42.1
Wood, paper, publishing 75.9 24.1 36.4 63.6
Other Manufacturing 40.4 59.6 8.2 91.8
Air Transport 100 0 100 0
Water Transport 100 0 . .
Other Transport 85.8 14.2 27.1 72.9
Finance 20.5 79.5 25.9 74.1
Insurance 58.3 41.7 14.4 85.6
Business, Professional, ICT 38 62 4.3 95.7
Communications 100 0 100 0
Utilities and Construction 100 0 100 0
Personal 99.6 0.4 99.8 0.2
Other Services 93.1 6.9 100 0
Source: Estimates by Prof. Ron Davies based on CSO and Forfas data.
Adding up these changes across sectors (taking into account the share of total exports at-tributed to each sector), we can break down the economy-wide growth in exports from TTIP into those attributable to Irish firms and those attributed to foreign firms.93 Table 7.2 reports the results from this exercise for the baseline scenario.
Table 7.2 Export changes by ownership (% changes) Irish export change Non-Irish export change
Main scenario 0.34 3.50
Source: Estimates by Prof. Ron Davies based on CSO data.
93 Specifically, for the Irish-owned firms, in each sector, we multiplied the sector-specific growth of exports, the share of that
sector in aggregate exports, and the share of the sector’s exports by Irish firms. This was then added across sectors to arrive at the results in Table 7.2. A comparable process was done for the foreign-owned firms.

TTIP impact in Ireland
72
As this indicates, in the baseline scenario for trade liberalization, the majority of export growth is attributable to foreign-owned firms, where the increase in exports is anticipated to be roughly ten times that of the Irish-owned firms.94 This occurs for two reasons. First, in over half of the sectors, foreign firms account for the majority of exports. Second, and more importantly, the expected effects of TTIP are not equal across sectors. In the main scenario, three sectors with the greatest expected export growth rates – Electrical Ma-chinery, Insurance, and Pharmaceuticals – are all heavily dominated by FDI-produced ex-ports. On the other hand, in six of the eight sectors where all exports are produced by Irish firms (a group that includes beef), exports are expected to fall as a result of TTIP. Thus, the combination of the fact that exports in most sectors are driven by foreign firms and that those are the sectors that are expected to see the biggest increases in trade re-sults in the majority of the increase in exports being attributable to foreign-owned firms. Nevertheless, in each scenario there is an anticipated increase in exporting by the Irish-owned part of the economy. Further, as we move from scenarios least promising for beef towards those most promising, the relative increases in exports shifts in favour of Irish firms. This is because beef is essentially an entirely Irish owned sector. As such, assuming larger increases in beef exports both increases Irish-owned exports by assumption and re-sults in a smaller shift from Irish dominated to foreign dominated sectors. In addition to changes in exporting, TTIP is expected to have important effects on em-ployment across sectors. The economy-wide changes in employment in Irish and foreign-owned firms is shown in table 7.3. These changes are estimated just as the results in table 7.2, i.e. by combining the predictions for each sector, the size of that sector in overall em-ployment, and the share of Irish/foreign employment in each sector. Results are reported for each of the three skill categories.95 Because the simulations assumed full employment in equilibrium, the employment changes in Irish and non-Irish firms should add up to zero (before rounding). Put differently, this assumption means that there is not a change in the overall employment of, say, low-skill workers, just a change in the nationality of their employer.
Table 7.7.3 Employment changes by ownership (% Changes) Low skill Middle skill High skill
Irish-owned
Non Irish-owned
Irish-owned
Non-Irish owned
Irish-owned
Non Irish-owned
Main scenario -0.27 0.28 -0.06 0.06 -0.07 0.07
Source: Estimates by Prof. Ron Davies based on CSO and Forfas data.
From this analysis, two results come through. First, just as there is a relative shift in ex-porting towards that by foreign firms, there is an overall shift in employment patterns from Irish-owned firms towards foreign-owned ones. This occurs as workers move into those sectors that expand as a result of TTIP, sectors where exports dominated by foreign firms. This gives a further indication of the differences in TTIP’s impact across sectors for
94 In the additional scenarios with greater trade liberalization in Agri-food, comparable results were found. 95 In doing so we assume that the share of employment in each skill category is the same as that sector overall; i.e. if FDI ac-
counts for 75%of employment in a sector, then it accounts for 75% of low-skill employment, 75% of middle-skill employ-ment, and 75% of high-skill employment.

TTIP impact in Ireland
73
Table 7.2’s numbers on expected export changes. Secondly, the percentage employment change in Irish-owned and Non-Irish owned at -0.27 and +0.28 respectively is 3 times higher in the low-skill category than in the middle or high skill category of workers. This reflects the CGI model predictions for the beef sector, for example, which has relatively more low-skill workers.96 It is important to remember that these predictions are based on the assumptions of the exercise. In particular, it assumes that there is no change in the overall labour supply. If, as is expected, the labour supply expands then the increased need for workers in TTIP-expanding sectors need not be met through reductions in em-ployment elsewhere. In addition, the exercise does not consider other changes in the eco-nomic environment such as other policy initiatives promoting Irish-owned sectors such as beef or dairy, initiatives which may offset TTIP’s effects. Combining these results paints a clear picture – that the changes likely to be wrought by TTIP in the overall Irish economy will tend to shift activity towards foreign-owned firms. There are several reasons for the overall positive impact of TTIP. The first reason is that our results show that even as overall Irish exports rise, this is done with fewer workers, meaning an increase in the productivity and competitiveness of Irish firms. Indeed, since increased productivity is linked to higher wages and our analysis finds that real wages rise for all skill categories, this productivity boost works to the bene-fit of the Irish worker. In particular, despite the relatively large shifts in who employs them, our estimates suggest that low-skill Irish workers have the most to gain. Further-more, there is an increasing body of evidence showing that trade liberalization improves aggregate productivity by shifting economic activity to the most productive firms. Alt-hough such firm productivity differences are not part of our analysis, one place such a shift would be seen would be in real wages. If TTIP shifts activity to more productive firms, this rise in productivity would be associated with a rise in real wages beyond that in our analysis. Another benefit is that there is growing evidence that FDI provides productivity benefits to indigenous firms by bringing in new technology, business practices and linkages to global markets.97 As such, a shift in activity towards foreign-owned firms may come with yet another productivity boost for the Irish firms, improving their profitability and the wages they pay. Thus, TTIP’s reduction of trade barriers is likely to increase the globaliza-tion of the Irish economy, which can be a positive thing for Irish workers and indigenous firms. Finally, it is important to recognize that the above results are dependent on, among other assumptions, the presumption that the shares of Irish and foreign activity within each sector will not change due to TTIP. As discussed in Section 2.3, SMEs may be particularly apt to increase exports after TTIP’s implementation. In particular, Fontagné, Orefice, Piermartini, and Rocha’s (2013) results suggest that SME exports may be as much as 50 times more sensitive to NTBs as their larger competitors. Turning back to Ireland, their
96 It should be noted that these changes come during a period of change in employment by US FDI in Ireland. Despite increas-
ing overall employment, during the decade starting in 2000, US multinationals’ employment in Irish manufacturing de-creased by 11,500 to 55,000 workers. Quinlan (2013) attributes this to increasing automation. Thus, due to technological change there may be other employment challenges for low-skill workers, a trend beyond the scope of our analysis.
97 See Görg (2007) for an overview of this evidence, including a review of that specific to Ireland.

TTIP impact in Ireland
74
results suggest that, because indigenous Irish firms tend to be much smaller than their foreign-owned counterparts, Irish firms may experience a larger increase in exports then foreign firms. Thus, the above results may well be ‘worst case’ estimates. In fact, if SME exports do increase in response to trade liberalization, this may increase the benefits pro-vided by programs such as Enterprise Ireland which specifically works with Irish SMEs looking to expand into global markets. In particular, given Enterprise Ireland’s extensive experience in the US, this body may play a key role in TTIP-driven export expansion by Irish-owned firms. In an examination of the sensitivity of the baseline results to the differential response of SMEs to trade liberalization, in alternative estimates, we assumed that the French esti-mates for agriculture held for all Irish industries, that all Irish firms count as SMEs and that all foreign firms are large by the Fontagné, et al. definition. This resulted in larger ex-port increases attributable to Irish firms and somewhat smaller declines in the share of employment by Irish firms. Nevertheless, the results were very similar to those above – i.e. most of the export increases come from foreign firms and their employment rises while Irish firm employment falls in the aggregate. This is because, as noted above, the within-sector changes are dominated by the cross-sector shifts that favour foreign-domi-nated industries.
Trade liberalisation and changes in FDI in Ireland As noted above, the estimates for the changes of the Irish and foreign-owned activities were made assuming that, within each sector, the relative sizes of the two groups re-mained constant. In addition to the potential for larger responses by smaller companies, this may not hold if TTIP affects the level of FDI and in particular that coming to Ireland from the US. On the one hand, one might worry that the reduction in trade barriers would reduce the attractiveness of Ireland as an export platform because it becomes easier for potential American investors to export directly to the EU market rather than via FDI in Ireland. This could therefore lower inbound Irish FDI. On the other hand, as trade barri-ers decline this may spur additional investment because it becomes less costly for firms to utilize Ireland as a link in their global supply chains. Given the importance of FDI, and American FDI in particular, to the Irish economy, it is important to be aware of likely changes in overall FDI levels. In this regard, the literature on the determinants of FDI paints a very clear picture – namely that lowering trade barriers tends to increase FDI. This effect operates through three channels. First, there are the barriers that impede goods and services from entering the host country. As discussed in the overview of Blonigen and Piger (2011), the vast ma-jority of studies find that FDI rises as it becomes easier for imports to enter the host coun-try. This is consistent with the idea that as trade becomes easier, affiliates in the host be-come more productive as a part of a multinational’s worldwide operations. As such, when TTIP lowers the barriers for goods and services moving from the US to Ireland, invest-ment from the US to Ireland is expected to increase. The second channel concerns trade barriers into the source country for FDI. Again, the evidence indicates that as trade barri-ers into the source country fall, FDI goes up. This is because easier trade facilitates coop-eration between the affiliate and the parent company, increasing output in both. In the

TTIP impact in Ireland
75
context of FDI from the US into Ireland, this is particularly important since over 90% of exports to the US by these multinationals are sold to the US parent company (Quinlan, 2013), suggesting the potential for a large increase in US FDI in Ireland. Combining these two effects suggests that as TTIP lowers trade barriers between the US and Ireland, it will increase FDI between the two nations. The third channel in which TTIP can have an effect is the export platform story in which, for example, a US multinational invests in Ireland for the purpose of exporting to Europe. If TTIP makes it easier to serve the European market from the US, this could potentially reduce the need for the Irish affiliate. Alternatively, if the Irish and American portions of the firm’s global operations complement one another (such as if the Irish affiliate pro-vides customer support services for goods made in the US), then TTIP could increase the incentive for investment in Ireland. Turning to the data, the evidence again indicates that the FDI-increasing effects are the dominant influence. In a study by Blonigen, Davies, Waddell and Naughton (2007) that considers US investment into the European OECD countries, declines in trade barriers were significantly linked to higher FDI, even after controlling for factors such as US investment in other locations (which itself has a negligi-ble impact). Thus, their estimates suggest that a reduction in trade barriers via TTIP would be most likely to spur additional US investment in Ireland. Davies and Guillin (forthcoming) focus on US-owned FDI in services and find a similar result. Therefore the data suggests that the export platform effect is likely to bolster the other FDI-increasing effects resulting from TTIP. It is worth noting that this third effect may also increase the attractiveness for Ireland as part of the global supply chain for multinationals headquar-tered elsewhere in the EU as well as from countries not participating in TTIP, further in-creasing inbound FDI as well as diversifying it. Thus, rather than lowering the presence of FDI (including that from the US) in Ireland, it is more likely that TTIP will increase FDI activity in Ireland. Although, similar to the above results stemming from the TTIP’s cross-sector effects, this may shift a greater share of economic activity into foreign-owned multinationals, this has the potential to benefit the overall Irish economy due to increased wages and productivity spillovers. Finally, a related limitation of our study is that just as we assume that relative FDI levels are unchanged, we do not consider emigration of workers or the potential impacts of TTIP on labour migration. In particular, the increase in real wages for all skill categories may reduce the outflow Ireland has experienced in the wake of the crisis. Given the predicted increases in real wages for low-skill workers, this may be important. Indeed, a recent study conducted by the Economic and Social Research Institute found that Irish emigra-tion during the recent crisis was focused among workers without a leaving certificate (Duffy et al, 2013). As a result TTIP may work to stem the outflow of such workers.
Impact of investment liberalisation in TTIP While the above analysis points to the need to recognize the role of multinationals in in-terpreting the potential Irish impacts of TTIP, it also highlights a limitation of the analy-sis, namely, that it does not account for potential effects of TTIP on foreign investment in

TTIP impact in Ireland
76
Ireland. On the one hand, one might worry that the reduction in trade barriers would re-duce investment in Ireland (particularly by American firms) as it becomes easier for po-tential investors to export directly from the US. On the other hand, as trade barriers de-cline it may spur investment because it becomes less costly for firms to utilize global sup-ply chains. Which effect dominates is a somewhat open question, however, the evidence provided by Blonigen, Davies, Waddell, and Naughton (2007) suggests TTIP’s trade liber-alization is likely to increase US FDI investment into Ireland. This, combined with the trade promotion effects in the current study, suggests that the results of our analysis may well act as a lower bound on the potential growth of employment and trade by foreign-owned firms. Investor protection and investor-state dispute settlement Foreign direct investment is a main contributor to economic growth. It creates jobs, in-creases productivity by allowing the transfer of technology, skills and knowledge, and it can boost trade. The EU is a large foreign investor with outward extra-EU stocks of FDI amounting to €5.2 trillion by 2012 while EU inward stocks (extra-EU) accounted for €3.9 trillion in the same year according to Eurostat. The purpose of bilateral investment treaties (BIT) is to promote and protect foreign in-vestments. The central element of a BIT is that it provides a minimum level of protection for foreign investors. BITs establish the terms and conditions for investment by nationals and companies of one country in another and set up a legally binding level of protection in order to encourage investment flows between two countries. Amongst other things, BITs contain provisions that grant investors fair, equitable and non-discriminatory treatment, protection from unlawful expropriation and adequate and effective compensation in cases of expropriation, free transfers of funds and direct re-course for investors to international arbitration. Since investment is usually defined in a broad, asset-based manner, protection also extends to intellectual and industrial property rights. BITs may grant “national treatment” to investors and their investments (terms no less fa-vourable than those that apply to domestic investors) and may include a clause on “most-favoured-nation treatment” (terms no less favourable than those that apply to investors from third countries). EU states are the main users of BITs globally, with a total number of about 1200 bilateral treaties already concluded. One of the purposes of a BIT is to protect investments and investors in order to encourage investment flows between two countries. BITs can have positive effects beyond their main purpose such as acting as a trigger for domestic reforms to strengthen property rights or the rule of law and transparency, some-thing that is particularly relevant in countries where many investors complain about the lack of certainty and transparency. BITs can serve to de-politicise the resolution of invest-ment disputes insofar as they offer recourse to investor to state dispute settlement and
TTIP impact in Ireland
77
not only state to state disputes.98 Investor-state dispute settlement is an issue which is currently being debated in the EU and is not treated further in this report. Based on the available econometric and qualitative studies, we find that while BITs can be important instruments for the protection of investments, it is more uncertain how BITs impact the volume and destination of FDI. The econometric evidence on the relationship between BITs and investments is, in our view, mixed and without a clear consensus on the extent to which BITs should be expected to increase FDI.99 Based on the available evi-dence, we conclude that the investment protection element of BITs alone is unlikely in it-self to significantly increase FDI flows between the signatories. It is, however, the case that while the additional value to Ireland of a BIT would be low given the already high level of protection provided in law, there may be a case for a common floor of investment protection across the EU in terms of assurance for US investors in the EU, confirming openness to investment on the part of the Union. An agreement that reduces barriers to investment is likely to lead to significant increases in bilateral investments.
98 Aron Broches, the General Counsel of the World Bank with influence on the Convention on the Settlement of Investment
Disputes between States and Nationals of Other States (ICSID Convention), has emphasized the importance of depoliticisa-tion of international disputes via investor-state arbitration. See for example Broches (1995). See also Paulsson (1995) or Choi (2007) for further arguments.
99 Empirical findings are extremely sensitive to the estimation method, particularly when it comes to handling the possible endogeneity problem i.e. the possibility that BITs are signed when FDI flows between the signatories are already large and/or are expected to increase.

Glossary
This glossary contains the terms, abbreviations and acronyms used in the Study.
BIT Bilateral Investment Treaty
bn Billion
CEPR Centre for Economic Policy Research
CGE-model Computable General Equilibrium model
CSO Central Statistical Office, Ireland
DG TRADE European Commission Directorate General for Trade
EU European Union
FDI Foreign Direct Investment
FTA Free Trade Agreement
GDP Gross Domestic Product
GTAP Global Trade Analysis Project
MNE Multinational Enterprise
NTB Non-Tariff Barrier
HLWG High-Level Working Group on Jobs and Growth
ICT Information and Communication Technology
IDA Industrial Development Agency, Ireland
IPR Intellectual Property Rights
ISDS Investor-to-State Dispute Settlement
OECD Organisation for Economic Co-operation and Development
R&D Research and Development
SME Small and Medium sized Enterprise
SPS Sanitary and Phyto-Sanitary
TBT Technical Barriers to Trade
TTIP Transatlantic Trade and Investment Partnership
UK United Kingdom
US United States of America
WTO World Trade Organisation

TTIP impact in Ireland
79
References
American Chamber of Commerce, 2014. Fact Sheet http://www.amcham.ie/download/Am-Cham%20Fact%20File.pdf (Accessed 29 June 2014.)
Blonigen, B.A., R.B. Davies, G.R. Waddell and H. Naughton (2007). “FDI in Space: Spatial Auto-regressive Relationships in Foreign Direct Invest-ment,” European Economic Review, 51(5), pp. 1303-1325.
Blonigen, B.A., R.B. Davies, Glen R. Waddell and H. Naughton (2007). “FDI in Space: Spatial Auto-regressive Relationships in Foreign Direct Invest-ment,” European Economic Review, 51(5), pp. 1303-1325.
Blonigen, B.A. and J.Piger, 2011. "Determinants of Foreign Direct Investment," NBER Working Pa-
pers 16704, National Bureau of Economic Re-search, Inc.
Brennan, L. and R. Verma (2013). “Outward FDI in Ireland and its Policy Context” in Inward and
Outward FDI Country Profiles, editor(s) K.P. Sauvant, P. Mallampally and G. McAllister, New York, Vale Columbia Center, 2013, pp306 – 317.
Central Intelligence Agency. (2014) The World
Factbook. /library/publications/the-world-factbook (Accessed 29 June 2014)
Central Statistical Office (2013a), “Goods Exports and Imports”. Statistical release, 13th February 2013. http://www.cso.ie/en/media/csoie/releas-espublications/documents/external-trade/2012/gei_dec2012.pdf
Central Statistical Office (2013b), “International Trade in Services”. Statistical release, 30th Sep-

TTIP impact in Ireland
80
tember 2013. http://www.cso.ie/en/releasesand-publications/er/its/international-tradeinservices2012
CEPII (2013). “Transatlantic Trade: Whither Part-nership, Which Economic Consequences?,” CEPII Policy Brief NO 1, September 2013.
CEPR (2013). "Reducing Transatlantic Barriers to Trade and Investment," report to the European
Commission by Francois, J., M. Manchin,H. Norberg, O. Pindyu, and P. Tomberger; CEPR (London).
Copenhagen Economics (2013). “Effekter af frihan-delsaftaler for Danmark”. Rapport udarbejdet for Udenrigsministeriet, November 2013.
Central Statistical Office (2011): “Business in Ireland, 2011,” Central Statistics Office, Ireland.
Central Statistical Office (2012). “Census of Agricul-ture 2012 – Final Results,” Government of Ire-land.
Dairy Import Assessment (1). “Dairy Import Asses-ment,” United States Department of Agriculture. http://www.ams.usda.gov/AMSv1.0/dairyim-portassessment (Accessed 29 June 2014)
Davies, R.B. and A. Guillin. “How Far Away is an In-tangible? Services FDI and Distance,” forthcom-ing in World Economy.
Department of Agriculture (2013). “Annual Review & Outlook for Agriculture, Food and the Marine 2012/2013,” Department of Agriculture, Food and the Marine. Government of Ireland.
Department of Agriculture (2014a). “Fact Sheet on Irish Agriculture – July 2014,” Department of Ag-riculture, Food and the Marine. Government of Ireland.
Duffy, D., J. FitzGerald, K. Timoney, and D. Byrne (2013). Quarterly Economic Commentary, Win-ter 2013. Economic and Social Research Institute.
Ecorys (2009): “Non-Tariff Measures in EU-US Trade and Investment – An Economic Analysis,” Client: European Commission, Directorate-Gen-eral for Trade. December 2009.

TTIP impact in Ireland
81
European Commission (2013). Website for trade
policy. http://ec.europa.eu/trade/policy/in-fo-cus/ttip/
European Commission (2013), “Commission wel-comes the US Rule Announcement to bring the US legislation in line with international standards for BSE,” Press release database, European Commission.
European Commission. DG Trade, Market Access Database. http://madb.europa.eu/madb/index-Publi.htm (Accessed 29 June 2014)
European Commission (2014). The Transatlantic Trade and Investment Partnership, EU position
on chemicals. 2014
European Commission (2014). The Transatlantic Trade and Investment Partnership, EU position
on pharmaceuticals. 2014
European Commission (2014). Transatlantic Trade and Investment Partnership: The Opportunities for Small and Medium Sized Businesses, Brussels
Eucolait (2013). “Presentation at the High level Reg-ulatory forum on 10 April 2013,” European Asso-ciation of Dairy Trade.
Eucolait (2013a). “Eucolait position on the TTIP,” European Association of Dairy Trade. http://www.eucolait.be/positions-a-let-ters/14157-trade (Accessed 29 June 2014)
Enterprise Ireland (1). “Diary and Ingredients,” En-terprise Ireland, Government of Ireland. http://www.enterprise-ireland.com/en/Start-a-Business-in-Ireland/Food-Investment-from-Out-side-Ireland/Key-Sectors/Dairy-and-Ingredi-ents/ (Accessed 29 June 2014)
Felbermayr, G.J. and M. Larch (2013). “The Transat-lantic Trade and Investment Partnership(TTIP): Potentials, Problems and Perspectives” CESifo
Forum 2/2013 (June), pp. 49-60.
Fontagné, L., G. Orefice, R. Piermartini, and N. Ro-cha (2013). “Product Standards and Margins of Trade: Firm Level Evidence,” CEPII Working Pa-
per N°2013-06.
Foreign Agricultural Service (2013). “Dairy Tariff-Rate Import Quota Licensing Program,” Federal

TTIP impact in Ireland
82
Register. 6 June 2013. https://www.federalregis-ter.gov/articles/2013/02/06/2013-02530/dairy-tariff-rate-import-quota-licensing-program (Ac-cessed 29 June 2014)
FORFÁS (2013). “Annual Employment Survey 2012,” Department of Enterprise, Trade and Employ-ment (Dublin).
Francois, J., M. Manchin, and W. Martin (2013). "Market Structure in Multisector General Equi-librium Models of Open Economies," in Hand-
book of Computable General Equilibrium Model-
ing, P. Dixon and D. Jorgenson eds., North-Hol-land: Amsterdam.
Francois, J., H. van Meijl, and F. van Tongeren (2005). "The Doha Round and Developing Coun-tries," Economic Policy 20(42), 349–391
Francois, J., M. Manchin and P. Tomberger (2013). "Services Linkages and the Value Added Content of Trade," World Bank Policy Research Working
Paper 6432
Girma, S., H. Görg, and A. Hanley (2008). “R&D and Exporting: A Comparison of British and Irish Firms” Review of World Economics, 144(4), 750-773.
Görg, H. (2007). “Productivity Spillovers from Multi-national Companies,” in Perspectives on Irish
Productivity, Forfás.
Hertel, T. (2013). "Global Applied General Equilib-rium Analysis Using the Global Trade Analysis Project Framework," in Handbook of Computa-
ble General Equilibrium Modeling, P. Dixon and D. Jorgenson eds., North-Holland:Amsterdam.
IDA Ireland (2013), Annual report & Accounts 2012. www.idaireland.com
IEA (2011): “Top Exporters in Ireland and Northern Ireland 2011,” Irish Exporters Association.
Johnson, R. and C.E. Hanrahan (2010). “The U.S.-EU Beef Hormone Dispute,” CRS Report for Con-gress. Congressional Research Service.
The Irish Times Top 1000 Companies magazine, June 2012.

TTIP impact in Ireland
83
McCann, F. (2009). “Importing, exporting and productivity in Irish Manufacturing,” UCD Cen-
ter for Economic Research Working Paper,
09/22.
McCann, F. (2011). "The heterogeneous effect of in-ternational outsourcing on firm productivity," Review of World Economics (Weltwirtschaft-
liches Archiv), 147(1), pp. 85-108.
MoU (2009). “Memorandum of Understanding be-tween the United States of America and the Euro-pean Commission regarding the importation of beef from animals not treated with certain growth-promoting hormones and increased du-ties applied by the United States to certain prod-ucts of the European communities,” http://www.ustr.gov/sites/default/files/as-set_upload_file254_15654.pdf
Narayanan,B., A. Aguiar, and R. McDougall (2012). Global Trade, Assistance, and Production: The GTAP 8 Data Base, Center for Global Trade Anal-ysis, Purdue University.
O'Neill, B.C, T.R. Carter, K.L. Ebi, J. Edmonds, S. Hallegatte, E.Kemp-Benedict, E.Kriegler, L. Mearns, R. Moss, K. Riahi, B. van Ruijven, and D. van Vuuren (2012). “Final Report on The Nature and Use of New Socioeconomic Pathways for Cli-mate Change Research,” National Center for At-mospheric Research (NCAR).
OECD (2013). “Education at a Glance 2013: OECD Indicators”, OECD Publishing.
PwC (2014): “Creating the Future for Insurance in Ireland”. PricewaterhouseCoopers.
Quinlan, J.P. (2013). “The Irish-US Economic Rela-tionship 2013,” American Chamber of Commerce Ireland.
Quinlan (2013) “The Irish-US Economic Relation-ship 2013,” American Chamber of Commerce.
US Trade Representative (2014) “Memorandum of Understanding between the United States of America and the European Commission (…),” Of-fice of the United States Trade Representative. http://www.ustr.gov/sites/default/files/as-set_upload_file254_15654.pdf (Accessed 29 June 2014)
TTIP impact in Ireland
84
Van Egeraat, Chris and Barry, Frank (2009). The
Irish Pharmaceutical Industry over the Boom
and Beyond, For Irish Geography – Special Is-sue: Geographies of the Celtic Tiger
World Bank. (2002). “Foreign Direct Investment Survey,” Washington, DC: World Bank Group.
World Bank. (2013). Doing Business 2013. Washing-ton, DC: World Bank Group.