1830 ieee journal on selected areas in … · high-reliability topological architectures for...
TRANSCRIPT

1830 IEEE JOURNAL ON SELECTED AREAS IN COMMUNICATIONS, VOL. 22, NO. 9, NOVEMBER 2004
High-Reliability Topological Architectures forNetworks Under Stress
Guy Weichenberg, Student Member, IEEE, Vincent W. S. Chan, Fellow, IEEE, andMuriel Médard, Senior Member, IEEE
Abstract—In this paper, we consider the design of a physicalnetwork topology that meets a high level of reliability using un-reliable network elements. We are motivated by the use of net-works and, in particular, all-optical networks, for high-reliabilityapplications which involve unusual and catastrophic stresses. Ournetwork model is one in which nodes are invulnerable and linksare subject to failure—a good approximation for optical networkswith passive nodes and vulnerable fiber under stress of discon-nection—and we focus on statistically independent link failureswith initial steps taken toward generalization to dependent linkfailures. Our reliability metrics are the all-terminal connectednessmeasure and the less commonly considered two-terminal connect-edness measure. We compare in the low and high stress regimes,via analytical approximations and simulations, common commer-cial architectures designed for all-terminal reliability when linksare very reliable with alternative architectures which are mindfulof both of our reliability metrics and regimes of stress. We derivenew results especially for one of these alternative architectures,Harary graphs, which have been shown to possess attractive re-liability properties. Furthermore, we show that for independentlink failures network design should be optimized with respect toreliability under high stress, as reliability under low stress is lesssensitive to graph structure; and that under high stress, very highnode degrees and small network diameters are required to achievemoderate reliability performance. Finally, in our discussion of cor-related failure models, we show the danger in relying on an inde-pendent failure model and the need for the network architect tominimize component failure dependencies.
Index Terms—Link failures, network design, network reliability,physical network topology.
I. INTRODUCTION AND MOTIVATION
LOCAL-AREA NETWORK (LAN) design for applicationswhich demand very high levels of reliability is an impor-
tant research direction owing to the increase in the number ofsuch applications and the inability of typical commercial archi-tectures to meet their stringent reliability requirements.
Manuscript received March 30, 2004; revised August 3, 2004. This workwas supported in part by the Defense Advanced Research Projects Agency,“Robust Architectures for Multi-Service, Multi-Level Reliability, Multi-LevelService and Multi-Priority WDM Local Area Networks,” under GrantMDA972-02-1-0021; and in part by the National Science Foundation ITR/SY,“High Speed Wavelength-Agile Optical Networks,” under Grant 008963-001.This paper was presented in part at the Fourth International Workshop onthe Design of Reliable Communication Networks (DRCN 2003), Banff, AB,Canada, October 2003; and the 23rd Conference of the IEEE CommunicationsSociety (INFOCOM 2004), Hong Kong, March 2004.
The authors are with the Massachusetts Institute of Technology, Cambridge,MA 02139-4307 USA (e-mail: [email protected]).
Digital Object Identifier 10.1109/JSAC.2004.835750
Fig. 1. LAN responsible for transporting control signals in an aircraft.
For example, the transport of control signals in aircraft re-quires virtually uninterrupted communication in the face of avariety of stresses (see Fig. 1). Currently, this is achieved notthrough networking, but often through cumbersome and inef-ficient redundancy of hydraulic lines. Take, for example, the747 aircraft where the cockpit is connected to control surfacesthrough five parallel, heavy, somewhat spatially diverse, hy-draulic lines. Some degree of parallel diversity and redundancyis necessary in such applications to guard against system failurein the event of localized structural damage to the aircraft.
Alternatively, one could follow the example of commercialarchitectures when designing for such mission-critical applica-tions. However, commercial architectures are often unable toprovide the stringent level of desired service, as they are typ-ically designed to recover from single failures within a timeperiod usually leading to unacceptable delays on the order oftens of milliseconds. In addition to specially designed proto-cols to ensure that temporal disruptions in communication aremitigated as much as possible, high-reliability applications in-herently require rich connectedness among network nodes toprovide multiple communication paths. In this work, we ad-dress the latter requirement of rich connectedness among net-work nodes. The cost of rich connectedness is less of an issue inLANs in contrast to wide-area networks (WANs), where con-nectedness is hampered by the high cost of fiber runs. An ad-ditional benefit of highly connected network topologies is thatthese networks substantially reduce hop counts and thus save onexpensive switching equipment. The issue of protocol design isnot considered in this work, although we refer the reader to [1]
0733-8716/04$20.00 © 2004 IEEE

WEICHENBERG et al.: HIGH-RELIABILITY TOPOLOGICAL ARCHITECTURES FOR NETWORKS UNDER STRESS 1831
for an example of a robust protocol known as lightpath diver-sity,1 which can be used in optical networks in place of alternaterouting to guarantee critical message delivery deadlines.
The model we will be using in this paper, where nodes areinvulnerable and links are vulnerable, is particularly relevantto all-optical networks. In such networks, the highly reliablepassive optics at intermediate network nodes are modeled asinvulnerable graph nodes, and fiber links, tunable lasers, andreceivers, which are significantly more prone to failures, areabstracted as vulnerable graph edges.
In our study, we are solely concerned with connectednessmeasures of a network. While network reliability metrics suchas throughput or delay may be relevant to some applications [2],connectedness measures are appropriate in situations where net-work performance is considered satisfactory as long as the net-work remains connected, or when the network’s ability to pro-vide a minimal level of service is of interest.
It has been shown by Provan and Ball that the calculationof the probability of connection of a graph belongs to theNP-hard class of intractable problems [3]. An analogous resultwas proven for two-terminal reliability by Valiant [4]. In orderto avoid the combinatorial difficulty of these problems, onemust resort to Monte Carlo sampling techniques, finding effi-cient algorithms for special classes of graphs [5]–[7], or usingbounding techniques. Algorithmic bounding techniques werefirst introduced in [8] by Van Slyke and Frank, with tighterbounds subsequently obtained by researchers, such as Ball andProvan, Lomonosov and Polesskii, and Colbourn and Harms[9]–[12].
In this work, we consider networks under both low and highstress. In low stress situations, we assume that link failures occurwith probability approximately 0.2 or below and can be statis-tically dependent. In high stress situations, link failures occurwith probability approximately 0.5 or above and can again bestatistically dependent.
Most reliability studies to date have focused on the analysisand design of networks with emphasis on all-terminal reliabilitywhen links are very reliable. Analyses of the circulant family ofgraphs, for example, have focused on the family’s connectivityand cohesion properties (to be defined later), which are relevantto all-terminal reliability when links are very reliable [13]–[15].A similar emphasis in the reliability literature related to Mooregraphs is also evident [16]. In [17]–[19], the authors examinethe connectivity and cohesion properties of complete -partitegraphs. Families of graphs are developed in [20] with excellentconnectivity and cohesion properties for a wide range of graphparameters.
This emphasis on all-terminal reliability when links are veryreliable is appropriate when modeling benign component fail-ures due to low stress, such as normal wear of components.However, the design of networks for when links are unreliable,owing to high stress, which is addressed in this paper, shouldnot be overlooked. In situations where the probability that a net-work is connected is quite small, connectedness among a fewcritical nodes could still allow for important network functions
1In lightpath diversity, a power-limited optical transmitter splits its trans-mitted data along multiple disjoint optical paths. The signals from multiple pathsare then recombined at the receiver and decoded.
to be carried out, or for the network to degrade with progres-sive failure gracefully. We emphasize that our consideration ofhigh link failure probability does not suggest that networks nor-mally operate in this mode. Rather, high link failure probabili-ties are assumed, given that a catastrophic stress has occurred.This metric is important for applications where network surviv-ability after occurrence of catastrophic events is critical. For ex-ample, enhanced connectedness among critical nodes for air-craft control could provide a mean time to failure of 10 min foran aircraft, enough time for the plane to be safely grounded;whereas sparse connectedness among critical nodes could leadto a shorter mean time to failure, resulting in disaster.
Furthermore, the assumption in the majority of previous workthat link failures are statistically independent is inappropriatefor situations where, for example, networks are subjected tolocalized environmental stresses or when network componentsshare a failed piece of equipment. This paper explores reliabilitymodels which permit statistical dependency among componentfailures. While the results obtained for such models are prelimi-nary, they do develop intuition for the critical factors in reliablenetwork design, and are a step toward the formulation of a gen-eral design methodology for high-reliability networks.
Most of the necessary background is provided in Section II.In this section, we also present new bounding techniqueswhich are valuable in the design of reliable networks. Wespecialize these techniques for one family of candidate graphsfor high-reliability network design, Harary graphs, and indoing so, introduce new results for these graphs. Section IIIdiscusses network design under the assumption of statisticallyindependent link failures. In this section, we propose and justifya design methodology and carry out a series of simulationsto gain design insights. In Section IV, we consider networkdesign under statistically dependent link failures. We introducea simple Markov model, and then carry out approximate relia-bility analyses of special network topologies.
II. RELIABILITY METRICS AND RELIABLE
NETWORK TOPOLOGIES
In this work, a network is modeled as an undirected graph. The incidence matrix of an undirected graph is the
matrix (each row corresponds to a node and each column to anedge) with the th entry defined as follows:
if edge is incident at nodeotherwise
Two distinct nodes in such a graph are connected if there ex-ists a path between the nodes. An undirected graph is connectedif there exists a path between every pair of distinct nodes. A(minimal) set of edges in a graph whose removal disconnectsthe graph is a (prime) edge cutset. A (minimal) set of nodeswhich has the same property is a (prime) node cutset. The min-imum cardinality of an edge cutset is the edge connectivity orcohesion . The minimum cardinality of a node cutset isthe node connectivity or connectivity . Analogous two-ter-minal metrics are the edge-connectivity and node-con-nectivity with respect to a pair of nodes and . Thetwo-terminal edge (respectively, node) connectivity of a graph

1832 IEEE JOURNAL ON SELECTED AREAS IN COMMUNICATIONS, VOL. 22, NO. 9, NOVEMBER 2004
is the minimum number of edges (respectively, nodes) whoseremoval disconnects the node pair.
A myriad of metrics can been defined to measure the relia-bility of networks in some sense. These criteria, which we nowdiscuss, may be broadly categorized as either deterministic orprobabilistic.
A. Deterministic Metrics
Two rudimentary, deterministic, all-terminal reliability cri-teria are the cohesion and connectivity of the graph underlying anetwork. An -node, -edge graph having maximum cohesion isa max- graph. Similarly, an -node, -edge graph having max-imum connectivity is a max- graph. The following bounds re-late connectivity and cohesion to the basic parameters of a graph[21]:
(1)
where is the minimum degree of the graph, and is the de-gree of node . Harary has shown that the bounds in (1) can beachieved through the construction of Harary graphs [22]. Morerefined deterministic criteria for network reliability can also bedefined, such as the number of edge or node cutsets of order or
in a max- or max- graph, respectively. A graph is super- ifit is max- and every edge disconnecting set of order isolatesa point of degree .
An alternative measure of a graph’s ability to remain con-nected is the number of spanning trees it possesses. Thecharacterization of graphs with a maximum number of trees hasbeen solved for sparse graphs when the number of edges is atmost , and for dense graphs when the number of edges isat most less than that of the complete graph , the -nodegraph which has all of its nodes adjacent (i.e., the node graphwith edges) [23]–[25].
B. Probabilistic Metrics
Deterministic reliability metrics do not provide adequatemeasure of the susceptibility of networks to disconnection be-cause these metrics do not account for the reliability of networkcomponents. Probabilistic reliability criteria, on the other hand,require the reliability of network components in addition tothe knowledge of deterministic network properties, and thusyield more meaningful measures of network reliability. Forthis reason, this work is primarily concerned with probabilisticreliability criteria.
Probabilistic reliability metrics require the concept of a prob-abilistic graph. A probabilistic graph is an undirected graphwhere each node has an associated probability of being in anoperational state and likewise for each edge. In probabilistic re-liability analyses, networks under stress are modeled as proba-bilistic graphs.
Almost all approaches to probabilistic reliability analysishave focused on the probability that a subset of nodes ina network are connected when links are very reliable. Theall-terminal reliability of a probabilistic graph is defined as theprobability that any two nodes in the graph have an operatingpath connecting them. If links fail in a statistically independent
fashion with probability , then the all-terminal reliabilityis given by
(2)
(3)
where denotes the number of connected subgraphs withedges, and denotes the number of edge cutsets of cardinality. For values of sufficiently close to zero, we can ignore all but
the first-order summation term in (3), and can there-fore be accurately approximated by . Inthis case, an optimally reliable graph—one that achieves themaximum over all graphs with the same number ofnodes and edges—achieves the maximum value of ofimplying that it is regular, and has a minimum number of cut-sets of size . Therefore, in this regime of , optimally reliablegraphs are super- graphs. For values of sufficiently close tounity, all but the first-order summation term in (2) can be ig-nored, and can therefore be accurately approximatedby , where . Therefore,for values of sufficiently close to unity, an optimally reliablegraph has a maximum number of spanning trees.
The two-terminal reliability of a probabilistic graph is theprobability that a given pair of nodes, and , have an oper-ating path connecting them
(4)
(5)
where is the shortest path length between nodes and ,is the number of subgraphs with edges that connect nodes
and , is the minimum number of edge failures required todisconnect nodes and , and is the number of cutsets withrespect to nodes and of cardinality . For the remainder ofthis work, unless otherwise stated, we redefine the two-terminalreliability of a probabilistic graph as .
If we wish to maximize when ,then, neglecting all but the first-order summation term in (5),it is apparent that the property of super- is a necessary condi-tion. This is because , and for super- graphs,
attains the minimum bound of two, corresponding to iso-lating each of and . For values of sufficiently close to unity,then, neglecting all but the first-order summation term, (4) im-plies that an optimally reliable graph minimizes ;in other words, it has minimum diameter.
C. Bounds on Probabilistic Reliability Metrics
In this section, we introduce new and simple techniques tobound the probability of connection of a network and the prob-ability of connection of a node pair in a network. The qualityof these bounds are illustrated for the ten-node, degree-threeHarary graph in Figs. 4–6. In the discussion that follows,
WEICHENBERG et al.: HIGH-RELIABILITY TOPOLOGICAL ARCHITECTURES FOR NETWORKS UNDER STRESS 1833
we assume that all graphs are regular and have maximumconnectivity.
1) All-Terminal Reliability When is Low: In this section,we derive upper and lower bounds for the probability thata graph is connected . The general approach wefollow is based on enumeration of prime failure events. Wedefine a prime failure event as an event in which a subsetof nodes becomes disconnected from the rest of the graphthrough the failure of the minimal set of edges. Clearly, primefailure events constitute only a subset of all possible graphdisconnection events, since graph disconnection can also occurwhen more than a minimal set of edges fail. Therefore, we mayobtain an upper bound for by subtracting from unitythe probabilities of the mutually exclusive prime failure events
(6)
where is the number of distinct prime failure events of car-dinality . To obtain a lower bound for , we note thatany failure scenario requires that at least one of the prime failureevents occur. Therefore, we obtain a lower bound forby subtracting from unity the union bound of the prime failureevents
(7)
It remains to determine the coefficients . If the graph underconsideration is either trivially small, or simple and symmetric,as is the case with Harary graphs, then closed form, analyticsolutions or bounds are obtainable. Otherwise, one must resortto more general techniques.
We now introduce a technique to determine the coefficientsfor general graphs. It is known that a vector representation
of the prime failure events of a graph can be expressed in twoways as the modulo two sum of a subset of rows of a graph’s in-cidence matrix [26]. Specifically, a prime failure event partitionsa network into two subsets of nodes. Therefore, we can obtaina prime failure event by adding modulo two the rows that cor-respond to each of the nodes in one of the partitions. Hence, wecan find all prime failure events of a graph by summing modulotwo the rows of the subsets of the rows the incidencematrix which yield distinct partitions of the network.2 Thecoefficients are determined by simply counting the number ofdistinct prime failure events of cardinality . This technique isillustrated in Appendix A.
2) Two-Terminal Reliability When is Low: If instead ofthe probability that graph is connected ,we desire the probability that nodes , are con-nected , we can use an approach similar to that ofSection II-C1 to obtain the following bounds:
(8)
where is the number of distinct prime failure events withrespect to nodes and of cardinality , and as before, is
2Note that if we sum modulo two the rows of all 2 possible subsets, then weare counting every partitioning scenario twice, including the null and completepartitions.
the minimum number of edge failures required to disconnectnodes and .
In order to determine the coefficients , we use an ap-proach similar to that of Section II-C1. Since we are only in-terested in prime failure events of which disconnect nodes
and , we add modulo two to the row corresponding to allpossible subsets of the remaining rows of the incidence matrix,except the row corresponding to . Clearly, there are suchpossible subsets. This provides us with a binary vector repre-sentation of all possible prime failure events which disconnect
and .3) All-Terminal Reliability When is High: We approach
the task of bounding in the regime of high in ananalogous fashion to Section II-C1. The events of interest here,however, are the existence of spanning trees rather than primefailure events. A lower bound for is obtained by sum-ming the events that correspond to a spanning tree existing andthe remaining links in the network being inoperative
(9)
An upper bound for can be obtained be invoking theunion bound on the spanning tree events
(10)
It now remains to determine . Fortunately, this is a well-studied problem, and is known to be the determinant of an
matrix whose th entry is definedas follows [27]:
ifif nodes and are adjacentotherwise
where again, is the degree of node .4) Two-Terminal Reliability When is High: When
is high, most of the links in a network have failed and theunderlying graph has relatively few edges. In such sparselyconnected graphs, the disconnection of nodes and is nearlyequivalent to a set of edge-disjoint paths between and allhaving failed. To be precise, the disconnection of nodes and
actually implies the failure of a set of edge-disjoint pathsbetween and , but the converse is not true. This is becauseeach of the edge-disjoint paths can fail but there may still exista path between and through the use of segments of thefailed disjoint paths. Hence, we can lower bound asfollows:
edge-disjoint paths fail
path fails
(11)
where is the length of the th edge-disjoint path, and thesecond and third lines follow from the independence of edgefailures.
The value of when is sufficientlyhigh is achieved by a node pair with shortest path lengthequal to the graph diameter . A simple lower bound for

1834 IEEE JOURNAL ON SELECTED AREAS IN COMMUNICATIONS, VOL. 22, NO. 9, NOVEMBER 2004
Fig. 2. C h2; 4i circulant graph.
is the probability that the shortest pathbetween the most distant node pair is available
(12)
A tighter lower bound for can be derivedusing (11) if the lengths, or an upper bound on the lengths,of the edge-disjoint paths joining the most distant node pair isavailable.
D. Circulants
Harary graphs, to be discussed in greater detail in the nextsection, belong to a more general family of graphs known ascirculants. The circulant graph , where
, hasadjacent to each node . See Fig. 2 for an example
of a circulant graph. Owing to a theorem by Mader which provesthat every connected, regular, node-symmetric3 graph has
, all connected circulants are max- [28]. Furthermore,the only circulants which are not super- are the cycles and thegraphs with , and an oddinteger [13].
In [29], Wang and Yang derive a useful result for the numberof spanning trees in circulant graphs, and in [13] Boesch andWang examine the diameter properties of circulants. In [30], weshow that in the best case, the diameters of degree circulantsgrow as the th root of the number of nodes . Construc-tions of graphs which meet this bound for the case ofcan be found in [13].
E. Harary Graphs
As previously mentioned, Harary graphs, first presented in[22], achieve the bounds in (1). This result implies that Hararygraphs also achieve the maximum value of and
over all graphs with nodes and edges.In a Harary graph where is even, each
node , , is adjacent to nodes; and if is odd, then each node
is also adjacent to node . See
3Two nodes u and v in a graph are similar if there is an automorphism whichmaps u onto v. A graph in which all nodes are similar is node-symmetric.
Fig. 3. H(8; 4) Harary graph.
Fig. 3 for an example of a Harary graph. Harary graphs havethe following properties [31]:
• has , ;• is regular of degree , unless and are both
odd;• has one node of degree and nodes
of degree if and are both odd.In [14], Wang and Yang determined that even-degree Hararygraphs possess the fewest number of edge cutsets of cardinality, when . Each cutset in the above range of
cardinalities was shown to isolate a single node in the Hararygraph.
We now specialize some of the results of Section II-C toHarary graphs. We focus on Harary graphs because they pos-sess good reliability properties in the low- regime. Before be-ginning our analysis of Harary graphs, we prove an intuitive anduseful theorem for this family of graphs.
Theorem 1: Consider a Harary graph , where iseven. Partition the nodes into a subset of nodes and asubset of nodes , where . Then, the min-imum number of edges joining to occurs when thenodes in (and, hence, the nodes in ) are consecu-tively numbered (modulo ).
To prove the theorem, we need the following lemma:Lemma 1: Partition the nodes of the Harary graph
into a subset of nodes , and a subset of nodes, such that the nodes in (and, hence, the nodes in )
are consecutively numbered (modulo ). Then, the number ofedges joining to is
ifif
otherwise .(13)
The proofs of Lemma 1 and Theorem 1 are provided inAppendix B.
1) All-Terminal Reliability When is Low: Every graph dis-connection scenario can be viewed as a partitioning of the graphinto two subsets of nodes which are disconnected. Now, sincea partition of consecutive nodes minimizes the number ofedges joining to in an even-degree Harary graph, theprobability that a partition of nodes becomes disconnected

WEICHENBERG et al.: HIGH-RELIABILITY TOPOLOGICAL ARCHITECTURES FOR NETWORKS UNDER STRESS 1835
Fig. 4. Probability of graph disconnection versus p for H(10; 3). “ATR,simple lower bound” refers to np (1� p) , “ATR, general, lower bound”refers to (6), “ATR, general, upper bound” refers to (7), “ATR, summation,upper bound” refers to (14), and “ATR, closed form, upper bound” refers to(15).
from a partition of nodes is maximized when the par-tition of nodes are consecutive. We can, therefore, form anupper bound for the probability of graph disconnection (and,hence, a lower bound for the probability of graph connection) byupper bounding the probability of and becoming dis-connected by the consecutive case, and then employing a unionbound on these events. Furthermore, since theHarary graph is a subgraph of the Harary graph, theall-terminal reliability of an odd degree Harary graph is lowerbounded by the all-terminal reliability of the Harary graph withdegree one less. Thus, a lower bound for for a Hararygraph is
(14)
Because prime failure events were used to derive (14), the boundis tight for low . We can derive a slightly looser lower boundfor by bounding some of the terms in (14) [30]
(15)
The quality of these bounds is illustrated in Fig. 4 for the ten-node, degree-three Harary graph. The more useful upper boundson the probability of disconnection are tighter than the lowerbounds. Furthermore, these upper bounds are quite tight forvalues of less than approximately 0.2.
2) Two-Terminal Reliability When is Low: The derivationof a lower bound for the node pair connection probability
Fig. 5. Worst case probability of node pair disconnection versus p forH(10;3). “TTR, simple lower bound” refers to 2p (1 � p) , “TTR,general, lower bound” refers to the right inequality of (8), “TTR, general, upperbound” refers to the left inequality of (8), “TTR, summation, upper bound”refers to (16), and “TTR, closed form, upper bound” refers to (17).
is virtually identical to that of for lowin Section II-E1. The difference is that we are only interestedin partitions of the network nodes that result in nodes andresiding in different partitions. Hence, we modify (14) to obtain
(16)
In a manner similar to Section II-E1, we can derive a slightlylooser upper bound for [30]
(17)
The quality of this bound is illustrated in Fig. 5 for the ten-node,degree-three Harary graph. As in the all-terminal case, the two-terminal upper bounds are quite tight for values of less thanapproximately 0.2.
3) All-Terminal Reliability When is High: For high , webound using the approach outlined in Section II-C3,which requires knowledge of the number of spanning trees in agraph. We specialize Wang and Yang’s result for the number ofspanning trees in circulant graphs [29] to Harary graphs.
Lemma 2: The number of spanning trees in the degreeHarary graph is
if is even
if is odd.
The quality of these bounds is illustrated in Fig. 6 for the ten-node, degree-three Harary graph.

1836 IEEE JOURNAL ON SELECTED AREAS IN COMMUNICATIONS, VOL. 22, NO. 9, NOVEMBER 2004
Fig. 6. Probability of graph connection and worst case probability of node pairconnection versus p for H(10; 3). “ATR, lower bound” refers to (9), “ATR,upper bound” refers to (10), and “TTR, lower bound” refers to (18).
In general, it appears that Harary graphs have fewer span-ning trees than many of its circulant counterparts with the samenumber of nodes and edges. For example, the Harary graph
possesses 30 250 spanning trees, whereas the circu-lant possesses 40 500 spanning trees. For values ofvery close to unity, this translates to a probability of connectionfor which is smaller than that of by approx-imately 25%.
4) Two-Terminal Reliability When is High: When theprobability of link failure is high, we bound the proba-bility of node pair connection using the technique outlinedin Section II-C4. This technique requires knowledge of theedge-disjoint path lengths between nodes and . We considerHarary graphs of even degree only, as the case of odd degree isconsiderably more complex. Let denote the node separationof and . Define the parameter as . Byinspecting the structure of even-degree Harary graphs, thelength of path for is found to be
where the function equals unity when its argument equalsand is otherwise equal to zero. If , then the length of
path for is given by
Finally, the length of path for is given by
These path lengths can now be substituted into (11) to obtain alower bound for .
When is high, is minimized for node pairs whichare most distantly placed in . For even-degree Harary graphs,such node pairs have indexes which differ by . Thediameter of even-degree Harary graphs is thus
. For odd-degree Harary graphs, most distantly placednodes can be shown to have indexes that differ by
, with a resulting graph diameter of. Thus, using (12), we have the following lower bound
for for Harary graphs:
(18)
where
if is even
if is odd
The quality of this bound is illustrated in Fig. 6 for the ten-node,degree-three Harary graph. Note that as the number of nodesincreases relative to the degree , odd-degree Harary graphspossess diameters which are approximately half as largeas even-degree Harary graphs. Furthermore, because Hararygraphs are defined such that nodes are connected to their nearestneighbors, the diameter of Harary graphs are generally largerthan other circulant graphs with the same number of nodes andedges. For example, the Harary graph has diametereight, whereas the circulant has diameter four.
F. Cages and Moore Graphs
Cages are regular graphs which, for a given degree andgirth achieve the minimum number of nodes . Thesearch for cages with degrees exceeding three and girths ex-ceeding five has proven to be very difficult with few resultsobtained.
Any graph which achieves the Moore bound, a lower boundfor , is known as a Moore graph. Moore graphs are thus,by definition, cages. A well-known property of Moore graphs isthat they have minimum diameter , which grows as the log-arithm of , over all regular graphs of the same degree withthe same number of nodes. Moore graphs only exist for graphsof girth (complete graphs), (complete bipartitegraphs), or with a prime power (generalizedpolygons), and with and possibly [32].See Fig. 7 for an illustration of the Moore graph with and
, also known as the Petersen graph.
III. NETWORK DESIGN WITH STATISTICALLY INDEPENDENT
LINK FAILURES
In this section, we model networks as probabilistic graphswith the following properties:
1) nodes are invulnerable;2) edges fail in a statistically independent fashion with prob-
ability ;3) once an edge fails, it cannot be repaired.
A. Design of Reliable Networks
Circulants are excellent candidate graphs for high-reliabilitynetwork design for a number of reasons. The circulant family ofgraphs is rich—a circulant graph can be defined for most com-binations of number of nodes and degree. In addition, circulantsinherently possess good reliability properties. For example, inour discussion of circulants in Section II-D, we indicated thatnearly all circulants are super- . Furthermore, in a recent workby Sawionek et al. [33], the family of circulant graphs were

WEICHENBERG et al.: HIGH-RELIABILITY TOPOLOGICAL ARCHITECTURES FOR NETWORKS UNDER STRESS 1837
Fig. 7. Two representations of the g = 5,� = 3Moore graph, also known asthe Petersen graph. The upper diagram (a) is the full tree representation usingnode 1 as the root node. For any Moore graph, a full-tree representation usingany node as the root is possible.
shown to probably contain a uniformly optimally reliable graphwhen such a graph exists, except for when . Uniformlyoptimally reliable graphs have the largest probability of connec-tion for all values of (i.e., ) over all graphs with thesame number of nodes and edges. The authors used local, dis-crete, approximate optimization techniques to show this result.
In the following, we discuss network design in the two ex-treme regions of link vulnerability with respect to our two reli-ability metrics. Fig. 8 summarizes our design insights.
1) Designing for All-Terminal Reliability When is Low:When is low and we would like to design a network forall-terminal reliability, then we know that the class of optimalgraphs lies within the super- family. Intuitively, this is becausesuper- graphs minimize the probability of low-order cutsetevents, which are the most likely disconnection scenarios underthe assumption of low . In [15], Bauer et al. derive an explicitbound on for which super- graphs are optimal, and alsoderive conditions which ensure that is at leasttimes greater for super- graphs than for nonsuper- graphs.
Within the class of super- graphs, even-degree Hararygraphs were shown to be especially good when is low, sincethey achieve the fewest number of cutsets of cardinality , when
. Thus, if we are principally concerned withall-terminal reliability in the low regime, then we shoulddesign networks as Harary graphs. Recall that in Section II-E,we derived new results for the family of Harary graphs which
Fig. 8. Summary of design insights. The top line in each quadrant isa necessary condition for optimality with respect to the correspondingvulnerability region and reliability metric. The lines below are the types ofgraphs suggested by our methodology.
allowed us to develop tight, closed form bounds for all-terminalreliability when is low.
2) Designing for Two-Terminal Reliability When is Low:We now consider the task of designing a network to maximize
when is low. As in the all-terminal case, anecessary condition for optimality with respect to two-terminalreliability when is the super- property. Furthermore,for even-degree Harary graphs, any cutset of cardinality for
isolates either or alone. Hence, Hararygraphs are a good design choice when two-terminal reliability isof principal interest. The derivation of tight, closed form boundsfor the two-terminal reliability of Harary graphs when is lowis also derived in Section II-E.
3) Designing for All-Terminal Reliability When is High:As discussed in Section II-B, when we are interested in opti-mizing the design of a network with respect to all-terminal reli-ability in the high- regime, we seek an architecture which max-imizes the number of spanning trees. Intuitively, this is becausegraphs with a maximum number of spanning trees maximizethe number of most-likely graph connection scenarios. In [30],we derive an upper bound on the number of spanning trees fora regular -node, -edge graph, which can be used to obtainan estimate of the required degree . After determining an esti-mate for from this bound, we search the finite space of nodecirculants with degree for the configuration with the largestnumber of spanning trees. The number of spanning trees of acirculant is computed using Wang and Yang’s result in [29].
4) Designing for Two-Terminal Reliability When is High:We now consider the task of designing a network to maximize
when is high. A simple lower bound foris
(19)
which is just the probability that a single shortest path betweenthe most distant node pair is available.
The relationship among , , and for circulant graphs wasinvestigated in [13] by Boesch and Wang. As previously men-tioned, in [30] we show that in the best case, the diameters ofdegree circulants grow as the th root of the number ofnodes . On the other hand, we recall from our discussion in

1838 IEEE JOURNAL ON SELECTED AREAS IN COMMUNICATIONS, VOL. 22, NO. 9, NOVEMBER 2004
Fig. 9. Dual-homed switch topology (Ethernet).
Section II-F that the diameters of Moore graphs grow with thelogarithm of the number of nodes . However, for networks of50 nodes or less, the difference in the minimum degree requiredwhen the diameter is held constant is usually zero or one. Fur-thermore, recall that with the exception of a few configurations,graphs that achieve the Moore bound do not exist. Thus, circu-lant graphs that achieve the diameter bounds in [30] are optimalor nearly optimal with respect to two-terminal reliability whenthe number of nodes is on the order of tens, which is the casefor most networks we consider.
We conclude this section by noting that a relationship seemsto exist between a graph’s diameter and its number of spanningtrees, although the precise relationship is unclear. In mostinstances, regular graphs with small diameters have a largenumber of spanning trees. However, in general, a smallerdiameter does not imply a larger number of spanning trees, orvice versa. The intuition behind this trend is that for the samenumber of nodes and edges, the nodes of symmetric graphswith larger diameters are generally more distant from oneanother. Consequently, there are fewer combinations of edgeswhich could form spanning trees owing to the constraints whichensure that nodes are distant. Hence, the number of spanningtrees generally decreases with diameter when the number ofnodes and edges is held constant. Therefore, as in the case oflow , there exist synergies between the optimality criteria forall- and two-terminal reliability for high .
B. Simulation Results
1) Commercial Networks Versus Our Candidate Topologies:We now conduct a comparison among Harary graphs—one ofour candidate topologies—and some topologies employed incommercial networks—dual-homed switch graphs, rings, andmultiple fiber rings.
The dual-homed switch architecture is illustrated in Fig. 9. Inthis topology, each node is connected to a primary and a sec-ondary switch through a dedicated link. In addition, the twoswitches are bridged. Communication between a node pair, al-though normally first attempted through the primary switch, canbe carried out via any available path. Switched Ethernet is acommon example of the dual-homed switch architecture [34],and we will therefore refer to the dual-homed switch architec-ture simply as Ethernet. In an multiple fiber ring graph, thereare undirected edges between nodes that would otherwise
Fig. 10. Probability of disconnection versus p for the 14-node Ethernet, ring,double-ring, and H(14; 4) graphs when p � 1=2.
have one undirected edge in a ring graph. For brevity, we referto multiple fiber rings simply as multirings.
In our comparison, each graph supports 14 nodes and the de-gree of the multiring and the Harary graph is four. We furtherassume that nodes, including the two switches in the Ethernettopology, are invulnerable, and that the Ethernet bridge relia-bility is identical to that of the other links in the network.
Fig. 10 depicts the performance of the topologies when. The most immediate observation is that the Harary graph
outperforms the other graphs with respect to both all- and two-terminal reliability. Between Ethernet and the ring, which arethe degree two topologies,4 Ethernet exhibits better all- and two-terminal reliability. Ethernet’s superior performance can be at-tributed to the fact its number of lowest-order cutsets scalesweakly with the number of nodes in the graph. For example,for all-terminal reliability, the number of cutsets of order two is
in Ethernet, whereas it is in the ring. Simi-larly, for two-terminal reliability, the number of cutsets of ordertwo is two in Ethernet, whereas it is in the ring. Thesame scalability explanation also applies when accounting forthe superior performance of relative to the double ring,which is also a degree four graph. With respect to all-terminalreliability, , since it is super- , possesses cut-sets of order four, whereas the double ring possessescutsets of order four. For two-terminal reliability, the number ofcutsets of order two is two in , whereas it isfor the double ring.
In Fig. 11, the performance of the topologies is plotted when. The bottom section of the plot, which is of little prac-
tical interest, is grayed out. With respect to all-terminal relia-bility, the graph again outperforms the aforementionedgraphs. has 1.9898 10 spanning trees, whereasthe double ring has spanning trees.Hence, we expect to perform better than the doublering, which is indeed the case. Furthermore, Ethernet has farmore spanning trees than the ring, which only has , thus
4Strictly speaking, Ethernet is not a degree two topology, owing to the exis-tence of the two high degree switches.

WEICHENBERG et al.: HIGH-RELIABILITY TOPOLOGICAL ARCHITECTURES FOR NETWORKS UNDER STRESS 1839
Fig. 11. Probability of connection versus p for the 14-node Ethernet, ring,double-ring, H(14; 4) and H(14;10) graphs when p � 1=2.
accounting for its superior reliability performance. As can beseen from the modest all-terminal probabilities of connection,all-terminal connectedness is too stringent a requirement for thehigh- regime. In fact, very rich connectedness among networknodes is required for even moderate connectedness, as seen bythe performance of the graph. Thus, in the high-regime it makes more sense to design for partial, or two-ter-minal connectedness. As discussed in the introductory section,connectedness among only critical nodes in the network couldstill allow for important network functions to be carried out, orfor failure to occur gracefully.
With respect to two-terminal reliability, Ethernet achieves thebest performance of all, owing to its diameter of two.has the next best two-terminal performance with a diameter offour, whereas the ring and the double ring possess diameters of
. Of course, the price paid for the better reliabilityof Ethernet in this respect is the cost of the two high-degreeswitches. The attractiveness of the Ethernet topology is furtherdiminished when one considers node failures, which is outsidethe scope of this work. In the case of vulnerable nodes, twosingle failures at the switches can bring the entire network down.Furthermore, it should be noted that when is high, it is pos-sible to find circulant graphs with the same number of nodes andedges which possess more spanning trees and smaller diameters,and hence better reliability performance when is high, than thecorresponding Harary graphs [30].
The comparison conducted in this section substantiatesour claim that circulant graphs, such as Harary graphs, pos-sess reliability advantages relative to topologies employedin present-day commercial networks. In fact, Harary graphsoutperformed the other topologies except when two-terminalreliability in the high- regime was considered. We concludethat there is a significant reliability advantage in strategicpositioning of link capacity, as in circulant graphs, rather thanadding redundant backup links. We next conduct simulationcomparisons among a variety of circulant topologies.
2) Comparison Among Candidate Topologies: In this sec-tion, we present simulation results for several network designs.
Fig. 12. Probability of disconnection versus p for the Petersen graph,H(10;3) and H(10;4) when p � 1=2.
These results verify our previous insights, and also shed light onthe relative performance of different network configurations.
In our first set of simulations, we consider the Petersen graph(the Moore graph with and ), and the Hararygraphs, and . When is low, Fig. 12 indi-cates the expected result that possesses a lower prob-ability of disconnection by a factor of approximately rela-tive to the Petersen graph and . Perhaps an unexpectedfinding is the closeness of the performance of the Petersen graphand when is low. In fact, all- and two-terminal re-liability for super- graphs can be well-approximated byand , respectively, when is low. Thus, with respect to all-and two-terminal reliability when is low, the sparse family ofMoore graphs offers little or no benefit over the richer family ofsuper- graphs. It is only when two-terminal reliability in the
high regime is of interest that Moore graphs present a notice-able advantage over other competing topologies, as they pos-sess smaller graph diameters. Thus, when designing a networktopology we should focus on optimizing the network structurewith respect to high stress reliability, as low stress reliabilityis virtually unchanged provided that the underlying graph issuper- , which is the case for nearly all circulants.
In our next set of simulations, we investigate the effect ofnode degree on reliability in the regime. Specifically,we are interested in determining the node degrees required toachieve all- and two-terminal reliabilities in the range of 0.1 to1. For our simulations, we consider a variety of 14 node cir-culants. Fig. 13 depicts the all-terminal performance of thesegraphs in the regime. As expected, the all-terminal re-liability increases with node degree. However, the performancegain from increasing the node degree diminishes as the nodedegree increases. For example, the performance gain from in-creasing the node degree from four to seven is far greater thanthat of increasing the node degree from seven to ten. Another ob-servation is that the performance difference among graphs withthe same node degree is more pronounced at lower node degreesthan at higher node degrees. This is because structural changes

1840 IEEE JOURNAL ON SELECTED AREAS IN COMMUNICATIONS, VOL. 22, NO. 9, NOVEMBER 2004
Fig. 13. Probability of graph connection versus p for H(14; 4), C h2; 3i,H(14;7), C h1; 3; 5; 7i, H(14;10), C h1;2; 4; 5; 6i and the completegraph K , when p � 1=2.
in sparser graphs can more dramatically affect the relative relia-bility properties of graphs than in denser graphs. Unfortunately,these simulations also indicate that to achieve all-terminal reli-abilities in the range of 0.1 to 1 when , very high nodedegrees are required. In fact, when exceeds roughly 0.87, eventhe complete graph cannot achieve a reliability above 0.1.Furthermore, in line with our previous observation, once we re-alize that a high node degree is required to achieve a reliabilityin the range of 0.1 to 1, the graph’s actual structure is not veryimportant.
Our simulation resuls for the two-terminal reliability ofthe same seven graphs in the regime are illustratedin Fig. 14. The trends observed in this figure are similar tothose discussed above. In fact, for two-terminal reliability,some trends are even more pronounced. For example, theperformance difference of graphs with the same node degreeis quite significant at lower degrees, while the performanceof the graphs is virtually indistinguishable at higher degrees.Intuitively, this is because topological idiosyncrasies (i.e.,diameter) of graphs are magnified in a graph’s two-terminalreliability figure since the connectedness of the worst node pairis only considered; whereas, all-terminal reliability is a globalconnectedness measure. The simulation results also indicatethat two-terminal reliabilities above 0.1 can be achieved at lowto moderate node degrees. For example, the minimum diam-eter circulant of degree four, achieves two-terminalreliabilities above 0.1 when is less than approximately 0.75.
IV. NETWORK DESIGN WITH STATISTICALLY DEPENDENT
LINK FAILURES
As discussed in the introduction, many situations arise forwhich the modeling assumption that network links fail in a sta-tistically independent fashion is inappropriate. We shall see thatmodeling link failures in a statistically independent fashion canlead to dangerously optimistic conclusions regarding the relia-bility of a network. As illustrated in the next section, the criticalnetwork property is no longer the unconditional probability of
Fig. 14. Worst case probability of node pair connection versus p forH(14;4),C h2;3i, H(14;7), C h1;3; 5; 7i, H(14;10), C h1;2; 4; 5; 6i and thecomplete graph K , when p � 1=2.
link failure as in the independent link failure model, but theprobability of link failure given the failure of a proximate link.
Furthermore, while we do not explicitly address node failuresin this work, node failures can be partly addressed by the use ofdependent link failure models.
In this section, we carry out approximate reliability analysesof special network topologies based on existing dependent linkfailure models as well as a new Markov model introduced here.Unfortunately, the different assumptions used in each of thesemodels preclude a very meaningful comparison among thesetopologies, except when small correlation among link failures ispresent. These models, however, may be applied in comparisonsamong graphs belonging to the same family.
The analyses conducted here are probabilistic and quantita-tive in nature, whereas other recent work in correlated link fail-ures, such as shared risk link groups (SRLGs) [35], are not.
A. Markov Model
In order to illustrate our Markov model, consider linkswhich are of interest, . Now, let us assume thatthere is a Markovian failure dependency among these links;that is, conditioned on the state of link , link is inde-pendent of the states of links . Let denote theevent that link is operational, and let denote that link isnot operational. Let us further assume that the marginal proba-bility distributions of the states of each of the links is identical(i.e., ), and that is also identical for all .Thus, the probability that all links have failed is given by
Alternatively, in terms of the correlation coefficient of thestates of adjacent links, the probability that all links fail is
(20)
Note that if is low and , then the probability thatall links have failed is approximately equal to . As

WEICHENBERG et al.: HIGH-RELIABILITY TOPOLOGICAL ARCHITECTURES FOR NETWORKS UNDER STRESS 1841
noted above, the critical parameter is no longer the uncondi-tional probability of link failure as in the independent linkfailure model, but , which is related to the probability of linkfailure given the failure of a proximate link.
B. Reliability of the Ethernet Graph
We now compute the reliability of the Ethernet graph whendependence among link failures is present. We assume thatnodes, including switches, are invulnerable, and that link fail-ures are correlated only if the corresponding links are incidentat the same nonswitch node. Whether or not this is a realisticmodel depends on how the Ethernet is physically configured.For example, the above model would be realistic for Ethernetsin which line cards at the switches reside in separate back-planes. Using this dependent failure model, the probability ofconnection of the graph is
and the two-terminal probability of connection is
where denotes the probability of failure of the bridge joiningthe switches.
C. Reliability of Ring and Multiring Graphs
In this section, we develop approximate expressions forthe all- and two-terminal reliability of rings and multirings,assuming that nodes are invulnerable and that links fail in astatistically dependent fashion using a slight extension of ourMarkov model.
1) Ring Graph: Assuming that nodes are invulnerable, theprobability that a ring remains connected is the probability thatzero links or exactly one link fails in the ring. These two proba-bilities can be computed using a chain rule expansion along con-secutive links around the ring. In line with our Markov model,we make the simplifying assumption that the state of a link isgoverned by the state(s) of its most immediate neighbor(s). Notethat the state of the final link in the expansion is influenced byits two adjacent links, rather than by just one link. For an -nodering, the probability of graph connection can thus be expressedas
To compute the two-terminal reliability, we note that the proba-bility that a node pair remains is connected is equal to the proba-bility that all of the links on at least one of the two disjoint paths
between the nodes remain operational. Hence, for a diameteri-cally-spaced pair of nodes on an ring graph, the two-terminalprobability of connection is
We would like to point out that the above model for the ringgraph (and the following model for the multiring graph) is in-consistent, in that different chain rule expansions of the sameevent may lead to different values for the probability of theevent. This inconsistency arises because of the simplifying ap-proximation we make in assuming that the state of link , con-ditioned on the state of link , is independent of the statesof links . While this is a good approximation for linkstate correlations which decay rapidly with distance around thering, the cyclic nature of the graph results in dependency on thestates of these upstream links. Hence, the model is contrary tothe assumptions of Markov random fields. To arrive at a con-sistent Markovian model, one can employ techniques from thetheory of graphical models [36]. However, the relationship be-tween the specified parameters and those that are intuitive andoften available to the network designer (such as link state prob-ability distributions) is complex. Furthermore, some of thesetechniques require the tedious computation of normalizing par-tition functions.
2) Multiring Graph: To generalize the above analysis tomultirings, we need only replace the parameter in the aboveequations with the probability of the parallel links failing inan multiring. We may incorporate statistical dependence byusing our Markov model to replace by .Note that the conditional probability in this expression for par-allel links is different from the previous conditional probabilityfor consecutive links in the ring. In addition, the conditionalprobability for consecutive links takes on a slightly differentmeaning in this context—it is the probability that at least oneof the parallel links is up given that at least one of the previousparallel links is up.
D. Reliability of Harary Graphs When is Low
In this section, we state approximate expressions for the all-and two-terminal reliability of Harary graphs when link failuredependencies are present. We use the basic idea of the -modelpresented in [37] in conjunction with the Harary graph analysisdeveloped in Section II-E. In Section II-E, we noted that everygraph disconnection scenario can be viewed as a partitioning ofthe graph into two subsets of and nodes and ,respectively, which are disconnected, and that a partition ofconsecutive nodes minimizes the number of edges joiningto . Since the edges joining to are in “closest”proximity when the nodes in are consecutive, we reason thata conservative estimate for the reliability of Harary graphs canbe obtained by treating each possible as a consecutive parti-tion of nodes. We cannot rigorously state that such an estimatewould be a lower bound for the probability of graph connectionbecause in order to do so, we would need a complete probabilitydistribution for the states of all links in the graph.
1842 IEEE JOURNAL ON SELECTED AREAS IN COMMUNICATIONS, VOL. 22, NO. 9, NOVEMBER 2004
When , where a link is more likely to failwhen one or more of the links joining and have failed,the probability of graph and node pair disconnection for Hararygraphs is approximately and , respectively.The analogous expressions for the independent failure modelare and , respectively. In order to get a feeling forthe difference in these two sets of expressions, let us considera 20-node, degree-four Harary graph with probability of linkfailure and . Our dependency model yields the values2.5 10 and 2.5 10 for the all- and two-terminal prob-abilities of disconnection, respectively. On the other hand, theindependence model yields the values 2 10 and 2.5 2 ,respectively.
For large values of , the above asymptotic expression are nolonger good estimates of the all- and two-terminal reliabilities.In the limit of (equivalently, ), these estimates donot approach , which is the expected probability of disconnec-tion. We attribute the diminishing accuracy of the asymptoticexpressions to the fact that these estimates are union boundson failure events. As increases, the probability that multiplefailure events simultaneously increases, thereby making theunion bound loose.
E. Two-Terminal Reliability When is High
As mentioned in Section III-B, when is high, it makes senseto consider the two-terminal reliability of a network rather thanthe more stringent all-terminal metric. When is high and weare interested in the two-terminal reliability of a graph, we usea generalization of the simple bound stated in Section III-A4
Using our Markov model along the shortest path between theworst case node pair, the above expression becomes
where, again, denotes the probability that link isoperational given that link is operational.
As an example, let us consider a 20-node, degree-four Hararygraph with probability of link operation and conditionalprobability . Note that for Hararygraphs, the diameter grows linearly with the number of nodesin the graph. In this example, the network diameter is five.Our dependency model yields a lower bound of 6.25 10 ,whereas the independence model yields a lower bound of1 10 .
F. Approximate Reliability Performance of Topologies
We conclude this section by investigating the reliability per-formance of the topologies studied in the previous sections.It is difficult to make a fair reliability comparison among theEthernet, ring, multiring, and Harary graphs studied here be-cause the underlying dependent failure models make differentassumptions regarding the nature of the link failure correlations.
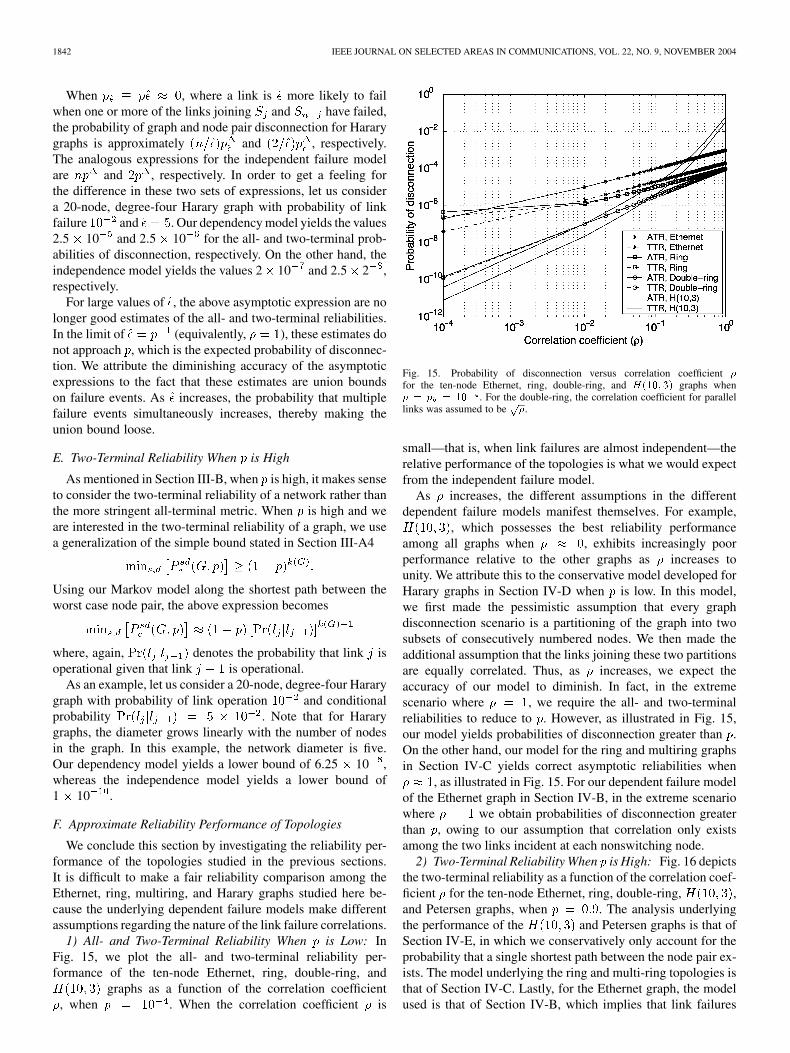
1) All- and Two-Terminal Reliability When is Low: InFig. 15, we plot the all- and two-terminal reliability per-formance of the ten-node Ethernet, ring, double-ring, and
graphs as a function of the correlation coefficient, when . When the correlation coefficient is
Fig. 15. Probability of disconnection versus correlation coefficient �for the ten-node Ethernet, ring, double-ring, and H(10; 3) graphs whenp = p = 10 . For the double-ring, the correlation coefficient for parallellinks was assumed to be
p�.
small—that is, when link failures are almost independent—therelative performance of the topologies is what we would expectfrom the independent failure model.
As increases, the different assumptions in the differentdependent failure models manifest themselves. For example,
, which possesses the best reliability performanceamong all graphs when , exhibits increasingly poorperformance relative to the other graphs as increases tounity. We attribute this to the conservative model developed forHarary graphs in Section IV-D when is low. In this model,we first made the pessimistic assumption that every graphdisconnection scenario is a partitioning of the graph into twosubsets of consecutively numbered nodes. We then made theadditional assumption that the links joining these two partitionsare equally correlated. Thus, as increases, we expect theaccuracy of our model to diminish. In fact, in the extremescenario where , we require the all- and two-terminalreliabilities to reduce to . However, as illustrated in Fig. 15,our model yields probabilities of disconnection greater than .On the other hand, our model for the ring and multiring graphsin Section IV-C yields correct asymptotic reliabilities when
, as illustrated in Fig. 15. For our dependent failure modelof the Ethernet graph in Section IV-B, in the extreme scenariowhere we obtain probabilities of disconnection greaterthan , owing to our assumption that correlation only existsamong the two links incident at each nonswitching node.
2) Two-Terminal Reliability When is High: Fig. 16 depictsthe two-terminal reliability as a function of the correlation coef-ficient for the ten-node Ethernet, ring, double-ring, ,and Petersen graphs, when . The analysis underlyingthe performance of the and Petersen graphs is that ofSection IV-E, in which we conservatively only account for theprobability that a single shortest path between the node pair ex-ists. The model underlying the ring and multi-ring topologies isthat of Section IV-C. Lastly, for the Ethernet graph, the modelused is that of Section IV-B, which implies that link failures

WEICHENBERG et al.: HIGH-RELIABILITY TOPOLOGICAL ARCHITECTURES FOR NETWORKS UNDER STRESS 1843
Fig. 16. Worst case probability of node pair connection (TTR) versuscorrelation coefficient � for the ten-node Ethernet, ring, double-ring, H(10; 3),and Petersen graphs when p = p = 0:9. For the double-ring, the correlationcoefficient for parallel links was assumed to be
p�.
along the shortest path between the node pair are statisticallyindependent.
When , the trends depicted in Fig. 16 are what we ex-pect from the independent failure model. Specifically, the rela-tive performance of the topologies is largely governed by theirrespective diameters. As increases, however, the effect of thesedifferent network diameters diminishes. As can be seen fromFig. 16, the reliability performances of the , Petersen,ring, and multiring graphs converge to the expected value of
. Ethernet, however, owing to the assumptions of itsmodel, exhibits a peculiar downward trend as increases. When
, the two-terminal reliability is approximately ,which is approximately equal to the probability of one of thetwo-hop paths between the source and destination being opera-tional. On the other hand, when , the two links from eachnonswitch node act as one link and there is effectively only onetwo-hop path between the source and destination. In this case,the two-terminal reliability is approximately .
V. CONCLUSION
In this work, we first considered the design of networkswith statistically independent link failures and invulnerablenodes, which is a good model for passive all-optical local-areanetworks. We developed bounding techniques for the reliabilityof networks, which were specialized to Harary graphs yieldingnew results for this family of graphs. We then outlined andjustified a design methodology in which circulant graphs werethe principal candidate topologies. We found the following.1) When designing a highly reliable network topology, weshould focus on optimizing the network structure with respectto high stress reliability. This is because low stress, all- andtwo-terminal reliability is virtually the same for all super-graphs (i.e., graphs that achieve maximum edge connectivityand minimum number of edge cutsets of this order), which
constitute the vast majority of circulant graphs, our family ofcandidate graphs. 2) To obtain all- and two-terminal reliabilitiesin the 0.1–1 range when links are very unreliable (i.e., ),large node degrees are required and that for such high nodedegree graphs, the actual graph structure is not very important.
We then took initial steps in broadening the scope of thiswork to the case of statistically dependent link failures. Weconducted approximate dependent failure analyses of severalspecial topologies—Ethernet, ring, multiring, and Hararygraphs—using existing models and our simple Markov model,and have shown the danger in relying on an independent linkfailure model. In fact, using our Markov model, the probabilityof failure of links with correlation coefficient was shownto be approximately , when is low and . Unfor-tunately, the models developed for the topologies we comparedrested upon different assumptions, thereby making detailedcomparisons among families of graphs difficult. On the otherhand, these models may find use in comparisons among graphsbelonging to the same family. A lesson to be learned from thisis that such reliability models only bring the network architectpart way to the goal of designing a highly reliable network.The value provided by such models and techniques is deter-mined by the network architect’s ability to match the modeland the underlying real network. Most importantly, even withcrude correlated failure models the conclusion that statisticaldependence diminishes network reliability when is low isevident, and the network architect should therefore configurea network to minimize component failure dependencies. Morework, however, needs to be done with respect to dependentcomponent failure models. Models which strike a good balancebetween simplicity and applicability to a variety of topologiesneed to be developed. In addition, these models should possessintuitive parameters which are readily available to the networkdesigner.
APPENDIX A
Example 1: Illustrating the Bounding Technique of Section II-C1: Consider the graph depicted in Fig. 17. The incidencematrix for the graph is
We first determine the subsets which give us dis-tinct prime failure events. Then, for each of these seven primefailure events, we sum modulo two the corresponding rows ofto obtain the binary prime failure event vectors. These seven par-titions and their corresponding vectors are listed in Fig. 18. Wesee that there is one prime failure event of cardinality one, threeprime failure events of cardinality two, and three prime failureevents of cardinality three. Thus, can be bounded asfollows:

1844 IEEE JOURNAL ON SELECTED AREAS IN COMMUNICATIONS, VOL. 22, NO. 9, NOVEMBER 2004
Fig. 17. Graph considered in Example 1.
Fig. 18. Prime failure events for Example 1. Entries in the left column arenodes contained in one possible partition of the graph. The corresponding entriesin the right column are the event vectors formed by summing modulo two therows corresponding to the nodes in the left column.
APPENDIX B
Proof of Lemma 1: The case of is trivial. When, a consecutive partition of nodes al-
lows the nodes in to be fully connected. In this case, thenumber of edges joining to follows from the fact thatthe total number of edge endpoints incident at ’s nodes is
and that the total number of edge endpoints in a fully con-nected subgraph of nodes is . For the remaining case,when the nodes are consecutively arranged, the nodes at eitherend of the partition possess connections to ,the nodes which are second from either end of the partitionpossess connections to , and so on. Hence,the total number of edges joining to is the constant
, as required.Proof of Theorem 1: The case of is trivial. Consider
now the case of . Note that minimizing thenumber of edges joining to is equivalent to maximizingthe number of internal edges shared by the nodes of one of thepartitions. When , a consecutive partition of
nodes allows the nodes in to be fully connected, yieldingthe maximum number of internal connections, and hence theminimum number of external edges.
For the remaining case where , we carryout the proof by induction. We may use our result for
as our base case. Now, assume that a consecutive arrangementof nodes achieves the minimum number of external edges. Letus now proceed by contradiction by assuming the existence of apartition of nodes which achieves a smaller numberof external edges than the number achieved by a consecutivearrangement of nodes in Lemma 1.
If we can find a node in which contains at leastedges to , then we move this node to . Thiscreates a partitioning of the graph into and nodes,which achieves fewer edges joining the two partitions than a
consecutive arrangement. This would contradict our inductionhypothesis, implying that a consecutive arrangement of nodesis optimal.
Now, let us consider the case where there does not exist anode in which contains at least edges to . Weproceed by finding a pair of consecutive nodes in the graph suchthat one of the nodes belongs to and the other node be-longs to . Examining the window of consecutivenodes centered at , our assumption that there does not exist anode in which has at least edges to requiresthat at least nodes in this window belong to . Wenow consider the window of consecutive nodes centeredat . Since the window formed by the union of and ’s win-dows of length has size nodes, there can be atmost nodes in this larger window that belong to .By moving to , we create a partitioning of the graph into
and nodes which achieves fewer edges joiningthe two partitions than that of the and partitioning,and hence, fewer than that of a consecutive arrangement of and
nodes. Note that by moving to , we have not cre-ated a node in which possesses at least edges to theother partition. This is because the nodes initially inonly gain internal edges by moving to , and now pos-sesses fewer than edges to the other partition. Thus, we cancontinue in this way—finding a pair of consecutive nodes in dif-ferent partitions and moving one node to the other partition, al-ways decreasing the number of edges connecting the partitions,until we have increased the size of our initial partition of nodesto nodes. At this point, we have created a partitioning ofthe graph into and nodes which achieves fewer edgesjoining the partitions than the partitioning of the graph in ourinduction hypothesis, which was assumed to be optimal. Thisis a contradiction, implying that a consecutive arrangement ofnodes is optimal.
REFERENCES
[1] Y. Wen and V. W. S. Chan, “Ultra-reliable communication over unreli-able optical networks via lightpath diversity: characterization and opti-mization,” in Proc. IEEE Globecom, Dec. 2003.
[2] C. J. Colbourn, “Reliability issues in telecommunications networkplanning,” in Telecommunications Network Planning, P. Soriano and B.Sanso, Eds. Norwell, MA: Kluwer, 1999, ch. 9, pp. 135–146.
[3] J. Provan and M. Ball, “The complexity of counting cuts and computingthe probability that a graph is connected,” SIAM J. Comput., vol. 12, pp.777–788, 1983.
[4] L. G. Valiant, “The complexity of enumeration and reliability problems,”SIAM J. Comput., vol. 8, pp. 410–421, 1979.
[5] A. Satyanarayana, “A unified formula for analysis of some network re-liability problems,” IEEE Trans. Rel., vol. R-31, pp. 23–32, 1982.
[6] A. Satyanarayana and J. N. Hagstrom, “New algorithm for the analysisof multi-terminal reliability,” IEEE Trans. Rel., vol. R-30, pp. 325–334,1981.
[7] A. Satyanarayana and A. Prabhakar, “New topological formula and rapidalgorithm for reliability analysis of complex networks,” IEEE Trans.Rel., vol. R-27, pp. 82–100, 1978.
[8] R. Van Slyke and H. Frank, “Network reliability analysis: part 1,” Net-works, vol. 1, pp. 279–290, 1972.
[9] M. Ball and J. S. Provan, “Bounds on the reliability polynomial forshellable independence systems,” SIAM J. Algebr. Discrete Methods,vol. 3, pp. 166–181, 1982.
[10] M. V. Lomonosov and V. P. Polesskii, “An upper bound for the reliabilityof information networks,” Prob. Inform. Trans., vol. 7, pp. 337–339,1971.
[11] C. J. Colbourn and D. D. Harms, “Bounding all-terminal reliabilityin computer networks,” Computer Communications Networks Group,Univ. Waterloo, Tech. Rep. E-123, 1985.

WEICHENBERG et al.: HIGH-RELIABILITY TOPOLOGICAL ARCHITECTURES FOR NETWORKS UNDER STRESS 1845
[12] , “Bounding all-terminal reliability in computer networks,” Net-works, vol. 18, pp. 1–12, 1988.
[13] F. T. Boesch and J. Wang, “Reliable circulant networks with minimumtransmission delay,” IEEE Trans. Circuits Syst., vol. CAS-32, pp.1286–1291, Dec. 1985.
[14] , “Super line-connectivity properties of circulant graphs,” SIAM J.Algebr. Discrete Methods, vol. 7, pp. 89–98, 1986.
[15] D. Bauer, F. T. Boesch, C. Suffel, and R. Van Slyke, “On the validityof a reduction of reliable network design to a graph extremal problem,”IEEE Trans. Circuits Syst., vol. CAS-34, pp. 1579–1581, Dec. 1987.
[16] R. S. Wilkov, “Design of computer networks based on a new reliabilitymeasure,” in Proc. Symp. Computer-Communications Networks andTeletraffic, Brooklyn, NY, 1972.
[17] H. Frank and I. T. Frisch, “Analysis and design of survivable networks,”IEEE Trans. Commun. Technol., vol. COM-18, pp. 501–519, Oct. 1970.
[18] H. Frank, “Maximally reliable node weighted graphs,” in Proc. 3rdAnnu. Conf. Information Sciences and Systems, 1969, pp. 1–6.
[19] F. T. Boesch and A. P. Felzer, “On the minimumm degree vulnerabilitycriterion,” IEEE Trans. Circuit Theory, vol. CT-18, pp. 224–228, Mar.1971.
[20] S. L. Hakimi and A. T. Amin, “On the design of reliable networks,”Networks, vol. 3, pp. 241–260, 1973.
[21] F. Harary, Graph Theory. Reading, MA: Addison-Wesley, 1969.[22] , “The maximum connectivity of a graph,” Proc. Nat. Acad. Sci.
USA, vol. 48, pp. 1142–1146, 1962.[23] F. T. Boesch, X. Li, and C. Suffel, “On the existence of uniformly opti-
mally reliable networks,” Networks, vol. 21, pp. 181–194, 1991.[24] G. Wang, “A proof of Boesch’s conjecture,” Networks, vol. 24, pp.
277–284, 1994.[25] A. Satyanarayana, L. Schoppmann, and C. Suffel, “A reliability-im-
proving graph transformation with applications to network reliability,”Networks, vol. 22, pp. 209–216, 1992.
[26] M. N. S. Swamy and K. Thulasiraman, Graphs, Networks, and Algo-rithms. New York: Wiley, 1981.
[27] L. Weinberg, “Number of trees in a graph,” Proc. IRE, vol. 46, no. 12,pp. 1954–1955, Dec. 1958.
[28] W. Mader, “Minimale n-fach kantenzusammenhängende graphen,”Math. Ann., vol. 191, pp. 21–28, 1971.
[29] J. F. Wang and C. S. Yang, “On the number of spanning trees in circulantgraphs,” Int. J. Comput. Math., vol. 16, pp. 229–241, 1984.
[30] G. E. Weichenberg, “High-reliability architectures for networks understress,” S.M. thesis, Massachusetts Inst. Technol., Cambridge, 2003.
[31] F. T. Boesch, “Synthesis of reliable networks—a survey,” IEEE Trans.Rel., vol. R-35, pp. 240–246, Aug. 1986.
[32] G. Exoo. (1998) A new technique for the characterization of graphswith a maximum number of spanning trees. [Online]. Available:http://isu.indstate.edu/ge/CAGES/cage5a.pdf
[33] B. Sawionek, J. Wojciechowski, and J. Arabas, “Synthesis of reliablenetworks in the presence of line failures,” in Proc. IEEE Int. Symp. Cir-cuits and Systems, Geneva, Switzerland, May 2000, pp. IV-649–IV-652.
[34] R. Breyer and S. Riley, Switched, Fast, and Gigabit Ethernet: NewRiders, 1998.
[35] I. P. Kaminow and T. L. Kochs, Eds., Optical Fiber TelecommunicationsIIIA. New York: Academic, 1997.
[36] M. J. Wainwright, “Stochastic processes on graphs with cycles: geo-metric and variational approaches,” Ph.D. dissertation, MassachusettsInst. Technol., Cambridge, 2002.
[37] S. N. Pan and J. Spragins, “Dependent failure reliability models for tac-tical communications networks,” in Proc. Int. Conf. Communications,1983, pp. 765–771.
Guy Weichenberg (S’03) received the B.S. degreein engineering science (electrical option) from theUniversity of Toronto in 2001, and the M.S. degreefrom the Massachusetts Institute of Technology(MIT), Cambridge, in 2003. He is currently workingtoward the Ph.D. degree in the Laboratory forInformation and Decision Systems at MIT. Hisresearch interests include network theory and opticalcommunications.
Mr. Weichenberg was co-awarded the Best PaperPrize for G. Weichenberg, V. W. S. Chan, M. Mé-
dard, “A Reliable Architecture for Networks Under Stress,” Fourth InternationalWorkshop on the Design of Reliable Communication Networks (DRCN 2003).He also holds a Natural Sciences and Engineering Research Council of Canada(NSERC) Postgraduate Scholarship.
Vincent W. S. Chan (S’69–M’88–S’92–F’94)received the B.S. and M.S. degrees in 1971, the E.E.degree in 1972, and the Ph.D. degree in 1974 inelectrical engineering, in the area of communicationsfrom the Massachusetts Institute of Technology(MIT), Cambridge.
He is the Joan and Irwin Jacob Professor ofElectrical Engineering and Computer Scienceand Aeronautics and Aeronautics, and Directorof the Laboratory for Information and DecisionSystems (LIDS), MIT. From 1974 to 1977, he was
an Assistant Professor with the School of Electrical Engineering, CornellUniversity, Ithaca, NY. He joined Lincoln Laboratory at MIT in 1977 as a StaffMember of the Satellite Communication System Engineering Group workingon military communications and networking. In January 1981, he became theAssistant Leader of the Communication Technology Group starting a researchand development program on optical space communications. In July 1983,he formed and became Leader of the Optical Communication TechnologyGroup and Manager of the Laser Intersatellite Transmission Experiment(LITE) Program. He became the Head of the Communications and InformationTechnology Division of Lincoln Laboratory until joining LIDS in 1999. He alsoserved as the principal investigator of a Next-Generation Internet Consortium(ONRAMP) formed among AT&T, Cabletron, MIT, and JDS Fitel, and aSatellite Networking Research Consortium formed among MIT, Motorola,Teledesic, and Globalstar. He is a member of the Board of Directors of VitesseSemiconductor Corporation and the Chairman of its Technical Advisory Board.He also serves on the Technical Advisory Boards of Agility Communications,Axiowave Networks (TAB Chairman), and as a Member of the Corporationof Draper Laboratory. His research interests are in optical communications,wireless communications, space communications, and networks.
Dr. Chan is a Fellow of the Optical Society of America.
Muriel Médard (S’91–M’95–SM’00) received theB.S. degrees in electrical engineering and computerscience and in mathematics in 1989, the B.S. degreein humanities in 1990, the M.S. degree in electricalengineering in 1991, and the Sc.D. degree in elec-trical engineering in 1995, all from the MassachusettsInstitute of Technology (MIT), Cambridge.
She is a Harold E. and Esther Edgerton AssociateProfessor in the Electrical Engineering and ComputerScience Department at MIT and a member of the Lab-oratory for Information and Decision Systems. She
was previously an Assistant Professor in the Electrical and Computer Engi-neering Department and a member of the Coordinated Science Laboratory atthe University of Illinois Urbana-Champaign. From 1995 to 1998, she was aStaff Member at MIT Lincoln Laboratory in the Optical Communications andthe Advanced Networking Groups. Her research interests are in the areas of re-liable communications, particularly for optical and wireless networks.
Prof. Médard was co-awarded the Best Paper Award for “A Reliable Ar-chitecture for Networks Under Stress,” presented at the Fourth InternationalWorkshop on the Design of Reliable Communication Networks (DRCN 2003).She received a National Science Foundation (NSF) Career Award in 2001and was co-winner of the 2004 Harold E. Edgerton Faculty AchievementAward, established in 1982 to honor junior faculty members “for distinctionin research, teaching and service to the MIT community.” She was awardedthe IEEE Leon K. Kirchmayer Prize Paper Award 2002 for her paper, “TheEffect Upon Channel Capacity in Wireless Communications of Perfect andImperfect Knowledge of the Channel,” published in IEEE TRANSACTIONS
ON INFORMATION THEORY. She serves as an Associate Editor for the OpticalCommunications and Networking Series of the IEEE JOURNAL ON SELECTED
AREAS IN COMMUNICATIONS and as an Associate Editor in Communicationsfor the IEEE TRANSACTIONS ON INFORMATION THEORY. She has served as aGuest Editor for the IEEE JOURNAL OF LIGHTWAVE TECHNOLOGY and as anAssociate Editor for the OSA Journal of Optical Networking.