180508 investor presentation may 2018 - ir.kpn.com€¦ · strategy strategic choices embedded in...
TRANSCRIPT

Investor Presentation
May 2018

Contents
1 Strategy
2 Performance
3 Appendix

3
StrategyStrategic choices embedded in organization
CEO
Operational
Financial
Commercial
SIMPLIFY GROW INNOVATE
Digital & simple serviceand delivery
Converged Telco& IT services
Excellentuser experience
Flexible & simplifiednetwork and operating model
Best-in-class secured integrated networks
Applying innovativetechnologies
Leancost structure
Value management& predictable cash generation
Invested aheadof the curve
Further strengthening our Company
Value creation
Investor presentation | Strategy | KPN strategy |

4
Simplification and digitalization embedded in organizationDriving revenue opportunities and lower spend
ENABLING IMPROVEDCUSTOMER EXPERIENCE
Removing complexity for customers- Single ID, omnichannel experience, e-care
On-demand virtualized services- Instant provisioning, real-time scaling
DRIVINGPERFORMANCE
Lower spend- Marketing, call center, engineers- Personnel, IT/TI, maintenance, energy- SAC/SRC, connection fees, traffic- Cheaper generic hardware
€Revenue opportunities- Fixed-mobile-IT convergence- Additional value added services
(incl. partnerships such as Netflix and WeChat)- Infrastructure as a Service- Data & Analytics as a Service
Simplify portfolio and operations - Fewer propositions- Creation of uniform digital layer- BSS / OSS IT integration
Decentralize
Virtualize
Digitalize
Rationalize
Use data & analytics- Targeted household marketing- Optimized customer service- Smarter network investments
Provide services closer to customers- Improved (metro) core network - First 5G technology use cases- Higher network efficiency
Increase network efficiency and effectiveness- Flexible on-demand capacity
and services- Self-healing and self-optimizing
networksInvestor presentation | Strategy | Simplification & Digitalization |

5
External environment reassuringGrowing macro-economy with strong competitive position
1 CPB (issued March 2018)2 World Economic Forum; The Global Competitiveness Report 2017-2018
3.2%3.1%
2.2%2.3%
2018E20172015 2016
FAVOURABLE MACRO ECONOMY
3.9%4.9%
6.0%6.9%
2016 2017 2018E2015
GDP growth NL1
Unemployment NL1
STRONG COMPETITIVE POSITION
’17-’18 vs. ’16-’17
The Netherlands 4 -
Germany 5 -
United Kingdom 8 -1
Denmark 12 -
Belgium 20 -3
Investor presentation | Strategy | External environment |

6
External environment reassuring (cont’d)KPN strongly positioned as leading integrated service provider
1 Independent market survey (Q1 2018)2 Total Dutch (Consumer and Business) mobile service revenue market share (Q4 2017), based on IAS 18 mobile service revenues3 Telecompaper (Q1 2018)4 Independent market survey (Consumentenbond; Q1 2018)
Mobile network 2G, 3G, 4G 2G, 3G, 4G 2G, 3G, 4G 4G + MVNO
Mobile network quality1
Mobile market share2 43% 30% 20% 7%
Fixed network FttC, FttH Coax Wholesale KPN Wholesale KPN
Broadband market share3 41% 44% 3% 4%
TV product perception4 N/A
TV market share3 32% 52% 2% 2%
Fixed-mobile convergence
Business market presence SME, LE, Corporate
SME, LE, Corporate SME, LE SME, LE
Business market capabilities
Trusted brand
Investor presentation | Strategy | External environment |

7
Strong progress in Simplify, Grow, Innovate strategyKey priorities on track
Simplify Grow Innovate
Grow in TV and IT services
Finalize Business transformation
Finalize build of flexible and simplified integrated network and operating model
Expand superior access position by deploying innovative technologies and increasing fiber penetration
Optimize financial framework and grow dividend
Accelerate up- and cross-sell in bundles
Investor presentation | Strategy | Consumer |

8
Further strengthening convergence position in ConsumerClear benefits from targeted household approach
Clear convergence benefitsCustomers in fixed-mobile bundles
Households1 Postpaid customers
1 As % of broadband customers2 Source: Kantar TNS3 Based on fixed-mobile households
4 KPN brand5 Consumer Marketing & Communication expenses
25
Consumer total (all brands)
Fixed-mobile bundles4
13
Fixed-mobile bundles
Consumer total
~9%
~5%
Increasing SIMs per household3Higher NPS2 (Q4 ’17)
Lower churn4 (Q4 ’17) Lower marketing expenses5
-12%
FY ’17FY ’16
1.47
Q4 ’17Q4 ’16
+2.7%1.51
Investor presentation | Strategy | Consumer |
Q1 ’18:+28k net adds
Q1 ’17
39%
43%
Q1 ’18 Q1 ’18
Q1 ’17
45%
53%all brands
66%KPN brand
Q1 ’18:+48k net adds
9
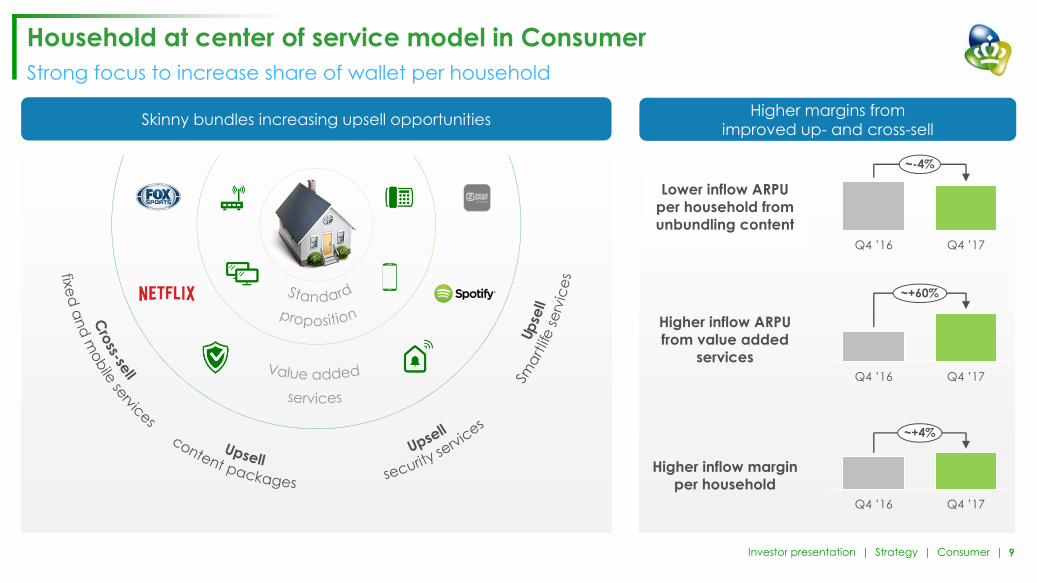
Q4 ’16 Q4 ’17
~+4%
~+60%
Q4 ’16 Q4 ’17
Lower inflow ARPU per household from unbundling content
Higher inflow margin per household
Higher margins from improved up- and cross-sell
Q4 ’17Q4 ’16
~-4%
Higher inflow ARPU from value added
services
Skinny bundles increasing upsell opportunities
Household at center of service model in ConsumerStrong focus to increase share of wallet per household
Investor presentation | Strategy | Consumer |

10
Strong competitive positioning in Dutch marketCovering all segments: focus on fixed-mobile bundling and high value
CLV illustrates focus on KPN brandHigher market share through increasing KPN share in brand mixLeading converged position
~77% ~78%
~23% ~22%
43%42% ~43%
Q4 ’17
~79%
~21%
Q3 ’17Q4 ’16
Mobile service revenues KPN brand
Market share NL1
Mobile service revenues no frills brands
1 Management estimatesInvestor presentation | Strategy | Consumer |

11
Enabling digital customer interactionDriving cost savings and potential new revenue streams
Contact center costs
Q1 ’17
+11%
Q1 ’18
Online contact1,2
Q1 ’18
-14%
Q1 ’17
Increase of digital customer interaction supporting lower contact center costs in Consumer
WeChat Go Europe platform offering in-app purchases
KPN enabled app and connectivity for Chinese tourists
travelling to Europe
Revenue share of tickets sold and financial transactions
Q1 ’17
-21%
Q1 ’18
Incoming calls2
1 Webcare and chat contact via online customer service channels2 KPN brand Investor presentation | Strategy | Consumer |

12
Digitalization strengthening customer relationshipsData & analytics supporting value per household
Targeted marketing Enables personalized actions and
campaigning
Improving customer service
Improving quality of InHome connection Identify individual churn probability and
driver
Creation of uniform digital layer completed… …enabling data & analytics for targeted household approach
Upgraded customers
~13%
~3%
Control group
Lower churnHigher NPS43
Upgraded customers
13
Consumer total
20-30 Mbps >50 Mbps0-10 Mbps
~-50%
Churn rate
UNIFORM DIGITAL LAYER (API)
Encouraging results from proactively upgraded InHome quality
Higher InHome speedreduces churn
Investor presentation | Strategy | Consumer |

13
Targeted household marketing drives customer loyalty and convergenceUsing smart analytics to drive value
Step 1: Creation of uniform digital layer completed
Step 2: Use Data & Analytics to optimize - Customer service- Up- and cross-sell- Network investmentswhile preserving privacy
Benefits
New (3) Offered (0)
Client advice (automatically shown to customer service)
Client has the right for KPN Veilig to be installed on 2 devices0 installedWe can enhance the client’s connection (speed/stability) by switching WiFi channels
Upgrade to Alles-in-1 Standaard, from Internet+Bellen
Client situation
Data pool
Convergence penetration
Churn
Household value
Marketing expenses
Net Promotor Score
Investor presentation | Strategy | Consumer |

14
Simplified Business portfolio in 2017Added scale and capabilities to strengthen position as leading ICT service provider
Changing customer needs…
…require a simple and customer focused portfolio
Tailor made single play solutions
Traditional on-premise services
Cloud-based (IT) services
Platformspecific access
Shared access & OTT (IPVPN, SDN)
Propositions
Portfolio
Distribution platform
KPN small business KPN ÉÉN SME LE & Corporate 7 focused propositions Industry propositions
<5 employees 5-150 employees >150 employees Healthcare, Government & Manufacturing
Communication services
IT services
Professional services & Consultancy
Standardized bundled services
Investor presentation | Strategy | Business |

15
Transformation to leading Business ICT provider on trackSupported by Simplification
Improved time-to-marketIntegrating Mobile IT systems delivers ~€ 50m run-rate savings in total from decommissioned legacy IT
Benefits:
Migration of KPN Business Mobile clients completed
Focus to further improve Business NPS1
1 Source: Kantar TNS2 Source: Dutch IT Partner Preference Survey3 Source: Giarte, annual client satisfaction benchmark Dutch IT outsourcing market
-6Q1 ’18
-3
Q1 ’17
Best ICT service provider
#1 ICT service provider in NL2
100% outsourcing recommendation score
for KPN Workspace3
Investor presentation | Strategy | Business |

16
Improved positioning in growing IT marketLeverage leading position in communication services to grow market share in IT
Security Digital workspace Cloud
9.6
7.26.8
20222015 2017
CAGR +5.0%
1 Gartner, management estimates; addressable market includes Cloud infra & Hosting, Consulting & Professional Services, Digital Workspace, Application & Data
…in growing IT market…increasing share in IT services…
€ bn
Expanding growth in Internet of Things with fully integrated solution
Addressable IT market for KPN3
2016 2017
~75%
Strong growth in workspaces
Managed workspaces
Investor presentation | Strategy | Business |
Security Digital workspace Cloud9.6
7.26.8
CAGR +5.0%
202220172015
…in growing IT marketIncreasing share in IT services…
€ bn
Addressable IT market for KPN1
~75%
20172016
Strong growth in workspaces
Managed workspaces
Easy integration of devices and applications
Best-in-class connectivity and services
Combined consulting, data and security services
Connectivity
ARPU x3
Full solution

17
LoRa
LTE-M
4G M2M
Growth in IT services and IoTNationwide IoT network supporting leading position
Full IoT service offering leading to strong growthUpsell security portfolio through KPN ÉÉN SME
4.0
Q1 ’17 Q1 ’18
2.8
Nationwide IoT coverage
or modularbuilding blocks
Data driven solutions
KPN Things services
Connectivity
Hardware
Professional services
KPN ÉÉN distribution platform
KPN ÉÉN customers
KPN IoT M2M base (m)
Offered asplug & playend-to-end
solution
Investor presentation | Strategy | Business |

18
Simplifying operating model and expanding superior network position
Expand superior access position by deploying innovative technologies and increasing fiber penetration
Finalize build of flexible and simplified integrated network
Ensuring best-in-class customer experience
Simplify operating model to improve customer experience and operational effectiveness
Investor presentation | Strategy | Network, Operations & IT |

19
Second wave Simplification program ahead of scheduleRun-rate savings target raised to at least € 350m by end 2019
End 2016 2017
~110
2018 - 2019
>240
End 2019
>350
SECOND WAVE
Simplification program run-rate opex and Capex savings
€ m
Customer centricNext generation Telco
Fully virtualized
Investor presentation | Strategy | Network, Operations & IT |

20
BSS integration~€ 80m run-rate savings1 from KPN Consumer Fixed and Mobile IT rationalization
OSS integration~€ 30m run-rate savings1 from consolidation of network interaction layer
Gradual approach to simplify operating modelBSS integration nearly completed, starting OSS integration in 2018
Customer interaction layer (BSS)
Network interaction layer (OSS)
Consumer Fixed KPN Mobile
UNIFORM DIGITAL LAYER (API)
KPNB2B
Fixed
TelfortB2B
Mobile
TelfortB2B
Fixed
KPNB2B
Mobile
KPNB2B
Fixed
TelfortB2B
Fixed
TelfortB2B
Mobile
TelfortMobileKPN MobileKPN Fixed Telfort
Fixed
End 2013
End 2017
1 Run-rate savings per end 2019 Investor presentation | Strategy | Network, Operations & IT |

21
Gradual approach to simplify operating model (cont’d)2017-2019: Evolving into next generation Telco
Network interaction layer (OSS)
Customer interaction layer (BSS)
Investor presentation | Strategy | Network, Operations & IT |

22
Ready to upgrade if demand changesDense fiber network reaching ~80% of households (FttH / FttC)
700
600
500
400
300
200
0
100
Agg
rega
te b
it ra
te (M
bps)
300
Loop length (m)
900100 700400 500 800200 600 1,000
G.Fast Bonded VplusVplusBonded vectoring
VDSL2 vectoring
~50% of KPN network
~80% of KPN network
Vplus delivering highest stable speeds without changing network architecure1Cost and time efficient upgrades
1 Source: Nokia; bonded speeds based on KPN management estimate Investor presentation | Strategy | Network, Operations & IT |

23
Converging fixed and mobile network technologiesMix of technologies to deliver best customer experience
Launch of 4G50 Mbps
LTE 1800225 Mbps
LoRaTriple carrier aggregation LTE-M 5G
use cases
DecentralizedCDN
Core network100 Gbps
SDN / NfVVPlus
Fixed-wirelessconvergence
FttC / FttH
FttS / FttB / FttHtechnologies
Investor presentation | Strategy | Network, Operations & IT |

24
Determining value of 5G technologies through use casesStarting several pilots with business partners
Urban areas Transport & Logistics
Rural applications
Virtual reality
4k / 8k television
Crowd control
Precision farming
Fixed wireless internet
Drone surveillance
Cargo / asset tracking
Predictive maintenance
Increase asset utilization
Automotive
Truck platooning
Green light optimal speed advice
Automated valet parking
Investor presentation | Strategy | Network, Operations & IT |

25
Continued investments to further improve customer experienceCore network important differentiator for quality of service
Changing customer behavior, data demand increasing rapidly
Supporting customer experience, strong increase NPS IPTV1
14
Q4 ’16
21
Q4 ’17
1 KPN brand, source: Kantar TNS
1.6
1.1
0.70.4
2017201620152014
CAGR ~52%
3.1
2.21.8
1.1
20172014
CAGR ~40%
20162015
OTT traffic (Tbps)
Unicast IPTV traffic (Tbps)
ROTTERDAM
AMSTERDAMZWOLLE
ARNHEM
Upgraded core network, roll-out decentralized CDN on track
Metro-Core location
Street cabinet or Mobile base station
Core location
Upgrade core network completed 161 Metro Core Locations Providing significant cost reduction
Investor presentation | Strategy | Network, Operations & IT |

26
Network rationalization to prepare for virtualizationReducing complexity and associated costs to enable flexibility
2019 Network
~35%
~100%
2016 Network
~55%
~62%
2010 Network
100%
~35%
Am
ount
of n
etw
ork
equi
pmen
t1
Decentralize, bringing services closer to customersIP transformation on track
1 Rebased (amount of network equipment used in 2010 = 100%)
Legacy IP-based
Investor presentation | Strategy | Network, Operations & IT |

27
Gradually moving to a software defined networkProviding flexible on-demand capacity and new services, faster and at lower costs
Software Defined NetworkLegacy network
OSS
Network
UNIFORM DIGITAL LAYER (API)
Dedicated hardwarefor different
network functionsGeneric
hardware
Virtualized network functions
BSS
Fast delivery
Real-time scaling
Intuitive user experience
Near real-time updates
ON-DEMAND VIRTUALIZED SERVICES
DRIVINGPERFORMANCE
Infrastructure as a Service
Flexible capacity
Highly automated maintenanceSelf-healing and
self-optimizing networks
Investor presentation | Strategy | Network, Operations & IT |

28
Growing free cash flow to drive value
Strong free cash flow potential Solid financial position
Commitment to growingshareholder returns
Committed to investment grade credit profile
Telefónica Deutschland stake provides additional financial flexibility
Free cash flow growth to drive growing shareholder remuneration
1
2
3
4
5
Grow revenues in Consumer, stabilize in Business
Rigorous focus on driving down costs
Capex levels trending down from elevated levels
Lower interest payments going forward
Limited cash taxes
Investor presentation | Strategy | Financial performance |

Contents
1 Strategy
2 Performance
3 Appendix

30
Continued focus on value in competitive Consumer mobile environmentKPN brand resilient through high convergence penetration
211228
-9.0%
Q1 ’18
208
Q4 ’17Q1 ’17
€ m
-2.9%
Mobile service revenues
Growth of mobile service revenues(Excluding regulation)
Focus on retention of high value customers…
…through successful convergence strategy
Q1 ’18
Q1 ’17
45%
53%all brands
66%KPN brand
Q1 ’18:+48k net adds
flat
Q1 ’17 Q1 ’18
Total churn
Service revenues impacted by regulation and price pressure in mobile-only
KPN brand churn
No frills churn
-23%
Investor presentation | Performance | Consumer |

31
Sustained revenue growth in Consumer residentialContinuously improving excellent customer experience
467
Q1 ’17 Q1 ’18
+2.1%
476
1 As % of broadband customers
Further fixed-mobilehouseholds growth1
Continued fixed revenue growth New fully integrated TV-offering
Q1 ’18:+28k net adds
Q1 ’17
39%
43%
Q1 ’18
New IPTV app withleading user interface
Offering excellent customer experience on all devices
€ m
Investor presentation | Performance | Consumer |

32
Good progress in Business transformationSimplified portfolio driving improved customer satisfaction
Business revenue growth drivers Improving customer satisfaction
1 Source: Kantar TNS (KPN brand)
(6)Q1 ’17
-3
Q1 ’18
NPS Business1
Q1 ’18adjusted
y-on-y growth
Q1 ’18 % of total
adj. revenues
Communication Services -8.7% 63%
Mobile service revenues -7.9% 24%
IoT 40% 2.1%
Broadband & Network services -1.5% 17%
Fixed voice -14% 13%
Other -22% 7.3%
IT Services (a.o. security, cloud, workspace) 18% 16%
Professional Services & Consultancy 4.8% 21%
Business total -2.4%
Investor presentation | Performance | Business |

33
Revenues impacted by regulation
Adjusted revenues NL declined by 3.4%
€ m
1,40113
Adj. revenues NL Q1 ’18
9
Wholesale
26
BusinessConsumer Other (incl. eliminations)
20
Adj. revenues NL Q1 ’17
1,451
-1.3%
Growth of adjusted revenues NL, excluding € 31m regulation impact(roaming & MTA / FTA)
Investor presentation | Performance | Financial performance |

34
Adjusted EBITDA growth driven by Simplification and digitalization
Adjusted EBITDA NL increased by 2.2%
€ m38.3%
3
50
RevenuesAdj. EBITDA NL Q1 ’17
556569
Other operating expenses
Personnel expenses
Adj. EBITDA NL Q1 ’18
Cost of goods & services
20
IT/TI
2817
40.6%
1 2
1 Lower traffic costs due to reduction MTA tariffs
3Lower costs for billing & collection, marketing and housing
Adjusted EBITDA margin The Netherlands
3.8%
Growth of adjusted EBITDA NL, excluding € 9m regulation impact(roaming)
32 Ongoing Simplification and
digitalization savings
Investor presentation | Performance | Financial performance |

35
Solid financial position supported by growing free cash flow
5.8
7.2
Q1 ’18
6.5
7.4
6.0
7.2
Q1 ’17 Q4 ’17
1 All figures based on continuing operations. iBasis classified as discontinued operations2 Gross debt defined as the nominal value of interest bearing financial liabilities, excluding derivatives and related collateral,
representing the net repayment obligations in Euro, taking into account 50% of the nominal value of the hybrid capital instruments
2.8x 2.5x2.6x
Lower debt level
Net debt / EBITDAx.xx.xGross debt2
Net debt
€ bn
Growing free cash flow1
29
Q1 ’18
122
Q1 ’17
€ m
Investor presentation | Performance | Financial performance |

Contents
1 Strategy
2 Performance
3 Appendix

37
KPN ADR programKPN has a sponsored Level 1 ADR program
Bloomberg ticker KKPNY
Trading platform Over-the-counter (OTC)
CUSIP 780641205
Ratio 1 ADR : 1 Ordinary Share
Depositary bank Deutsche Bank Trust Company Americas
Depositary bank contact Jonathan Montanaro
ADR broker helpline+1 212 250 9100 (New York) +44 207 547 6500 (London)
E-mail [email protected]
ADR website www.adr.db.com
Depositary bank’s local custodian Deutsche Bank, Amsterdam
Investor presentation | Appendix | ADR program |
38
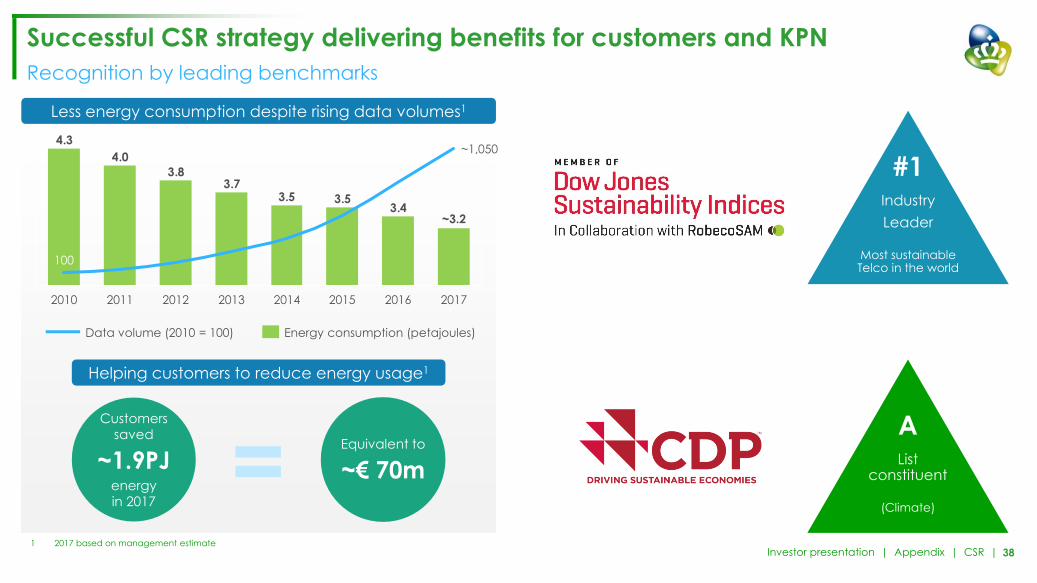
Successful CSR strategy delivering benefits for customers and KPNRecognition by leading benchmarks
#1Industry Leader
Most sustainable Telco in the world
AList
constituent
(Climate)
3.43.53.5
3.73.8
4.04.3
2017
~3.2
~1,050
2016201520142013201220112010
100
Data volume (2010 = 100) Energy consumption (petajoules)
Customers saved
~1.9PJenergy in 2017
Equivalent to
~€ 70m=1 2017 based on management estimate
Less energy consumption despite rising data volumes1
Helping customers to reduce energy usage1
Investor presentation | Appendix | CSR |

39
Dutch mobile service revenues
Service revenues (€ m) Q1 ’18 Q1 ’17 y-on-y %Consumer 208 228 -9.0%
Business1 137 145 -5.2%
Other2 36 37 -4.2%
KPN The Netherlands 381 411 -7.2%
1 Includes M2M service revenues2 Includes amongst others Wholesale mobile service revenues and visitor roaming
Investor presentation | Appendix | Dutch wireless |

40
Debt portfolio
Hybrid bonds24%
Global bonds9%
Other2%
Euro bonds65%
GBP2
24%
USD2
15%
EUR61%
’28 32
0.6
’26
0.1
’21
0.6 0.6
’30
0.4
’19 ’23’18
1.1
0.5
’25’20
1.0
’22
0.6 0.60.5
’29
0.8
’24
0.9
USD hybrid (1st call) GBPEUR USD
EUR hybrid (1st call)GBP hybrid (1st call)
1 Based on the nominal value of interest bearing liabilities after swap to EUR, including € 1.1bn hybrid bond, GBP 400m hybrid bond and USD 600m hybrid bond
2 Foreign currency amounts hedged into EUR3 Excludes bank overdrafts
Breakdown nominal debt1 (total € 8.3bn) Nominal debt by currency
Bond redemption profile (€ bn) Fixed vs. floating interest3
Floating15%
Fixed85%
Investor presentation | Appendix | Debt overview |

41
IFRS 15 changed revenue recognition rulesExample 1: Handset sales via own channels
IFRS
15
IAS
18
Accounting for this example
(€) Month 1 Month 2 … Month 24 TotalNon-service revenues (handset) 48 - … - 48
Service revenues 50 50 … 50 1,200
Total revenues 98 50 … 50 1,248Opex (SAC) -528 - … - -528
EBITDA -430 50 … 50 720
Contract components (€) Value Revenue / cost
Contract duration (months) 24
Monthly subscription 50 1,200
Initial handset payment 48 48
Handset value 528 -528
EBITDA contract lifetime 720
(€) Month 1 Month 2 … Month 24 TotalNon-service revenue (handset) 528 - … - 528
Service revenues 30 30 … 30 720
Total revenues 558 30 … 30 1,248Opex (SAC) -528 - … - -528
EBITDA 30 30 … 30 720
Contract asset (working capital) Month 1 Month 2 … Month 24 TotalAdd: handset receivable 480 - … - 480
Less: monthly billing -20 -20 … -20 -480
Closing balance 460 440 … - -
P&L
P&L
Under IFRS 15: Handset delivery at purchase is
accounted for as non-service revenues
Handset revenues consist of: Initial payment (€ 48) Amount to be recovered over the
contract period (€ 480)
No impact on free cash flow from accounting change Higher EBITDA in month 1 (€ 460) is offset
by change in working capital
Bala
nce
Shee
t
Investor presentation | Appendix | IFRS 15 |

42
IFRS 15 changed revenue recognition rules (cont’d)Example 2: Handset sales via third parties
IFRS
15
IAS
18
Accounting for this example
(€) Month 1 Month 2 … Month 24 TotalService revenues 50 50 … 50 1,200
Total revenues 50 50 … 50 1,200Opex (SAC) -600 - … - -600EBITDA -550 50 … 50 600
Contract components (€) Value Revenue / cost
Contract duration (months) 24
Monthly subscription 50 1,200
Dealer fee (handset) 480 -480
Dealer fee (subscription) 120 -120
EBITDA contract lifetime 600
(€) Month 1 Month 2 … Month 24 TotalService revenues 30 30 … 30 720
Total revenues 30 30 … 30 720Opex (SAC) -5 -5 … -5 -120
EBITDA 25 25 … 25 600
Contract asset (working capital) Month 1 Month 2 … Month 24 TotalAdd: handset receivable 480 - … - 480
Less: monthly billing -20 -20 … -20 -480
Closing balance 460 440 … - -
P&L
P&L
Bala
nce
Shee
t
Contract cost (non-current) Month 1 Month 2 … Month 24 TotalAdd: contract cost 120 - … - 120
Less: amortization -5 -5 … -5 -120
Closing balance 115 110 … - -
Under IFRS 15: At purchase, dealer fees are recognized
on the balance sheet Handset revenues and handset dealer fee
are no longer included in revenue and SAC
Dealer subscription fee is spread over the contract lifetime as SAC
No impact on free cash flow from accounting change Higher EBITDA in month 1 (€ 575) is offset by
change in working capital (contract asset) and change in provisions (non-current assets)
Investor presentation | Appendix | IFRS 15 |
43
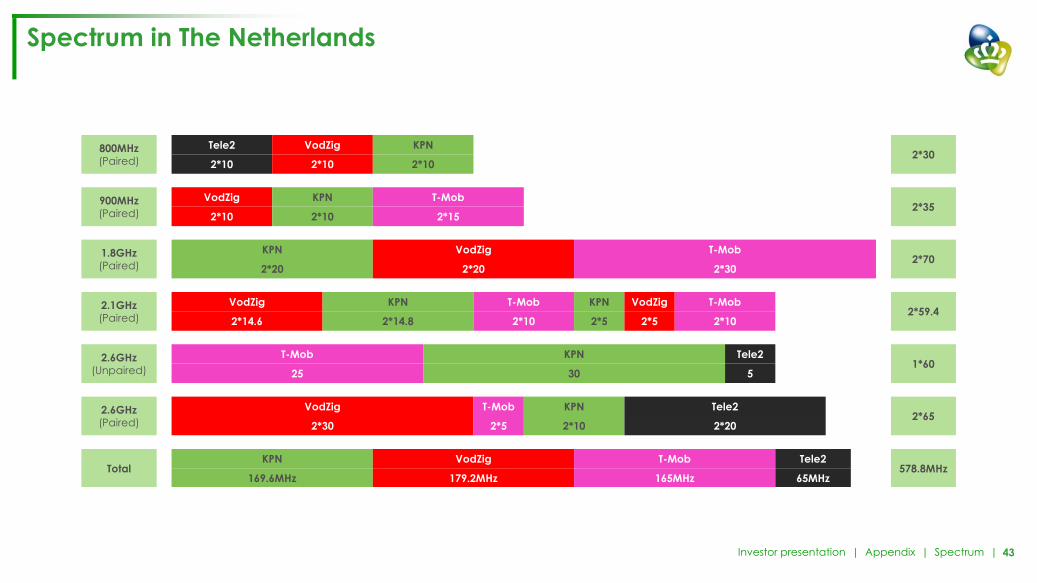
Spectrum in The Netherlands
800MHz(Paired)
Tele2 VodZig KPN2*30
2*10 2*10 2*10
900MHz(Paired)
VodZig KPN T-Mob2*35
2*10 2*10 2*15
1.8GHz(Paired)
KPN VodZig T-Mob2*70
2*20 2*20 2*30
2.1GHz(Paired)
VodZig KPN T-Mob KPN VodZig T-Mob2*59.4
2*14.6 2*14.8 2*10 2*5 2*5 2*10
2.6GHz(Unpaired)
T-Mob KPN Tele21*60
25 30 5
2.6GHz(Paired)
VodZig T-Mob KPN Tele22*65
2*30 2*5 2*10 2*20
TotalKPN VodZig T-Mob Tele2
578.8MHz169.6MHz 179.2MHz 165MHz 65MHz
Investor presentation | Appendix | Spectrum |

44
Fixed infrastructure
Download speed Active inNetwork
~50Mbps
~100Mbps
~120Mbps
~240Mbps
~400Mbps
>1Gbps
~1Gbps
CO
CO
SC
ODF
SC
VDSL2
VDSL2 pair bonding
Vectoring
Bonded vectoring
Bonded VPLUS
NG.PON
FttH
SC
SC
Fiber Copper Investor presentation | Appendix | Fixed infrastructure |

45
Safe harbor
Alternative performance measures and management estimatesThis financial report contains a number of alternative performance measures (non-GAAP figures) to provide readers with additional financial information that is regularly reviewed by management, such as EBITDA and Free Cash Flow (‘FCF’). These non-GAAP figures should not be viewed as a substitute for KPN’s GAAP figures and are not uniformly defined by all companies including KPN’s peers. Numerical reconciliations are included in KPN’s quarterly factsheets and in the Integrated Annual Report 2016. KPN’s management considers these non-GAAP figures, combined with GAAP performance measures and in conjunction with each other, most appropriate to measure the performance of the Group and its segments. The non-GAAP figures are used by management for planning, reporting (internal and external) and incentive purposes. KPN’s main alternative performance measures are listed below.KPN defines EBITDA as operating result before depreciation (including impairments) of PP&E and amortization (including impairments) of intangible assets. Note that KPN’s definition of EBITDA deviates from the literal definition of earnings before interest, taxes, depreciation and amortization and should not be considered in isolation or as a substitute for analyses of the results as reported under IFRS as adopted by the European Union. In the Net Debt / EBITDA ratio, KPN defines Net Debt as the nominal value of interest bearing financial liabilities excluding derivatives and related collateral, representing the net repayment obligations in Euro, taking into account 50% of the nominal value of the hybrid capital instruments, less net cash and short-term investments, and defines EBITDA as a 12 month rolling total excluding restructuring costs, incidentals and major changes in the composition of the Group (acquisitions and disposals). Free Cash Flow is defined as cash flow from continuing operating activities plus proceeds from real estate, minus capital expenditures (Capex), being expenditures on PP&E and software. Operating free cash flow is defined as adjusted EBITDA minus Capex. Revenues are defined as the total of revenues and other income unless indicated otherwise. Adjusted revenues and adjusted EBITDA are derived from revenues (including other income) and EBITDA, respectively, and are adjusted for the impact of restructuring costs and incidentals. The term service revenues refers to wireless service revenues. All market share information in this financial report is based on management estimates based on externally available information, unless indicated otherwise. For a full overview on KPN’snon-financial information, reference is made to KPN’s quarterly factsheets available on ir.kpn.com
Forward-looking statementsCertain statements contained in this financial report constitute forward-looking statements. These statements may include, without limitation, statements concerning future results ofoperations, the impact of regulatory initiatives on KPN’s operations, KPN’s and its joint ventures' share of new and existing markets, general industry and macro-economic trends and KPN’sperformance relative thereto and statements preceded by, followed by or including the words “believes”, “expects”, “anticipates”, “will”, “may”, “could”, “should”, “intends”, “estimate”,“plan”, “goal”, “target”, “aim” or similar expressions.These forward-looking statements rely on a number of assumptions concerning future events and are subject to uncertainties and other factors, many of which are outside KPN’s controlthat could cause actual results to differ materially from such statements and speak only as of the date they are made. A number of these factors are described (not exhaustively) in theIntegrated Annual Report 2016.
Investor presentation | Appendix | Safe harbor |