18 nov 2010
DESCRIPTION
FINANCE. 18 Nov 2010. Introduction. The financial system coordinates saving and investment. Participants in the financial system make decisions regarding the allocation of resources over time and the handling of risk. Finance is the field that studies such decision making. 0. - PowerPoint PPT PresentationTRANSCRIPT

18 NOV 2010
FINANCE
THE BASIC TOOLS OF FINANCE 1

THE BASIC TOOLS OF FINANCE 2
IntroductionIntroduction
The financial system coordinates saving and investment.
Participants in the financial system make decisions regarding the allocation of resources over time and the handling of risk.
Finance is the field that studies such decision making.

THE BASIC TOOLS OF FINANCE 3
Present Value: The Time Value of Money
To compare a sums from different times, we use the concept of present value.
The present value of a future sum: the amount that would be needed today to yield that future sum at prevailing interest rates
Related concept: The future value of a sum: the amount the sum will be worth at a given future date, when allowed to earn interest at the prevailing rate

THE BASIC TOOLS OF FINANCE 4
EXAMPLE 1: A Simple Deposit Deposit $100 in the bank at 5% interest.
What is the future value (FV) of this amount?
In N years, FV = $100(1 + 0.05)N
In three years, FV = $100(1 + 0.05)3 = $115.76
In two years, FV = $100(1 + 0.05)2 = $110.25
In one year, FV = $100(1 + 0.05) = $105.00
THE BASIC TOOLS OF FINANCE 5
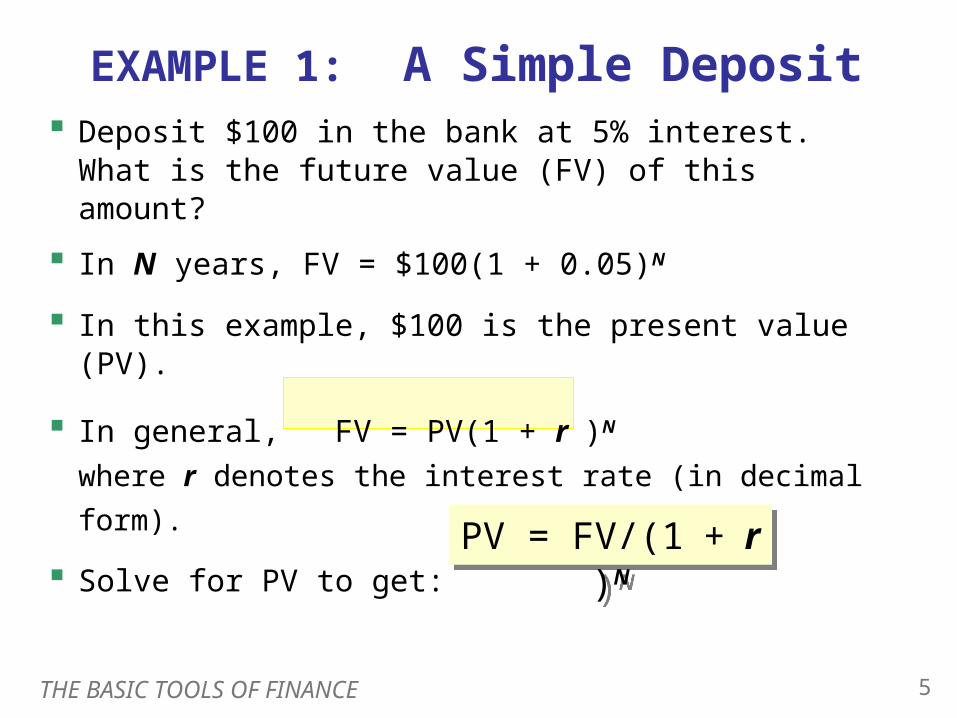
Deposit $100 in the bank at 5% interest. What is the future value (FV) of this amount?
In N years, FV = $100(1 + 0.05)N
In this example, $100 is the present value (PV).
In general, FV = PV(1 + r )N
where r denotes the interest rate (in decimal form).
Solve for PV to get:
EXAMPLE 1: A Simple Deposit
PV = FV/(1 + r )NPV = FV/(1 + r )N

THE BASIC TOOLS OF FINANCE 6
EXAMPLE 2: Investment Decision
Suppose r = 0.06. Should General Motors spend $100 million to build a factory that will yield $200 million in ten years?
Solution: Find present value of $200 million in 10 years:
PV = ($200 million)/(1.06)10 = $112 million
Since PV > cost of factory, GM should build it.
Present value formula: PV = FV/(1 + r )NPresent value formula: PV = FV/(1 + r )N

THE BASIC TOOLS OF FINANCE 7
EXAMPLE 2: Investment Decision
Instead, suppose r = 0.09. Should General Motors spend $100 million to build a factory that will yield $200 million in ten years?
Solution: Find present value of $200 million in 10 years:
PV = ($200 million)/(1.09)10 = $84 million
Since PV < cost of factory, GM should not build it.
Present value helps explain why investment falls when the interest rate rises.
Present value helps explain why investment falls when the interest rate rises.
THE BASIC TOOLS OF FINANCE 8
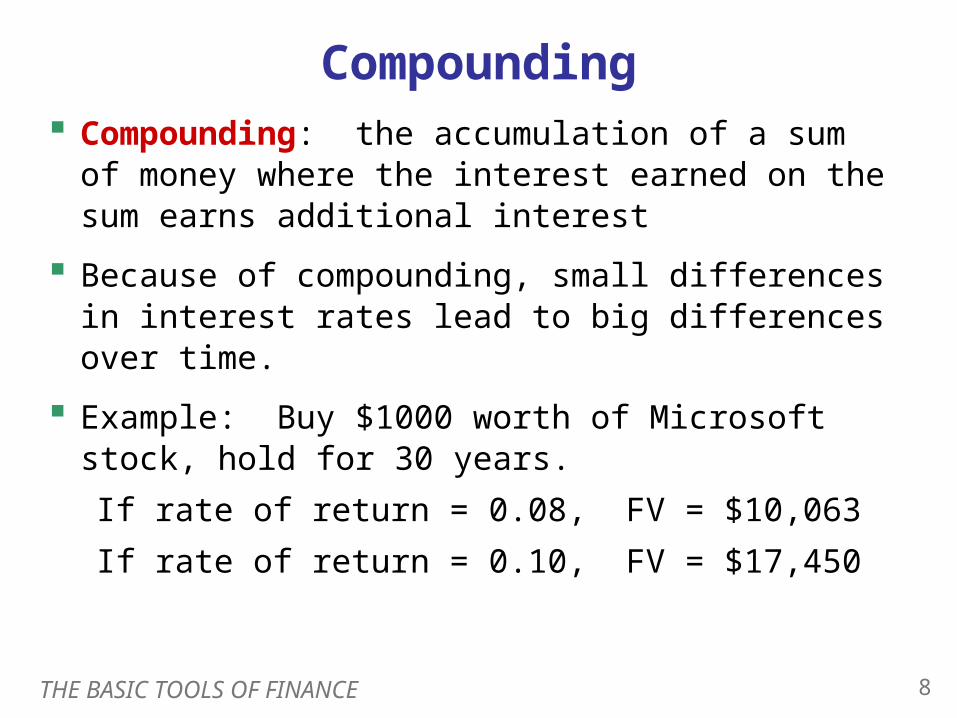
Compounding Compounding: the accumulation of a sum of
money where the interest earned on the sum earns additional interest
Because of compounding, small differences in interest rates lead to big differences over time.
Example: Buy $1000 worth of Microsoft stock, hold for 30 years.
If rate of return = 0.08, FV = $10,063
If rate of return = 0.10, FV = $17,450

THE BASIC TOOLS OF FINANCE 9
The Rule of 72 The Rule of 72:
If a variable grows at a rate of x percent per year, that variable will double in about 72/x years.
Example:
If interest rate is 5%, a deposit will double in about 14 years.
If interest rate is 7%, a deposit will double in about 10 years.

THE BASIC TOOLS OF FINANCE 10
Risk Aversion Most people are risk averse – they dislike
uncertainty.
Example: You are offered the following gamble.Toss a fair coin. If heads, you win $1000. If tails, you lose $1000.
Should you take this gamble?
If you are risk averse, the pain of losing $1000 would exceed the pleasure of winning $1000, and both outcomes are equally likely, so you should not take this gamble.

THE BASIC TOOLS OF FINANCE 11
The Utility Function
Wealth
Utility
Current wealth
Current utility
Utility is a subjective measure of well-being that depends on wealth.
Utility is a subjective measure of well-being that depends on wealth.As wealth rises, the
curve becomes flatter due to diminishing marginal utility:
the more wealth a person has, the less extra utility he would get from an extra dollar.
As wealth rises, the curve becomes flatter due to diminishing marginal utility:
the more wealth a person has, the less extra utility he would get from an extra dollar.

THE BASIC TOOLS OF FINANCE 12
The Utility Function and Risk Aversion
Because of diminishing marginal utility, a $1000 loss reduces utility more than a $1000 gain increases it.
Because of diminishing marginal utility, a $1000 loss reduces utility more than a $1000 gain increases it.
Wealth
Utility
–1000 +1000
Utility loss from losing
$1000
Utility gain from winning $1000

THE BASIC TOOLS OF FINANCE 13
Managing Risk With Insurance How insurance works:
A person facing a risk pays a fee to the insurance company, which in return accepts part or all of the risk.
Insurance allows risks to be pooled, and can make risk averse people better off:
E.g., it is easier for 10,000 people to each bear 1/10,000 of the risk of a house burning down than for one person to bear the entire risk alone.

THE BASIC TOOLS OF FINANCE 14
Two Problems in Insurance Markets
1. Adverse selection: A high-risk person benefits more from insurance, so is more likely to purchase it.
2. Moral hazard: People with insurance have less incentive to avoid risky behavior.
Insurance companies cannot fully guard against these problems, so they must charge higher prices.
As a result, low-risk people sometimes forego insurance and lose the benefits of risk-pooling.

THE BASIC TOOLS OF FINANCE 15
Reducing Risk Through Diversification
Diversification reduces risk by replacing a single risk with a large number of smaller, unrelated risks.
A diversified portfolio contains assets whose returns are not strongly related: Some assets will realize high returns,
others low returns. The high and low returns average out,
so the portfolio is likely to earn an intermediate return more consistently than any of the assets it contains.

THE BASIC TOOLS OF FINANCE 16
Reducing Risk Through Diversification
Diversification can reduce firm-specific risk, which affects only a single company.
Diversification cannot reduce market risk, which affects all companies in the stock market.

THE BASIC TOOLS OF FINANCE 17
Reducing Risk Through Diversification
Increasing the number of stocks reduces firm-specific risk.
Increasing the number of stocks reduces firm-specific risk.
Sta
nd
ard
dev
of
po
rtfo
lio
ret
urn
# of stocks in portfolio
0
10
20
30
40
50
0 10 20 30 40
But market risk remains.
But market risk remains.

THE BASIC TOOLS OF FINANCE 18
The Tradeoff Between Risk and Return
Tradeoff: Riskier assets pay a higher return, on average, to compensate for the extra risk of holding them.
E.g., over past 200 years, average real return on stocks, 8%. On short-term govt bonds, 3%.

THE BASIC TOOLS OF FINANCE 19
The Tradeoff Between Risk and Return
Example: Suppose you are dividing your portfolio between two asset classes.
A diversified group of risky stocks: average return = 8%, standard dev. = 20%
A safe asset: return = 3%, standard dev. = 0%
The risk and return on the portfolio depends on the percentage of each asset class in the portfolio…

THE BASIC TOOLS OF FINANCE 20
The Tradeoff Between Risk and Return
Increasing the share of stocks in the portfolio increases the average return but also the risk.
Increasing the share of stocks in the portfolio increases the average return but also the risk.

THE BASIC TOOLS OF FINANCE 21
Asset Valuation When deciding whether to buy a company’s stock,
you compare the price of the shares to the value of the company.
If share price > value, the stock is overvalued.
If price < value, the stock is undervalued.
If price = value, the stock is fairly valued.

THE BASIC TOOLS OF FINANCE 22
Asset Valuation Value of a share
= PV of any dividends the stock will pay + PV of the price you get when you sell the share
Problem: When you buy the share, you don’t know what future dividends or prices will be.
One way to value a stock: fundamental analysis, the study of a company’s accounting statements and future prospects to determine its value

THE BASIC TOOLS OF FINANCE 23
The Efficient Markets Hypothesis
Efficient Markets Hypothesis (EMH): the theory that each asset price reflects all publicly available information about the value of the asset

THE BASIC TOOLS OF FINANCE 24
Implications of EMH1. Stock market is informationally efficient:
Each stock price reflects all available information about the value of the company.
2. Stock prices follow a random walk: A stock price only changes in response to new information (“news”) about the company’s value. News cannot be predicted, so stock price movements should be impossible to predict.
3. It is impossible to systematically beat the market.By the time the news reaches you, mutual fund managers will have already acted on it.

THE BASIC TOOLS OF FINANCE 25
Index Funds vs. Managed Funds
An index fund is a mutual fund that buys all the stocks in a given stock index.
An actively managed mutual fund aims to buy only the best stocks.
Actively managed funds have higher expenses than index funds.
EMH implies that returns on actively managed funds should not consistently exceed the returns on index funds.

THE BASIC TOOLS OF FINANCE 26
Index Funds vs. Managed Funds
.550
1.272
12.5
10.3
S&P SmallCap 600 (index fund)
Managed mid cap funds
.535
1.458
10.9
8.1
S&P MidCap 400 (index fund)
Managed mid cap funds
.351
1.020
6.2%
5.9
S&P 500 (index fund)
Managed large cap funds
2006 expense
ratio
2001-2006 annualized
return
THE BASIC TOOLS OF FINANCE 27
Market Irrationality Many believe that stock price movements are
partly psychological:
J.M. Keynes: stock prices driven by “animal spirits,” “waves of pessimism and optimism”
Alan Greenspan: 1990s stock market boom due to “irrational exuberance”
Bubbles occur when speculators buy overvalued assets expecting prices to rise further.
The importance of departures from rational pricing is not known.

THE BASIC TOOLS OF FINANCE 28
CONCLUSION Basic tools people use when they make financial
decisions.
The efficient markets hypothesis teaches that a stock price should reflect the company’s expected future profitability.
Fluctuations in the stock market have important macroeconomic implications, which we will study later in this course.