(17e00103) managerial economics - bimkadapa.in merged pdf 345.pdf · and significance of elasticity...
TRANSCRIPT

1 | P a g e
UNIT -3 PRODUCTION ANALYSIS BALAJI INSTITUTE OF IT AND MANAGEMENT
(17E00103) MANAGERIAL ECONOMICS Objective of this course is to understand the relevance of economics in business
management. This will enable the students to study functional areas of management such
as Marketing, Production and Costing from a broader perspective.
1. Introduction to Managerial Economics: Definition, Nature and Scope, Relationship
with other areas in Economics, Production Management, Marketing, Finance and
Personnel, Operations research - The role of managerial economist. Objectives of the
firm: Managerial theories of firm, Behavioural theories of firm, optimization
techniques, New management tools of optimization.
2. Theory of Demand: Demand Analysis – Law of Demand - Elasticity of demand, types
and significance of Elasticity of Demand. Demand estimation – Marketing research
approaches to demand estimation. Need for forecasting, forecasting techniques.
3. Production Analysis: Production function, Isoquants and Isocosts, Production
function with one/two variables, Cobb-Douglas Production Function, Returns to
Scale and Returns to Factors, Economies of scale- Cost concepts - cost-output
relationship in the short run and long run, Average cost curves - Break Even Analysis.
4. Market Structure and Pricing practices: Features and Types of different competitive
situations - Price-Output determination in Perfect competition, Monopoly,
Monopolistic competition and Oligopoly. Pricing philosophy – Pricing methods in
practice: Price discrimination, product line pricing. Pricing strategies: skimming
pricing, penetration pricing, Loss Leader pricing. Pricing of multiple products.
5. Inflation and Business Cycles:-Definition and meaning-characteristics of Inflation-
types of inflation - effects of inflation - Anti-Inflationary methods - Definition and
characteristics of business cycles-phases of business cycle - steps to avoid business
cycle
Textbooks:
Managerial Economics Analysis, Problems ,Cases ,Mehta,P.L., Sultan Chand &Sons.
Managerial Economics, Gupta, TMH
References
Managerial Economics, D.N.Dwivedi,Eighth Edition,Vikas Publications
Managerial Economics, Pearson Education, James L.Pappas and Engene
F.Brigham
Managerial Economics, Suma Damodaran, Oxford.
Macro Economics by MN Jhingan-Oxford
Managerial Economics- Dr.DM.Mithani-Himalaya Publishers
Managerial Economics-Dr.H.L Ahuja-S.Chand and Com pvt ltd, NewDelhi
Managerial Economics by Dominick Salvatore, Ravikesh Srivastava- Oxford
University press.
Managerial Economics by Hirschey- Cengage Learning

2 | P a g e
UNIT -3 PRODUCTION ANALYSIS BALAJI INSTITUTE OF IT AND MANAGEMENT
UNIT-3
PRODUCTION ANALYSIS
1. PRODUCTION FUNCTION:
1.1: PRODUCTION ANALYSIS:
MEANING AND DEFINITION OF PRODUCTION
Production analysis or theory of production deals with a relationship between
input factors and output the operational efficiency for optimum output and
cost of production is not considered.
ACCORDING TO JAMES BATES AND J.R. PARKINSON,” production is the
organized activity of transforming resources into finished products in the form
of goods and services and the objective of production is to satisfy the demand
of such transformed resources”.
1.2: FACTORS OF PRODUCTION:
Production requires the use of certain resources. Each particular resource may
be called a factor of production. Anything that contributes towards output is a
factor of production. For the sake of convenience it is usual to group all
productive resources fewer than four heads land labor capital and organization
each group being called a factor of production.
PRODUCTION
1. LAND:
The term is used in different sense in economics.
It does not mean soil or earth’s surface alone but refers to all free
gift of nature which would include besides the land in common
parlance natural resources fertility of soil water air natural vegetation
etc.
2. LABOUR:
The term labor means mental or physical exertion directed to
produce goods or services.
In other words it refers to various types of human effort require the
use of physical exertion skill and intellect.
Labor to have an economic significance must be one which is done
with the motive of some economic reward. Division of labor is an
important feature of modern industrial organization.
3 | P a g e
UNIT -3 PRODUCTION ANALYSIS BALAJI INSTITUTE OF IT AND MANAGEMENT
3. CAPITAL:
Capital may be defined as that part of wealth of an individual or
community which is used for further production of wealth.
In fact capital is a stock concept which yields as produced means of
production.
4. ENTREPRENEUR:
It is the factor which mobilizes the other factors land, labor, and
capital; combines them in the right proportion then initiates the
process of production and bears the risk involves in it.
This factor is known as the entrepreneur. He has also been called the
organizer, the manager or the risk taker.
1.3 PRODUCTION FUNTION:
Production function states the relationship between inputs and output
i.e., the amount of output that can be produced with given quantities of
inputs under a given state of technical knowledge.
The output takes the form of volume of goods or services and the inputs
are different factors of production i.e., land, labor, capital and
enterprise.
Mathematically the production function is described as,
Q = f (X1, X2, X3 ………Xn)
Where,
Q = Quantity produced during a given period of time
(X1, X2, X3 ……..Xn) = Quantities of various inputs used in production.
Production function can also be defined in a different way. If shows the
minimum quantities of various inputs that are required to yield a given
quantity of output.
1.4: ASSUMPTIONS OF PRODUCTION FUNCTIONS
The production function has following assumptions,
1. Perfect divisibility of both inputs and output
2. Limited substitution on one factor for the other.
3. The level of technology remains constant
4. Inelastic supply of fixed factors in the short run
5. It is related to specified period of time.
1.5: SIGNIFICANCE OF PRODUCTION FUNCTIONS

4 | P a g e
UNIT -3 PRODUCTION ANALYSIS BALAJI INSTITUTE OF IT AND MANAGEMENT
Production function analysis is of practical importance in managerial decision
making in business.
Some of its managerial uses are given below,
1. Production function analysis is of great of help in making shot period
decisions by business executives in two ways.
a. How to get optimum level of output from a given set of inputs
b. How to get the given level of output from the minimum set of inputs.
2. Production function analysis is of highly useful in making long period
decisions by business executives If returns to scale are increasing it will
be worthwhile to increase production if returns to scale are diminishing
it will be worthwhile to decrees production and if returns to scale
remain constant it would be indifferent to the producer whether to
increase or decrease production if demand is no constraint.
3. Production function analysis is of great use to calculate the least cost
combination of various factors in outs for a given level of output or the
maximum output input combination for a given cost.
4. Production function analysis is logical and also to common sense if the
price of one factor input falls while one for the second.
5. Production function analysis is of great importance in making decision
on the utility of employing a variable input in the production process.
1.6: LIMITATIONS OF PRODUCTION FUNCTIONS
Production function analysis has the following limitations.
1. Production function analysis has restricted itself to the case of two
inputs and one output. Mathematically, there is no great difficulty in
extending this analysis to multiple inputs and outputs.
2. Production function analysis has assumed smooth and continues curves
while in the real world, discontinuities in the production function may
appear.
3. Production function analysis assumes that technology remains constant.
But in reality it does not remain the same.
4. Production function analysis is also applied under perfectly competitive
market situations which are rare in the real world.
5. Production function analysis assumes that units of labor are
homogeneous. In reality labor units are not identical but heterogeneous
in characters.

5 | P a g e
UNIT -3 PRODUCTION ANALYSIS BALAJI INSTITUTE OF IT AND MANAGEMENT
2. ISOQUANTS AND ISOCOSTS:
2.1: MEANING AND DEFINITION OF ISOQUANTS
Isoquant is also known as production function with two variable inputs
or equal product curves
DEFINITION:
According to FERGUSON, an isoquant is a curve showing all possible
combinations of inputs physically capable of producing a given level of output.
The combinations of all variable inputs which can yield the same output
with various combinations are termed as isoquants.
They are also known as iso-product or iso-product curve. For better
understanding of isoquants following schedule may be seen which gives
various combinations of variable factors x and y for a given level of
output.
factors x and y for a given level of output.
Table 3.2: combination of two inputs
Factor combination Factor X Factor Y
A 1 12
B 2 08
C 3 05
D 4 03
E 5 02
Each of the factor combinations A, B, C, D and E represents the same levels of
production say 100 units. When we plot them we get a curve IQ as shown in
figure 3.3
Figure 3.3: equal product
curve or isoquant
2.2: ASSUMPTIONS OF ISOQUANTS
Isoquant analysis is normally based on the following assumptions
1. It has been assumed that there are only two factors of input for
geometrical representation but in practice there are generally four or
five or even more variable used in production.
6 | P a g e
UNIT -3 PRODUCTION ANALYSIS BALAJI INSTITUTE OF IT AND MANAGEMENT
2. It has been assumed that factors of production are divisible in small
units and can be used in various proportions. In practice it not feasible
for all factors.
3. Technology constraints do not permit to change the input variables at
any point of time.
4. During production utmost care is taken to utilize the different factors in
most efficient way. This practice has not been followed in this
assumption.
2.3: TYPES OF ISOQUANTS
Isoquants assume different shapes depending upon the degree of
substitutability of inputs under consideration.
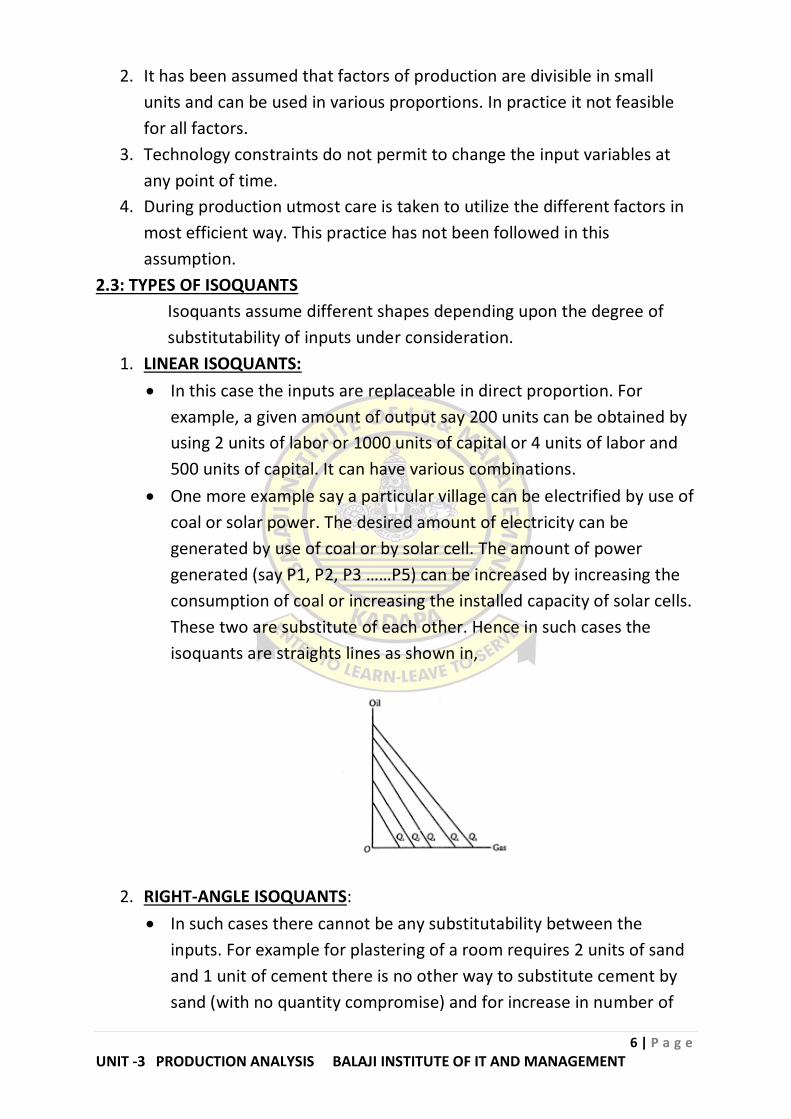
1. LINEAR ISOQUANTS:
In this case the inputs are replaceable in direct proportion. For
example, a given amount of output say 200 units can be obtained by
using 2 units of labor or 1000 units of capital or 4 units of labor and
500 units of capital. It can have various combinations.
One more example say a particular village can be electrified by use of
coal or solar power. The desired amount of electricity can be
generated by use of coal or by solar cell. The amount of power
generated (say P1, P2, P3 ……P5) can be increased by increasing the
consumption of coal or increasing the installed capacity of solar cells.
These two are substitute of each other. Hence in such cases the
isoquants are straights lines as shown in,
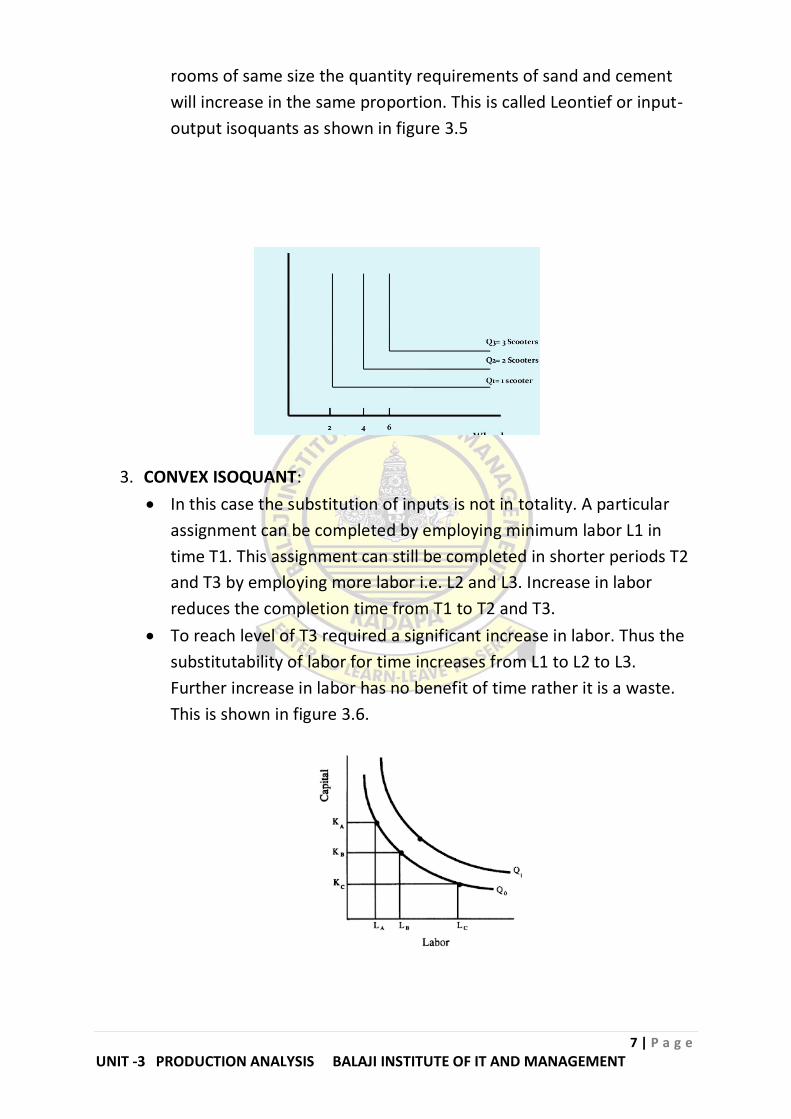
2. RIGHT-ANGLE ISOQUANTS:
In such cases there cannot be any substitutability between the
inputs. For example for plastering of a room requires 2 units of sand
and 1 unit of cement there is no other way to substitute cement by
sand (with no quantity compromise) and for increase in number of
7 | P a g e
UNIT -3 PRODUCTION ANALYSIS BALAJI INSTITUTE OF IT AND MANAGEMENT
rooms of same size the quantity requirements of sand and cement
will increase in the same proportion. This is called Leontief or input-
output isoquants as shown in figure 3.5
3. CONVEX ISOQUANT:
In this case the substitution of inputs is not in totality. A particular
assignment can be completed by employing minimum labor L1 in
time T1. This assignment can still be completed in shorter periods T2
and T3 by employing more labor i.e. L2 and L3. Increase in labor
reduces the completion time from T1 to T2 and T3.
To reach level of T3 required a significant increase in labor. Thus the
substitutability of labor for time increases from L1 to L2 to L3.
Further increase in labor has no benefit of time rather it is a waste.
This is shown in figure 3.6.

8 | P a g e
UNIT -3 PRODUCTION ANALYSIS BALAJI INSTITUTE OF IT AND MANAGEMENT
2.4: GENERAL PROPERTIES OF ISOQUANT CURVES:
The properties of isoquants are describes below
1. ISOQUANTS AE NEGATIVELY SLOPED: Generally isoquants sloe
downwards in anticlockwise direction and follow a negative slope. This is
due to the fact that reduction of one input factor requirements
appropriate increase in other factor for maintaining the same level of
output.
Figure3.7: isoquant having positively-sloped segments
2. HIGHER ISOQUANT REPRESENTS A LARGER OUTPUT: the higher
isoquant is one which can yield higher output by use of same amount of
one factor and higher amount of other factor or higher amount of both
the factors.
Figure 3.8: two isoquants representing different output
levels.
3. TOW ISOQUANTS INTERSECT OR TOUCH EACH OTHER: since isoquants
represents different level of output and hence they do not intersect or
touch each other.

9 | P a g e
UNIT -3 PRODUCTION ANALYSIS BALAJI INSTITUTE OF IT AND MANAGEMENT
4. ISOQUANTS ARE CONVEX TO THE ORIGIN: generally in production
processes substitutes can be arranged such as labor can be substituted
by capital and vice versa. However the marginal rate of substitution has
a decreasing tendency.
Figure: convexity of an isoquant
2.5: ISOCOSTS:
Iso-cost curve is the path traced by several combinations of L and K
where each of them requires the same amount of money for production.
On differentiating the equation with respect to L we get dK/dL = -w/r,
that represents the slope of the iso-cost curve.
Iso-cots line represents the various combination of labor and capital
which an industry can use for a given factor price.
The slop of this online is a ratio dK/dL indicates the factor price. It will
shift towards right when money spent on variable factors increases.
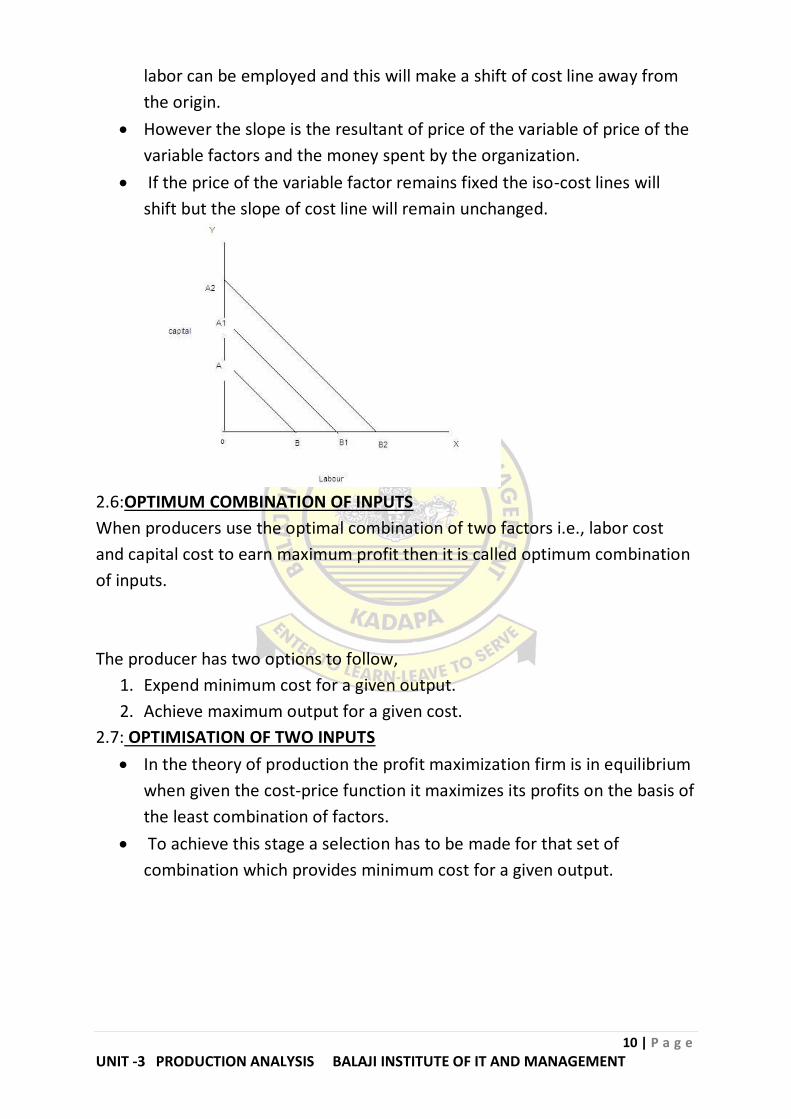
SLOPE OF ISO-COST LINE
It is clear that with variation of factors i.e., labor and capital the slope of
the cost line can be varied. If the price of the labor decreases then more
10 | P a g e
UNIT -3 PRODUCTION ANALYSIS BALAJI INSTITUTE OF IT AND MANAGEMENT
labor can be employed and this will make a shift of cost line away from
the origin.
However the slope is the resultant of price of the variable of price of the
variable factors and the money spent by the organization.
If the price of the variable factor remains fixed the iso-cost lines will
shift but the slope of cost line will remain unchanged.
2.6:OPTIMUM COMBINATION OF INPUTS
When producers use the optimal combination of two factors i.e., labor cost
and capital cost to earn maximum profit then it is called optimum combination
of inputs.
The producer has two options to follow,
1. Expend minimum cost for a given output.
2. Achieve maximum output for a given cost.
2.7: OPTIMISATION OF TWO INPUTS
In the theory of production the profit maximization firm is in equilibrium
when given the cost-price function it maximizes its profits on the basis of
the least combination of factors.
To achieve this stage a selection has to be made for that set of
combination which provides minimum cost for a given output.

11 | P a g e
UNIT -3 PRODUCTION ANALYSIS BALAJI INSTITUTE OF IT AND MANAGEMENT
3. PRODUCTION FUNCTION WITH ONE VARIABLE INPUT RETURNS
TO FACTOR
3.1: MEANING AND DEFINITION RETURNS TO FACTORS/LAW OF VARIABLE
PROPORTIONS
Return to factors is known as the law of available proportions or
production function with one variable.
In short period of time during production the technical conditions
remain unchanged and it implies that for a specified output the input
factors proportions remain unchanged.
However it is possible to increase one of the input factors for having
increased output while maintaining the other input factors as constant.
DEFINITION:
According to F. BENHA, as the proportion of one factor in a combination of
factors is increased after a point first the marginal and then the average
product of that factor will diminish.
3.2: ASSUMPTIONS OF LAW OF VARIABLE PROPORTIONS
The law of diminishing returns is based on the following assumptions
1. Only one factor is varied and others are kept fixed
2. It is assumed that factors which are variable are same in all respect and
there are no variations.
3. There is no change in technology
4. The proportions of inputs can be varied
5. This is applicable for short period only I long terms all factors are
variable.
6. Due to fall and rise in price of the product the returns in terms of money
may decrease or increase irrespective of output which is measured in
physical quantities like tones quintals.
3.3: TOTAL AVERAGE AND MARGINAL PRODUCT
Before discussing the relationship it is important to understand the
following terms
1. TOTAL PRODUCTION: It is the resultant output of all input factors at any
given time.
2. AV ERAGE PRODUCTION: the average product is one which is obtained at
the expense of per unit of input factor. It is shown in column 3 of the
table given below. The increase in input variable increases the average

12 | P a g e
UNIT -3 PRODUCTION ANALYSIS BALAJI INSTITUTE OF IT AND MANAGEMENT
product till it reaches to maximum level and further increase in input
variable results in decrease in average product.
3. MARGINAL PRODUCTION: it is the change in total product due to per
unit change in input variable factor. In other words it is the increase in
total production with per unit increase in input.
3.4: THREE STAGES OF LAW OF VARIABLE PROPORTIONS
These stages are described below
STAGE-1: LAW OF INCREASING RETURNS
The variation characteristics of total product marginal product, and average
product are indicated with variation of labor. The total product marginal
product and average product increases till point 1 is reached. After this stage
although total product rises but rate of increase is reduced considerable.
REASONS FOR INCREASING RETURNS TO A FACTOR
Main reasons of the applications are as under
1. UNDER-UTILISATION OF FIXED FACTOR: in the beginning of the
production some factors remain unutilized /underutilized and with
increase in variable factors these are fully utilized these results in
i9ncrease in output.
2. INDIVISIBILITY FACTOR: Due to technological constrains certain factors
remain indivisible and are required to reach a minimum level of that
input to run the industry irrespective of the output level. The output can
be enhanced with inclusion of other variable factors.
3. SPECIALISATION AND DIVISION OF LABOR: increase in variable factors
increases the
Possibility of division of labor which generates specialization of labor
increase in efficiency and output.
13 | P a g e
UNIT -3 PRODUCTION ANALYSIS BALAJI INSTITUTE OF IT AND MANAGEMENT
STAGE-2: LAW OF DIMINISHING RETURNS: the total product keep on
increasing with diminishing rate and it reaches to maximum point M, where
the second stage ends. In this stage the average and marginal product also fall
but marginal product falls at faster rate than average product rate. This is a
very important stage since industries are needed to operate at this stage as
well.
REASONS FOR LAW OF DIMINISHING RETURNS
The reasons are described as below
1. CERTAIN FACTORS REMAIN FIXED:
The four factors such as land labor capital and enterprise cannot be
increases at any point of time.
But obtaining a higher rate of production it is required that the
factor of production increased at higher rate. Due to constraints it is
not possible to increase these production factors any more.
This may bring new competitors who may adversely affect the
business.
2. CERTAIN FACTORS BECOME SCARCE:
Sometimes factors like land labor or specially trained labor and
capital become scarce and cannot be increased any further.
This will adversely affect the output rate of the organization.
3. LACK OF PERFECT SUBSTITUTION OF PRODUCTION FACTORS:
During production process some factors become short in supply and
producers are forced to use substitutes which are also not always
available. This results in decreasing in output.
4. ACHIEVEMENT OF OPTIMUM CAPACITY:
After optimum utilization of all factors in production and utilization
of full plant capacity a saturation point is reached beyond that the
output cannot be increased any further.
IMPORTANCE OF THE LAW OF DIMINISHING RETURNS
Law of diminishing returns has a great importance in economics. This can be
understood by following points,
1. Universal
2. Basis of the theory of population
3. Basis of theory of rent
4. Basis of theory of distribution
5. Basis of optimum production

14 | P a g e
UNIT -3 PRODUCTION ANALYSIS BALAJI INSTITUTE OF IT AND MANAGEMENT
STAGE-3: LAW OF NEGATIVE RETURNS: at this stage there is a decline in all
respect i.e., total product marginal product and average product. This stage is
termed as stage of negative returns.
REASONS FOR LAW OF NEGATIVE RETURNS
1. REDUCTION IN VARIABLE FACTOR: in such condition the quantity or
number of variable factor is in excess obstruct the movement of other
fixed factors resulting in reduction of output. The reduction in quantity
or number of variable factor is the right choice in such condition.
2. MOVING BEYOND OPTIMUM LEVEL: when the plant has reached at a
level where all inputs are being utilized to the maximum limit the further
movement will result in under utilization of inputs. This will results in
decreased efficiency and losses.
4. COBB-DOUGLAS PRODUCTION FUNCTION
CHARLES W. COBB AND PAUL H. DOUGLAS studied the relationship of inputs
and outputs and formed an empirical production function popularly known as
COBB-DOUGLAS production function. Originally C-D production function
applied not to the production process of an individual form but to the whole of
the manufacturing production.
The COBB-DOUGLAS production is expressed by
Q = AL
Where Q = output
L and K = inputs of labor and capital respectively.
A and = positive parameters where
The equation tells that output depends directly on L and K and that part of
output which cannot be explained by L and K is explained which the residual is
often called technical change.
The marginal products of labor and capital are the functions of the parameters
A and the ratios of labor and capital inputs i.e.,
The two parameters and taken together measure the degree of the
homogeneity of the function. In other words this function characterizes the
returns to scale thus.
a. Increasing returns to scale
b. Constant returns to scale
c. Decreasing returns to scale.

15 | P a g e
UNIT -3 PRODUCTION ANALYSIS BALAJI INSTITUTE OF IT AND MANAGEMENT
4.1 PROPERTIES OF COBB-DOUGLAS PRODUCTION FUNCTION
The COBB-LOUGLAS production function has the following properties,
1. There are constant returns to scale
2. Elasticity of substitution is equal to one.
3. And represent the labor and capital shares of output respectively.
4. And are also elasticity of output with respect to labor and capital
respectively.
5. If one of the inputs is zero, output will also be zero.
6. The expansion path generated by C-D function is linear and it passes
thro9ugh the origin.
7. The marginal product of labor is equal to the increase in output when
the labor input is increased by one unit.
8. The average product of labor is equal to the ratio between output and
labor input.
9. The ratio measures factor intensity. The higher this ratio the more
labor intensive is the technique and the lower is this ratio and the more
capital intensive is the technique of production.
4.2 IMPORTANCE OF COBB-DOUGLAS PRODUCTION FUNCTION
COBB-DOUGLAS production function is most popular in empirical research. The
reasons for this are many,
1. The COBB-DOUGLAS function is convenient for international and inter-
industry comparisons. Since and (which are partial elasticity
coefficients) are pure numbers (i.e., independent of units of
measurement) they can be easily used for comparing results of different
samples having varied units of measurements.
2. Another advantage is that this function captures the essential non
legerities of production process and also the benefit of the simplification
of calculation by transforming the function into a linear form with the
help of logarithms. The log-linear function becomes linear in its
parameters which is quite useful to a managerial economist for his
analysis.
3. In addition to being elasticity’s the parameters of COBB-DOUGLAS
function also possess other attributes. For examples, the sum of
shows the returns to scale in the production process and present
the labor share and capital share of output respectively and so on.
16 | P a g e
UNIT -3 PRODUCTION ANALYSIS BALAJI INSTITUTE OF IT AND MANAGEMENT
4. This function can be used to investigate the nature of long run
production function increasing constant and decreasing returns to scale.
5. Although in its original form COBB-DOUGLAS production function limits
itself to handling just tow inputs (e.g., L and K) it can be easily
generalized for more than two inputs like,
Where, Q = Output
X1, X2, X3 …...Xn = different inputs.
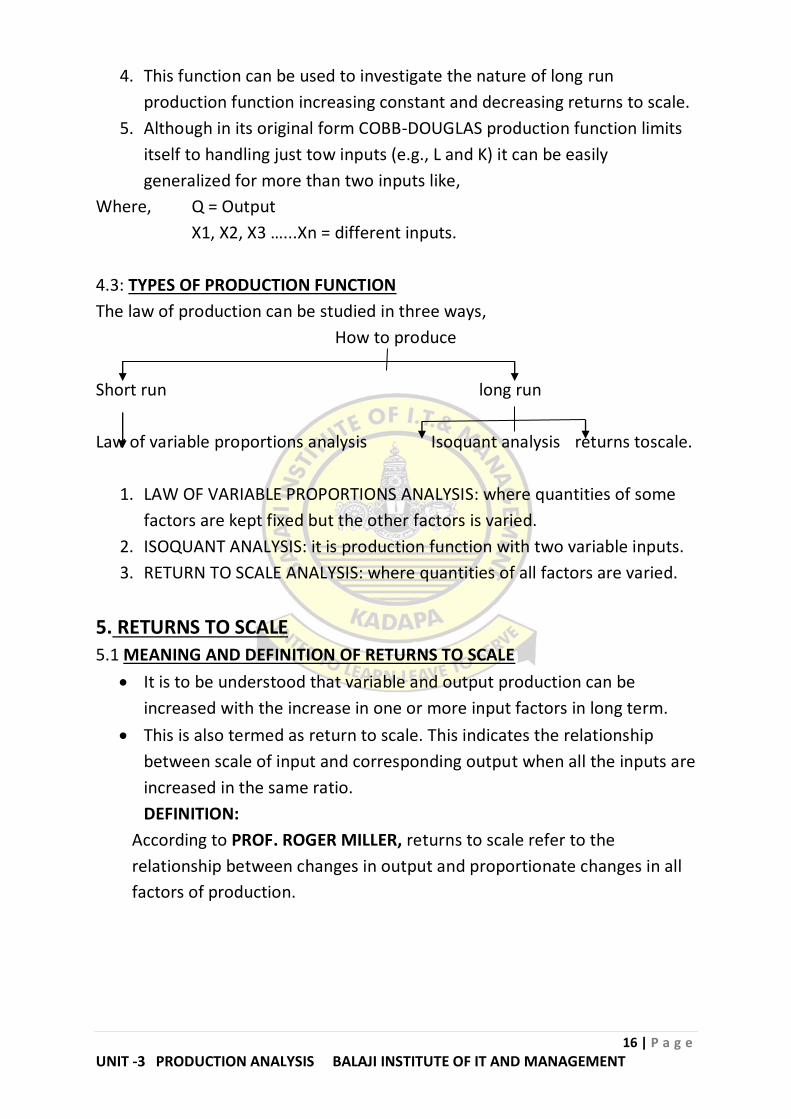
4.3: TYPES OF PRODUCTION FUNCTION
The law of production can be studied in three ways,
How to produce
Short run long run
Law of variable proportions analysis Isoquant analysis returns toscale.
1. LAW OF VARIABLE PROPORTIONS ANALYSIS: where quantities of some
factors are kept fixed but the other factors is varied.
2. ISOQUANT ANALYSIS: it is production function with two variable inputs.
3. RETURN TO SCALE ANALYSIS: where quantities of all factors are varied.
5. RETURNS TO SCALE
5.1 MEANING AND DEFINITION OF RETURNS TO SCALE
It is to be understood that variable and output production can be
increased with the increase in one or more input factors in long term.
This is also termed as return to scale. This indicates the relationship
between scale of input and corresponding output when all the inputs are
increased in the same ratio.
DEFINITION:
According to PROF. ROGER MILLER, returns to scale refer to the
relationship between changes in output and proportionate changes in all
factors of production.
17 | P a g e
UNIT -3 PRODUCTION ANALYSIS BALAJI INSTITUTE OF IT AND MANAGEMENT
5.2 ASSUMPTIONS OF RETURNS OT SCALE
Following assumptions are made,
1. All inputs can vary except the enterprise
2. Workers accurately do their assigned work with provided tools
3. There are not technology changes during production
4. There is perfect competition
5. The output product is measured in quantities.
5.3 TYPES OF RETURNS TO SCALE
Following are the types of return to scale
1. Increasing returns to scale
2. Constant returns to scale
3. Diminishing returns to scale
According to the given assumptions with increase in factors of production i.e.,
labor and capital following possibilities will be found
1. Output may increase in same ratio as input factors
2. Output may rise at much higher rate compared to input factors
3. Output may increase in very small proportion to increase in input
factors.
It is generally found that the increase in input factors is in fixed proportions
then output increases in following three different phases.
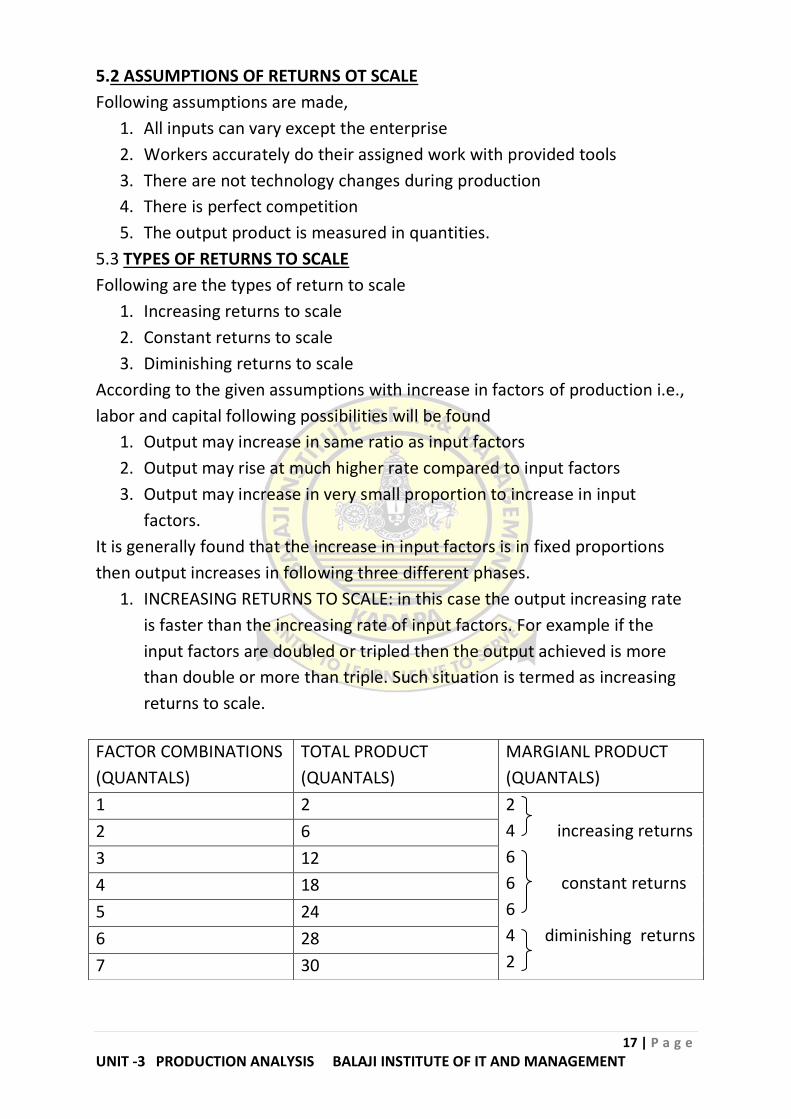
1. INCREASING RETURNS TO SCALE: in this case the output increasing rate
is faster than the increasing rate of input factors. For example if the
input factors are doubled or tripled then the output achieved is more
than double or more than triple. Such situation is termed as increasing
returns to scale.
FACTOR COMBINATIONS
(QUANTALS)
TOTAL PRODUCT
(QUANTALS)
MARGIANL PRODUCT
(QUANTALS)
1 2 2
4 increasing returns
6
6 constant returns
6
4 diminishing returns
2
2 6
3 12
4 18
5 24
6 28
7 30

18 | P a g e
UNIT -3 PRODUCTION ANALYSIS BALAJI INSTITUTE OF IT AND MANAGEMENT
2. CONSTANT RETURN TO SCALE: when the increase in total output exactly
equals to increase in inputs then this situation is termed as constant
return to scale. Such situation makes marginal returns constant.
It is evident from the table above that for 3rd, 4th and 5th units of sale of
production the marginal returns remain constant at 6th. This stage II is
indicated in figure 3.15 where the portion B to C of CD curve remains
constant. The portion B to C is horizontal or parallel to scale of production
which indicates constant return to scale.
Figure: returns to scale
3. DIMINISHING RETURNS TO SCALE: such situation indicates arrival of
saturation stage which does not permit further increases in capacity of
plant. The output increase rate is much less than the increase rate of
input factors of production. This stage of indicated as stage 3 in figure
3.15 which shows a downward trend of returns.
6. ECONOMIES DISECONOMIES OF SCALE
6.1INTRODUCTION
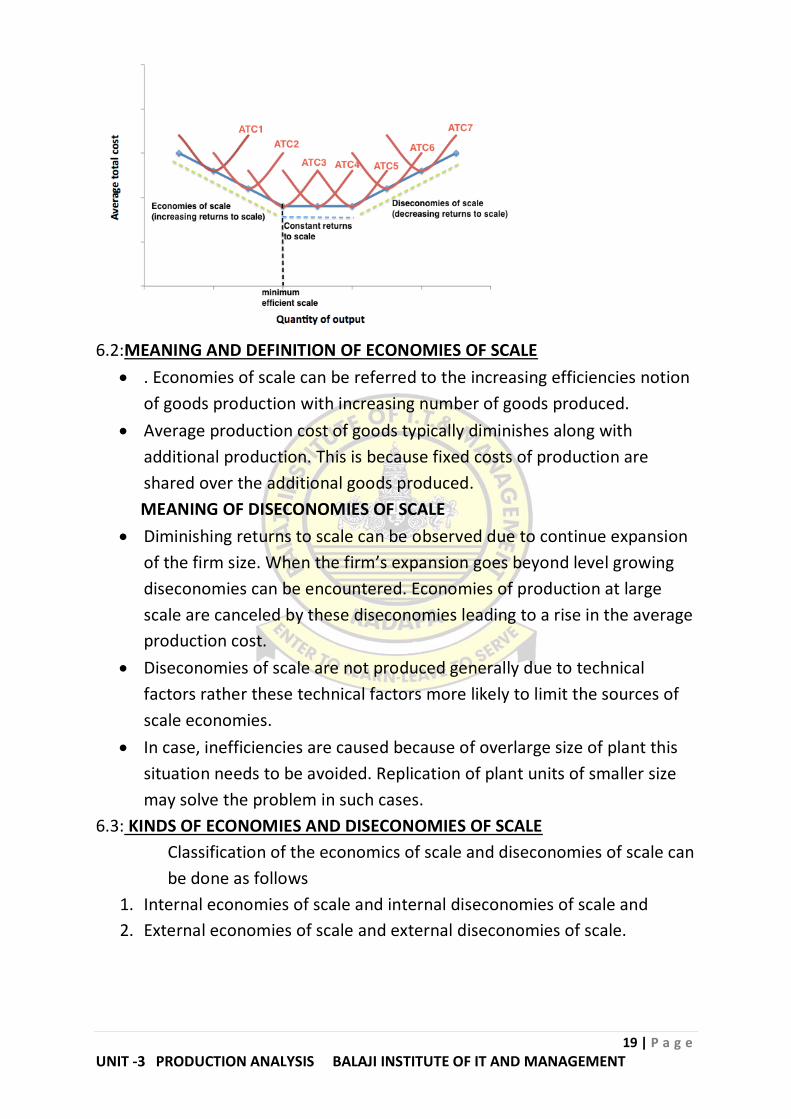
Important information about the processes of production followed by
firm for manufacturing of goods conveyed by the shape of the long-run
average total cost curve.
Economies of scale is when output increases leading to declaiming of
long-run average total cost. Similarly when output increases leading to
rise of long-run average total cost, it is known as diseconomies of scale.
19 | P a g e
UNIT -3 PRODUCTION ANALYSIS BALAJI INSTITUTE OF IT AND MANAGEMENT
6.2:MEANING AND DEFINITION OF ECONOMIES OF SCALE
. Economies of scale can be referred to the increasing efficiencies notion
of goods production with increasing number of goods produced.
Average production cost of goods typically diminishes along with
additional production. This is because fixed costs of production are
shared over the additional goods produced.
MEANING OF DISECONOMIES OF SCALE
Diminishing returns to scale can be observed due to continue expansion
of the firm size. When the firm’s expansion goes beyond level growing
diseconomies can be encountered. Economies of production at large
scale are canceled by these diseconomies leading to a rise in the average
production cost.
Diseconomies of scale are not produced generally due to technical
factors rather these technical factors more likely to limit the sources of
scale economies.
In case, inefficiencies are caused because of overlarge size of plant this
situation needs to be avoided. Replication of plant units of smaller size
may solve the problem in such cases.
6.3: KINDS OF ECONOMIES AND DISECONOMIES OF SCALE
Classification of the economics of scale and diseconomies of scale can
be done as follows
1. Internal economies of scale and internal diseconomies of scale and
2. External economies of scale and external diseconomies of scale.

20 | P a g e
UNIT -3 PRODUCTION ANALYSIS BALAJI INSTITUTE OF IT AND MANAGEMENT
a)INTERNAL ECONOMIES AND DISECONOMIES OF SCALE
1. Technical economics and diseconomies
2. Managerial economies and diseconomies
3. Commercial economies and diseconomies
4. Financial economies and diseconomies
5. Risk bearing economies and diseconomies
b) EXTERNAL ECONOMIES AND DISECONOMIES OF SCALE
EXTERNAL ECONOMIES AND DISECONOMIES OF SCALE
Cheaper raw material & capital
Equipment
Technological external economies
Development of skilled labor
Growth of ancillary industries
Better transportation and marketing facilities
1. Cheaper raw material and capital equipment.
2. Technological external economies
3. Development of skilled labor
4. Growth of ancillary industries
5. Better transportation and marketing facilities
7. COST CONCEPTS:
7.1: CONCEPT
The study of the behavior of the cost with respect to several criteria of
production such as size of output scale of operations process of factors
of production and other relevant economic variables in known as cost
analysis.
7.2: MEANING AND DEFINITION OF COST
The expenses incurred in the business activity of supplying goods and
services to consumers are defined as cost.
In economics the value of the price of the object or condition is the cost
of production which is determined by the total cost of resources
employed for producing it.

21 | P a g e
UNIT -3 PRODUCTION ANALYSIS BALAJI INSTITUTE OF IT AND MANAGEMENT
According to CAMPBELL, production costs are those which must be
received by resources owners in order to assume that they will continue
to supply them in a particular time of production.
7.3: TYPES OF COSTS
The important types of costs are as follows,
1. Opportunity cost and actual cost
2. Business cost and full cost
3. Direct cost and indirect cost
4. Incremental cost and sunk cost
5. Explicit cost and implicit cost
6. Historical cost and replacement cost
7. Past cost and future cost
8. Shut-down cost
9. Real cost and prime cost
10. Urgent cost and post potable cost
11. Escapable cost and unavoidable cost
12. Out-of-pocket cost and book cost
13. Fixed cost and variable cost
14. Total average and marginal cost
15. Short-run cost and long-run cost
16. Private cost and social cost
17. Accounting cost and economic cost
18. Money cost and selling cost
7.4: DETERMINANTS OF COST
The following are the determinants of cost
1. Law of returns operating
2. Size of the plant
3. Period
4. Capacity utilization
5. Prices of factors of production
6. Technology
7. Efficiency in the use of inputs
8. Lot size of the product
9. Output is stable and constant.

22 | P a g e
UNIT -3 PRODUCTION ANALYSIS BALAJI INSTITUTE OF IT AND MANAGEMENT
7.5 COST FUNCTION
The cost function is a mathematical relationship between cost of a
product and the various determinants of costs where dependent
variable is unit cost or total cost and the independent variable a4re the
price of a factor the size of the output or any other relevant
phenomenon which has a bearing on cost.
Symbolically we may state the function as,
C = f (O, S, T, P ……….)
Where,
C – Cost
O – Level of output
S – Size of plant
T – Time under consideration
P – Prices of factors of production
8. COST-OUTPUT RELATIONSHIP IN THE SHORT-RUN AND LONG
RUN
8.1: COST-OUTPUT RELATIONSHIP IN THE SHORT-RUN
In short-run the cost-output relationship is defined as a particular
operation scale or a fixed plant. That means there is an indication
towards cost variation over the plant output of a given capacity and,
thus there is variation in their relationship based on the varying capacity
of the plant.
In order to make decision one needs to understand the total cost and
output relationship along with knowledge of various costs and output
types separately. Thus discussion of the short-term cost-output
relationship can be carried out in terms of following,
1. Marginal cost and output
2. Average cost and output and
3. Total cost and output.
A) SHORT-RUN TOTAL COST
Total cost in short-term can be divided into two parts which are total
fixed costs and total variable costs keeping the organization scale
fixed.
TC = TFC + TVC

23 | P a g e
UNIT -3 PRODUCTION ANALYSIS BALAJI INSTITUTE OF IT AND MANAGEMENT
1. TOTAL FIXED COST OR TFC: cost of production that does not change
with respect to the output is termed as total fixed cost. These are the
costs that are totally independent of the output level. These costs in fact
are incurred even during temporary production stop by the films. These
costs are also known as the overhead cost.
total fixed cost
Units of output TFC
0 20
1 20
2 20
3 20
4 20
5 20
TFC = quantities of the fixed productive service factor price.
Illustration of a firm’s TFC is given in the following diagram and table.
Total fixed cost curve is basically a horizontal curve which lies parallel to the X-
axis representing that TFC at all output levels tends to remain same.
2. TOTAL VARIABLE COST OR TVC:
The production cost that is in direct relationship with the output is
termed as total variable cost.
These are rise in TVC with increase in the output and falls with
decrease in the output. Costs included in this type are expenses on
water raw materials taxes advertising power labor hiring etc. such
costs are also termed as direct costs.
The cost incurred on using the production variable factors is termed
as the variable costs.
24 | P a g e
UNIT -3 PRODUCTION ANALYSIS BALAJI INSTITUTE OF IT AND MANAGEMENT
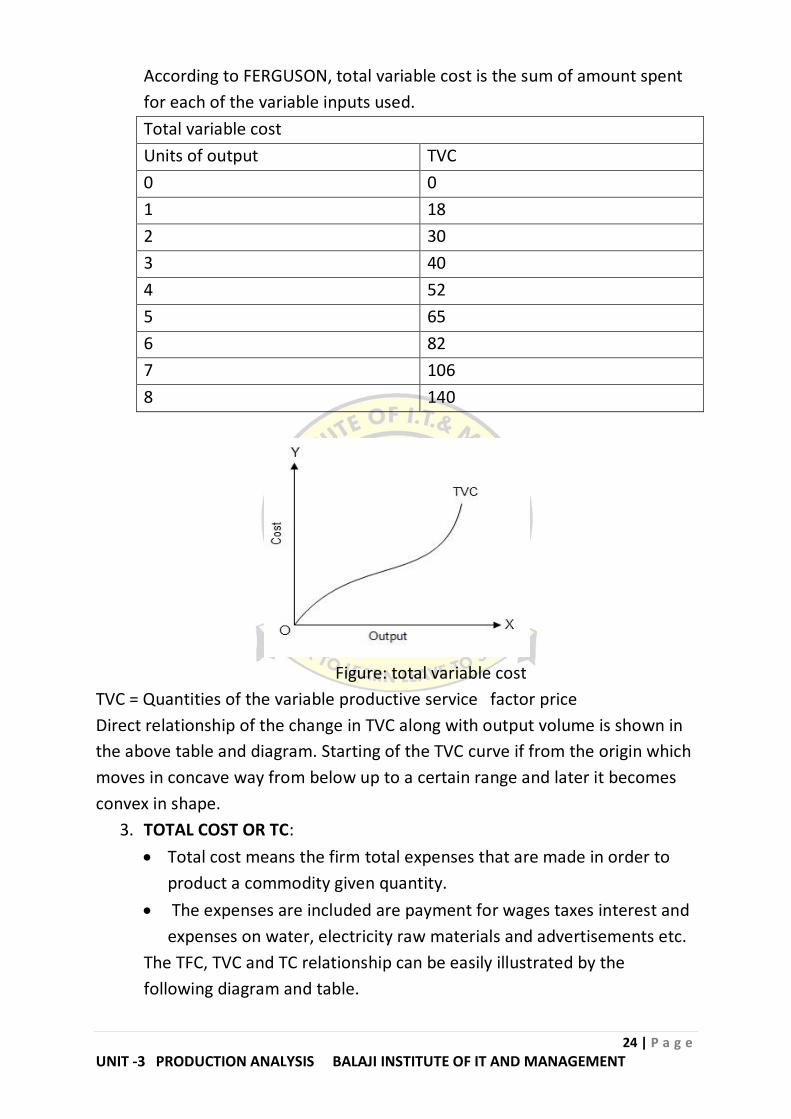
According to FERGUSON, total variable cost is the sum of amount spent
for each of the variable inputs used.
Total variable cost
Units of output TVC
0 0
1 18
2 30
3 40
4 52
5 65
6 82
7 106
8 140
Figure: total variable cost
TVC = Quantities of the variable productive service factor price
Direct relationship of the change in TVC along with output volume is shown in
the above table and diagram. Starting of the TVC curve if from the origin which
moves in concave way from below up to a certain range and later it becomes
convex in shape.
3. TOTAL COST OR TC:
Total cost means the firm total expenses that are made in order to
product a commodity given quantity.
The expenses are included are payment for wages taxes interest and
expenses on water, electricity raw materials and advertisements etc.
The TFC, TVC and TC relationship can be easily illustrated by the
following diagram and table.

25 | P a g e
UNIT -3 PRODUCTION ANALYSIS BALAJI INSTITUTE OF IT AND MANAGEMENT
EXAMPLE,
TOTAL COSTS
UNITSS OF
OUTPUT
TFC TVC TC
0 20 0 20
1 20 18 38
2 20 30 50
3 20 40 60
4 20 52 72
5 20 65 85
6 20 82 102
7 20 106 126
8 20 140 160
FIGURE: TOTAL COST
TFC curve in the lies parallel to X-axis. The origin of this curve is from a point on
Y-axis which clearly indicates that fixed will be incurred even in case when
there is no output. On the other hand there is an n increase is an increase in
the total variable cost with an increase in the output as shown by the rise in
TVC curve. TC curve is obtained by simply vertical addition of TFC curve and
TVC curve.

26 | P a g e
UNIT -3 PRODUCTION ANALYSIS BALAJI INSTITUTE OF IT AND MANAGEMENT
B) SHORT-RUN AVERAGE COST
Average costs are generally more important as compared to total costs
in case of short-run analysis.
The output units which are produced by a firm do not cost the same
amount to the producing firm but the selling price must be same.
Therefore the average cost or per unit cost must known by the firm.
1. AVERAGE FIXED COST OR AFC: AFC can be calculated as Total fixed cost
at each level divided by Q i.e., the units produced.
This is given as,
TFC
AFC =
Q
2. SHORT-RUN AVERAGE VARIABLE COST: AVC at short run can be
calculated by simply dividing the total variable cost by the units
produced.
TVC
SAVC =
Q
3. SHORT-RUN AVERAGE TOTAL COST: short-run average total cost of any
output that is produced by the firm. Calculation of SATC is done by
simple dividing the total cost at each output level divided by the
produced units which is given as,
TC TFC TVC
SAC or SATC = = + = AFC + AVC
Q Q Q
C) SHORT-RUN MARGINAL COST
The marginal cost is the fundamental concept that is used for exact output
level determination of a firm. Marginal cost is basically variation in the total
cost that is caused because of production of the additional output unit. This is
given as,
TC
SMC =
Q
27 | P a g e
UNIT -3 PRODUCTION ANALYSIS BALAJI INSTITUTE OF IT AND MANAGEMENT
8.2: COST-OUTPUT RELATIONSHIP IN THE LONG-RUN
Long-run stands for the time period in which the entire productive
factors of a firm’s production become variable.
Combination of many short-run may be described as long-run. These are
no fixed production factors in the long-run. Due to this all costs are
variable and there is no fixed cost at all.
A short-run may be characterized by a particular plant size. There is a
short-run cost curve that exists for every plant size for the producer.
In the short-run producer has to operate on the short run cost curve
chosen by him; instead of the out9put level. For each output level he
finds that shot-run cost curve which will result in the lowest production
cost for that output level.
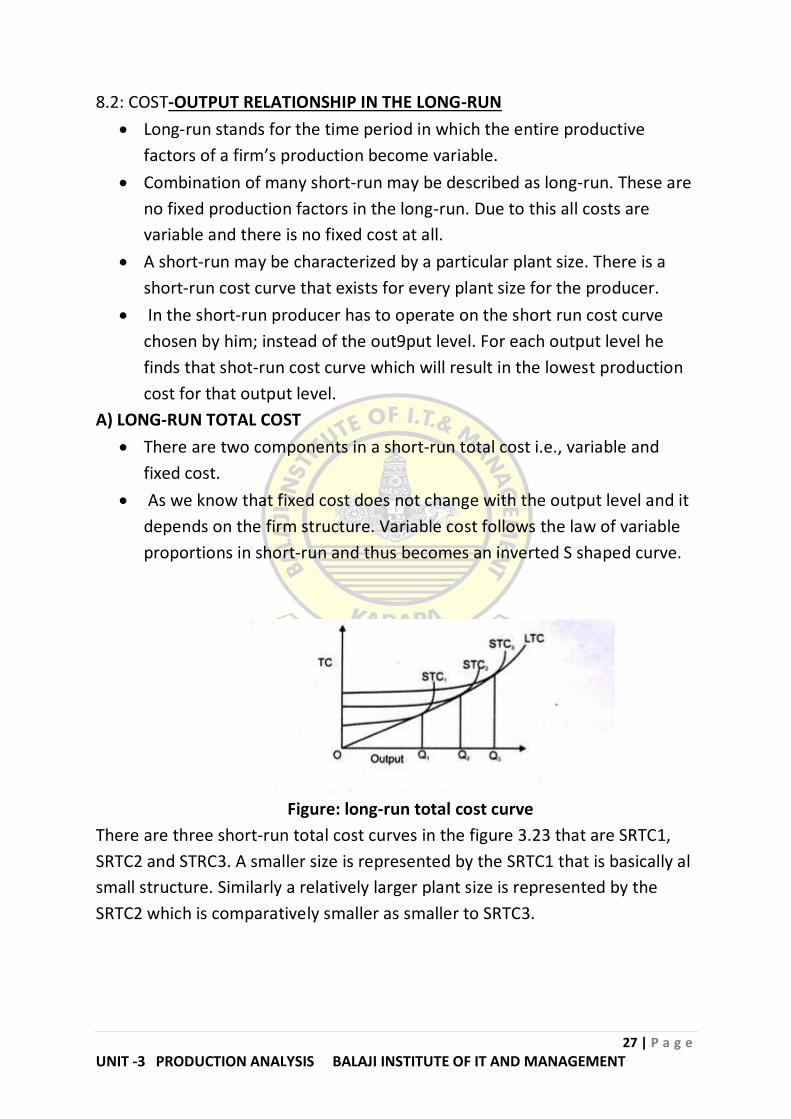
A) LONG-RUN TOTAL COST
There are two components in a short-run total cost i.e., variable and
fixed cost.
As we know that fixed cost does not change with the output level and it
depends on the firm structure. Variable cost follows the law of variable
proportions in short-run and thus becomes an inverted S shaped curve.
Figure: long-run total cost curve
There are three short-run total cost curves in the figure 3.23 that are SRTC1,
SRTC2 and STRC3. A smaller size is represented by the SRTC1 that is basically al
small structure. Similarly a relatively larger plant size is represented by the
SRTC2 which is comparatively smaller as smaller to SRTC3.
28 | P a g e
UNIT -3 PRODUCTION ANALYSIS BALAJI INSTITUTE OF IT AND MANAGEMENT
B) LONG-RUN AVERAGE COST
Long run average cost curves are also known by the following,
1. ENVELOPE CURVE: this curve encloses all short-run average cost curves
and hence it is termed as envelope curve. Main implication of this
envelope curve is that long run average cost cannot exceed short-run
average cost. Since in the long run indivisible factors are fully utilized
and thus the long run average cost curve will surround the short run
average cost. This will not intersect the SAC curves while rising in
upward direction.
2. PLANNING CURVE: another name of the long run average cost curve is
planning curve. With the use of this curve a firm can plan that which
plant should be used to produce different output quantities. This helps
in minimization of the production cost.
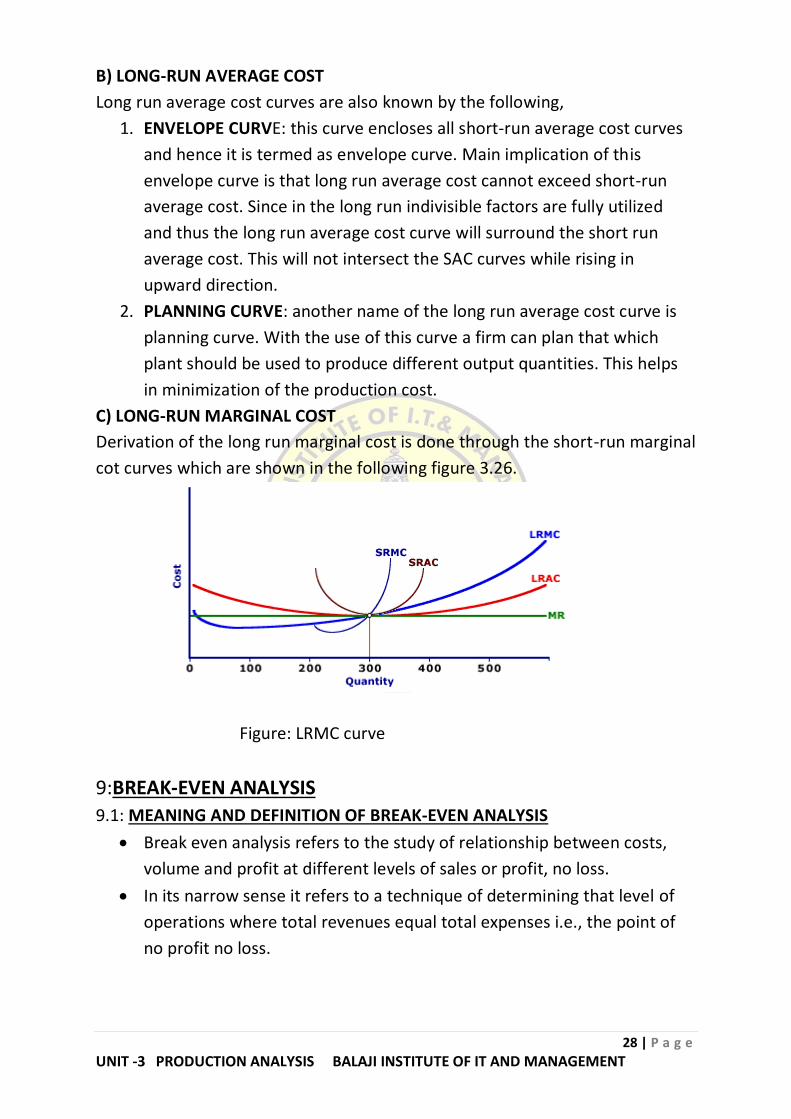
C) LONG-RUN MARGINAL COST
Derivation of the long run marginal cost is done through the short-run marginal
cot curves which are shown in the following figure 3.26.
Figure: LRMC curve
9:BREAK-EVEN ANALYSIS
9.1: MEANING AND DEFINITION OF BREAK-EVEN ANALYSIS
Break even analysis refers to the study of relationship between costs,
volume and profit at different levels of sales or profit, no loss.
In its narrow sense it refers to a technique of determining that level of
operations where total revenues equal total expenses i.e., the point of
no profit no loss.

29 | P a g e
UNIT -3 PRODUCTION ANALYSIS BALAJI INSTITUTE OF IT AND MANAGEMENT
DEFINITION:
According to MATZ, CURRY AND FRANK, a break-even analysis
indicates at what level of costs and revenue are in equilibrium.
9.2: ASSUMPTIONS OF BREAK-EVEN ANALYSIS
The break-even analysis is based upon the following assumptions
1. All elements of cost i.e., production administration and selling
distribution can be segregated into fixed and variable components
2. Variable cost remains constant per unit of output irrespective of the
level of output and thus fluctuates directly in proportion to changes in
the volume of output.
3. Fixed cost remains constant at all volumes of output.
4. Selling price per unit remains unchanged or constant at all levels of
output.
5. Volume of production is the only factor that influences cost.
6. There will be no change in the general price level
7. There is only one product or in case of multi products the sales mix
remains unchanged.
8. There is synchronization between production and sales.
9.3:BREAK-EVEN POINT
It is a point where sales revenue equals the costs to make and sell the
product and no product or loss is reported.
Break-even point is the level of sales of which profit is zero. At break
even pint sales are equal to fixed cost plus variable. This concept is
further explained by the following equation.
Break-even sales = fixed cost + variable cost.
Break-even point is also called CRITICAL POINT, EQUILIBRIUM POINT,
NO-PROFIT NO-LOSS POINT, or BALANCING POINT.
According to KELLER and FERRARA, the break-even point of a company
or a unit of a company is the level of sales income which will equal to the
sum of its fixed costs and variable costs.
9.4: COMPUTATION OF THE BREAK-EVEN POINT
The break-even point can be computed by the following methods
Computation of the break-even point
Algebraic formula method graphic or chart method

30 | P a g e
UNIT -3 PRODUCTION ANALYSIS BALAJI INSTITUTE OF IT AND MANAGEMENT
A)ALGEBRAIC FORMULA METHOD FOR COMPUTING THE BREAK-EVEN POINT
The break-even point can be computed in terms of,
1. BREAK-EVEN POINT IN UNITS: as the break-even point is the point of no
profits no loss, it is that level of output at which the total contribution
equal the total fixed costs. It can be calculated with the help of following
formula
Fixed cost
Break even point =
Selling price per unit
Fixed cost
=
Contribution per unit
2. BREAK-EVEN POINT IN TERMS OF BUDGET TOTAL OR MONEY VALUE AT
BREAK-EVEN POINT
Total sales = total fixed cost + total variable cost.
Or S = F + V
(Where S = sales, F = fixed costs and V = variable cost)
Or S – V = F
S –V F
Or = (Dividing both sides by S - V)
S – V S – V
F
Or 1 =
S –V
F × S
Or S 1 = (Multiplying both sides by S)
S – V
31 | P a g e
UNIT -3 PRODUCTION ANALYSIS BALAJI INSTITUTE OF IT AND MANAGEMENT
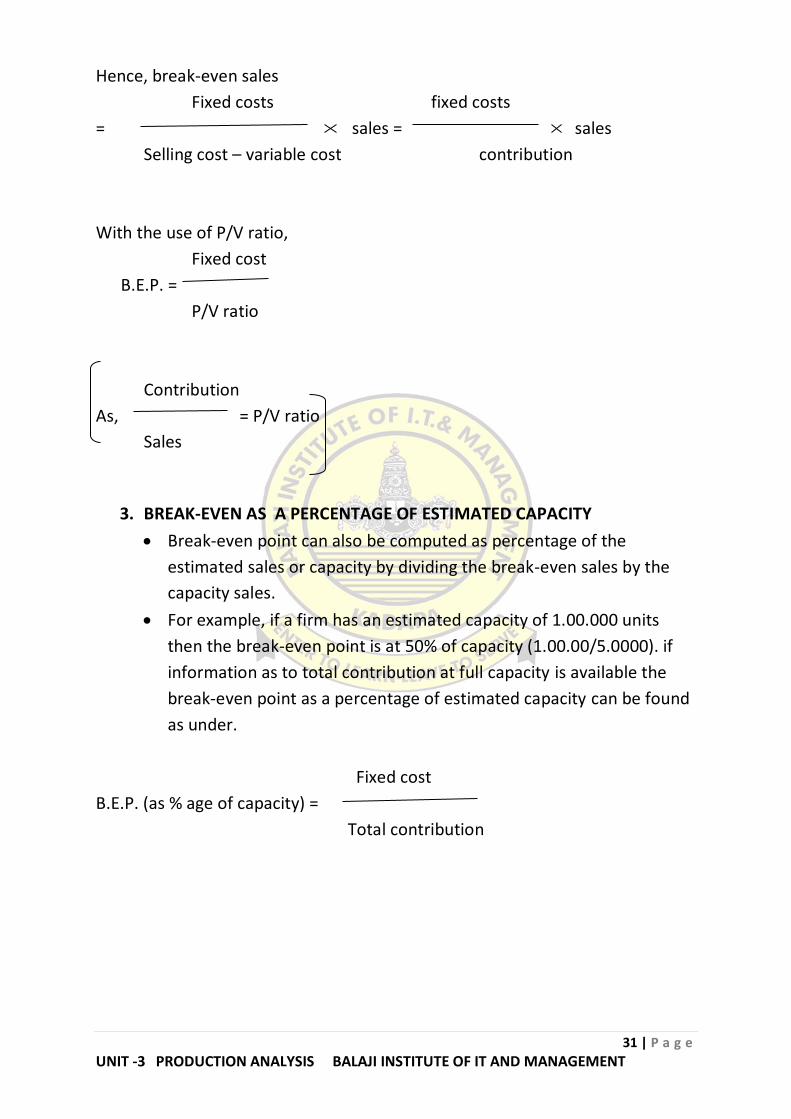
Hence, break-even sales
Fixed costs fixed costs
= sales = sales
Selling cost – variable cost contribution
With the use of P/V ratio,
Fixed cost
B.E.P. =
P/V ratio
Contribution
As, = P/V ratio
Sales
3. BREAK-EVEN AS A PERCENTAGE OF ESTIMATED CAPACITY
Break-even point can also be computed as percentage of the
estimated sales or capacity by dividing the break-even sales by the
capacity sales.
For example, if a firm has an estimated capacity of 1.00.000 units
then the break-even point is at 50% of capacity (1.00.00/5.0000). if
information as to total contribution at full capacity is available the
break-even point as a percentage of estimated capacity can be found
as under.
Fixed cost
B.E.P. (as % age of capacity) =
Total contribution

32 | P a g e
UNIT -3 PRODUCTION ANALYSIS BALAJI INSTITUTE OF IT AND MANAGEMENT
B) GRAPHICAL METHOD OF BREAK-EVEN ANALYSIS OR BREAK-EVEN
CHART/GRAPH
The break-even point can also be computed graphically. A break-even
chart is a graphical representation of marginal costing.
The break-even charts portray a pictorial view of the relationships
between costs volume and profits. It shows the break-even point and
also indicates the estimated profit or loss at various levels of output.
The break-even point as indicated in the chart is the point at which the
total cost line and the total sales line intersect.
9.5: CONSTRUCTION OF BREAK-EVEN CHARTS
Constructions of break-even chart involves the drawing of fixed cost line total
cost line, and sales line as follows,
1. Costs a scale for production on the horizontal axis and a scale for costs
and sales on the vertical axis.
2. Plot the fixed cost on the vertical axis and draw fixed cost line passing
through this point parallel to horizontal axis.
3. Plot the variable cost for some activity levels starting from the fixed cost
line and join these points.
4. Plot the maximum or any other sales volume and draw the sales line by
joining zero and the point so obtained.
There are three methods of drawing a break-even chart/graph. These
methods of drawing break-even chart have been explained with the help
of the example 4.
SECOND METHOD
The break-even chart can also be drawn by another method which is a
variation of the first method. Under this method the variable cost line is drawn
first and then total cot line is drawn. The fixed cost line so drawn represents
the total cost (variable + fixed) at various levels of output.
THIRD METHOD – CONTRIBUTION BREAK-EVEN CHART
This is a modified form of a simple break-even chart as shown in the first-two
methods above. Under this method total cost line is not drawn rather another
line felled contribution line is drawn from the origin and this line goes up with
the increase in the level of output. The fixed cots line is drawn parallel to the X-
axis as in the first method.
33 | P a g e
UNIT -3 PRODUCTION ANALYSIS BALAJI INSTITUTE OF IT AND MANAGEMENT
9.6: SIGNIFICANCE OF BREAK-EVEN ANALYSIS
The significance of break-even analysis is as follows
1. To forecast profit accurately it is absolutely essential to determine the
relationship between costs and profits on one hand and on volume and
product on the other hand. It aims at measuring variations in cost with
volume. Profit planning considers the projected level of output optimum
product combination estimated revenue total cost of production and is
thus based on break-even analysis.
2. Break-even analysis is used in setting up flexible budgets which show
costs at various levels of activities.
3. Break-even analysis helps management in the evaluation of performance
for control purposes.
4. It helps in making short-run tactical decisions e.g., shift working
acceptance of special order choice of sales – mix etc.
9.7: LIMITATIONS OF BREAK-EVEN ANALYSIS
1. Break-even analysis can sometimes gives misleading results of
production capacity changes.
2. All costs cannot be easily and accurately segregated into fixed and
variable components
3. Total fixed costs do not remain fixed beyond certain ranges of activity
levels.
4. Sometimes changes in opening and closing stocks may be significant.
5. If selling pr9ices and factor prices (e.g., material prices, wage rates)
changes, then break-even relationship is affected.
Prepared By
V.SREERAM YASHASVEE L.L.B., M.B.A., (C.A)
ASSISTANT PROFESSOR
BALAJI INSTITUTE OF IT AND MANAGEMENT,KADAPA.
UNIT-4: MARKET STRUCTURE AND PRICING BALAJI INST OF IT& MANAGEMENT STRATEGIES Page 1
(17E00103) MANAGERIAL ECONOMICS Objective of this course is to understand the relevance of economics in business
management. This will enable the students to study functional areas of management such
as Marketing, Production and Costing from a broader perspective.
1. Introduction to Managerial Economics: Definition, Nature and Scope, Relationship
with other areas in Economics, Production Management, Marketing, Finance and
Personnel, Operations research - The role of managerial economist. Objectives of the
firm: Managerial theories of firm, Behavioural theories of firm, optimization
techniques, New management tools of optimization.
2. Theory of Demand: Demand Analysis – Law of Demand - Elasticity of demand, types
and significance of Elasticity of Demand. Demand estimation – Marketing research
approaches to demand estimation. Need for forecasting, forecasting techniques.
3. Production Analysis: Production function, Isoquants and Isocosts, Production
function with one/two variables, Cobb-Douglas Production Function, Returns to
Scale and Returns to Factors, Economies of scale- Cost concepts - cost-output
relationship in the short run and long run, Average cost curves - Break Even Analysis.
4. Market Structure and Pricing practices: Features and Types of different competitive
situations - Price-Output determination in Perfect competition, Monopoly,
Monopolistic competition and Oligopoly. Pricing philosophy – Pricing methods in
practice: Price discrimination, product line pricing. Pricing strategies: skimming
pricing, penetration pricing, Loss Leader pricing. Pricing of multiple products.
5. Inflation and Business Cycles:-Definition and meaning-characteristics of Inflation-
types of inflation - effects of inflation - Anti-Inflationary methods - Definition and
characteristics of business cycles-phases of business cycle - steps to avoid business
cycle
Textbooks:
Managerial Economics Analysis, Problems ,Cases ,Mehta,P.L., Sultan Chand &Sons.
Managerial Economics, Gupta, TMH
References
Managerial Economics, D.N.Dwivedi,Eighth Edition,Vikas Publications
Managerial Economics, Pearson Education, James L.Pappas and Engene
F.Brigham
Managerial Economics, Suma Damodaran, Oxford.
Macro Economics by MN Jhingan-Oxford
Managerial Economics- Dr.DM.Mithani-Himalaya Publishers
Managerial Economics-Dr.H.L Ahuja-S.Chand and Com pvt ltd, NewDelhi
Managerial Economics by Dominick Salvatore, Ravikesh Srivastava- Oxford
University press.
Managerial Economics by Hirschey- Cengage Learning
UNIT-4: MARKET STRUCTURE AND PRICING BALAJI INST OF IT& MANAGEMENT STRATEGIES Page 2
UNIT-4
MARKET STRUCTURE AND PRICING
1. FEATURES AND TYPES OF DIFFERENT MARKETING CONDITIONS:
1.1: MARKET STRUCTRUE:
MEANING AND DEFINITION OF MARKET
A specific place for purchasing and selling of goods is termed as
market. This term has broader outlook in economics where market refers to
whole area where the buyers and sellers of the product are spread and not
limited to a specific place.
According to PROF. R. CHAPMAN the term market refers to not necessarily to
a place but always to a commodity and the buyers and sellers who are in direct
competition with one another.
For goods and services the nature and degree of competition in the market is
referred by market structure.
1.2: FEATURES OF MARKET
The essential features of a market are as follows,
1. AREA:
In economics a market does not mean a particular place but the
whole region where sellers and buyers of a product are spread.
Modern modes of communication and transport have made the
market area for a product very wide.
2. ONE COMMODITY:
In economics a market is not related to a place but to a particular
product. Hence there are separate markets for various commodities.
For example there are separate markets to clothes grains jeweler etc.
3. BUYERS AND SELLERS:
The presents of buyers and sellers are necessary for the sale and
purchase of a product in the market.
In the modern age the presence of buyers and sellers is not necessary
in the market because they can do transactions of goods through
letters telephones business representative internet etc.
4. FREE COMPETITION:
There should be free competition among buyers and sellers in the
market.
UNIT-4: MARKET STRUCTURE AND PRICING BALAJI INST OF IT& MANAGEMENT STRATEGIES Page 3
This competition is in relation to the price determination of a product
among buyers and sellers.
5. ONE PRICE:
The price of a product is the same in the market because of free
competition among buyers and sellers.
1.3: MARKET STRUCTURS
In economics markets are classified according to the structure of the
industry serving the market. Those variables which have received the most
attention are number of buyers and sellers extent of product substitutability
costs ease of entry and exit and the extent mutual interdependence.
MARKET STRUCTURE: refers to the nature and degree of competition in the
market for goods and services. The structures of market both for goods market
and service market are determined by the nature of competition prevailing in a
particular market.
1.4: DETERMINANTS OF MARKET STRUCTURE
For a particular product the number so determinants of market
structure are,
1. Number and nature of sellers
2. Number and nature of buyers
3. Nature of product
4. Entry and exit conditions
5. Economies of scale
1.5: TYPES OF DIFFERENT COMPETITIVE SITUATIONS/MARKET
STRUCTURE
The types of market depend on the degree of competition prevailing
in the market. Broadly speaking there are four types of competition prevailing
in the markets. These are,
1. PERFECT MARKET: many sellers selling same type of products to many
buyers is the characteristics of perfectly competitive market. These
types of market are considered to be unrealistic but it is of special
importance for hypothetical and theoretical reasons.
2. IMPERFECT MARKET: the situation pertaining to perfect market is
different form imperfect market. The market having large number of
producers offering closed substitute goods which are not identical as
regards to perfect competition. Various forms of imperfect competition
are,

UNIT-4: MARKET STRUCTURE AND PRICING BALAJI INST OF IT& MANAGEMENT STRATEGIES Page 4
(i) MONOPOLY: the origin of the work monopoly is from the Greek work
‘monos’, single and ‘polein’ to sell. The product is greatly
discriminated due to the absence of competitive seller producing
closed substitute products.
(ii) MONOPOLISTIC COMPEATITION: with respect to large number
sellers contributing discriminated product to large number buyers
makes this competition different.
(iii) OLIGOPOLY: selling of competing products by some sellers to many
buyers is called oligopoly which is originated from the Greek work
oligos few and plain to sell. The interdependent strategy between the
firms as they are fewer in number in the market clearly states that
oligopolistic firms profit totally depends on the actions of their
competitors.
(iv) DUOPOLY: Duopoly type of oligopoly originates from the Greek work
duo two and polein to sell. There are only two firms in the market
producing a homogeneous goods characteristics imperfect
competition. Such that in a market A, there are only two dominant
suppliers which means market where prices are being jointly
controlled by them.
2. PRICE-OUTPUT DETERMINATION IN PERFECT COMPETITION:
2.1: PERFECT COMPETITION
MEANING AND DEFINITION OF PERFECT COMPETITION
A market which consists of a large number of buyers and sellers who
are involved in buying and selling homogeneous products with
perfect knowledge of the market is called perfect competitive
market.
Fruit and vegetable market is an example of perfect competitive
market.
DEFINITION:
According to A. KOUTSOYIANNIS, perfect competition is a market
structure characterized by a complete absence of rivalry among the
individual firms.
UNIT-4: MARKET STRUCTURE AND PRICING BALAJI INST OF IT& MANAGEMENT STRATEGIES Page 5
2.2: FEATURES OF PERFECT COMPETITION
Following are the features of perfect competition
1. LARGE NUMBER OF BUYERS AND SELLERS:
The first condition of the perfect competition is the existence of large
number of buyers and sellers or otherwise the market rice cannot be
affected by a single producer or purchaser who varies his supply of
demand.
Any single firm contributes only a small portion of it output with
respect to total output whereas out o the total demand a single
purchasers demand is only a small portion of it.
2. HOMOGENEOUS PRODUCT:
The items produced by the firms satisfying the second condition of
perfect competition that it must be uniform and alike so that none of
the buyers may have any choice for the product such as salt wheat
cotton coal etc., are the examples homogeneous products.
3. FREE ENTRY AND EXIT:
Under perfect competition the firms in the industry earn common
profit which can happen only if there is not restriction on the firms
regarding its exit from the industry or entry in to the industry.
4. PERFECT KNOWLEDGE:
There should be perfect knowledge or the market to the buyers and
sellers and they must have complete awareness of the prizes that are
being offered and accepted.
On the basis of this knowledge there will be an assurance of uniform
prices all over the market.
5. ABSENCE OF TRANSPORT COSTS:
It is assumed that there are free transport facilities.
If the prices are same then it is necessary that no cost of
transportation has to be incurred.
6. PERFECT MOBILITY OF THE FACTORS OF PRODUCTION:
For the firms mobility of the factors of production is important to
adjust their supply to demand.
The movement of factors of production is very important for the
firms and the industry in achieving equilibrium position.

UNIT-4: MARKET STRUCTURE AND PRICING BALAJI INST OF IT& MANAGEMENT STRATEGIES Page 6
7. ABSENCE OF ARTIFICIAL RESTRICTIONS:
There is freedom to the sellers to sell their goods to any buyer and
buyer and buyers are free to purchase from any seller.
The buyers and sellers must be free from any discrimination.
8. ABSENCE OF SELLING COSTS:
Due to the production of homogeneous product buy the firms the
firms the cost of advertising sales promotion etc, negligible under
perfect competition
2.3: ADVANTAGES OF PERFECT COMPETITION
Following are the advantages of the perfect competition.
1. Consumer sovereignty
2. Beneficial to consumer
3. Cost-saving
4. Economic efficiency
2.4: DISADVANTAGES OF PERFECT COMPETITION
Following are the disadvantages of the perfect competition.
1. No scope for economies of scale
2. Homogenous products
3. Insufficient profits
4. Free flow of technology
5. Externalities.
2.5: PRICE-OUTPUT DETERMINATION IN PERFECT COMPETITION
1. The marginal revenue should be equal to the marginal cost i.e. MR = MC.
If MR is greater than MC there is always an incentive for the firm to
expand its production further and gain by sale of an additional unit adds
more to cost than to reduce output since an additional unit adds amore
to cost than to revenue. Profits are maximum only at the point where
MR =MC.

UNIT-4: MARKET STRUCTURE AND PRICING BALAJI INST OF IT& MANAGEMENT STRATEGIES Page 7
2. The MC curve should cut MR curve from below. In other words MC
should have positive slope.
2.6: PRICE DETERMINATION AND EQUILIBRIUM OF THE FIRM IN SHORT
RUN
A firm is price taker rather than a price maker in the market. The
difference between the role of a competitive industry and affirm in
determination the price and output level can be seen through the diagram
given below.
1. ABNORMAL PRIFIT/SUPERNORMAL PROFIT: a firm may get abnormal
profit at the equilibrium level of output if its average revenue exceeds
the average cost of production. At OP price firm produces OQ output
firms average revenue (AR) is EQ while its average revenue (AC) is BQ.
2. LOSSES: at equilibrium output a firm may suffer loss. It is because of the
fact that a part of the fixed of the fixed cost may not be recovered in
short run. In the figure 4.3 E is the equilibrium point AR = EQ and AC =
BQ since BQ > EQ, firms is earning BE per unit loss and total loss is ABEP.
3. NORMAL PROFITS OR BREAK EVEN: when the firm just meets its
average total cost it earns normal profits. Here AR = ATC

UNIT-4: MARKET STRUCTURE AND PRICING BALAJI INST OF IT& MANAGEMENT STRATEGIES Page 8
The figure 4.4 shows that MR =MC at E. the equilibrium output is OQ. Since
here AR =ATC or OP = EQ the firm is just earning normal profits.
CONCLUSIONS
A. If AR = AC the firm will get normal profit
B. If AR > AC, the firm will get normal profit
C. If AR < AC, the firm will suffer loss.
D. If AR < AVC the firm will stop production.
2.7: PRICE DETERMINATION AND EQUILIBRIUM OF THE FIRM IN LONG RUN
The entry or exit of the firms is not restricted in a perfectly
competitive market
Those firms which are inefficient then they incur losses and then
either close down the firms or enhance their efficiency.
Profit earning firms attract new firms for establishment.
The firms work on no loss no profit situating where firms AR = AC
which is graphically plotted in the figure 4.5
In figure 4.5 OQ is equilibrium quantity and at this level of output
average revenue and average cost both equal to QS. Duet o this reason firm is
making only normal profits. The average cost and marginal cost will be
identical and hence the long run equilibrium conditions for a firm will be
MR = LMC = LAC = AR = price
2.8: PRICE DETERMINATION AND EQUILIBRIUM OF THE INDUSRY IN LONG
RUN
The following are the conditions which establish equilibrium in a perfectly
competitive industry

UNIT-4: MARKET STRUCTURE AND PRICING BALAJI INST OF IT& MANAGEMENT STRATEGIES Page 9
1. For long run equilibrium of an industry it is required that all the firms in
the industry are producing an equilibrium level of output where long-run
marginal cost equal to the long run marginal revenue (LMC = LMR).
2. The long equilibrium price is derived to attain equality between total
quantitative demanded and supplied in the long run in liquidating the
market. The long run equilibrium of the industry is depicted by the figure
4.7
There is full equilibrium position price = LAR = LMR = LAC = LMC as such
the firm enjoys normal profits.
Long run equilibrium price = LAR = LAC = LMR = LMC
Figure: industry and films equilibrium in the long run
The firms under homogeneity conditions are identical having identical cost
functions so they must be operations at the minimum point of LAC.
LAC price fail to earn normal profits and unable to sustain losses. To sum up
industry and firms equilibrium conditions in the long run are long run
equilibrium price = LAR = LAC = LMR = LMC.
3. MONOPOLY
3.1: MEANING AND DEFINITION OF MONOPOLY
A market situation where there is only one seller and barriers for others
to entry product having no close substitute cross elasticity of demand
being low with every other product and no other firm produces an
identical product is called monopoly.
Hence the price is fully under control of the monopolist but no control
over the demand that is determined by the purchased.

UNIT-4: MARKET STRUCTURE AND PRICING BALAJI INST OF IT& MANAGEMENT STRATEGIES Page 10
DEFINITION:
According to FERGUSON AND KREPS,” a pure monopoly exists when
one and only one firm produces or sells the commodity in questions. In other
words a monopoly is a one firm industry”.
3.2: FEATURES OF MONOPOLY
The features of monopoly market are as follows,
1. SINGLE SELLER:
A single producer of a particular commodity or service in a monopoly
market gathering large number of buyers ,who can be an individual,
a group of partners a joint stock company or a state ,it is the alone
source of supply for goods and services having no close substitute.
The market is referred is the industry.
2. RESTRICTED ENTRY:
There is a restriction on the free entry of new organization as new
sellers are prohibited to enter the monopoly market.
Following are the primary barriers restricting the entry of new
sellers.
a. Government license or franchise
b. Resource ownership
c. Patents and copyrights
d. High start up cost and
e. Decreasing average total cost.
3. HOMOGENEOUS PRODUCT:
The product which is produced by the monopoly firm has no close
substitute and is a homogeneous product.
The buyer is forced to purchase the product which is available at the
labeled price.
4. FULL CONTROL OVER PRICE:
The features of a monopoly market where entry is restricted of the
new sellers or buyers making the competition restricted ,market
conditions are fully influenced by the monopolist thus a company
under monopoly is free from price pressure and is independent to
charge according to his advantages and with the intention of
maximizing of profit via predetermined choice of quantity.
UNIT-4: MARKET STRUCTURE AND PRICING BALAJI INST OF IT& MANAGEMENT STRATEGIES Page 11
5. PRICE DISCRIMINATION:
The practices of charging different prices from different buyers for
the same goods or service are price discriminating.
The monopolist has advantages of being in the market by
discriminating the prices as per his convenience.
3.3: ADVANTAGES OF MONOPOLY
Following are the explanation of the advantages of monopoly
1. Research and development
2. Economies of scale
3. Competition for corporate control
4. Stability of prices
5. Source of revenue for the government
6. Massive profits
3.4: DISADVANTAGES OF MONOPOLY
Following are the disadvantages of monopoly
1. Exploitation of consumers
2. Dissatisfied consumers
3. Higher prices
4. Price discrimination
5. Inferior goods and services
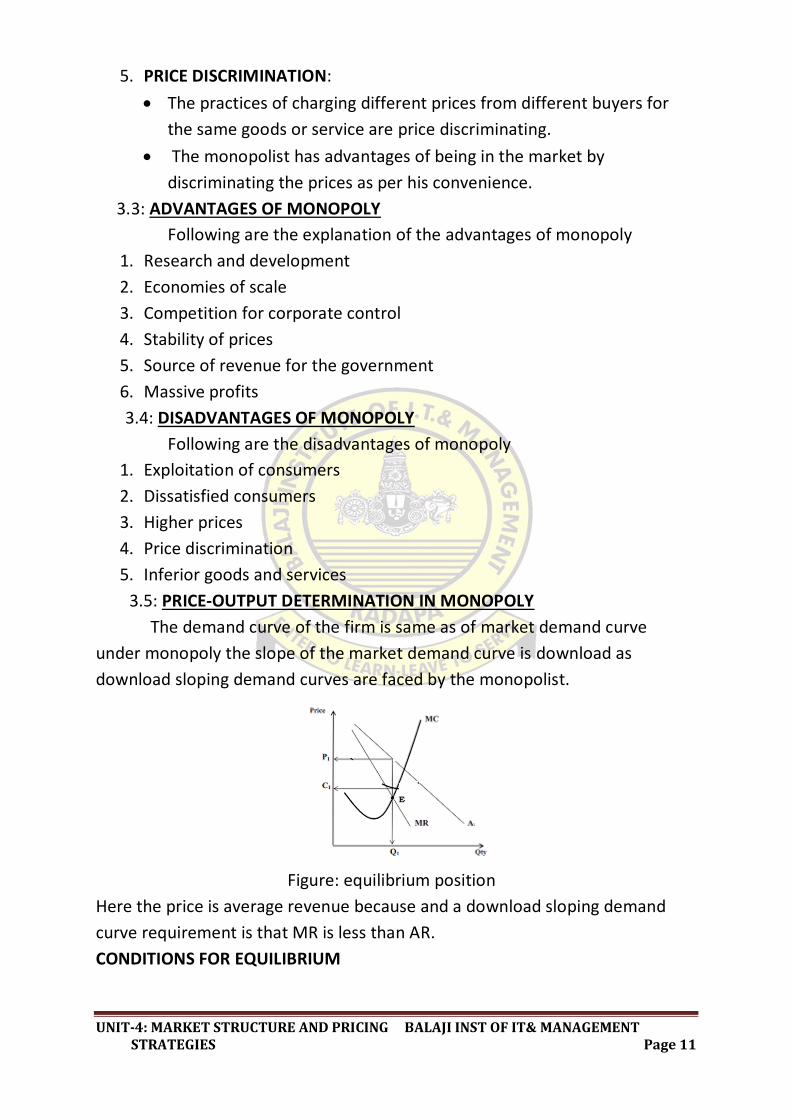
3.5: PRICE-OUTPUT DETERMINATION IN MONOPOLY
The demand curve of the firm is same as of market demand curve
under monopoly the slope of the market demand curve is download as
download sloping demand curves are faced by the monopolist.
Figure: equilibrium position
Here the price is average revenue because and a download sloping demand
curve requirement is that MR is less than AR.
CONDITIONS FOR EQUILIBRIUM
UNIT-4: MARKET STRUCTURE AND PRICING BALAJI INST OF IT& MANAGEMENT STRATEGIES Page 12
Following are the two conditions for equilibrium in a monopoly market which
are the basis of price output determination
1. MR=MC
2. MC curve must cut MR curve from below
ASSUMPTIONS OF MONOPOLY
The following assumptions are the basis of the analysis for determination the
price output and profit under monopoly.
a. For a homogeneous product there is one seller or producer
b. There are no close substitutes for the product
c. The power of monopolist is unrestricted and the price under monopoly
is uncontrolled.
d. There is no threat of entry of other firms.
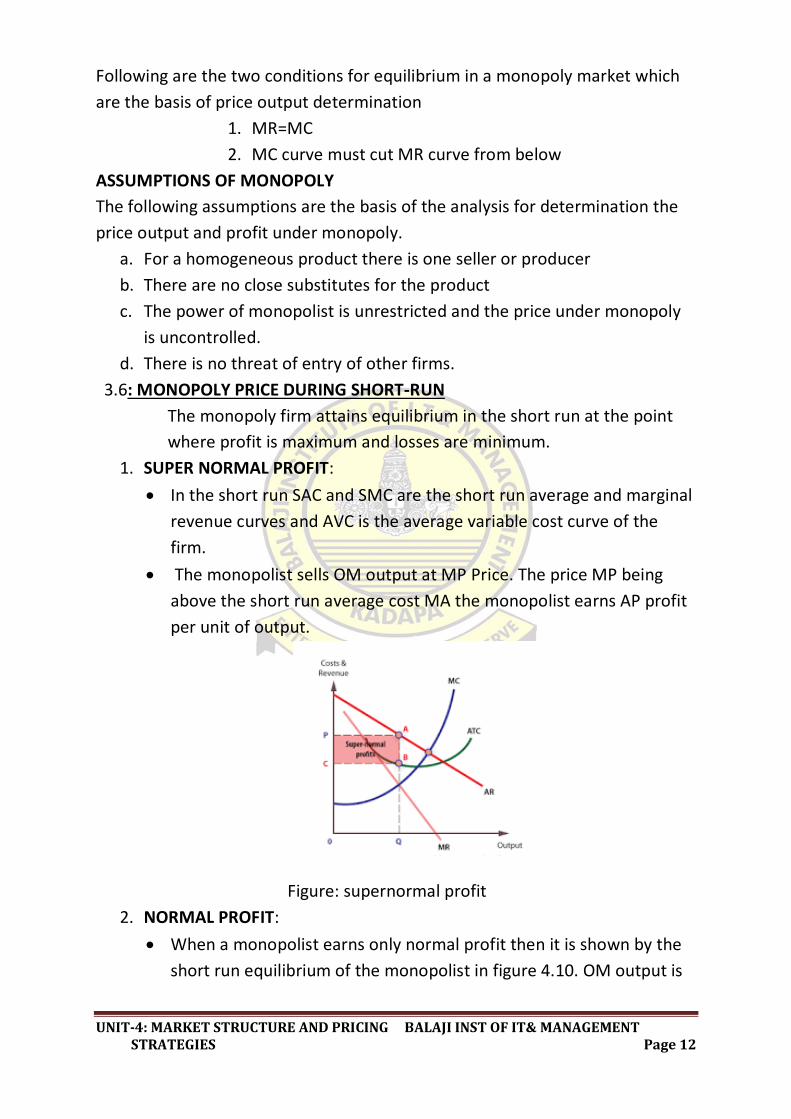
3.6: MONOPOLY PRICE DURING SHORT-RUN
The monopoly firm attains equilibrium in the short run at the point
where profit is maximum and losses are minimum.
1. SUPER NORMAL PROFIT:
In the short run SAC and SMC are the short run average and marginal
revenue curves and AVC is the average variable cost curve of the
firm.
The monopolist sells OM output at MP Price. The price MP being
above the short run average cost MA the monopolist earns AP profit
per unit of output.
Figure: supernormal profit
2. NORMAL PROFIT:
When a monopolist earns only normal profit then it is shown by the
short run equilibrium of the monopolist in figure 4.10. OM output is

UNIT-4: MARKET STRUCTURE AND PRICING BALAJI INST OF IT& MANAGEMENT STRATEGIES Page 13
determined by the equality of SMC curve and MR curve at point E
which is sold at MP Price.
The monopolist has the knowledge that any level of output other
than OM would carry loses because the SAC curve will be higher than
the AR curve.
3. MINIMUM LOSS:
The monopolist incurs losses in a short run situation as shown in
figure 4.11. The equilibrium point E which is determination by the
equation SMC = MR.
But the monopoly price MP established by demand conditions does
not cover the short run average costs of production PA.
Total loses are equal to BP PA = BRPAC. In this figure 4.11 is the
close down point for this firm. The firm will close down.
3.7: MONOPOLY PRICE DURING LONG-RUN
When at that level of output marginal cost equals marginal’s revenue
the long run equilibrium of the firm under monopoly is achieved. Due to non
entry of the new firms in the market the profit of the monopoly firm is
abnormal in the long run.

UNIT-4: MARKET STRUCTURE AND PRICING BALAJI INST OF IT& MANAGEMENT STRATEGIES Page 14
The profit PR per unit is achieved because at the output level OQ average
revenue of the firm exceeds its averages cost the shared area KLRP is equal to
the total profit.
4. MONOPOLISTIC COMPETITION:
4.1: MEANING AND DEFINITION OF MONOPOLISTIC COMPETITION
Monopolistic competition means a situation in market where
differentiated products are sold in market by many firms.
There is a keen competition which is not perfect though among many
firms producing very alike products.
Thus monopolistic competition means the competition among huge
number of sellers that produce close substitutes for each other which
are not perfect substitutes.
DEFINITION:
According to BAUMOUL, the term monopolistic competition refers to
the market structure in which the sellers do have a monopoly (they are the
only sellers) of their own product but they are also subject to substantial
competition pressures from sellers of substitute product.
4.2: FEATURES OF MONOPOLISTIC COMPETITION
Some of the features of monopolistic competition are as follows,\
1. LARGE NUMBER OF SELLERS:
There are huge sellers in a monopolistically competitive market who
have a small market share individually.
These firms produce and sell close substitute products. This makes
the touch and real competition among firms.
2. PRODUCT DIFFERENTIATION:
The different seller’s products are differentiated in a monopolistic
completive market on the basis of brands.
A monopoly element is aroused because of product differentiating to
the product over the product that is it competition.
3. FREEDOM OF ENTRY OR EXIT:
Market allows free entry of new firms and also exits of existing firms.
4. INDEPENDENT BEHAVIOR:
Every firm posses an independent policy in monopolistic competition.

UNIT-4: MARKET STRUCTURE AND PRICING BALAJI INST OF IT& MANAGEMENT STRATEGIES Page 15
Since there are large number of seller’s major portion of total output
is not controlled by anyone.
5. PRODUCT GROUPS:
Under monopolistic competition there is not any industry but groups
of firms that exist which produce the similar product.
Each firm is an industry in itself and produces a different product.
For example, cigarettes, cars, etc.
6. SELLING COSTS:
Sales area essentially pushed up by the selling costs because product
differentiation exists in monopolistic competition.
It includes salesman expenses advertisement costs sellers allowances
for displaying windows free sampling premium gifts and coupons free
service etc.
7. NON-PRICE COMPETITION:
A firm increase profits and sales of its product in monopolistic
competition without any price cut.
Products can be changed by a monopolistic competitor either by
quality etc.
8. CONTROL OVER PRICE:
Prices are controlled by the firms to some extent. For example
professionals such as solicitors restaurants etc., are price maker.
A price which is set by the firm’s conscious decision is termed as
administered price. Also firms must decide the price changing
frequency.
4.3: ADVANTAGES
Following are some advantages of monopolistic competition
1. Promotion of competition (link of barriers to entry)
2. Differentiation brings greater consumer choice and variety
3. Product and service quality development
4. Consumers become more knowledgeable of products
4.4: DISADVANTAGES
Following are the disadvantages of monopolistic competition
1. Liable of excess capacity
2. Allocatively inefficient

UNIT-4: MARKET STRUCTURE AND PRICING BALAJI INST OF IT& MANAGEMENT STRATEGIES Page 16
3. Higher prices
4. Advertising
4.5: PRICE OUTPUT DETERMINATION IN MONOPOLISTIC COMPETITION
As there is product differentiation between firms in a monopolistic
competitive market a perfect elastic demand is not faced by the firm for its
products.
CONDITIONS FOR THE EQUILIBRIUM OF AN INDIVIDUAL FIRM
The price-output equilibrium and determination conditions of an individual
firm may be described as follows,
1. Marginal cost = marginal revenue and
2. There must be intersection of MR curve by MC curve from below.
A) SHORT RUN EQULIBRIUM OF THE INDUSTRY
The analysis in short runoff the firm under monopolistic competition is
based on some assumptions. These assumptions are as follows,
1. There are larger numbers of sellers who act independently of each
other.
2. Each seller products shows differentiation from other product
3. A determination elastic demand curve is attained by firms
4. Each firms short run cost curves differed from each other and
5. There is a restriction to entre new firms in the industry.
EXPLANATION
Under these assumptions a price and output is fixed by each firm so as to
maximize the profits. There will be loss in case while it is able to cover up the
average variable cost.
1. SUPER NORMAL PROFIT: in figure 4.13 at point E, the SMC Curve cuts
the MR curve. This point E shows the output OQ and price QA (= OP).
Resulting from this the firm
Earns supernormal profit which is represented by the area PABC.
2. NORMAL PROFIT: Figure 4.14 shows the same equilibrium of output and
price. But the firm only covers the short run average unit cost in this
case as shown by the demand curve Ds tangency and the short run
average unit cost cure that is SAC located at A. it earns normal profit.
3. MINIMUM LOSS: figure 4.15 representation a condition where the firm
is incapable of covering its short run average unit cost and thus incurs
losses. When the price is lowered below QA by the firm then firm will
stop further production. However there will be a loss to firm at this price

UNIT-4: MARKET STRUCTURE AND PRICING BALAJI INST OF IT& MANAGEMENT STRATEGIES Page 17
which is equal to area CBAP during the short run in the hope of cost
lowering in the long run.
Figure: supernormal profit figure: minimum profit
Figure: normal profit
B) LONG RUN EQUILIBRIUM OF THE INDUSTY
There is exist and entry of the firms in long run in a competitive industry that is
monopolistic. The process of adjustment will lead to existence of normal
profits only. This is because of similar products in the market.

UNIT-4: MARKET STRUCTURE AND PRICING BALAJI INST OF IT& MANAGEMENT STRATEGIES Page 18
Figure: long run equilibrium in industry
In a monopolistic competitive industry if the firms in short run earn super
normal profits there will be an incentive to enter for new firms in the industry.
In the figure 4.16 in long run all firms are at equilibrium at point E where LMC =
MR and MR is cut by LMC form below and the curve LAC is tangent at point A
to the D/AR curve.
5. OLIGOPOLY
5.1. MEANING AND DEFINITION OF OLIGOPOLY
Oligopoly is defined as a condition where there is huge competition
among a few large firms and there is an element of interdependence in
firm’s decision making.
A major change in policy by one firm will show immediate and obvious
impacts on its competitors.
DEFINITION:
According to MANSFIELD oligopoly is a market structure characterized by a
small number of firms and a great deal of interdependence.
For example, automobile industry or cold drinks industry. There is limited
number of manufacturers for automobile and cold drink manufacturing
industry in India.
5.2: FEATURES OF OLIGOPOLY
Features of oligopoly market are as follows,
1. INTERDEPENDENCE:
Decision making inter dependence among few firms of oligopoly
market is an important feature of oligopoly.
The reason behind this is that when the competitors are few then
any change in output price product by one firms shows immediate

UNIT-4: MARKET STRUCTURE AND PRICING BALAJI INST OF IT& MANAGEMENT STRATEGIES Page 19
effect on rivals fortune that will be retaliate to change their own
output price or advertising technique according to the situation.
2. IMPORTANCE OF ADVERTISING AND SELLING COSTS:
Oligopolist’s interdependence shows direct impact on the various
firms to employ marketing weapons that are of north natures
aggressive and defensive so as to gain greater market share or to
maintain their existing share.
3. GROUP BEHAVIOUR:
The oligopoly theory is a group behavior theory and it is not a theory
of individual or mass behavior.
On oligopoly part profit maximizing behavior may not be very much
valid.
4. INDETERMINATE DEMAND CURVE:
Due to firms interdependence is oligopoly and also because of a
particular firm’s inability to predict other firms’ behavior
determinateness and definiteness is lot by the demand curve facing
an oligopolistic firm.
5. FEW SELLERS:
There are a small number of sellers in the oligopoly market.
Here small number of sellers represents that a significant fraction of
total industry output is produced by every firm and these can have a
noticeable impact on the market conditions.
5.3: ADVANTAGES
1. Huge profits are made by the large firms that have strong hold over the
market because there are few market players.
2. Mostly products of two varying competitive companies are derived out
of one main large firm in oligopoly.
3. The companies generate high profits and this profit can be used for
development and innovation of new process and products.
4. Customers can stabilize and plan their expenditure efficiently due to
stable market prices that leads to trade cycle stabilization.
5.4: DISADVANTAGES
1. Though price setting can prove to be advantages for the firms’ but if it’s
not done in realistic manner it may tend to be disadvantages to
customers.

UNIT-4: MARKET STRUCTURE AND PRICING BALAJI INST OF IT& MANAGEMENT STRATEGIES Page 20
2. Dominant companies do not think to improvise their products because
of little competition.
3. Due to presence of various entry barriers new firms cannot easily enter
the market.
5.5: PRICE OUTPUT DETERMINATION IN OLIGOPOLY
Under oligopoly there is no definite price output determination
theory. This is because of interdependence of oligopolistic firms’ to make
decisions and uncertainty reaction patterns of rival firms.
The different models are includes,
1. Non-collective oligopoly model of SWEEZY (kinked demand curve)
and
2. Collusive oligopoly model
KINKED DEMAND CURVE:
This model which is termed as kinked demand curve is a model of
oligopoly that was developed by PAUL M. SWEEZY and HALL and HITCH. With
the help of kinked demand curve analysis he tried to show that output and
price once determined tend to stabilize and not fluctuate under oligopolistic
trend and conditions.
ASSUMPTIONS OF KINKED DEMAND CURVE:
The kinked demand curve hypothesis of price rigidity is based on the
following assumptions.
1. There are few firms in the oligopolistic industry
2. There are no advertising expenditure
3. Each seller’s attitude depends on the attitude of his rivals
4. The marginal cost curve passes through the dotted portion of the
marginal revenue curve so that changes in marginal cost do not affect
output are price.
EXPLANATION OF KINKED DEMAND CURVE:
As per observations prices remain much inflexible for longer time in
many oligopolistic industries.
For this rigidity in price many explanations have been given under
oligopoly and out of these explanations most popular is kinked demand
curve hypothesis which was given by American economist SWEEZY.

UNIT-4: MARKET STRUCTURE AND PRICING BALAJI INST OF IT& MANAGEMENT STRATEGIES Page 21
According to the kinked demand curve hypothesis the demand curve
that faces an oligopolistic has a kink at prevailing price level. The kink is
observed at the existing level of price because the demand curve segment
above this level tends to be highly elastic and below this level segment tends
to be inelastic. dD a kinked demand curve with P a kink point is shown in the
figure 4.17.
CRITICISMS OF KINKED DEMAND CURVE:
Criticism of kinked demand curve is explained on the following
grounds
1. DOES NOT EXPLAIN HOW PREVAILING PRICE IS DETERMINED:
Kinked demand curve explains simply why and how a price once set
remains stable in the market.
Kinked demand curve given by HALL AND HITCH attempts to explain
how determination of prevailing prices is done. But again that is not a
valid explanation too.
2. DOES NOT EXPLAIN PRICE OUTPUT DETERMINATION:
Firms behave in a concerted manner under oligopoly that is collusive.
Under this oligopoly there is no kink on the firms’ demand curve.
3. EXPLAINS PRICE RGIDITY IN DIFFERENTIATED OLIGOPOLY ONLY:
Price rigidity is explained by this theory in only differentiated
oligopoly.
It is possible that the marginal curves vertical position of a kinked
demand curve may be not much wide for marginal cost curve to pass
through it.
6. PRICING PHILOSOPHY:
6.1: MEANING AND DEFINITION OF PRICING:
According to PROF. K.C. KITE, pricing is a managerial task that involves
establishing pricing objective identifying the factors governing the price
ascertaining their relevance as significance determining the product value in

UNIT-4: MARKET STRUCTURE AND PRICING BALAJI INST OF IT& MANAGEMENT STRATEGIES Page 22
monetary terms and formulation of price policies and the strategies
implementing them and controlling them for the best results.
6.2: IMPORTANCE OF PRICING
Generally buyers and sellers try to reach an agreement for the price
which is paid for product or service. The pricing is very important to customers
industries and for promotion of business activity s described below.
1. IMPORTANCE OF PRICING TO THE CONSUMERS: The importance for the
consumers is an follows,
(i) AFFECT PURCHASING POWER:
(ii) If the price of the product is high then the consumers are forced
to reduce the purchase quantity because consumers have limited
money to make purchases and if the product is not essential then
they may even avoid purchasing it.
(iii) PRICE INDIVATES PRODUCT QUALITY:
It is a common perception in the minds of consumers that
producers carrying higher price also have higher quality.
In absence of other inputs about the product the higher price is
the only convincing factor.
(iv) CUSTOMERS VALUE PERCEPTION:
Many times the price of the product does not match the expected
value by the customers and sometimes it is even lower than their
expectations.
This it depends upon the right decision of the marketer to take a
right decision for pricing level.
2. IMPORTANCE OF PRICING TO THE FIRMS: The importance of pricing for
the firms is discussed below,
1. DETERMINES PROFITABILITY:
The price of the product is directly related to the profit to the
company which is set to receive.
The firms receive returns in terms of money which is based on the
price of product. Hence any increase or decrease in price level of
the product affects the profitability.
2. DETERMINES MARKET SHARE:
The price of a commodity is a major factor that determines the
demand.

UNIT-4: MARKET STRUCTURE AND PRICING BALAJI INST OF IT& MANAGEMENT STRATEGIES Page 23
Price affects the competitiveness of the firms products and its
market share.
3. DETERMINES SUCCESS:
The pricing policy of a company acts as double edge sword for the
company
In the case when the price is set too high the product sale will be
minimum and generated revenue fails to cover up the production
costs.
4. INTER FIRM RIVALRY:
The pricing policy also generates tough competition between the
rivals.
The money spent on advertisements middlemen and profitable
schemes increases the operation costs of the company.
3. IMPORTANCE OF PRICING TO THE ECONOMY: The importance of pricing
for economy is described below
1. INFLUENCES FACTORS OF PRODUCTION:
The factors responsible for production are capital land machines
and labor. For each factor money is spent by the producer.
With increase or decrease in price of the product the profit in
terms of money also increases or decreases.
2. DETERMINES DEMAND AND SUPPLY:
The higher price leads to increase in supply but fall in the demand
because of low capacity of payment of common customer.
The lower price results in increase in demand and reduction in
supply due to increase in number of customers and limitation of
the company to match the demand.
3. AFFECTS SAVINGS AND INVESTMENTS:
The paying capacity of the consumers remains limited and due to
this reason increase in the price of product leads to reduction in
their savings and investments.
In alarming of price rise or fall, the investments of the government
sometime become necessary.
4. BETTER UTILIZATION OF RESOURCES:
The prices control the demand of the products.

UNIT-4: MARKET STRUCTURE AND PRICING BALAJI INST OF IT& MANAGEMENT STRATEGIES Page 24
The companies get the returns based upon the prices allocated to
products.
The public sector organizations run only by the budget generated
from the revenues which is earned by the government.
5. INFLATION IN THE ECONOMY:
During inflation the pricing policy is very crucial because of the
following facts,
a. During inflation the purchasing power of consumer declines and
to sustain the business it is essential for the entrepreneurs to find
alternate substitutes or methods to reduce the price of the
products.
6.3: DETERMINANTS OF PRICING POLICY:
The factors which influence the price can be divided into two
factors.
1. INTERNAL FACTORS: These factors are disclosed below,
(i) ORGANIZATIONAL FACTORS:
There are two levels in an organization who decide the price level
of the product.
The top level limits itself up to planning of price range and the
market segment which is related to that product.
(ii) MARKETING MIX:
The price of the product is considered as only one factor out of
many other related factors by the marketers.
The increase in product cost results in increase in product
advertisements and distribution costs.
(iii) PRODUCT DIFFERENTIATION:
The price of the product also depends upon the attractive
characteristics of the product such as looks color packaging, after

UNIT-4: MARKET STRUCTURE AND PRICING BALAJI INST OF IT& MANAGEMENT STRATEGIES Page 25
sale service matching with contemporary fashion style trend and
the alternative usage of the product etc.
(iv) COST OF PRODUCT:
For determining the price of a product the cost or cost of
production cannot be ignored by any company.
Further a fine tuning is required to be made for finalizing the
price which depends upon the market demand and price being
offered by the rivals.
(v) OBJECTIVES OF THE FIRMS:
The objective of a company can be changed with time and
situation according to the financial status of a company which
affect the pricing decisions.
2. EXTERNAL FACTORS:
These factors are as follows
(i) DEMAND:
It is a common phenomenon in the marketing that scarce
commodities have increasing price which is the indication of its
high demand.
The demand of any product depends upon is utility number of
customers availability of similar products in the market and their
price the paying capacity of the customers as well as their greeter
liking of the product due to extra features such as looks offering
schemes etc.
(ii) COMPETITION:
The prices of the rival products in the market make crucial impact on
decision making of pricing. To remain in competition the companies
are made to make the price of the product equal to rivals or slightly
lower. The higher prices can be offered only if the company brand is
popular.
(iii) SUPPLIERS:
When the price of raw material which are used for production of
product increases then the suppliers charge more money for the
UNIT-4: MARKET STRUCTURE AND PRICING BALAJI INST OF IT& MANAGEMENT STRATEGIES Page 26
same quantity supplied.The producer is forced to transfer this
increase to customers by increase in the price.
(iv) ECONOMIC CONDITIONS:
The prices are directly related to inflation or deflation conditions
prevailing in the country.
In inflationary situations the prices of the input factors increases and
the prices of the products are also increase.
(v) BUYERS:
The pricing decision of the company on the product does affect the
consumers.
The price increase reduces the paying capacity of consumers and it
develops constraints on customers.
Consumes may change their plan for purchase of product.
This makes a great impact on company turn over in the case when
the product is being used by large number of consumers.
(vi) GOVERNMENT:
There is a control of government on the prices of the commodities
and the producers cannot charge for the product on their own.
The government legislations limit the prices of the commodities to
certain limits and a close watch is maintained by market surveyors on
the products sold by the private entrepreneurs.
7: PRICING METHODS IN PRACTICE: price discrimination,
product line pricing
The various methods of pricing are as follows,
Pricing methods in practice
Price discrimination product line pricing
Loss leader pricing prestige pricing
Value-based pricing peak load pricing
Affordability based pricing market and demand based
Cycle pricing
I) PRICE DISCRIMINATION
In this pricing system company establishes different price points for
different customers on the basis of different variables such as volume
of purchase payment conditions like cash down or installments loyalty

UNIT-4: MARKET STRUCTURE AND PRICING BALAJI INST OF IT& MANAGEMENT STRATEGIES Page 27
factor customers etc. the market consists of variety of customers and
this discriminatory pricing act as a motivator for the company.
OBJECTIVES OF PRICE DISCRIMINATION
There are following objectiveness of price discriminations
1. MAXIMISATION OF REVENUE:
The basic objective of price discriminations is that by setting different
prices for the same product in different markets / segments a
business can increase its total sales revenues.
Price discrimination is clearly in the interests of businesses who
achieve higher profits.
2. PREVENT CONSUMER SWITCHING:
A dominant firm may exploit final consumer by means of price
discrimination with the result in the reduction of consumer welfare.
It is a barrier to prevent consumers switching from one supplier to
another.
3. ATTAIN A SIGNAL MARKET:
It is sometimes a policy objective to attain a signal market across the
region.
There being one seller of the product under monopoly the monopoly
firms is the industry itself.
Therefore the demand curve for its product is downward sloping to
the right given the tastes and incomes of its customers.
It is a price maker which can set the price to its maximum
advantages.
4. REDUCTION IN RIVALS:
Price discrimination can be used by a document firm to weaken
actual or potential rivals.
Price discrimination also might because as a predatory pricing tactic –
i.e., setting prices below cost to certain customers in order to harm
competition at the supplier’s level and thereby increase a firm’s
market power.
II) PRODUCT LINE PRICING:
This processes is suitable for the companies which produce multiple
products of same family. Different products belonging to same product

UNIT-4: MARKET STRUCTURE AND PRICING BALAJI INST OF IT& MANAGEMENT STRATEGIES Page 28
family which complement each other are grouped together and prices
in a group.
This pricing strategies aim to maximized the sale of different product
by creating more complimentary rather than competitive products.
TYPES OF PRODUCT LINE PRICING
The types of product line pricing are as follows,
1. PRICE BUNDLING:
This method of pricing is adopted to maintain a continuous sale of
product.
It is useful for perishable products or consumer facilities like hotel
rooms or seat in flight which have no substitutes.
FOR EXAMPLE, offering off season discounts to customers for hotel
rooms flight tickets or buffet lunch in hotels at reduced prices etc.
2. PREMIUM PRICING:
This type of pricing is adopted by companies which manufacture
different models of same products suiting to different strata of
society.
FOR EXAMPLE, a company is producing variety of television sets like
normal flat screen 3D effects with speakers giving theatre sound
effects and screen size 48’’ or 60.
3. IMAGE PRICING:
This type of pricing is applicable for similar products from different
companies or the same company.
FOR EXAMPLE, such pricing can be found in cosmetics clothes soaps
cars etc.
4. COMPLEMENTARY PRICING:
Complementary pricing is additional price to be paid by the
customers for taking possession or enjoying the product.
FOR EXAMPLE, purchases of flat or car is always accompanied by
registration charges for legally owning it or in hotels the customers
pays for sales tax and VAT in addition to original price of food.
5. CAPTIVE PRICING STRATEGY:
To captivate the customers and to promote is product the company
the company offers it as a compliment with its regular product.

UNIT-4: MARKET STRUCTURE AND PRICING BALAJI INST OF IT& MANAGEMENT STRATEGIES Page 29
FOR EXAMPLE, toothpaste tube with a brush or shaving get with a
twin blade.
6. TWO PART PRICING:
Many products carry two part pricing.
FOR EXAMPLE, multi story apartment flats have purchasing cost and
monthly subscription to society running it to pay for clean less, round
the clock power supply and security of the residents.
Iii) LOSS LEADER PRICING:
The meaning appears form this title is that it is for incurring losses but
in fact it is for increasing profits.
In fact the loss leader traps the customers due to its low price who buy
some other products of the company.
In companies of this pricing policy sometimes the company makes it
mandatory for the customers to purchase certain items along with the
popularized products.
FOR EXAMPLE, companies like Gillette essentially give their razor units
away for free knowing that customers have to buy their replacement
blades which are where the company makes its profit.
According to HAYNES AND HENRY a loss leader is an item which
producers a less than customary contribution or a negative
contribution to overhead but which is expected to create profits on
increased future sales or sales of other items.
CHARACTERISTICS OF LOSS LEADER
BOB R. HOLDREN has given certain characteristics for the loss leader as given
below,
1. The buyers must have knowledge of price of similar products at others
places.
2. It should encourage the customers to make a bulk purchases to get the
benefits of profit due to low price.
3. Demand of the product should not fluctuate.
4. The price reduction should be able to make the public conscious.
iv)PRESTIGE PRICING:
The prestige pricing realizes the psychology of the customer who needs
to posses sometimes very exclusive. Customer feels pride of owning a product
which is rare.

UNIT-4: MARKET STRUCTURE AND PRICING BALAJI INST OF IT& MANAGEMENT STRATEGIES Page 30
FOR EXAMPLE, flats constructed in a city at a location where only elite of the
town reside. It is having terrace garden with fountains and separate lift
attached to it along with private car parking. Certainly such products are meant
for persons who are above the class and ready to pay any amount for it as
prestige. The demand curve for prestige pricing is indicted in figure 4.22
Figure: prestige pricing
v) VALUE – BASED PRICING:
This is a pricing which is done after consideration of the benefit the
product or service will provide to the customer and its utility for them.
The product designed marketed and priced by the marketer for
acceptance of customers is against the norms of this pricing.
FOR EXAMPLE, fashion industry is an example of a sector where value
based pricing is common. This same principle can apply to other markets
where the idea of the consumer’s outward image may be affected by
possessing the item in question.
Following four situations in cost value price are described below
1. VALUE > PRICE > COSTS: in this situation the company is able to recover
the costs but fail to recover the value which results in loss in due course.
2. PRICE > VALUE > COSTS: In this case the value and costs are recovered.
This situation will make the customers to find other similar product
which leads to decline in sale and lowering the share value of the
company.
3. PRICE > COSTS > VALUE: this is till grimmer situation for the customers.
It appears that company is not much worried for customers. This makes
the customers more negative for the product.
4. PRICE = VALUE > costs: this situation can be termed as the optimum
situation where custome4r feels comfortable which will ensure

UNIT-4: MARKET STRUCTURE AND PRICING BALAJI INST OF IT& MANAGEMENT STRATEGIES Page 31
continuous sale and profit to the company. After examination of above
four situations it may be noted that in all cases the price is always more
that the costs and this ensures a margin of profit. However situation four
is suitable for sustained profits and therefore most suitable.
vi) PEAK LOAD PRICING
The companies mark the timings seasons or places which suit the
customers the most and then accordingly design the price in order to
gain maximum profit from their product or facilities.
FOR EXAMPLE, maximum people would like to use telephones or
airlines before noon to utilize the information or reach the destination
comfortably to attend meeting so this become the peak period and
company takes advantage to charge at higher rates for the facilities to
accommodate who need it the most and able to pay for it.
The peak load pricing can be fruitfully applied if,
1. The installed capacity of service to be used for peak period as well as
non peak periods.
2. It is not possible to store and use to at appropriate time but it is to be
used at specified time.
3. The demands vary with time.
vii)AFFORDABILITY BASED PRICING
This is applicable for essential commodities which are needed by al
section of society and prices are set in such a way that all sections of
society are able to consume it to the required extent.
This makes the price independent of production costs. Government
public distribution system is also used for the distribution of various
goods.
FOR EXAMPLE, the government controls it by way of providing subsidy
like in case of cooking gas.
viii)MARKET AND DEMAND BASED PRICING
It is a practical way of pricing the product.
Before finalizing the price an analysis is made on demand of the product
and purchase capacity of customers.
If the analysis is results justify the price only then they will go for it.

UNIT-4: MARKET STRUCTURE AND PRICING BALAJI INST OF IT& MANAGEMENT STRATEGIES Page 32
Price demand relationship is based on the parameters in different
markets.
ix)CYCLE PRICING
The cycle pricing is related to periodic rise and fall of economic activities
in the country.
The study of past certain years reveals that there is a cycle variation of
economic activities. This has got following four phases as indicated in
figure 4.23.
1. Trough
2. Expansion
3. Boom and
4. Recession
8) PRICING STRATEGIES
A single price is not usually set by the companies but price structure
reflecting several variables.
When an appropriate pricing method is selected then the desired price
for the particular product or service is adopted by following pricing
strategies or techniques that are price adaptive.
Pricing strategies
Product life cycle pricing price discounts and
allowances
Geographic pricing strategy promotional pricing
Product mix pricing price leadership
I) PRODUCT LIFE CYCLE PRICING
According to PHILIP KOTLER the product life-cycle is an attempt
to recognize distinct stage in the sales history of the product.
STAGES OF PRODUCT LIFE CYCLE
The depiction of most of the product life cycle curves is bell shaped. This curve
is typically divided into four stages.
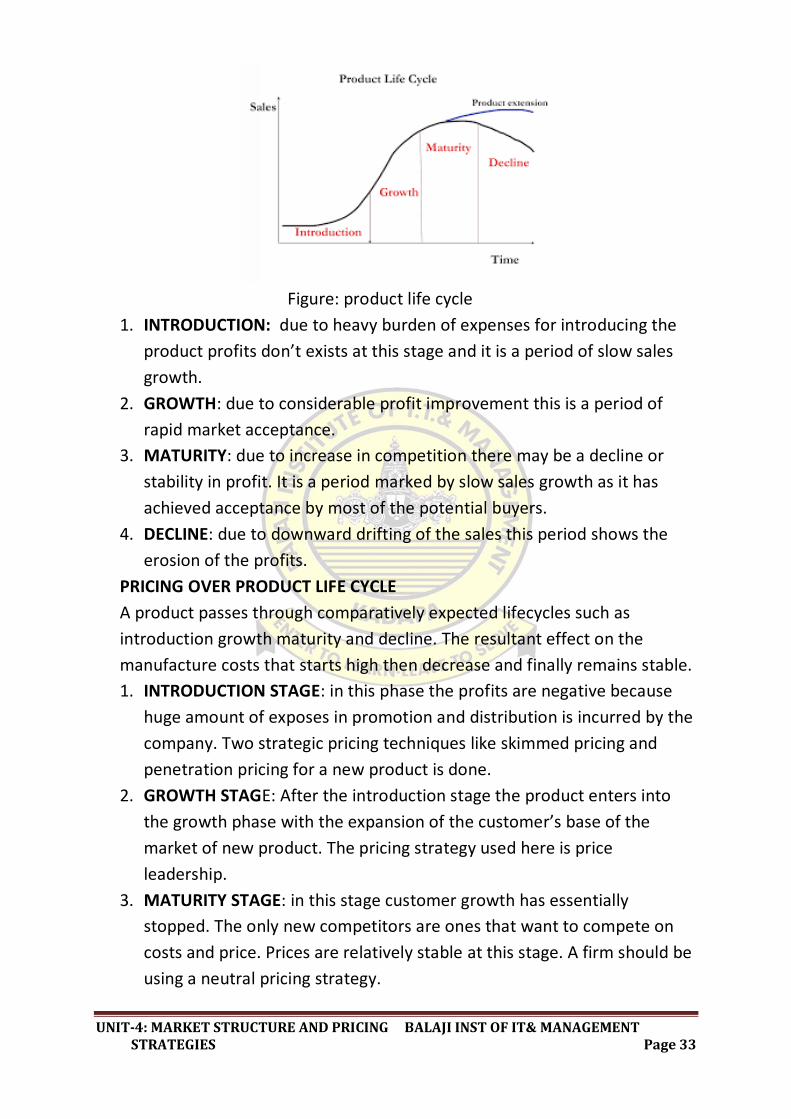
UNIT-4: MARKET STRUCTURE AND PRICING BALAJI INST OF IT& MANAGEMENT STRATEGIES Page 33
Figure: product life cycle
1. INTRODUCTION: due to heavy burden of expenses for introducing the
product profits don’t exists at this stage and it is a period of slow sales
growth.
2. GROWTH: due to considerable profit improvement this is a period of
rapid market acceptance.
3. MATURITY: due to increase in competition there may be a decline or
stability in profit. It is a period marked by slow sales growth as it has
achieved acceptance by most of the potential buyers.
4. DECLINE: due to downward drifting of the sales this period shows the
erosion of the profits.
PRICING OVER PRODUCT LIFE CYCLE
A product passes through comparatively expected lifecycles such as
introduction growth maturity and decline. The resultant effect on the
manufacture costs that starts high then decrease and finally remains stable.
1. INTRODUCTION STAGE: in this phase the profits are negative because
huge amount of exposes in promotion and distribution is incurred by the
company. Two strategic pricing techniques like skimmed pricing and
penetration pricing for a new product is done.
2. GROWTH STAGE: After the introduction stage the product enters into
the growth phase with the expansion of the customer’s base of the
market of new product. The pricing strategy used here is price
leadership.
3. MATURITY STAGE: in this stage customer growth has essentially
stopped. The only new competitors are ones that want to compete on
costs and price. Prices are relatively stable at this stage. A firm should be
using a neutral pricing strategy.

UNIT-4: MARKET STRUCTURE AND PRICING BALAJI INST OF IT& MANAGEMENT STRATEGIES Page 34
4. DECLINE STAGE: the last and the concluding stage are very crucial for
the marketers as they have to determine the elimination of the product
or to reposition it again for the extension of its product line. Here the
product line pricing strategy is applicable.
9: SKIMMING PRICING:
Utilizing the opportunities in the market for reaping the benefits of high
volume sales increases profits and low unit costs refers to skimming of
the prices.
This objective will be feasible in the market where there is a feeling in
the mind of the consumer that costly goods are of superior quality.
The following results are delivered by these pricing strategies in the
following situations.
1. When the target market associates quality of the product with its price
and high price is perceived to mean high quality of the product.
2. When the customer is aware and is willing to buy the product at a higher
price just to be an opinion leader.
3. When the product is perceived as enhancing the customers status in
society.
4. When the product represents significant technological breakthrough and
is perceived as a high technology product.
ADVANTAGES OF SKIMMING PRICING
Following are the advantages of skimming prices.
1. Demand with respect to price is more inelastic in the initial stages in
comparison to the condition when the price is grown fully. This is true
about the consumer goods.
2. The market can be broken into segments by launching a new product
with high price that differ in price elasticity of demand.
3. This policy appears to be safe as when unknown elasticity of demand is
being faced then the initial high price is depicted as rejection of the price
during the stage of exploration.
4. Many companies are not in a position to finance the product floatation
out of distant future revenue. High prices are a reasonable financing
technique for shouldering this burden in the light of many uncertainties
about the future.

UNIT-4: MARKET STRUCTURE AND PRICING BALAJI INST OF IT& MANAGEMENT STRATEGIES Page 35
DISADVANTAGES OF SKIMMING PRICING
Following are the disadvantages of skimming pricing
1. The strategy of skimming of the prices can be disastrous as due to the
presence of close competitors who can introduce similar products at
lower prices than the consumer will infer that the company is all the
time selling the products at higher price will force them to abandon the
company and its product.
2. Due to availability of strict legal and government regulations regarding
the rights of the consumers the price skimming option are not viable.
3. Due to the available history of the company of price skimming the
consumers will be reluctant to buy a new product rather they would
wait for some months to buy it at a lower price.
10. PENETRATION PRICING:
Low price of the product is being set by the entrepreneurship to enter
into the market in the initial stages with the objective of securing a large
market share.
Hence this objective of market penetration is to obtain maximum share
of the market by setting low prices deliberately.
The following conditions generalize and indicate the desirability of an
early low price policy.
1. A high price elasticity of demand in the short run i.e., a high degree of
responsiveness of sales to reductions in price.
2. Substantial savings in production costs as the result of greater volume
not a necessary condition however since elasticity of demand is high
enough pricing for market expansion may be profitable without realizing
production economies.
3. Product characteristics are such that it will not seem bizarre when it is
first fitted into the customer expenditure pattern.
4. A strong threat of potential competition.
A highly effective reason for penetration pricing is the threat of potential
competition. Most of the low pricing policies main objectives are to raise
entry barriers to prospective competitors in the exploring stages of
market development.

UNIT-4: MARKET STRUCTURE AND PRICING BALAJI INST OF IT& MANAGEMENT STRATEGIES Page 36
ADVANTAGES OF PENETRATION PRICING
1. It can result in fast diffusion and adoption. This can achieve high market
penetration rates quickly. This can take the competition by surprise not
giving them time to react.
2. It can create goodwill among the all important early adopter segment.
This can create valuable word of mouth publicity.
3. It creates cost control and cost reduction pressures from the start
leading to greater efficiency.
4. It discourages the entry of competitors. Low prices act as a barrier to
entry and
5. It can create high stock turnover.
DISADVANTAGES OF PENETRATION PRICING
1. The customer expects the prices to remain low for a long term. They are
not ready for the subsequent rise in the price and when it happens they
might switch to a competitor’s product. Thus subsequent price hike
leads to loss of market share gained.
2. It is believed that penetration pricing cannot create strong customer
relationship and only attracts customers on the lookout for a profitable
deal.
11. PRICING OF MULTIPLE PRODUCTS:
Most modern firms produce a variety of products rather than a single
product.
This requires that one expands our simple pricing rule and considers
demand and product interdependencies.
Normally in the case of a firm which is producing multiple commodities
the demands for its various products are separable but the costs is not
quite divisible product wise.
Thus while there are separate demand functions for all products of a
multiple product firms there is only one cost function for all products.
In the livestock industry meat and wool are produced together where
sheep are reared. Crude oil and natural gas may be found together in oil
exploration. In these joint products costs are also join. In most cases
joint products come in fixed proportions.

UNIT-4: MARKET STRUCTURE AND PRICING BALAJI INST OF IT& MANAGEMENT STRATEGIES Page 37
In joint products the profit maximizing prices will be given by the point
at which the combined marginal revenue of the products equals the
marginal’s costs as shown in figure 4.25.
Figure: pricing of joint products
The line CRM denotes the combined marginal revenue. It is obtained by
summing MR1 and MR2 vertically. The CMR equals MC at point E. A horizontal
line passing through point E determines the prices and quantities of the two
commodities. It is assumed that the demand functions of different
commodities are independent of one another. The profit maximizing prices are
OP1 and OP2 and the quantities are OQ1 and OQ2 of commodities 1 and 2
respectively. The prices in the case of more than two joint producers can also
be determined in the same manner.
Prepared By
V.SREERAM YASHASVEE L.L.B., M.B.A., (C.A)
ASSISTANT PROFESSOR
BALAJI INSTITUTE OF IT AND MANAGEMENT,KADAPA.

UNIT-5: INFLATION AND BUSINESS CYCLES BALAJI INST OF IT & MANAGEMENT Page 1
(17E00103) MANAGERIAL ECONOMICS Objective of this course is to understand the relevance of economics in business
management. This will enable the students to study functional areas of management such
as Marketing, Production and Costing from a broader perspective.
1. Introduction to Managerial Economics: Definition, Nature and Scope, Relationship
with other areas in Economics, Production Management, Marketing, Finance and
Personnel, Operations research - The role of managerial economist. Objectives of the
firm: Managerial theories of firm, Behavioural theories of firm, optimization
techniques, New management tools of optimization.
2. Theory of Demand: Demand Analysis – Law of Demand - Elasticity of demand, types
and significance of Elasticity of Demand. Demand estimation – Marketing research
approaches to demand estimation. Need for forecasting, forecasting techniques.
3. Production Analysis: Production function, Isoquants and Isocosts, Production
function with one/two variables, Cobb-Douglas Production Function, Returns to
Scale and Returns to Factors, Economies of scale- Cost concepts - cost-output
relationship in the short run and long run, Average cost curves - Break Even Analysis.
4. Market Structure and Pricing practices: Features and Types of different competitive
situations - Price-Output determination in Perfect competition, Monopoly,
Monopolistic competition and Oligopoly. Pricing philosophy – Pricing methods in
practice: Price discrimination, product line pricing. Pricing strategies: skimming
pricing, penetration pricing, Loss Leader pricing. Pricing of multiple products.
5. Inflation and Business Cycles:-Definition and meaning-characteristics of Inflation-
types of inflation - effects of inflation - Anti-Inflationary methods - Definition and
characteristics of business cycles-phases of business cycle - steps to avoid business
cycle
Textbooks:
Managerial Economics Analysis, Problems ,Cases ,Mehta,P.L., Sultan Chand &Sons.
Managerial Economics, Gupta, TMH
References
Managerial Economics, D.N.Dwivedi,Eighth Edition,Vikas Publications
Managerial Economics, Pearson Education, James L.Pappas and Engene
F.Brigham
Managerial Economics, Suma Damodaran, Oxford.
Macro Economics by MN Jhingan-Oxford
Managerial Economics- Dr.DM.Mithani-Himalaya Publishers
Managerial Economics-Dr.H.L Ahuja-S.Chand and Com pvt ltd, NewDelhi
Managerial Economics by Dominick Salvatore, Ravikesh Srivastava- Oxford
University press.
Managerial Economics by Hirschey- Cengage Learning

UNIT-5: INFLATION AND BUSINESS CYCLES BALAJI INST OF IT & MANAGEMENT Page 2
UNIT-5
INFLATION AND BUSINESS CYCLES
1. DEFINITION AND MEANING OF INFLATION
Inflation is normally associated with high prices which causes decline in
the purchasing power or value of money.
Inflation refers to the substantial and rapid increases in the general price
– level. Inflation is primarily a monetary phenomenon.
In the Keen sense true inflation begins when the elasticity of supply of
output in response to increase in money supply has fallen to zero or
when output is unresponsive to changes in money supply.
DEFINITION:
According to CROWTHER, inflation is a state in which the value of
money is falling i.e., prices are rising.
2. CHARACTERISTICS OF INFLATION:
Its various characteristics which are as follows,
1. PERSISTENT RISE IN PRICES:
The first characteristics of inflation are the persistent rise in prices.
This conclusion is based on observation of facts and it is by a large
correct.
Though there may be recovery of prices here and there due to
monetary and fiscal measures undertaken by the government it is an
agreed and fiscal measures undertaken by the government it is an
agreed fact that excessive raise in prices is the hallmark of inflation.
2. EXCESSIVE SUPPLY OF MONEY IN ECONOMY:
The second feature of inflation is an excessive supply of money in the
economy.
In times of war or sudden preparations for war the resources at the
disposal of the government may not be sufficient and the
government may adopt war time measures to augment the
resources to need the emergent situation.
3. VICIOUS CIRCLE OF INFLATIONARY SPIRAL
Characteristic of inflation is the vicious circle of inflationary spiral
created by the velocity of circulation of money. Inflation will feed on
itself to grow an inflationary spiral.

UNIT-5: INFLATION AND BUSINESS CYCLES BALAJI INST OF IT & MANAGEMENT Page 3
3. TYPES OF INFLATION
There are various types of inflation which can be categorized under
different heads as follows,
Types of inflation
According to rate of rice in price according to the factors
influences money supply
and demand for goods and
services
According to time according to coverage or
scope of point of view
According to govt. reaction according to Keynesian
view
1. ACCORDING TO RATE OF RISE IN PRICE
(i) CREEPING INFLATION:
When the rise in prices is very slow like that of a snail or creeper, it is
called creeping inflation.
In terms of speed a sustained rise in prices of annual increases of less
than 3 per cent per annum is characterized as creeping inflation.
Such an increase in prices is regarded safe, and essential for
economic growth.
(ii) WALKING INFLACTION:
When the rise in price becomes more pronounced as compared to a
creeping inflation there exists walking inflation in the economy.
Roughly when prices rise by more than ten percent and within a
range of 30% to 40% over a decade or 3 or 4% a year walking inflation
is the outcome.
(iii) RUNNING INFLATION:
When the movement of price accelerates rapidly running more than
100 per cent rise in prices over a decade.
Thus when prices rise by more than 10% a year running inflation
occurs.

UNIT-5: INFLATION AND BUSINESS CYCLES BALAJI INST OF IT & MANAGEMENT Page 4
(iv) GALLOPING INFLATION/HYPERINFLATION:
In case of hyperinflation prices rise every moment and there is no
limit to the height to which prices might rise therefore it is difficult to
measure its magnitude as prices rise by fits and starts.
If within a year the prices rise by 100 per cent, it is a case of
hyperinflation or galloping inflation.
2. ACCORDING TO THE FACTORS INFLUENCES MONEY SUPPLY AND
DEMAND FOR GOODS AND SERVICES
(i) EXCESSIVE MONEY SUPPLY INFLATION:
This is a classical type of inflation where there is an excess of money
supply in relation to the availability of real goods and services.
This type of inflation is usually conceived with reference to the
cyclical fluctuations In the economy and measures of monetary
controls to check inflationary or deflationary trends.
(ii) COST INFLATION:
When inflation emerges on account of a rise in factor cost it is called
cost inflation.
Due to a rising cost of living index workers demand higher wages and
higher wages in their turn increase the cost of production which a
producer generally meets by raising prices.
(iii) DEFICIT INFLATION:
When the government budgets contain heavy deficit financing
through creating new money the purchasing power in the community
increases and prices rises.
This may be referred to as deficit induced inflation.
3. ACCORDING TO TIME
(i) WAR-TIME INFLATION:
It is the outcome of certain exigencies of war on account of increased
government expenditure which is of unproductive nature.
UNIT-5: INFLATION AND BUSINESS CYCLES BALAJI INST OF IT & MANAGEMENT Page 5
By such public expenditure and government apportions a substantial
production of goods and services out of total availability for war
which causes a downward shift in the supply as a result an
inflationary gap may develop.
(ii) POST-WAR INFLATION:
It is a legacy of war. In the immediate post-war period it is usually
experienced.
This may happen when the disposable income of the community
increases when war-time taxation is withdrawn or public debt is
repaid in the post-war period.
(iii) PEACE-TIME INFLATION:
By this is meant the rise in prices during the normal period of peace.
Peace-time inflation is often a result of increased government
outlays on capital projects having a long gestation period so a gap
between money income and real wage goods develops.
4. ACCORDING TO COVERAGE OR SCOPE POINT OF VIEW
(i) COMPREHENSIVE INFLATION:
When prices of every commodity throughout the economy rise it is
called economy-wide or comprehensive inflation.
It is a normal inflationary phenomenon and refers to the rising prices
of the general price level.
(ii) SPORADIC INFLATION:
This is a kind of sectional inflation.
It consists of cases in which the averages of a group of prices rise
because of increases in individual prices due to abnormal shortage of
specific goods.
5. ACCORDING TO GOVERNMENT’S REACTION
Inflation is open or repressed according to government’s reaction to the
prevalence of inflationary forces in the economy.
(i) OPEN INFLATION:
When the government does not attempt to prevent price rise
inflation is said to be open.
Thus inflation is open when prices rise without any interruption of
government.
UNIT-5: INFLATION AND BUSINESS CYCLES BALAJI INST OF IT & MANAGEMENT Page 6
In open inflation free market mechanism is permitted to fulfill its
historic function of rationing the short supply of goods and distribute
them according to consumer‘s ability to pay.
(ii) REPRESED INFLATION:
When the government interrupts a price rise there is repressed or
suppressed inflation.
Thus suppressed inflation refers to those conditions in which price
increases are prevented at the present time through adoption of
certain measures like price controls and rationing by the
government.
6. ACCORDING TO KEYNESIAN VIEW:
Keynesian economic theory proposes that changes in money supply
do not directly affect prices and that visible inflation is the result of
pressures in the economy expressing themselves in prices. There are three
major types of inflation as part of what ROBERT J. GORDON calls the
triangle model.
(i) BUILT-IN INFLATION:
This is induced by adaptive expectations and is often linked to the
price-wage spiral.
It involves workers trying to keep their wages up with prices and
firms passing these higher labor costs on to their customers as higher
prices leading to a vicious circle.
(ii) PROFIT INFLATION:
This was originated by KEYNES in his book treatise on money.
According to KEYNES the price level of consumption goods is a
function of the investment exceeding savings.
It redistributes income in favor of profiteers and against the wagering
class.
(iii) SEMI-INFLATION:
It was originated by KEYNES.
According to KEYNES so long a s there are unemployed resources the
general price level will not rise as output increases.
This is known as semi inflation or bottleneck inflation because of the
bottleneck in supplies of some factors.
UNIT-5: INFLATION AND BUSINESS CYCLES BALAJI INST OF IT & MANAGEMENT Page 7
(iv) TRUE INFLATION ACCORDING TO KEYNES:
When the economy reaches the level of full employment any
increase in aggregate expenditure will raise the price level in the
same proportion.
This is because it is not possible to increase the supply of factors of
production and hence output after the level of full employment.
This is called as true inflation.
(v) MARK-UP INFLATION:
Is closely related to the price push problem.
Modern labor organizations possess substantial monopoly power.
They therefore set prices and wages on the basis of mark-up over
costs and relative incomes.
This sets-off an inflationary rise in prices. Similarly when strong trade
union is successful in raising the wages of workers this contributes to
inflation.
3.1. CAUSES OF INFLATION
The root cause of inflation is the imbalance between the total
demand and total supply of goods and services in the economy which causes
excessive demand. These are following causes of inflation.
1. INCREASE IN DEMAND FOR GOODS AND SERVICES: There are a number
of factors that cause increase in demand for goods and services in the
country. Some of the factors can be summed up as under.
(i) INCREASE IN PUBLIC EXPENDITURE:
An increase in public expenditure during the time of war or for
development planning causes increase in the demand for goods and
services in the economy and finally result in increase in prices of
goods and services causing inflation.

UNIT-5: INFLATION AND BUSINESS CYCLES BALAJI INST OF IT & MANAGEMENT Page 8
(ii) INCREASE IN PRIVATE EXPENDITURE:
An increase in private expenditure consumption expenditure as well
as investment expenditure is an important cause of the emergence of
excess demand in the economy.
When business conditions are good private entrepreneurs start
investing more and more funds in new business giving rise to increase
in the demand of the service of factor of production.
(iii) INCREASE IN EXPORTS:
An increase in the foreign demand for the country products reduces
the stock of commodities available for home consumption.
It is evident that women more and more of commodities are
exported to other countries less and less are available for domestic
consumption.
(iv) REDUCTION IN TAXATION:
Reduction in taxation is also an important cause of the emergence of
increase in demand. When government reduces tax it results to an
increase in purchasing power of the public and then it is in the potion
to demand more goods and services for private consumption and
results to an increase in prices causing inflation.
(v) REPAYMENT OF PAST INTERNAL DEBTS:
When the government repays it past debts to the public it results in
an increase of purchasing power of the public which is used by it for
buying more goods and services for consumption purposes.
This ultimately leads to an increase in demand in the economy and
cause inflation finally as with increases in demand the prices tend to
go up.
(vi) RAPID GROWTH OF POPULATION:
A rapid growth in population results in pushing up the level of
aggregate effective demand for goods and services in a country.
This acts as an inflationary force and tends to raise the prices to
higher levels.
UNIT-5: INFLATION AND BUSINESS CYCLES BALAJI INST OF IT & MANAGEMENT Page 9
2. DECREASE IN SUPPLY FOR GOODS AND SERVICES: the factors that result
in reduction in the supply of goods and services may be termed as
under.
(i) SHORTAGE OF SUPPLIES OF FACTORS OF PRODUCTION:
Occasionally the economy of a country faces or is met with shortage
of such factors as labo0r capital equipment raw material etc. this
results to an increase in prices and inflation as the demand is high
and supply is less.
(ii) HOARDING BY THE TRADERS:
At the time of shortages and rising prices there is a tendency on the
part of traders and merchants to hoard essential commodities for
profit purposes.
The stocks of essential goods often go underground during the
period of inflation and rising prices causing further scarcity of goods
in the market.
(iii) HOARDING BY CONSUMERS:
It is not only the traders and the merchants who resort to hoarding at
a time of inflation the individual consumer also holds essential
commodities to avoid payments of higher prices in future.
They also hoard essential commodities to ensure uninterrupted
availability for private consumption.
(iv) NATURAL CALAMITIES:
It also creates inflationary conditions by reducing the production in
the economy.
Floods and draughts adversely affect the supply of products and in
turn raise their prices.
(v) LAW OF DIMINISHING RETURNS:
The law of diminishing returns operates when production is
increased by employing more and more variable factors with fixed
factors and given technology.
As a result of this law the cost per unit of production increases thus
leading to a rise in the prices of production.
(vi) WAR:
During the war period economic resources are diverted to the
production of war materials.

UNIT-5: INFLATION AND BUSINESS CYCLES BALAJI INST OF IT & MANAGEMENT Page 10
This reduces the normal supply of goods and services for civilian
consumption and this leads to the rise in the price level.
(vii) INTERNAL CAUSES:
In modern times a major cause of inflationary rise in prices in most of
the countries is the international rise in the prices of basic materials
used in almost all the industrial materials.
Thus all the above factors cause inflation in the economy as when the
demand increases the prices also increase and so also when the
supply is less than the demand the prices are tend to go up causing
inflation.
4. EFFECTS OF INFLATION:
The effects of inflation are given below,
1. EFFECTS ON PRODUCTION
When prices start rising production is encouraged. Producers earn
windfall profits in the future.
They invest more in anticipation of higher profits in the future. This
tends to increase employment production and income.
But this is only possible up to the full employment level
(i) MISALLOCATION OF RESOURCES:
Inflation causes misallocation of resources when producers divert
resources from the production of essential to non-essential goods
from which they expect higher profits
(ii) CHANGES IN THE SYSTEM OF TRANSACTIONS:
Inflation leads to changes in transactions pattern of producers.
They hold smaller stock of real money holdings against unexpected
contingencies than before.
They devote more time and attention to converting money into
inventories or other financial or real assets.
(iii) REDUCTION IN PRODUCTION:
Inflation adversely affects the volume of production because the
expectations of rising prices along with rising costs of inputs bring
uncertainty.
This reduces production.

UNIT-5: INFLATION AND BUSINESS CYCLES BALAJI INST OF IT & MANAGEMENT Page 11
(iv) FALL IN QUALITY:
Continuous rise in prices creates a seller’s market.
In such a situation producers produce and sell sub-standing
commodities in order to earn higher profits.
They also indulge in adulteration of commodities.
(v) HOARDING AND BLACK-MARKETING:
To earn more profit from using prices producers hoard stocks of their
commodities.
Consequently an artificial scarcity of commodities is created in the
market.
Then the producers sell their products in the black market which can
increase inflationary pressures.
(vi) REDUCTION IN SAVING:
When prices rise rapidly the propensity to save declines because of
more money is needed to buy goods and services than before.
Reduced saving adversely affects investment and capital formation.
As a result production is hindered.
(vii) HINDERS FOREIGN CAPITAL:
Inflation hinders the inflow of foreign capital because the rising costs
of materials and other inputs make foreign investment less
profitable.
(viii) ENCOURAGES SPECULATION:
Rapidly rising prices create uncertainty among producers who indulge
in speculative activities in order to make quick profits.
Instead of engaging themselves in productive activities they
speculate in various types of raw materials required in production.
2. DISTRIBUTIONAL EFFECTS
Inflation redistributes income because prices of all factors do not rise
in the same proportion.
Since the effect of inflation on the incomes of different cases of
earners varies there are serious social consequences.
During inflation the distributive share accruing to the profiteers
increases more than that of wage earners or fixed income earner.
(i) Debtors and creditors
(ii) Business community
(iii) Fixed income groups

UNIT-5: INFLATION AND BUSINESS CYCLES BALAJI INST OF IT & MANAGEMENT Page 12
(iv) Investors
(v) Farmers
3. OTHER EFFECTS: Inflation leads to a number of other effects which are
discussed as under,
(i) Government
(ii) Balance of payments
(iii) Exchange rate
(iv) Collapse of the monetary system
(v) Social
(vi) Political
5. ANTI-INFLATIONARY METHODS:
Since inflation is a phenomenon where money income or purchasing
power is rising faster than the real goods and services the measures to
check inflation should either be of a check on the increase in money
incomes or making available more of real goods and services.
The various anti-inflationary methods which can be taken to establish a
better balance between aggregate supply and demand for money can be
studied under the following three main heads.
1. MONETARY MEASURES: monetary measures aim at reducing money
incomes. It includes,
(i) CREDIT CONTROL:
One of the important monetary measures is monetary policy.
The central bank of the country adopts a number of methods to
control the quantity and quality of credit.
Monetary policy may not be effective in controlling inflation, if
inflation is duet o cost-push factors.
Monetary policy can only be helpful in controlling inflation created
due to demand pull factors.
(ii) DEMONETISATION OF CURRRENCY:
However one of the monetary measures is to demonetize currency of
higher denominations.
Such a measure is usually adopted when there is abundance of black
money in the country.

UNIT-5: INFLATION AND BUSINESS CYCLES BALAJI INST OF IT & MANAGEMENT Page 13
(iii) ISSUE OF NEW CURRENCY:
The most extreme monetary measure is the issue of new currency in
place of the old currency in place of the old currency.
Under this system one new note is exchanged for a number of notes
of the old currency.
It is a very effective measure. But is inequitable for it hurts the small
depositors the most.
2. FISCAL MEASURES: Monetary policy alone is incapable of controlling
inflation. It should therefore be supplemented by fiscal measures. The
principal fiscal measures are the following,
(i) REDUCTION IN UNNECESSARY EXPENDITURE:
The government should reduce unnecessary expenditure on non-
development activates in order to curb inflation.
This well also put a check on private expenditure which is dependent
upon government demand for goods and services.
(ii) INCREASE IN TAXATION:
To cut personal consumption expenditure the rates of personal
corporate and commodity taxes should be raised and even new taxes
should be levied but the rates of taxes should not be as high as to
discourage saving investment and production.
(iii) INCREASE IN SAVINGS:
Another measure is to increase savings on the part of the people.
This will tend to reduce disposable income with the people and
hence personal consumption expenditure.
(iv) SURPLUS BUDGETS:
An important measure is to adopt anti-inflationary budgetary policy.
For this purpose the government should give up deficit financing and
instead have surplus budgets.
It means collecting more in revenue and spending less.
(v) PUBLIC DEBT:
At the same time it should repayment of public debt and postpone it
to some future date till inflationary pressures are controlled within
the economy.

UNIT-5: INFLATION AND BUSINESS CYCLES BALAJI INST OF IT & MANAGEMENT Page 14
Instead the government should borrow more to reduce money
supply with the public.
(vi) CONTROL OVER INVESTMENT:
Controlling investments is also considered necessary because due to
the multiplier effect the initial investment leads to large increase in
income and expenditure and the demand for both the consumer and
capital goods goes up speedily.
a. The projects selected should be such as result in utilization of ideal
capacity or in making provision for procurement of scarce raw
materials spares etc.
b. These should have a short gestation period so that production of
goods and services starts within the shortest possible time of
those being undertaken.
c. Speculation in goods should be restrained as it aggravates the
inflationary tendencies.
3. OTHER MEASURES: The other types of measures are those which aim at
increasing aggregate supply and reducing aggregate demand directly.
(i) INCREASING PRODUCTION: The following measures should be
adopted to increase production.
a. One of the foremost measures to control inflation is to increase
the production of essential consumer goods like food clothing
kerosene oil, sugar vegetable oils etc.
b. If there is need raw materials for such products may be imported
on preferential basis to increases the production of essential
commodities.
c. All possible help in the form of latest technology raw materials
financial help subsidies etc. should be provided to different
consumer good sectors to increase production.
(ii) RATIONAL WAGE POLICY:
Another important measure is to adopt a rational wage and income
policy.
Under hyper-inflation there is a wage price spiral.
Therefore the best course is to link increase in wages to increase in
productivity.

UNIT-5: INFLATION AND BUSINESS CYCLES BALAJI INST OF IT & MANAGEMENT Page 15
(iii) PRICE CONTROL:
Price control and rational is another measure of direct control to
check inflation.
Price control means fixing an upper limit for the prices of essential
consumer goods.
(iv) RATIONING:
Rationing aims at distributing consumption of scarce goods so as to
make them available to a large number of consumers.
It is applied to essential consumer goods such as wheat rice sugar
kerosene oil etc.
6. DEFINITION AND CHARACTERISTICS OF BUSINESS CYCLE:
6.1. MEANING AND DEFINITION OF BUSINESS CYCLE:
Business cycle or trade cycle is a term that describes economic activity
variations occurring in an almost regular time series in all the capitalist
societies.
The graph portrays like a wave when these indicators are plotted on it.
Thus it is a regular phenomenon of rising and falling of the economic
activity where each and every movement of rise and fall taken
collectivity describes a trade cycle or a business cycle.
DEFINITION:
According to KEYNES,” a trade cycle is composed of periods of good
trade characterize by rising prices and low unemployment percentages altering
with periods of bad trait characterized by falling prices and high
unemployment percentages”.
6.2. CHARACTERISTICS OF BUSINESS CYCLE:
The essence and characteristics of business cycle is as follow,
(i) RECURRING FLUCTUATION:
Business cycles are represented by variations which occur regularly
in an unhindered pattern.
This states that the repetition of expansion and contraction does not
have a uniform or regular period.
UNIT-5: INFLATION AND BUSINESS CYCLES BALAJI INST OF IT & MANAGEMENT Page 16
(ii) PERIOD OF BUSINESS CYCLE IS NO LONGER A YEAR:
The period of completion of a particular business cycle is around 3 to
4 days.
But in the some cases the duration of the business cycle is either
shorter or longer than that of the duration of a normal business cycle.
Usually the period of business cycle is not less than one year.
(iii) PRESENCE OF THE ALTERING FORCES OF EXPLATION AND
CONTRACTION:
The interchangeable force of prosperity and depression in an
economy that are in built in the system represent a business cycle.
Initially the force is of low intensity but finally regained by a counter
force which results in contraction ending up the process with
depression.
(iv) PHENOMENON OF THE CRISIS:
According to KEYNES business cycle is characterized by the event of
crisis.
It means that the peak and though are uneven as the expansion
phase of the business cycle ends up suddenly and depression slows
down gradually.
(v) SYNCHONYM:
Existing of business cycle is contemporary.
They have an enfolding attribute of causing any changes in an
individual industry or sector.
For example there is a parallel occurrence of depression or
contraction in all the industries or sectors of the economy.
(vi) CONSUMPTION OF NON-DURABLE GOODS AND SERVICES:
A significant feature of business cycle is the consumption of non
durable goods and services which are least affected by alternate
phase of business cycle.
Past data of business cycle clearly states that there is a great balance
in the consumption of non durable goods.

UNIT-5: INFLATION AND BUSINESS CYCLES BALAJI INST OF IT & MANAGEMENT Page 17
(vii) INVESTORIES OF GOODS:
Inventories of goods and services are largely affected by successive
expansion and contraction.
As depression sets in inventories boom ahead the required level
resulting in the decrease of production of goods.
(viii) PROFIT FLUCTUATES MORE THAN ANY OTHER TYPE OF INCOME:
Income from profit varies more in terms of income accruing from
other sources.
Uncertain situation that prevail during the occurrence of business
cycle making it difficult for businessmen to predict the future
economic conditions.
(ix) INTERNATIONAL IN CHARACTER:
The important aspect of business cycle is that they are international
in nature. As one country experiences the onset of business cycle it
extends to other counties too due to business relations between
them.
USA being the large importer of goods from other countries if
undergoes recession resulting into the decrees in the demand for
imports from other countries negatively affecting the exports of
other countries altogether.
The recession of 1930’s in USA and Great Britain has absorbed the
entire capitalistic economics of the world.
7. PHASES OF BUSINESS CYCLE:
The distinct and closely related phases of business cycle are follows,
(i) PROSPERITY OR EXPANSION:
In this phase there exist an optimistic feeling between businessman
and industrialists that is represented by enhanced production high
capital investment in fundamental industries.
The level of economic activity rises which is not being the nature of X
increased at cost of Y the whole system escalates.
The whole process being initiated by these stimulants is named as
starters or originating forces.

UNIT-5: INFLATION AND BUSINESS CYCLES BALAJI INST OF IT & MANAGEMENT Page 18
Figure: phases of business cycle.
(ii) BOOM OR PEAK:
Prosperity attains the highest level and then the recession of the
economic activity from the peak phase that is generally represented
by retardation in the rate of expansion resulting in slowing of the
growth and then reaching the peak.
(iii) RECESSION:
The beginning of recession means that boom is over signifying
liquidation in stock markets burden in the banking system clearance
of some bank loans fall in prices acute decline in the demand for
capital equipment and abandonment of new projects by the norms
characterized by recession.
The after effects of this phase are the prevalence of negative
sentiments reduction in fresh investments debt recovery by banks,
stocks liquidation and fall in prices.
8. STEPS TO AVOID BUSINESS CYCLES:
Economic development of an economic is negatively affected by
periodic fluctuation in business and economic activities.
Therefore the government should take protective and corrective
measures to maintain balance in economic system.
Following are the steps/measures to avoid/control business cycle.
1. PREVENTIVE MEASURES:
The aim of preventive measures is to avoid the happening of
business cycles which include all measures that are chosen during
the period of expansion to regulate purchases protection of assets
and avoiding irresponsible credit expansion.

UNIT-5: INFLATION AND BUSINESS CYCLES BALAJI INST OF IT & MANAGEMENT Page 19
(i) The existence of accurate connection between cyclical
changes in common business activity and changes in the
business of the given firm.
(ii) The quality of the cyclical price movements during the
purchases and sales of the distinct business in respect to the
general business cycle which has been secured by a business
manager who has initiated the foremost crucial step in
chalking out creative programs that is adaptable to the
business cycle.
The various protective measures against the effects of business
cycles are as follow,
(i) Preservation of assets and avoidance of unnecessary increase
in plant and equipment and in dividends during the expansion
phase.
(ii) Curtailing the dependence of agricultural on nature
(iii) Equilibrium between demand and supply
(iv) Control on experimental activities and
(v) Nationalization of basic industries.
2. CORRECTIVE MEASURES: The main corrective measures are,
(i) MONETARY POLICY:
The control over the supply of money and the cost of credit in the
economy refers to monetary policy.
Monetary policy is the utilization of various method of credit in the
economy and various method of credit control by the central bank.
The main method of quantitative measures is bank rate, open
market operations changes in cash reserve ratio (CRR) and statutory
liquidity ratio (SLR).
The main measures of selective credit control are rationing direct
action and normal persuasion.
(ii) FISCAL POLICY:
Fiscal policy caters to the achievement of certain objectives by
managing public revenue expenditure and public debt.

UNIT-5: INFLATION AND BUSINESS CYCLES BALAJI INST OF IT & MANAGEMENT Page 20
Therefore fiscal policy of the government is cable to control cyclical
fluctuations by inducing suitable changes in taxation public
expenditure and public debt policies.
(iii) DIRECT CONTROLS:
For fast and effective control of business cycle government applies
direct physical controls that includes licensing, rationing of scarce
and essential commodities control of prices and wages export
import control over exchange hoardings and black marketing and
control of monopolistic and restrictive trade practices (MRTP) etc.
(iv) AUTOMATIC STABILISERS:
To deal with the business cycles economists have suggested
introducing several automatic stabilizers or build in stabilizer.
These are the economic shock absorbers which facilitates in the
smooth flow of the mutual cyclical business fluctuations.
The application of this tax on the people in higher income group is
comparatively higher than those who are in the lower income
group.
(v) FIXED INVESTMENTS POLICY:
To control the cyclical movement of business is the other aspect of
the fixed investment policy.
It helps in planning a building programme.
On the basis of these past records it empowers the normal growth
rate to be determined accurately to plan in advance for future
development.
(vi) AD SPEND POLICY:
Deceleration in economy slows down the firms curtailing their
advertisement budgets to augment their own profitability.
Some major business corporate and FMCG companies do believe but
strive to enhance their advertisement budgets considerably.
Other companies like Coca-Cola, Pepsi, Godrej soaps, Dabur India,
Pharma Major, Smith line Beecham are the examples of raising
their ad spend in 2001 in comparison to 2000.
Prepared By
V.SREERAM YASHASVEE L.L.B., M.B.A., (C.A)
ASSISTANT PROFESSOR
BALAJI INSTITUTE OF IT AND MANAGEMENT,KADAPA